MBF1223 Financial Management. Lecture 8: Financial Ratios and Firm Performance
|
|
|
- Mae James
- 6 years ago
- Views:
Transcription
1 MBF1223 Financial Management Lecture 8: Financial Ratios and Firm Performance
2 Learning Objectives 1. Create, understand, and interpret common-size financial statements. 2. Calculate and interpret financial ratios. 3. Compare different company performances using financial ratios, historical financial ratio trends, and industry ratios. 2
3 1. Financial Statements Just like a doctor takes a look at a patient s x-rays or cat-scan when diagnosing health problems, a manager or analyst can take a look at a firm s primary financial statements i. e. the income statement and the balance sheet, when trying to gauge the status or performance of a firm. Income statement: periodic recording of the sources of revenue and expenses of a firm, Balance sheet: provides a point in time snap shot of the firm s assets, liabilities and owner s equity. 3
4 2. Benchmarking The financial statements constitute fairly complex documents involving a whole bunch of numbers. Absolute values tell us something about the amount of assets, liabilities, equity, revenues, expenses, and taxes of a firm, difficult to really gauge what s going on, primarily because of size and maturity differences among firms. requires benchmarking against some standard. One common method of benchmarking a is to compare a firm s current performance against that of its own performance over a 3-5 year period (trend analysis), by looking at the growth rate in various key items such as sales, costs, and profits. 4

5 2. Benchmarking Table: Cogswell Cola s Abbreviated Income Statements ($ in thousands) 5
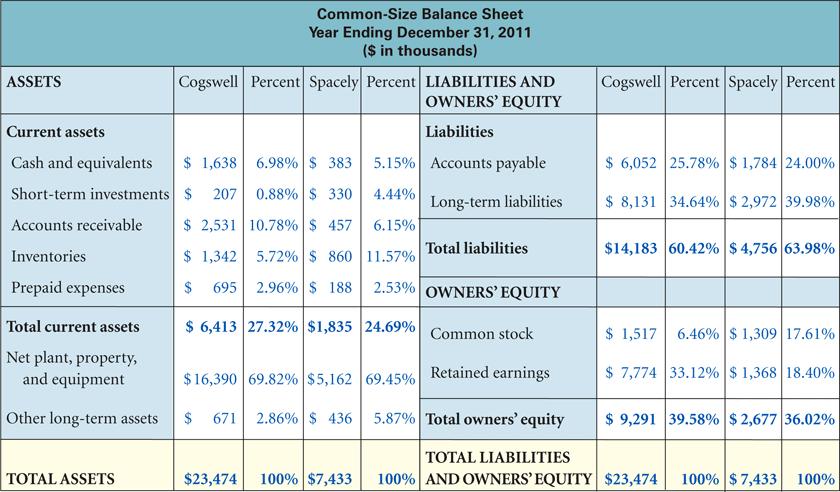
6 2. Benchmarking Another useful way to make some sense out of this mess of numbers, is to re-cast the income statement and the balance sheet into common size statements, by expressing each income statement item as a percent of sales and each balance sheet item as a percent of total assets. 6

7 2. Benchmarking Figure 2 7
8 2. Benchmarking Figure 8
9 2. Benchmarking Benchmarking is a good starting point to detect trends (if any) in a firm s performance and to make quick comparisons of key financial statement values with competitors on a relative basis. More in-depth diagnosis requires individual item analyses and comparisons which are best done by conducting ratio analysis. 9
10 3. Financial Ratios Financial ratios are relationships between different accounts from financial statements usually the income statement and the balance sheet that serve as performance indicators Being relative values, financial ratios allow for meaningful comparisons across time, between competitors, and with industry averages. 10
11 3. Financial Ratios 5 key areas of a firm s performance can be analyzed using financial ratios: 1. Liquidity ratios: Can the company meet its obligations over the short term? 2. Solvency ratios: (also known as financial leverage ratios): Can the company meet its obligations over the long term? 3. Asset management ratios: How efficiently is the company managing its assets to generate sales? 4. Profitability ratios: How well has the company performed overall? 5. Market value ratios: How does the market (investors) view the company s financial prospects? Can also conduct a Du Pont analysis which involves a breakdown of the return on equity into its three components, i.e. profit margin, turnover, and leverage. 11
12 4. Short-Term Solvency: Liquidity Ratios Measure a company s ability to cover its short-term debt obligations in a timely manner: 3 key liquidity ratios include: The current ratio, quick ratio, and cash ratio. 12

13 4. Short-Term Solvency: Liquidity Ratios Table: Liquidity Ratios 2011 for Cogswell Cola and Spacely Spritzers Cogswell has better liquidity and short-term solvency than Spacely, but, higher investment in current assets also means that lower yields are being realized since current assets are typically low yielding. So, we need to look at the other areas and inter-related effects of the firm s various accounting items. 13
14 5. Long-Term Solvency: Solvency or Financial Leverage Ratios Measure a company s ability to meet its long-term debt obligations based on its overall debt level and earnings capacity. Failure to meet its interest obligation could put a firm into bankruptcy. Equations 14.4, 14.5, and 14.6 can be used to calculate 3 key financial leverage ratios: the debt ratio, times interest earned ratio, and cash coverage ratio. 14
15 5. Long-Term Solvency: Long-Term Solvency: Solvency or Financial Leverage Ratios 15
 or its net cash flow (cash coverage ratio) than Spacely Spritzers.")
16 5. Long-Term Solvency: Long-Term Solvency: Solvency or Financial Leverage Ratios Table: Financial Leverage Ratios 2011 for Cogswell Cola and Spacely Spritzers Cogswell Cola has relatively less debt and a significantly greater ability to cover its interest obligations by using either its EBIT (times interest earned ratio) or its net cash flow (cash coverage ratio) than Spacely Spritzers. Leverage must be analyzed as a combination of debt level and coverage. If a firm is heavily leveraged but has good interest coverage, it is using the interest deductibility feature of taxes to its benefit. Having a high leverage with low coverage could put the firm into a risk of bankruptcy. 16
17 6. Asset Management Ratios Measure how efficiently a firm is using its assets to generate revenues or how much cash is being tied up in other assets such as receivables and inventory. Equations can be used to calculate 5 key asset management ratios. 17

18 6. Asset Management Ratios Table: Asset Management Ratios 2011 for Cogswell Cola and Spacely Spritzers While Cogswell is more efficient at managing its inventory, Spacely seems to be doing a better job of collecting its receivables and utilizing its total assets in generating revenues 18
19 7. Profitability Ratios Profitability ratios such as net profit margin, returns on assets, and return on equity, measure a firm s effectiveness in turning sales or assets into profits. 19

20 7. Profitability Ratios Table: Profitability Ratios 2011 for Cogswell Cola and Spacely Spritzers As far as profitability is concerned, Cogswell is outperforming Spacely by about 3%. 20
21 8. Market Value Ratios Used to gauge how attractive or reasonable a firm s current price is relative to its earnings, growth rate, and book value. 21
22 8. Market Value Ratios Potential investors and analysts often use these ratios as part of their valuation analysis. Typically, if a firm has a high price to earnings and a high market to book value ratio, it is an indication that investors have a good perception about the firm s performance. However, if these ratios are very high it could also mean that a firm is over-valued. With the price/earnings to growth ratio (PEG ratio), the lower it is, the more of a bargain it seems to be trading at, vis-à-vis its growth expectation. 22
23 8. Market Value Ratios Ratio Cogswell Cola Spacely Spritzers P/E PEG P/B The ratios seem to indicate that investors in both firms seem to have good expectations about their performance and are therefore paying fairly high prices relative to their earnings book values. 23
24 9. DuPont analysis Involves breaking down ROE into three components of the firm: 1) operating efficiency, as measured by the profit margin (net income/sales); 2) asset management efficiency, as measured by asset turnover (sales/total assets); and 3) financial leverage, as measured by the equity multiplier (total assets/total equity). Equation below shows that if we multiply a firm s net profit margin by its total asset turnover ratio and its equity multiplier, we will get its return on equity. 24
25 10. DuPont analysis Cogswell has better operational efficiency, i.e. it is better able to move sales dollars into income, but Spritzer is more efficient at utilizing its assets, and since it uses more debt, it is able to get more of its earnings to its shareholders. Although these 14 ratios are not the only ones that can be used to assess a firm s performance, they are the most popular ones. It is important to look at the overall picture of the firm in all 5 areas and accordingly reach conclusions or make recommendations for changes. 25
26 10. External Uses of Financial Statements and Industry Averages Financial statements of publicly traded companies and industry averages of key items provide the raw material for analysts and investors to make investment recommendations and decisions 26
 27")
27 11. Cola Wars Table: Key Financial Ratios and Accounts for PepsiCo and Coca-Cola (as of December 31, 2010) 27
")
28 11. Cola Wars Table: Some Key Ratios for PepsiCo and Coca-Cola (Five-Year Period) 28
29 11. Cola Wars One of the first things we notice in looking over the five years of data is how similar many of the ratios are from year to year, showing remarkable consistency for these two companies. We also can see that the gross margin of Coca-Cola is consistently higher than that of PepsiCo. The debt to equity ratio of both firms is mostly falling over the five-year period. We also can see that ROE has been very good for both companies, although slightly better for PepsiCo. Finally, PepsiCo has very strong and growing earnings per share over this period, outperforming Coca-Cola s EPS, but PepsiCo is also more expensive (higher current price per share). 29

30 12. Industry ratios: Table: Financial Ratios: Industry Averages Industry ratios are often used as benchmarks for financial ratio analysis of individual firms. There can be significant differences in various key areas across industries, which is why comparing company ratios with industry averages can be very useful and more informative. 30
31 Additional Problems with Answers Problem 1 Constructing an Income Statement. Using the income and expense account information for Tri-Mark Products Inc. listed below, construct an income statement for the year ended 31st December, Shares outstanding: 1,575,000 Tax rate: 35% Interest expense: $3,540,000 Revenue: $950,500,000 Depreciation: $50,000,000 Selling, general, and administrative expense: $85,000,000 Other income: $1,350,000 Research and development: $5,200,000 Cost of goods sold: $730,000,000 31
32 Additional Problems with Answers Problem 1 (Answer) Tri-mark Products Incorporated Income Statement for the year ended 31st Dec ('000s) Revenue $ 950,500 Cost of goods sold $ 730,000 Gross Profit $ 220,500 Operating expenses Selling, general and administrative expenses $ 85,000 R&D $ 5,200 Depreciation $ 50,000 Operating Income $ 80,300 Other Income $ 1,350 EBIT $ 81,650 Interest Expense $ 3,540 Taxable Income $ 78,110 Taxes $ 27,339 Net Income $ 50,772 Shares Outstanding $ 16,740 EPS $
33 Additional Problems with Answers Problem 2 Constructing a Balance Sheet. Construct Tri-Mark Incorporated s 2009 year-end Balance Sheet using the asset, liability, and equity accounts listed below: Retained Earnings $60,500,000 Accounts Payable $57,000,000 Accounts Receivable $43,000,000 Common Stock $89,676,000 Cash $6,336,000 Short Term Debt $1,500,000 Inventory $42,000,000 Goodwill $30,000,000 Long Term Debt $74,000,000 Other Non-Current Liabilities $15,000,000 PP&E $225,000,000 Other Non-Current Assets $14,000,000 Long-Term Investments $25,340,000 Other Current Assets $12,000,000 33
34 Additional Problems with Answers Problem 2 (Answer) Tri-mark Products Inc. Balance Sheet as at year ended 31st December 2009 ( 000s) Liabilities: Current Assets Current Liabilities Cash $6,336 Accounts Payable $57,000 Accts. Rec. $43,000 Short Term Debt $1,500 TOTAL Current Liabilities. $58,500 Inventory $42,000 Other Current $12,000 Long Term Debt $74,000 Total Current $103,336 Other Liabilities $15,000 L- T Inv. $25,340 Total Liabilities $147,500 PP&E $225,000 Owner s Equity Goodwill $30,000 Common Stock $189,676 Other Assets $14,000 Total Assets $397,676 Retained Earnings $60,500 Total OE $250,176 Total Liab. And OE $397,676 34
35 Additional Problems with Answers Problem 3 Common size statements: Re-state Tri-Mark Incorporated s 2009 financial statements as common-size statements and comment on them 35
36 Assets: Current Assets Additional Problems with Answers Problem 3 (Answer) Cash $6, Accts. Rec. $43, Inventory $42, Other Current $12, Total Current $103, L- T Inv. $25, PP&E $225, % of Total Assets Liabilities: Current Liabilities % of Total Assets Accounts Payable $57, Short Term Debt $1, TOTAL Current Liab. $58, Long Term Debt $74, Other Liabilities $15, Total Liabilities $147, Owner s Equity Common Stock $189, Retained Earnings $60, Goodwill $30, Other Assets $14, Total Assets $397, Total OE $250, Total Liab. And OE $397,
37 Additional Problems with Answers Problem 4 Compute and analyze financial ratios. Using the 2009 income statement and balance sheet of Trimark Products Inc., as constructed in problems 1 and 2 above, compute its financial ratios. How is the firm doing relative to its industry in the areas of liquidity, asset management, leverage, and profitability? 37
38 Additional Problems with Answers Problem 4 (continued) Industry Ratio Average Current Ratio Quick Ratio (or Acid Test Ratio) Cash Ratio Debt Ratio Cash Coverage Day s Sales in Receivables Total Asset Turnover Inventory Turnover Day s Sales in Inventory Receivables Turnover Profit Margin Return on Assets Return on Equity
39 Additional Problems with Answers Problem 4 (Answer) Industry Trimark Average Current Ratio Quick Ratio (or Acid Ratio Test) Cash Ratio Debt Ratio Cash Coverage Day s Sales in Receivables Total Asset Turnover Inventory Turnover Day s Sales in Inventory Receivables Turnover Profit Margin Return on Assets Return on Equity
40 Additional Problems with Answers Problem 4 (Answer) (continued) Analysis: Liquidity: Trimark s liquidity ratios are below the industry average indicating that they might need to look into their management of current assets and liabilities. Leverage: Trimark s debt ratio is much lower than the industry average and its cash coverage is more than 3 time the average, indicating that if it needs to borrow longterm debt it should not have much of a problem. Asset management: Trimark s asset turnover ratios are all below the average. It needs to tighten up collections, and manage its inventory more efficiently. Profitability: Trimark has a good control on cost of goods sold. Its net profit margin is better than the industry and so is its ROA. The industry, however, is returning a higher rate to the shareholders on average, primarily due to the higher debt levels. 40
41 Additional Problems with Answers Problem 5 DuPont Analysis. Based on the ratios calculated in problem 4 above, and in conjunction with the industry averages given, conduct a DuPont analysis on Trimark s key profitability ratios. 41
42 Additional Problems with Answers Problem 5 (Answer) According to the Du Pont breakdown, we have ROE = Net Profit Margin * Total Asset Turnover * Equity Multiplier ROE = NI/S * S/TA * TA/Equity Note: since we don t have the accounting information for the average, we have to figure out the industry s equity multiplier by some algebraic manipulation. Equity Multiplier = Total Assets/Equity Now, debt ratio = Total Debt/Total Assets Total Assets = Total Debt + Equity (Total Debt/Total Assets) +( Equity/Total assets) = 1 Equity/Total Assets = 1 (Total Debt/Total Assets) TA/E = 1/(1-TD/TA) 42
43 Additional Problems with Answers Problem 5 (Answer) (continued) Trimark Industry Debt Ratio Total Asset Turnover Profit Margin Return on Assets Return on Equity Equity multiplier = 1/(1-debt ratio) Despite a lower Total Asset Turnover ratio, Trimark s ROA (12.8%) is better than that of the industry (12.6%), primarily due to its higher net profit margin. The industry, however, has a higher ROE (22.1%) due to its higher debt ratio and correspondingly higher equity multiplier. 43

44 Figure 14.1 Cogswell Cola Balance Sheet 44

45 Figure 14.2 Cogswell Cola Income Statement 45
MBF1223 Financial Management Prepared by Dr Khairul Anuar
 MBF1223 Financial Management Prepared by Dr Khairul Anuar L5 - Financial Ratios and Firm Performance www.mba638.wordpress.com Reference Reference for this topic is Financial Management By Raymond Brooks
Working with Financial Statements, Part II
 Working with Financial Statements, Part II Faculty of Business Administration Lakehead University Spring 2003 May 7, 2003 Outline of Chapter 3, Part II 3.3 Ratio Analysis 3.4 The DuPont Identity 3.5 Using
Working with Financial Statements
 Working with Financial Statements Lakehead University September 2005 Overview of the Lecture 3.2 Standardizes Financial Statements 3.3 Ratio Analysis 3.4 Dupont Identity 3.5 Using Financial Statement Information
Working with Financial Statements
 Working with Financial Statements Lakehead University September 2005 Overview of the Lecture 3.2 Standardizes Financial Statements 3.3 Ratio Analysis 3.4 Dupont Identity 3.5 Using Financial Statement Information
Working with Financial Statements
 Working with Financial Statements Lakehead University September 2004 Overview of the Lecture 3.1 Cash Flow and Financial Statements 3.2 Standardizes Financial Statements 3.3 Ratio Analysis 3.4 Dupont Identity
Working with Financial Statements
 Working with Financial Statements Lakehead University September 2004 Overview of the Lecture 3.1 Cash Flow and Financial Statements 3.2 Standardizes Financial Statements 3.3 Ratio Analysis 3.4 Dupont Identity
Week-2 FINC Analysis of Financial Statements. Balance Sheets
 Dr. Ahmed FINC 5000 Week-2 Name Analysis of Financial Statements Balance Sheets Assets 2003 2004 2005e Cash $ 9,000 $ 7,282 $ 14,000 Short-Term Investments. 48,600 20,000 71,632 Accounts Receivable 351,200
Chapter 2. Learning Objectives. Topics Covered. Cash Flow and Financial Statement Analysis
 Chapter 2 Cash Flow and Financial Statement Analysis Learning Objectives Interpret information contained in the balance sheet, income statement, and statement of cash flows. Explain why income differs
Wikipedia: "Financial Ratio" Contents. Sources of Data for Financial Ratios. Purpose and Types of Ratios
 Wikipedia: "Financial Ratio" A financial ratio or accounting ratio is a relative magnitude of two selected numerical values taken from an enterprise's financial statements. Often used in accounting, there
Chapter 7. Analyzing Common Stocks. Security Analysis. Top-Down Approach Kaplan Financial
 Chapter 7 Analyzing Common Stocks Security Analysis Process of gathering, organizing, and using information to determine the intrinsic value of a common stock. Intrinsic value is the underlying or inherent
Role of Financial Manager. Assessing Financial Performance. Analysis of Financial Statements. To create value, the financial manager should:
 Role of Financial Manager To create value, the financial manager should: 1. Make sound investment decisions. 2. Make sound financing decisions. Importance of Assessing Financial Performance Assessing Financial
Financial Statement Analysis
 Financial Statement Analysis Lakehead University September 2003 Overview of the Lecture 2.1 Financial Statements 2.2 Ratio Analysis 2.4 Common-Size Analysis 2.3 Changing Prices 2.5 International Considerations
Chapter 17. Page 1. Company Analysis. Learning Objectives. INVESTMENTS: Analysis and Management Second Canadian Edition
 INVESTMENTS: Analysis and Management Second Canadian Edition W. Sean Cleary Charles P. Jones Chapter 17 Company Analysis Learning Objectives Define fundamental analysis at the company level. Explain the
1 2. Financial ratios
 1 2. Financial ratios Warning 2 Remember that accounting statements are based on book values. We would prefer to make decisions based on market values, but such information may not be easy to obtain, and
Problem Set One. Name
 MK602 Problem Set One Name The first part of the case, presented in Chapter 3 (pages 123-125), discussed the situation that Computron Industries was in after an expansion program. Thus far, sales have
ASSIGNMENT MEMORANDUM : FINANCIAL MANAGEMENT 2 (FM202)
") Page 1 of 6 ASSIGNMENT MEMORANDUM SUBJECT : FINANCIAL MANAGEMENT 2 () ASSIGNMENT : 2 nd SEMESTER 2012 QUESTION 1 [25] 1.1. e 1.2. a 1.3. b 1.4. b 1.5. a 1.6. b 1.7. d 1.8. a 1.9. a 1.10. b 1.11. c 1.12.
Page 1 of 6 ASSIGNMENT MEMORANDUM SUBJECT : FINANCIAL MANAGEMENT 2 () ASSIGNMENT : 2 nd SEMESTER 2012 QUESTION 1 [25] 1.1. e 1.2. a 1.3. b 1.4. b 1.5. a 1.6. b 1.7. d 1.8. a 1.9. a 1.10. b 1.11. c 1.12.
Understanding Financial Management: A Practical Guide Problems and Answers
 Understanding Financial Management: A Practical Guide Problems and Answers Chapter 3 Interpreting Financial Ratios 3.2 Liquidity Ratios 1. Ink Inc. has had a stable current ratio over the past three years
CMA 2010 Support Package
 CMA 2010 Support Package Ratio Definitions CMA EXAM RATIO DEFINITIONS Abbreviations EBIT = Earnings before interest and taxes EBITDA = Earnings before interest, taxes, depreciation and amortization EBT
Curriculum designed for use with the Iowa Electronic Markets Cynthia J. Brown Marilyn M. Dutton Thomas A. Rietz
 Financial Statement Analysis Curriculum designed for use with the Iowa Electronic Markets by Cynthia J. Brown Marilyn M. Dutton Thomas A. Rietz ١ Financial Statement Analysis: Lecture Outline Review of
Lecture 2. Financial Statements, Cash Flows, and Taxes and Analysis of Financial Statements (Ch 2, Ch3)
") Lecture 2. Financial Statements, Cash Flows, and Taxes and Analysis of Financial Statements (Ch 2, Ch3) Basic concepts of Financial Statements (FSs) Why the company needs to construct FSs? To provide information
Lecture 2. Financial Statements, Cash Flows, and Taxes and Analysis of Financial Statements (Ch 2, Ch3) Basic concepts of Financial Statements (FSs) Why the company needs to construct FSs? To provide information
Appendix: Financial Definitions. Basic Accounting Reports
 Appendix: Financial Definitions Several standardized methods have been created to analyze business financial data. These numbers are easily computed from the standard reported accounting data. The various
WEEK 10 Analysis of Financial Statements
 WEEK 10 Analysis of Financial Statements Learning Objectives 1. Organize a systematic financial statements analysis using common-size financial statements and ratio analysis. 2. Recognize the potential
ANALYSIS OF FINANCIAL STATEMENTS
 ANALYSIS OF FINANCIAL STATEMENTS 1. Basic concept of financial statement analysis 2. Liquidity ratios 3. Asset management ratios 4. Debt management ratios 5. Profitability ratios 6. Market value ratios
4 Chapter 2 Chapter 2: Financial Statement and Cash Flow Analysis
 4 Chapter 2 Chapter 2: Financial Statement and Cash Flow Analysis Answers to End of Chapter Questions 2-1. Financial statement analysis provides information about the company s financial health, and its
CHAPTER 2 ANALYSIS OF FINANCIAL STATEMENTS
 CHAPTER 2 ANALYSIS OF FINANCIAL STATEMENTS 1 Learning Outcomes LO.1 Describe the basic financial information that is produced by corporations and explain how the firm s stakeholders use such information.
Lesson 5 Ratios, at first glance
 Advanced Accounting AY 2017/2018 Lesson 5 Ratios, at first glance Università degli Studi di Trieste D.E.A.M.S. Paolo Altin 160 Financial ratios Provide a quick and (relatively) simple means of evaluating
Lecture 4. Interpreting and using financial statements for valuation II. Financial ratio analysis
 Lecture 4 Interpreting and using financial statements for valuation II Financial ratio analysis Agenda Use of financial ratios ROE decomposition Growth, risk, and, cash flow 2 What are financial ratios
Kavous Ardalan. Marist College, New York, USA
 Journal of Modern Accounting and Auditing, July 2017, Vol. 13, No. 7, 294-298 doi: 10.17265/1548-6583/2017.07.002 D DAVID PUBLISHING Advancing the Interpretation of the Du Pont Equation Kavous Ardalan
FAQ: Financial Ratio Analysis
 Question 1: What is horizontal analysis of financial statement data? Answer 1: Horizontal analysis is a method of financial ratio analysis. Horizontal analysis is comparing each item on the financial statements
Chapter 3 Analysis of Financial Statements. Ratio Analysis Please refer to the attached financial statements, and industry average ratios
 Chapter 3 Analysis of Financial Statements Ratio Analysis Please refer to the attached financial statements, and industry average ratios In this chapter, we will cover Liquidity ratios Asset management
The Du Pont System of the Analysis of Return Ratios Applied to Sears, Roebuck & Co.
 The Du Pont System of the Analysis of Return Ratios Applied to Sears, Roebuck & Co. Return on Assets (ROA) 1 Return on Equity (ROE) 2 Calculation for fiscal year 2003 Calculation for fiscal year 2003 (
Georgia Banking School Financial Statement Analysis. Dr. Christopher R Pope Terry College of Business University of Georgia
 Georgia Banking School Financial Statement Analysis Dr. Christopher R Pope Terry College of Business University of Georgia Introduction Objective My objective is to introduce you to the analysis of financial
Professional Designation Ratios: Formulas & Definitions Used in Credit Risk Assessment
 Professional Designation Ratios: Formulas & Definitions Used in Credit Risk Assessment Profitability Ratios Measure management's ability to control expenses and to earn a return on the resources committed
Financial Statements, Forecasts, and Planning Chapter 6
 C H A P T E R 6 Financial Statements, Forecasts, and Planning Chapter 6 Chapter Objectives Identify the elements of the balance sheet. Identify the elements of the income statement. Discuss the cash flow
Turnarounds. Financial Decline: When Bad Things Happen to Good Companies
 Turnarounds Financial Decline: When Bad Things Happen to Good Companies 1 A Better Place 2 Financial Distress Risk View from an outsider s perspective investors creditors Also useful for evaluating prospects
Analysis and Interpretation of Financial Statements
 Chapter 23 Analysis and Interpretation of Financial Statements o Prepare comparative financial statements using horizontal analysis o Prepare comparative financial statements using vertical analysis o
Learning Goal 1: Review the contents of the stockholders' report and the procedures for consolidating international financial statements.
 Principles of Managerial Finance, 12e (Gitman) Chapter 2 Financial Statements and Analysis Learning Goal 1: Review the contents of the stockholders' report and the procedures for consolidating international
Corporate Finance, 3Ce (Berk, DeMarzo, Strangeland) Chapter 2 Introduction to Financial Statement Analysis
 Chapter 2 Introduction to Financial Statement Analysis") Corporate Finance, 3Ce (Berk, DeMarzo, Strangeland) Chapter 2 Introduction to Financial Statement Analysis 2.1 The Disclosure of Financial Information 1) Canadian public companies are required to file
Corporate Finance, 3Ce (Berk, DeMarzo, Strangeland) Chapter 2 Introduction to Financial Statement Analysis 2.1 The Disclosure of Financial Information 1) Canadian public companies are required to file
ANSWERS TO END-OF-CHAPTER QUESTIONS
 ANSWERS TO END-OF-CHAPTER QUESTIONS 8/6/12 13.1 a. Financial statement analysis, which focuses on the data contained in a business s financial statements, is designed to assess the financial condition
Chapter 3 Working with Financial Statements
 Chapter 3 Working with Financial Statements This chapter is a continuation of Chapter 2. We use accounting numbers because of the unavailability of market numbers. We prefer to use market numbers. Common-Size
07/10/2013. Chapter 18. Financial statement analysis part a, Session 11
 Chapter 18 Financial statement analysis part a, Session 11 PowerPoint to accompany: Learning objectives Perform a horizontal analysis of financial statements Perform a vertical analysis of financial statements
Week 14, Chap14 Accounting 1A, Financial Accounting
 Week 14, Chap14 Accounting 1A, Financial Accounting Analyzing Financial Statements Instructor: Michael Booth Understanding The Business Return on an equity security investment Dividends Increase in share
Ratio Analysis. Assets = Liabilities + Shareholder s Equity
 Ratio Analysis The purpose of a financial statement is to disclose information about the financial position of an entity to interested parties. By reporting the finances, shareholders are able to make
Homework Solutions - Lecture 1
 Homework Solutions - Lecture 1 1. You are analyzing a company with the expected future cash flows shown below. Based on current market prices, the market value of the firm s equity is $1,96.9. The outstanding
FUNDAMENTALS OF HEALTHCARE FINANCE. Online Appendix B. Financial Analysis Ratios
 FUNDAMENTALS OF HEALTHCARE FINANCE Online Appendix B Financial Analysis Ratios INTRODUCTION In Chapter 13, we indicated that financial ratio analysis is a technique commonly used to help assess a business
Chapter 3 Financial Statements Analysis
 Chapter 3 Financial Statements Analysis 1 Acknowledgement This work is reproduced, based on the book [Ross, Westerfield, Jaffe and Jordan Core Principles and Applications of Corporate Finance ]. This work
Solutions Manual for Essentials of Managerial Finance 14th Edition by Besley Brigham
 Solutions Manual for Essentials of Managerial Finance 14th Edition by Besley Brigham Link download full: http://testbankair.com/download/solutions-manual-foressentials-of-managerial-finance-14th-edition-by-besley-brigham/
chapter4 To guide or not to guide, that is the Analysis of Financial Statements
 chapter4 Analysis of Financial Statements To guide or not to guide, that is the question. Or at least it s the question many companies are wrestling with regarding earnings forecasts. Should a company
REVIEW OF BASIC UNDERSTANDING AND ANALYSIS OF FINANCIAL STATEMENTS
 REVIEW OF BASIC UNDERSTANDING AND ANALYSIS OF FINANCIAL STATEMENTS Payear Sangiumvibool, Ph.D., CPA (US) ดร. พเย ย เสง ยมว บ ล Webster University Thailand Faculty, Accounting and Management สภาว ชาช พบ
This is How Do Managers Use Financial and Nonfinancial Performance Measures?, chapter 13 from the book Accounting for Managers (index.html) (v. 1.0).
 (v. 1.0).") This is How Do Managers Use Financial and Nonfinancial Performance Measures?, chapter 13 from the book Accounting for Managers (index.html) (v. 1.0). This book is licensed under a Creative Commons by-nc-sa
This is How Do Managers Use Financial and Nonfinancial Performance Measures?, chapter 13 from the book Accounting for Managers (index.html) (v. 1.0). This book is licensed under a Creative Commons by-nc-sa
CHAPTER 3. Analysis of Financial Statements
 CHAPTER 3 Analysis of Financial Statements 1 Topics in Chapter Ratio analysis Du Pont system Effects of improving ratios Limitations of ratio analysis Qualitative factors 2 Determinants of Intrinsic Value:
FINANCIAL RATIOS. LIQUIDITY RATIOS (and Working Capital) You want current and quick ratios to be > 1. Current Liabilities SAMPLE BALANCE SHEET ASSETS
 You want current and quick ratios to be > 1. Current Liabilities SAMPLE BALANCE SHEET ASSETS") FINANCIAL RATIOS ROUND ALL ANSWERS TO TWO DECIMALS UNLESS REQUESTED OTHERWISE IN THE PROBLEM LIQUIDITY RATIOS (and Working Capital) You want current and quick ratios to be > 1 Current Ratio Quick Ratio
FINANCIAL RATIOS ROUND ALL ANSWERS TO TWO DECIMALS UNLESS REQUESTED OTHERWISE IN THE PROBLEM LIQUIDITY RATIOS (and Working Capital) You want current and quick ratios to be > 1 Current Ratio Quick Ratio
CHAPTER 3. Topics in Chapter. Analysis of Financial Statements
 CHAPTER 3 Analysis of Financial Statements 1 Topics in Chapter Ratio analysis DuPont equation Effects of improving ratios Limitations of ratio analysis Qualitative factors 2 Determinants of Intrinsic Value:
FINANCIAL ANALYSIS TOOLS: DESCRIPTION CHAPTER 7 FINANCIAL ANALYSIS TECHNIQUES GRAPHICS: EXAMPLE GRAPHICS: EXAMPLE
 Presenter s name Presenter s title dd Month yyyy CHAPTER 7 FINANCIAL ANALYSIS TECHNIQUES FINANCIAL ANALYSIS TOOLS: DESCRIPTION Graphics Regression Common-Size Analysis Financial Ratio Analysis Copyright
C521 CHAPTER 13 & REVIEW FOR MIDTERM FINANCIAL ACCOUNTING EXAM
 1 C521 CHAPTER 13 & REVIEW FOR MIDTERM FINANCIAL ACCOUNTING EXAM What have we done in the course? On a chapter by chapter basis, we primarily have examined specific transactions and the effect on financial
CFIN4 Chapter 2 Analysis of Financial Statements
 1. The income statement measures the flow of funds into (i.e. revenue) and out of (i.e. expenses) the firm over a certain time period. It is always based on accounting data. Income statement 2. The balance
Managerial Accounting Prof. Dr. Varadraj Bapat Department of School of Management Indian Institute of Technology, Bombay. Lecture - 14 Ratio Analysis
 Managerial Accounting Prof. Dr. Varadraj Bapat Department of School of Management Indian Institute of Technology, Bombay Lecture - 14 Ratio Analysis Dear students, in our last session we are started the
Today s Agenda. Deriving the Du Pont Identity. Nike & Reebok s Profitability Ratios
 Today s Agenda DuPont Identity Market Value Ratios Financial Statement Analysis Uses & Problems Introduction to Bond Valuation Nike & Reebok s Profitability Ratios Profitability Ratios Nike Reebok Profit
ANALYSIS OF FINANCIAL STATEMENTS
 2059T_c05_150-188.QXD 06/29/2006 06:16 PM Page 150 5 ANALYSIS OF FINANCIAL STATEMENTS Reviewing and Assessing Financial Information Starting Point Go to www.wiley.com/college/melicher to assess your knowledge
Chapter 19. Financial Statement Analysis. Learning Objectives. The Annual Report Usually Contains...
 PowerPoint to accompany Chapter 19 Financial Statement Analysis Learning Objectives 1. Perform a horizontal analysis of comparative financial statements 2. Perform a vertical analysis of financial statements
ESV Ensco plc Sector: Energy SELL
 Analysts: Spencer Elkinton, Jake Gregg and Adam Smith Washburn University Applied Portfolio Management ESV Sector: Energy SELL Report Date: 4/18/2016 Market Cap (mm) $2,013 Annual Dividend.60 2 Yr Beta
CHAPTER 2 ANALYSIS OF FINANCIAL STATEMENTS
 TRUE/FALSE CHAPTER 2 ANALYSIS OF FINANCIAL STATEMENTS 1. The income statement measures the flow of funds into (i.e. revenue) and out of (i.e. expenses) the firm over a certain time period. It is always
Chapter 17. Financial Statement Analysis
 Chapter 17 Financial Statement Analysis 17-2 Topics Covered Financial Ratios DuPont System Using Financial ratios Measuring Company Performance The Role of Financial Ratios 17-3 Financial Ratios Five types
Breaking Down ROE Using the DuPont Formula. R eturn on equity. By Z. Joe Lan, CFA
 Breaking Down ROE Using the DuPont Formula By Z. Joe Lan, CFA Article Highlights ROE calculates the return a company earns from shareholder s equity. The DuPont formula reveals the source of those returns:
Top 8. Capstone Financial Ratios
 Financial Ratio Review Top 8 Plus Capstone Financial Ratios Kenneth EA Wendeln 2012 KEAW v5 Top 8 Key Financial Ratios Profitability Liquidity Return on Owners Equity % Current Ratio # n.nn EPS Earnings
BFSI & Capital Markets Study Group
 BFSI & Capital Markets Study Group - Wirc of Icai - Empowering Excellence Roundtable Discussion / Think Tank Meeting Venue : BKC Date : 31/10/2015 Topics : Applied Financial Analysis and Forecasting Financials
CVX Chevron Corporation Sector: Energy SELL
 Analysts: Zachary Haller, Andrew Paley Brown and Sean Miller Washburn University Applied Portfolio Management CVX Sector: Energy SELL Report Date: 4/18/2016 Market Cap (mm) $157,566 Annual Dividend $4.28
Week 4 and Week 5 Handout Financial Statement Analysis
 Week 4 and Week 5 Handout Financial Statement Analysis Introduction After understanding the basic financial statements, one may be interested in analysing the financial statements to understand the performance
CHAPTER 19: FINANCIAL STATEMENT ANALYSIS
 CHAPTER 19: FINANCIAL STATEMENT ANALYSIS 1. ROE Net profits/equity Net profits/sales Sales/Assets Assets/Equity Net profit margin Asset turnover Leverage ratio 5.5% 2.0 2.2 24.2% 2. ROA ROS ATO The only
Study Guide. Corporate Finance. A. J. Cataldo II, Ph.D., CPA, CMA
 Study Guide Corporate Finance By A. J. Cataldo II, Ph.D., CPA, CMA About the Author A. J. Cataldo is currently a professor of accounting at West Chester University, in West Chester, Pennsylvania. He holds
Brandon's Auto Supply Company
 Balance Sheet at June 30, 20XX Brandon's Auto Supply Company Vertical Analysis 20X9 % 20X8 % 20X7 % Current Assets Cash $ 88,531 7.5% $ 104,287 9.5% $ 117,910 11.7% Accounts receivable $ 117,793 10.0%
Scott.Helkowski Yanjun Gu Yiqin Gao
 Scott.Helkowski Yanjun Gu Yiqin Gao Overview Primarily food, beverages (including alcoholic beverages), tobacco, retailing and household items. The staples sector has historically exhibited a beta of.52
EXC Exelon Corporation Sector: Utilities HOLD
 Analysts: Alexa Bowen, Blake Porter and Kennedy White Washburn University Applied Portfolio Management EXC Sector: Utilities HOLD Report Date: 4/18/2016 Market Cap (mm) $31,337 Annual Dividend $1.24 2
Chapter 2. Introduction to Financial Statement Analysis
 Chapter 2 Introduction to Financial Statement Analysis 2-1. In a firm s annual report, five financial statements can be found: the balance sheet, the income statement, the statement of cash flows, the
Analysis of Financial Statements
 Question 1: What are the key elements in the primary financial statements that are used by executives for firm analysis? The three key financial statements that business executives and financial analysts
ACTY 7292 Financial Statement Analysis Final Exam Semester 1, 2015
 Faculty of Creative Industries & Business Department of Accounting and Finance Bachelor of Business ACTY 7292 Financial Statement Analysis Final Exam Date: Wednesday 1 st July 2015 Start time: 8.30AM 11.40AM
Financial Statements Analysis and Reporting Dr. Anil Kumar Sharma Department of Management Studies Indian Institute of Technology, Roorkee
 Financial Statements Analysis and Reporting Dr. Anil Kumar Sharma Department of Management Studies Indian Institute of Technology, Roorkee Lecture - 49 DuPont Ratios Part II Welcome students. So, in the
Corporate Finance. Week 3 Financial Statement Analysis II
 Corporate Finance 1-1 Week 3 Financial Statement Analysis II 1-1 Asset Efficiency or Turnover Measures 1-2 A first broad measure of efficiency is asset turnover: Sales Asset Turnover = Total Assets Fixed
Business Assignment 2 Solutions. 1. Consider the balance sheets and income statements for Sunrise, Inc. depicted in Table 1 and Table 2.
 Business 2019 Assignment 2 Solutions 1. Consider the balance sheets and income statements for Sunrise, Inc. depicted in Table 1 and Table 2. (a) For year 2000, calculate Sunrise s cash flow from assets,
National Annual Finance and Investment Management Olympiad
 2017 National Annual Finance and Investment Management Olympiad Paper 2 Duration: 2 hours Questions: 60 multiple choice questions Instructions This question paper has 60 multiple choice questions. Please
Introduction. The industry has seen tremendous growth over last 5 years
 Introduction Why automotive industry? The industry has seen tremendous growth over last 5 years Highly sensitive to demand and can be affected by external factors Capital intensive industry What are we
Chapter 02 Analysis of Financial Statements
 Chapter 02 Analysis of Financial Statements TRUEFALSE 1. The information contained in the annual report is used by investors to form expectations about future earnings and dividends. 2. Noncash assets
Absolute and relative security valuation
 Absolute and relative security valuation Bertrand Groslambert bertrand.groslambert@skema.edu Skema Business School Portfolio Management 1 Course Outline Introduction (lecture 1) Presentation of portfolio
CA. Sonali Jagath Prasad ACA, ACMA, CGMA, B. Com.
 MANAGEMENT OF FINANCIAL RESOURCES AND PERFORMANCE SESSIONS 5 & 6 FINANCIAL DATA, PERFORMANCE ANALYSIS & MANAGEMENT AND DECISION MAKING June 10 to 24, 2013 CA. Sonali Jagath Prasad ACA, ACMA, CGMA, B. Com.
FINANCIAL STATEMENT ANALYSIS & RATING CAMPARI S.P.A.
 FINANCIAL STATEMENT ANALYSIS & RATING CAMPARI S.P.A. Year 2012-2014 Report developed on www.cloudfinance.it 2 Sommario Financial Highlights... 3 Reclassified Financials... 8 Structure of Assets & Liabilities...
Understanding Financial Statements. Elizabeth Rankin
 Understanding Financial Statements Elizabeth Rankin Overview Accounting Concepts Principles Financial Statements Evaluating Performance Horizontal Analysis Vertical Analysis Ratio Analysis Entity Concept
In March 2005, shares of stock in chipmaker Intel were trading. Financial Statements. How to standardize financial statements for comparison purposes.
 and Cash Flow In March 2005, shares of stock in chipmaker Intel were trading for about $23. At that price, Intel had a price-earnings ratio of 20, meaning that investors were willing to pay $20 for every
Corporate Finance, 3e (Berk/DeMarzo) Chapter 2 Introduction to Financial Statement Analysis. 2.1 Firms' Disclosure of Financial Information
 Chapter 2 Introduction to Financial Statement Analysis. 2.1 Firms' Disclosure of Financial Information") Corporate Finance, 3e (Berk/DeMarzo) Chapter 2 Introduction to Financial Statement Analysis 2.1 Firms' Disclosure of Financial Information 1) U.S. public companies are required to file their annual financial
Corporate Finance, 3e (Berk/DeMarzo) Chapter 2 Introduction to Financial Statement Analysis 2.1 Firms' Disclosure of Financial Information 1) U.S. public companies are required to file their annual financial
ESSENTIALS OF ENTREPRENEURSHIP AND SMALL BUSINESS MANAGEMENT Chapter 11: Creating a Successful Financial Plan
 Copyright 2016 Pearson Education Inc 1 Section 3: Launching the Business 11 Creating a Successful Financial Plan 11-2 Describe how to prepare the basic financial statements and use them to manage a small
Investment Analysis (FIN 383) Fall Homework 9
 Fall Homework 9") Investment Analysis (FIN 383) Fall 2008 Homework 9 Instructions: please read carefully You should show your work how to get the answer for each calculation question to get full credit The due date is Tue
Investment Analysis (FIN 383) Fall 2008 Homework 9 Instructions: please read carefully You should show your work how to get the answer for each calculation question to get full credit The due date is Tue
Measuring Vendor Financial Strength
 Measuring Vendor Financial Strength Presented by Michael Greene, City of Tempe Presentation Overview Why is it important to consider a firm s financial strength Review the three typical financial statements:
Chapter 2 Solutions. 2-4 Shares issued = 100,000 Price per share = $7 Par value per share = $3
 Chapter 2 CFIN5 Chapter 2 Solutions 2-1 Publically-traded companies are required to provide adequate financial information to their shareholders. Information generally is provided through financial reports
ACCA F3. Provided by Academy of Professional Accounting (APA) Financial Accounting (FA) 财务会计第二十九讲. ACCA Lecturer: Rachel XU
 Financial Accounting (FA) 财务会计第二十九讲. ACCA Lecturer: Rachel XU") Professional Accounting Education Provided by Academy of Professional Accounting (APA) ACCA F3 Financial Accounting (FA) 财务会计第二十九讲 ACCA Lecturer: Rachel XU ACCAspace 中国 ACCA 特许公认会计师教育平台 Copyright ACCAspace.com
Professional Accounting Education Provided by Academy of Professional Accounting (APA) ACCA F3 Financial Accounting (FA) 财务会计第二十九讲 ACCA Lecturer: Rachel XU ACCAspace 中国 ACCA 特许公认会计师教育平台 Copyright ACCAspace.com
John A. Jaeger, CCE, MBA
 John A. Jaeger, CCE, MBA Session Outline General Info Review Company Introduction & Industry Review Company Financials Ratio Analysis Discussion Strengths & Weaknesses Decision Extend Credit Management
Business 2019, Spring 2003
 Business 2019, Spring 2003 Assignment 1 Suggested Answers 1. Financial Statements and Cash Flow Answer the following questions using Table 1. Bed Rock s tax rate in 2002 was 34%. (a) (6 points) Complete
CHAPTER II THEORETICAL BACKGROUND. Corporate failure is situation when company faced crisis in terms of
 CHAPTER II THEORETICAL BACKGROUND 2.1 Theoretical Background Corporate failure is situation when company faced crisis in terms of financial and do not take proper actions that can avoid bankruptcy. According
Verizon Communications Inc. Sector: Telecommunication Services Hold
 Applied Portfolio Management Analysts: Travis Hirt, Brandon Holle and Mark Latimer VZ Verizon Communications Inc. Sector: Telecommunication Services Hold Report Date: 4/4/25 Market Cap (mm) $85,94 Annual
Honeywell Flour Mills Plc
 Honeywell Flour Mills Plc Additional Milling Capacity supports revenue growth Honeywell Flour Mills Plc ( HFM or the company ) recently released its 9M results to December 2013. The unaudited 9M results
Lecture 1: Security selection and securities analysis
 Lecture 1: Security selection and securities analysis In this lecture we will focus on the main methods used to select individual securities for a portfolio. These may be summarized on the one hand as
Who of the following make a broader use of accounting information?
 Who of the following make a broader use of accounting information? Accountants Financial Analysts Auditors Marketers Which of the following is NOT an internal use of financial statements information? Planning