Public Debt Management
|
|
|
- Pamela Kelly
- 5 years ago
- Views:
Transcription
1 Public Debt Management quarterly report january- march 2016 Government of India Ministry of finance Budget Division Department of economic affairs May
2 CONTENTS Section Page No. Introduction 4 1 Macroeconomic Developments 5 2 Debt Management - Primary Market Operations 10 3 Cash Management 13 4 Trends in Outstanding Public Debt 15 5 Secondary Market 19 2
3 List of Tables and Charts List of Tables Table No. Title Page No. 1 Fiscal Outcome during April Feb Issuance of Dated Securities 11 3 Primary Issuance by Maturity Buckets, Q4 of FY Issuance of Treasury Bills 12 5 Repayments and Issuance of Treasury Bills in January -March Composition of Public Debt 16 7 Maturity and Yield of Central Government's Market Loans 17 8 Maturity Profile of GoI Outstanding Dated Securities 18 9 Ownership Pattern of Government of India Dated Securities Transactions in Government Securities Top 10 Traded Securities Maturity Pattern of Outright Transactions Category wise Buying and Selling (% of Total) 26 List of Charts Chart No. Title Page No. 1 Growth Rate in GDP at constant ( ) prices 5 2 Inflation Rate Based on WPI and CPI 6 3 Growth Rate in IIP 7 4 Monthly Exports and Imports 8 5 Foreign Investment Flow and Exchange Rate 9 6 Liquidity in the System 14 7 Holding Pattern of Government Securities 19 8 Movement of G-Sec Yields 10-year 21 9 Government Bond Yield Curve Treasury Bill Yield Curve 22 11a Secondary Market Transaction - Outright 23 11b Secondary Market Transaction - Jan-Mar a Maturity wise Trading Activity - Jan-Mar b 13 Maturity wise Trading Activity - Oct-Dec 2015 Trading Activity (Buy+Sell) by Category List of Statements Statement No. Title Page No. 1 Issuance of Dated Securities During FY Treasury Bills Issued During FY List of Dated Securities Outstanding at end-mar Maturity Profile of Government Securities at end-mar 2016 Calendar for Auction of Treasury Bills during Apr-June
4 Introduction The Middle Office was set up in September 2008, in Department of Economic Affairs, Ministry of Finance, Government of India. With the objective of enhancing transparency of debt management operations, Middle Office began publishing on its website a quarterly report titled Public Debt Management - Quarterly Report from the first quarter of the fiscal year The previous reports are available on the website of Ministry of Finance ( This report pertains to the fourth quarter of the fiscal year , viz., January-March The report gives an account of the debt management and cash management operations during the quarter, and attempts a rationale for major activities. The report also tries to provide detailed information on various aspects of debt management. While all attempts have been made to provide authentic and accurate information, it is possible that some errors might have crept in inadvertently. Readers may inform us of such errors and their valuable suggestions at mo-dea@nic.in. 4
5 :Q :Q :Q : Q (Ist RE) : Q : Q : Q (AE) Per cent 1 Macroeconomic Developments 1.1 India s real GDP growth at constant ( ) prices during (as per advance estimates of Feb 8, 2016) is estimated at 7.6 per cent as compared to the growth rate of 7.2 per cent in (first revised estimates). Also real GDP in Q3 (Oct-Dec) FY 16 (at constant price ) grew by 7.3 per cent as against upward revised growth of 7.7 per cent in Q2 FY16 (Chart 1). Anticipated growth of real GVA at basic constant prices ( ) during is 7.3 per cent against 7.1 per cent in The sectors which are likely to register growth rate of over 7.0 per cent are 'financial, real estate and professional services', trade, hotels, transport, communication and services related to broadcasting, and manufacturing'. The growth in the agriculture, forestry and fishing, mining and quarrying, electricity, gas, water supply and other utility services, construction and public administration, defence and other services is estimated to be 1.1 per cent, 6.9 per cent, 5.9 per cent, 3.7 per cent and 6.9 per cent respectively. Chart 1: Growth Rate in GDP at Constant ( ) Prices WPI inflation continued to remain in the negative zone for the 17 th consecutive month with WPI inflation in Mar 2016 placed provisionally at (-)0.81 per cent (y-o-y), as compared with (-)0.95 per cent in Feb Despite disinflation observed in food-related components, gradual upturn in commodity prices pushed WPI inflation slightly higher than the previous month. 5
6 Apr May Jun Jul Aug Sep Oct Nov Dec Jan Feb Mar per cent Headline CPI Inflation for March 2016 (prov.) stood at 4.83 per cent, marking a six-month low and much lower than revised estimate of 5.26 per cent in February The favourable base effects, which had nudged inflation into a dip during July-August 2015, waned from September and consequently, inflation rose for six months successively before subsiding in February Component-wise, food inflation eased to 5.27 per cent in March 2016 from 6.62 per cent in the corresponding period last year. Specifically, drastic fall in pulses inflation from a peak of per cent in November 2015 to per cent in March 2016 was significant. Other key components like housing (5.31 per cent vs 5.33 per cent), clothing and footwear (5.60 per cent vs 5.50 per cent) and Fuel and Light (3.38 per cent vs 4.59 per cent) noted secular decline. Services inflation came in at 4.01 per cent for March 2016, slowing from 4.38 per cent in the previous month. As a result, core price pressures cooled to 4.75 per cent in March 2016, reverting back to January 2016 levels. Also average CPI inflation rate during FY was lower at 4.91 per cent as compared with 5.97 per cent during FY (Chart 2). Chart 2: Inflation Rate Based on WPI and CPI WPI WPI CPI CPI 1.3 Index of Industrial Production (IIP), the economic barometer of Industrial growth of India registered a growth of 0.1 per cent in March 2016 as against 2.5 per cent noted in a year ago period. Weak growth in manufacturing and capital goods continued to impair industrial recovery of the country. However, on a cumulative basis, average IIP growth moderated marginally to 2.5 per cent during FY 2016, as compared to 2.8 per cent growth in the comparable period last year (Chart 3). 6
7 Per cent Chart 3: Growth Rate in IIP Apr May Jun Jul Aug Sep Oct Nov Dec Jan Feb Mar India s exports during Q4 FY 16 (Jan -Mar 2016) continued to decline (y-o-y) by 8.2 per cent while imports contracted by 13.2 per cent during the quarter. Exports contracted for the sixteenth successive month in March 2016 and the rate of contraction in exports narrowed to a single digit for the first time during Feb 2016 after Jan 2015 and volume growth turned positive. The decline in non-pol exports was even smaller, with gems and jewellery, drugs and pharmaceuticals, electronics and chemicals driving the upturn. The prolonged contraction in imports also slowed significantly, and non-pol non-gold import growth turned positive for the first time after seven months in Feb This reflected a sizable upsurge in imports of machinery, supported by a pick-up in imports of pearls and precious stones and electronic goods. With gold imports falling in February and March, the continuing softness in crude prices working favourably in terms of conserving the POL import bill and some gains in terms of trade, the trade deficit narrowed to its lowest monthly level in March 2016 since September 2013 (Chart 4). Trade deficit on a y-o-y basis, decreased sharply to 25.8 per cent during Q 4 FY16 (Jan -Mar) as compared with a decline of 19.7 per cent in Q 3. In turn, this has likely lowered the current account deficit (CAD) in Q4 below 1.3 per cent of GDP (recorded in Q3), despite a moderation in net receipts from services exports and remittances. 7
8 USD mn Per cent Chart 4: Monthly Exports and Imports Mar-16 Feb-16 Jan-16 Dec-15 Nov-15 Oct-15 Sep-15 Aug-15 Jul-15 Jun-15 May-15 Apr-15 Mar-15 Feb-15 Jan-15 Dec-14 Nov-14 Oct-14 Sep-14 Aug-14 Jul-14 Jun-14 May-14 Apr-14 Exports Imports Trade Balance Growth Exports (right scale) Source: RBI Bulletiin and PIB Growth Imports (right scale) 1.5 Net inflows in the form of foreign direct investment (FDI) were robust in Q4 FY 2016 (Jan-Feb), more than sufficient to fund the external financing requirement. Foreign portfolio investors (FPIs), who were net sellers in the domestic capital market up to February 2016, also became net buyers in March 2016 in both equity and debt segments (Chart 5). During (up to end-march 2016), there has been an accretion of US$ billion to the foreign exchange reserves which touched US$ billion at end-march As compared with previous quarter closing of INR at `66.33 per USD on Dec 31, 2015, rupee exhibited a largely depreciating trend during first two months (Jan-Feb 2016) of Q 4 FY 2016 on account of general risk aversion globally with falling equity markets and rising bond yields as also uncertainty surrounding the announcement of Union Budget. The rupee touch its lowest of the quarter at `68.78 per USD on February 26, 2016, which was also a lowest since September Thereafter it recovered consistently and INR touched its quarter high of `66.33 per USD on March 31, 2016, on positive market sentiment post-budget and positive news on capital flows and external sector data. 8
9 Q Q Q Q Q Q Q Q Q Q Q Q (Jan-Feb) USD mn `/USD average of Quarter/Month Chart 5: Foreign Investment Flow and Exchange Rate Source: RBI Direct Invest Portfolio Investment Total Exchange Rate (right scale) Note: Data on FDI have been revised since April 2011 to expand the coverage. 9
10 Section 2 Debt Management - Primary Market Operations A. Government Finances 2.1 Central Government had budgeted the gross fiscal deficit at ` 5.56 trillion (3.9 % of GDP for FY ) in Union Budget The same was revised to ` 5.35 trillion (3.9 per cent of GDP) in Union Budget as against `5.11 trillion (4.1 per cent of GDP) for FY The fiscal outcome for the FY16 (April-Mar 2016) of Central Government indicates lower gross fiscal deficit during April-Feb at `5.73 trillion or per cent of RE as against per cent during corresponding period of previous year. Total receipts (from revenue and non-debt capital) during the Apr- Feb 2016 are `9.83 trillion or 78.6 per cent of the (RE) was higher than 73.3 per cent of RE over the corresponding period of previous year. Total expenditure of the government during Apr- Feb 2016 was ` trillion or 87.1 per cent of RE (Table 1). Table 1: Fiscal Outcome during the April -February (Amount in ` crore) Item RE April-February April-Feb (% of RE) April-Feb (% of RE) Revenue Receipts 1,206, , Tax Receipts 947, , Non-Tax Receipts 258, , Other Non-debt Receipts 44,217 35, Total Expenditure 1,785,391 1,555, Revenue Expenditure 1,547,673 1,337, Capital Expenditure 237, , Revenue Deficit 341, , Primary Deficit 92, , Gross Fiscal Deficit 535, , Financing of which Market Loans* 509, , External Assistance 11,485 5, Securities against Small Savings 53,418 21, *:- Includes borrowings through treasury bills. Source: Controller General of Accounts (CGA) website; cga.nic.in 10
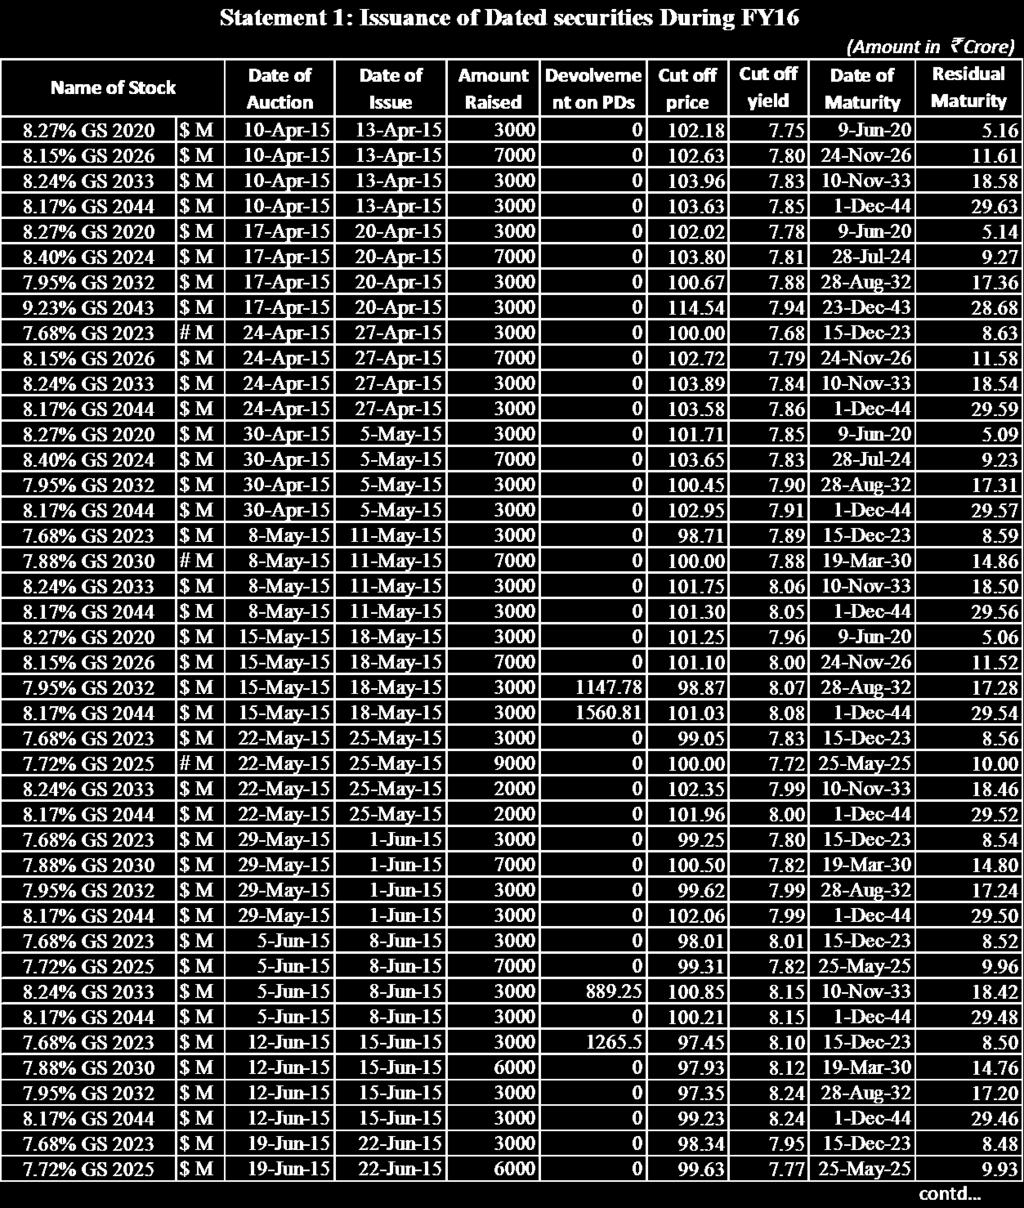
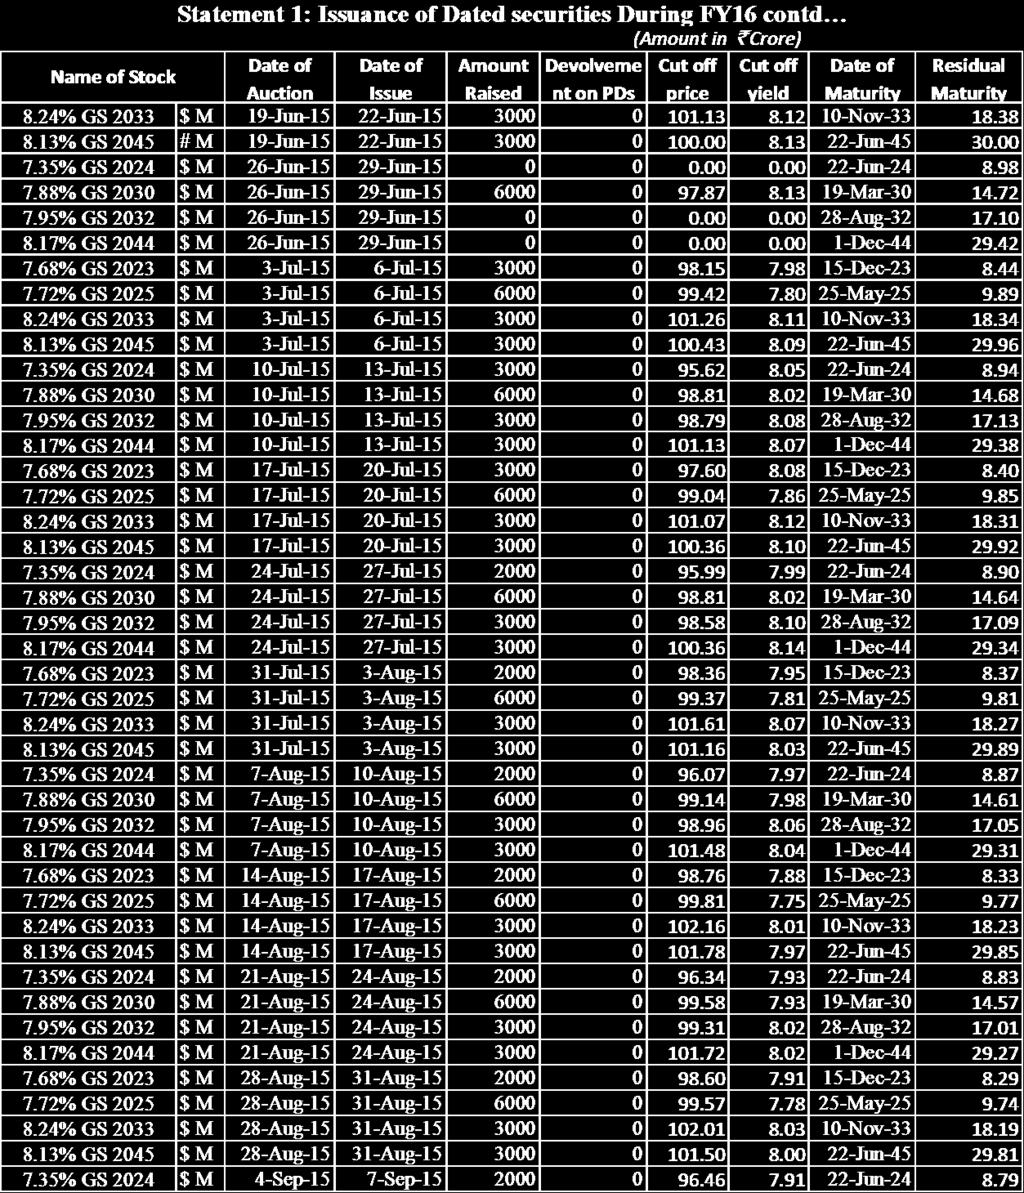
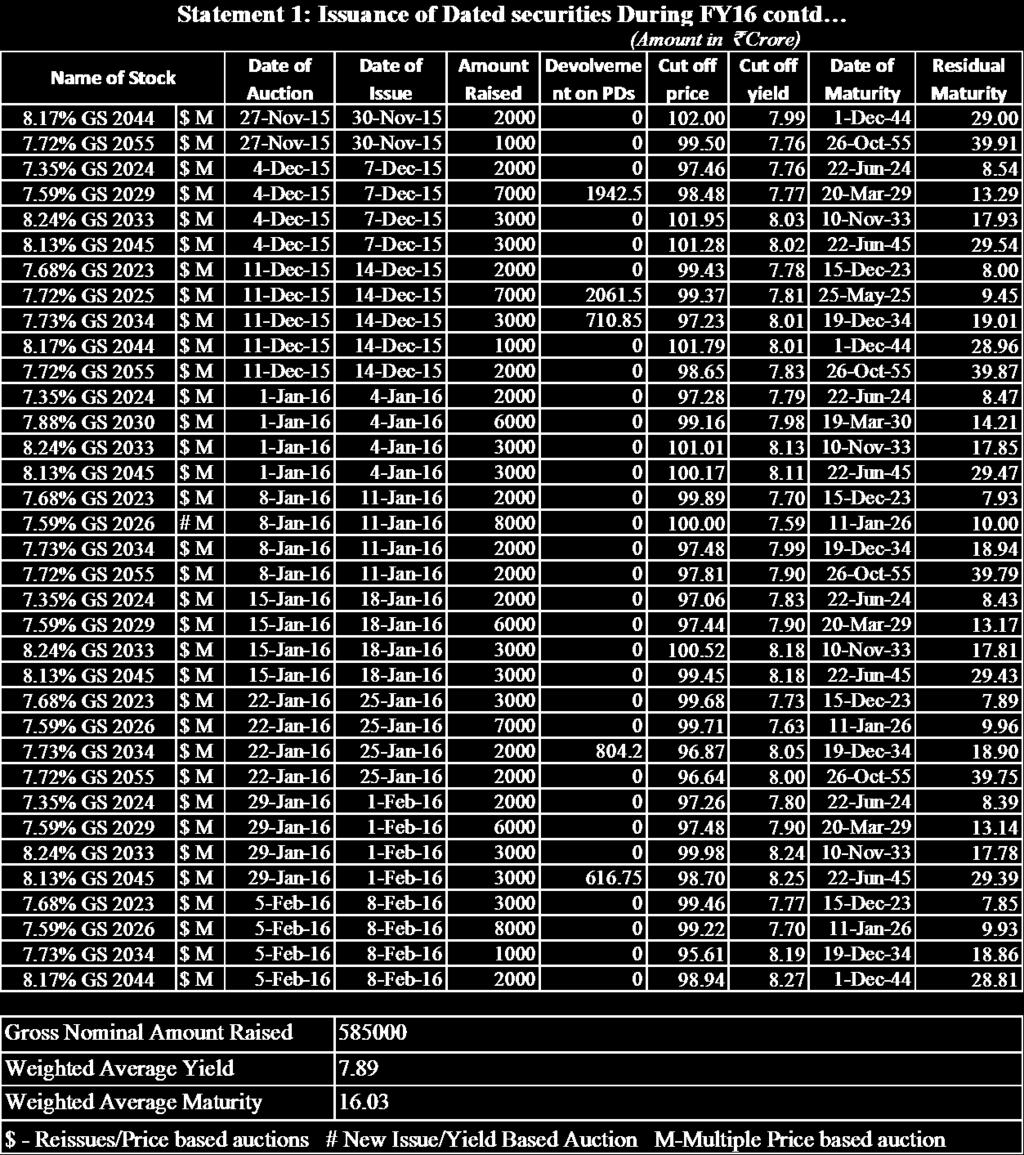
11 2. Issuance Details 2.3 This section discusses the issuance details of market borrowings during the Apr-Mar Gross and net market borrowing requirements of the Government for FY16 were revised lower to `5,85,000 crore and `4,40,608 crore, which were lesser by 1.18 per cent and 2.75 per cent, respectively, than `5,92,000 crore and `4,53,205 crore in FY15. During Q4 of FY16, the Government issued dated securities worth `84,000 crore taking the gross borrowings from Apr-Mar of FY16 to `5,85,000 crore (Table 2). Table 2: Issuance of Dated Securities (Amount in ` crore) Item RE Q 4 FY 16 FY (Actual) FY (Actual) FY 16 % of RE FY 15 % of RE Gross Amount Repayments Repurchases/buyback Net Issuance* 585,000 84, , , , , , ,678 36,575 36,575 6, ,608 84, , , * Exclude repurchase/buyback amount. 2.5 Auctions during Q4 of FY16 were held broadly in accordance with the pre-announced calendar (Table 3). During Q4 FY 16, six tranches of auctions were held for issuances of GoI dated securities worth ` 84,000 crore. Around 49 per cent of total issued securities were issued in the maturity bucket of years. There was no devolvement on PDs during Q4 FY16 as against devolvement on PDs worth ` 4,715 cr of three securities during Q3 FY16. 11
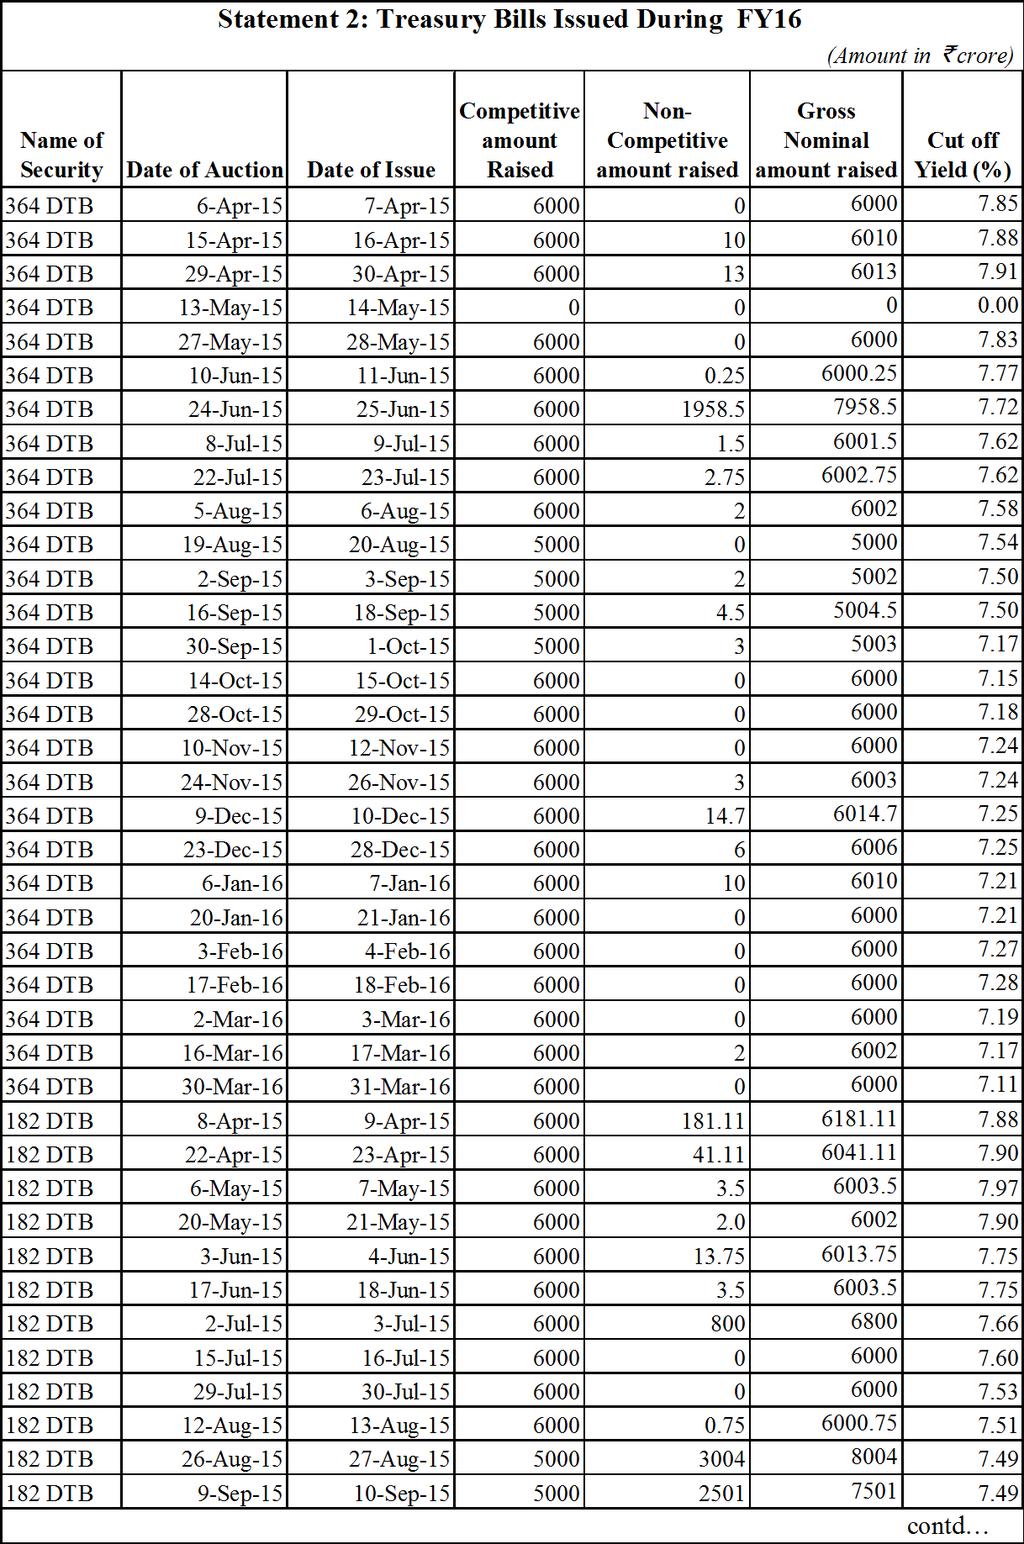
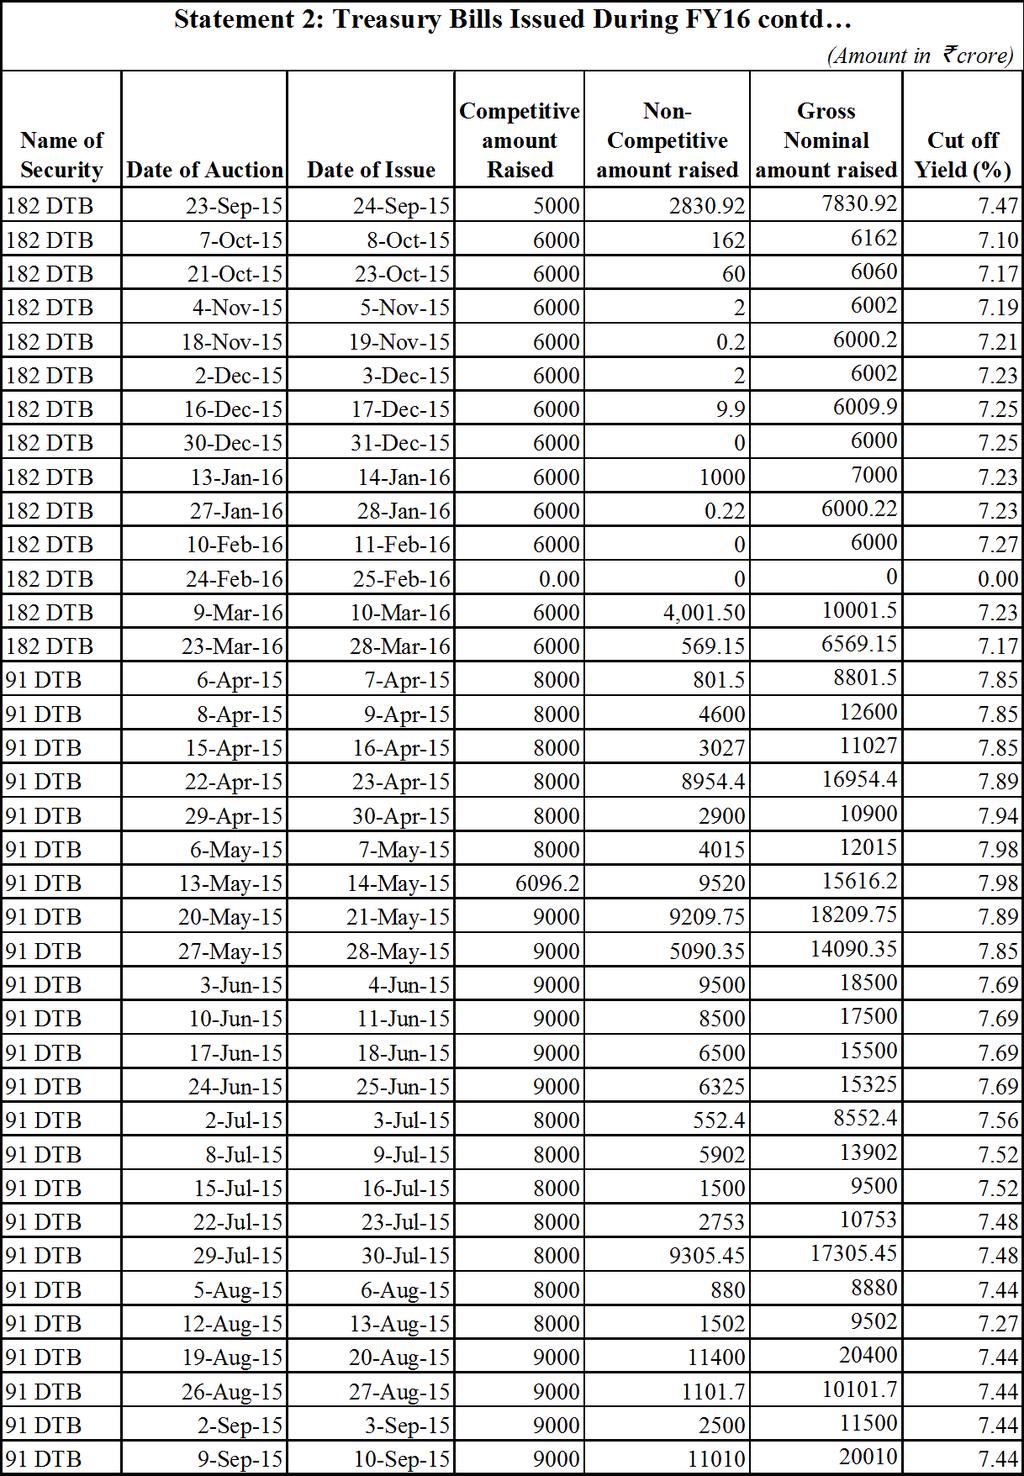
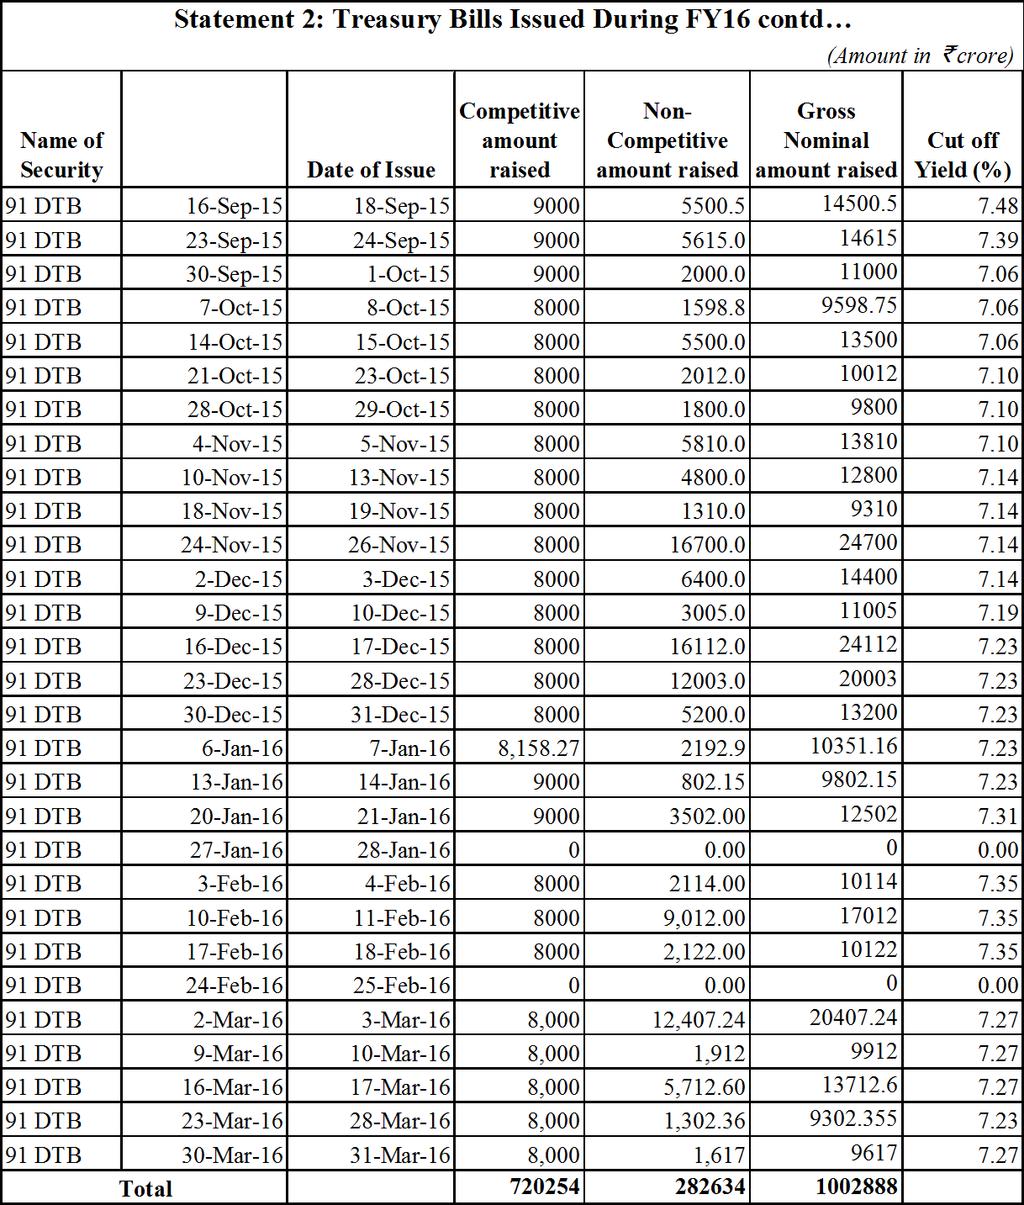
12 Table 3 Primary Issuance by Maturity Buckets, Q4 of FY (Amount in ` crore) 5-9 years years Years Years Total ,49,000 2,37,000 96,000 1,10,000 5,92,000 % of Total H1 FY16 63,000-87,000 1,53,000-72,000-96,000 72,000-96,000 3,60,000 % of Total H1 FY16 (Actual) 60, ,000 68, % of Total Q4 FY % of Total Q4 FY 16 (Actual) 14,000 41,000 14,000 15,000 84,000 % of Total H2 FY 16 32,000-48,000 1,06,000-48,000-64,000 48,000-64,000 2,34,000 % of Total H2 FY16 (Actual) % of Total FY ,35,000 2,59,000-1,20,000-1,20, % of Total FY , , , , ,000 % of Total The gross amount raised through treasury bills (91, 182 and 364 day treasury bills) during Q4 of FY 16 amounted to ` 2,10,438 crore while total repayments amounted to ` 2,71,391 crore resulting in net repayment of ` 60,954 crore compared with net repayment of ` 23,744 crore in Q4 of last year (Table 4). The details of issuance of bills during Q4 of FY16 are given in Statement 2. Table 4: Issuance of Treasury Bills* (Amount in ` crore) Item RE Q4 FY 16 FY 16 FY 15 FY 16 % of RE 364 DTB Gross Amount 154,033 42, , , Repayment 143,152 37, , , Net Issuance 10,881 5,008 10,881 6, DTB Gross Amount 171,954 35, , , Repayment 161,719 48, , , Net Issuance 10,235-12, DTB Gross Amount 730, , , , Repayment 682, , , , Net Issuance 47,550-53,396 3,893 3, All T-Bills Gross Amount 1,056, ,438 1,002, , Repayment 987, , , , Net Issuance 68,665-60,954 15,244 10, *:- Including amount through non-competitive route. 12
13 2.7 The weighted average maturity of primary issuance, stood at years, was kept long during this quarter. However, the weighted average maturity of issuance was lower than Q3 FY 2016 (16.72 years) due to market conditions. The weighted average yield (cut-off) of issuance during Q4 of FY16, was at 7.90 per cent as against 7.70 per cent in Q3 of FY16, reflecting some hardening in yields during the quarter. 13
 facility from the Reserve Bank and issuance of Cash")
14 Section 3 Cash Management 3.1 Government s cash account is maintained with RBI. The cash-flow mismatches of the Government are largely managed through issuance of Treasury Bills, access to the Ways and Means Advances (WMA) facility from the Reserve Bank and issuance of Cash Management Bills when in deficit and through auctions of its cash balance in market (through RBI) and buybacks of securities from market, when in surplus. The limits for Ways and Means Advances (WMA) for the second half of the financial year (October 2015-March 2016) was fixed at ` 20,000 crore. 3.2 Liquidity conditions in the economy remained tight further during the quarter (Chart 6). The liquidity deficit, as reflected by net borrowings from RBI under Liquidity Adjustment Facility (LAF) including marginal standing facility (MSF) during the quarter in January 2016 was at `1,38,266crore (average). However, the liquidity deficit increased subsequently in remaining quarter with an average deficit of `1,62,745 crore in February 2016 and `1,95,199 crore in March The average net borrowings under LAF during Q4 of FY at ` 1,65,403 crore was significantly higher than the average deficit of ` 76,724 crore in the previous quarter (Q3 of FY 15-16). On policy front, RBI in its Sixth bi-monthly monetary policy review on February2, 2016 maintained status quo on key policy rates with LAF repo rate at 6.75 %, LAF reverse repo rate at 5.75 %, and the MSF rate and the Bank Rate at 7.75 %. Source: Reserve Bank of India 3.3 The cash position of the Government during Q4 of FY15 was comfortable and remained in surplus mode during the quarter. The Net amount of Treasury Bills issued received through competitive route during the quarter decreased with net repayment of `17,841.73crore. The net amount of Treasury Bills received through non-competitive route during the quarter also decreased with repayment of `43, crore. Overall, the net amount mobilised through treasury bills (under competitive and non-competitive routes) 14
15 during Q4 of FY15 decreased leading to repayment of `60,953.57crore. Details of treasury bills issued and matured in Q4 of FY16 are given in Table 5. Table 5: Repayments and Issuance Treasury Bills in Jan - March 2016 (Amount in ` crore) Date of Issue Repayments Issued Amount Variation in Issued amount over 91 DTB 182 DTB 364 DTB 91 DTB 182 DTB 364 DTB Repayments 1-Jan , Jan Jan , Jan , Jan , Jan , Feb , Feb , , Feb , Feb , Feb , Mar , Mar , , Mar , Mar , Mar , , Mar ,000 6, Total Under Competitive Route Q4 104, , , , , , , Total Under Non-Competitive Route Q4 82, , , , , The calendar for issuance of treasury bills during April - June 2016 was announced on March 18, 2016, with gross borrowings at `1,95,000 crore (Statement 5). 15
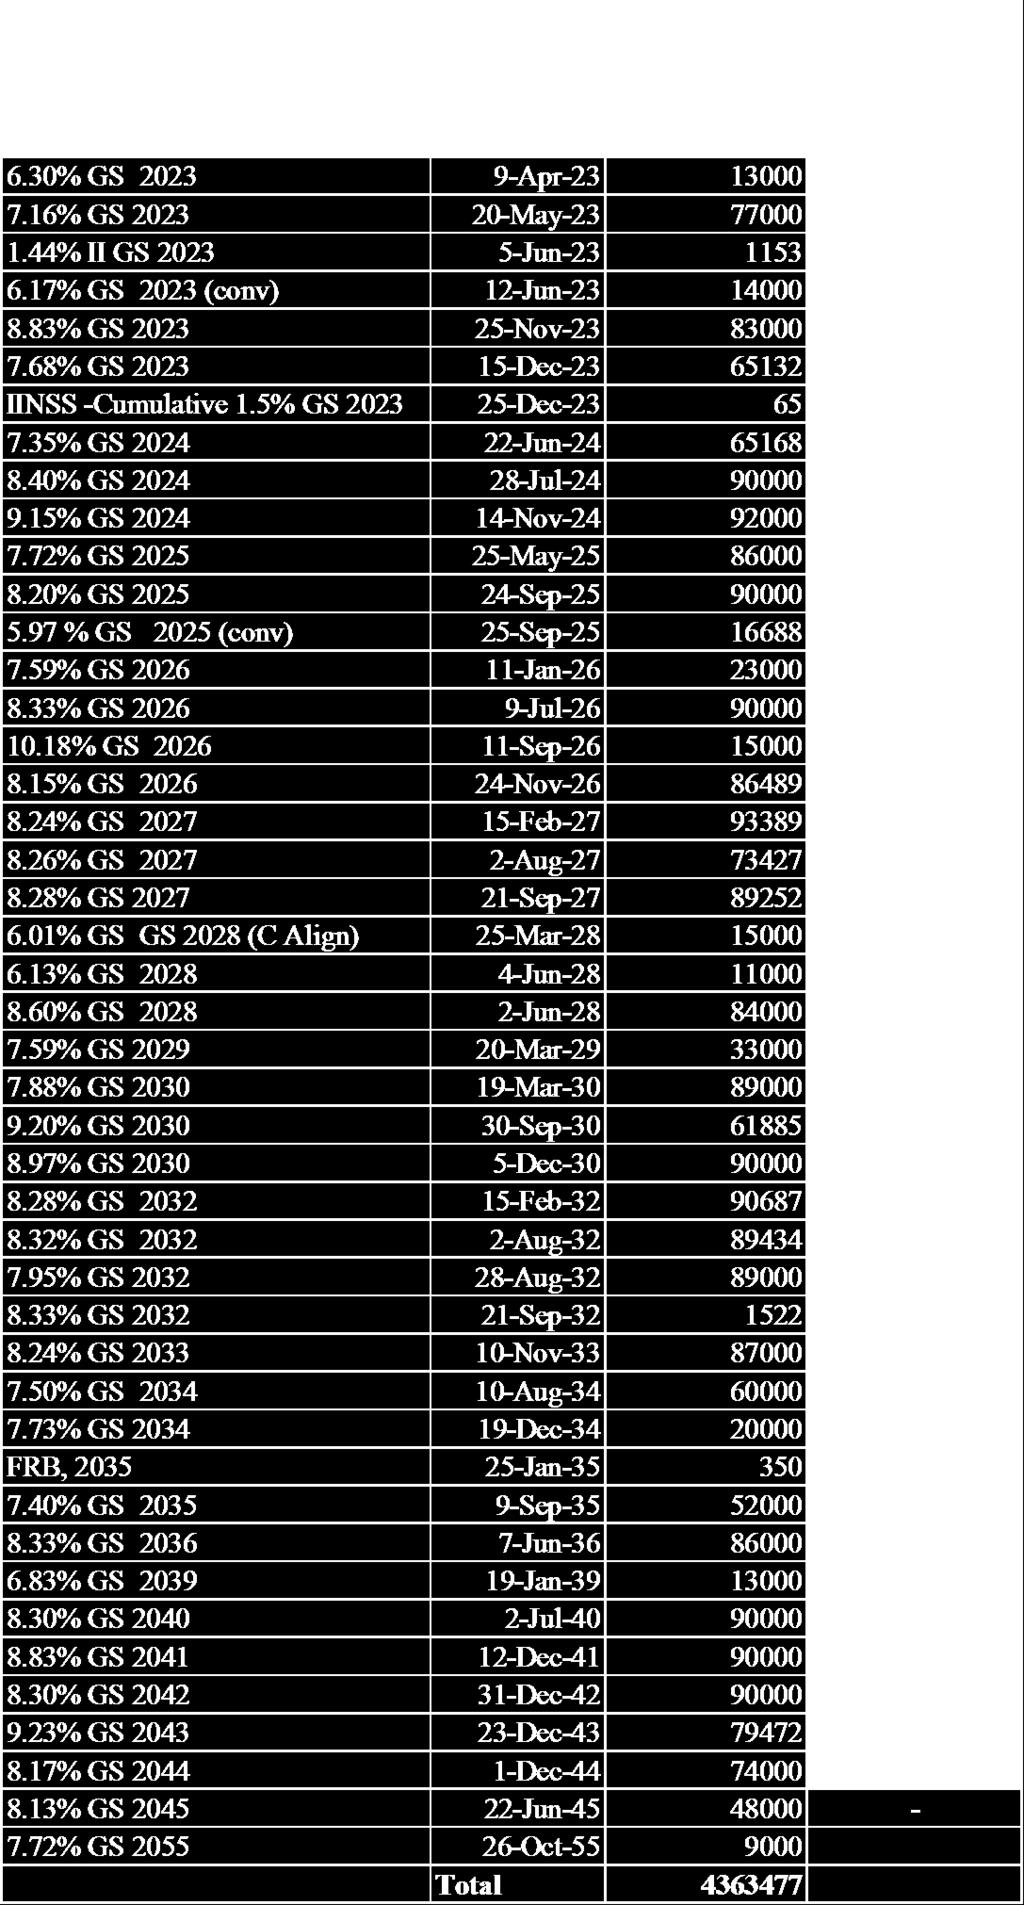
16 Section 4 - Trends in Outstanding Public Debt 4.1 The total public debt (excluding liabilities under the Public Account ) of the Government provisionally decreased marginally to `5,573,332 crore at end-march 2016 from `5,575,376 crore at end-december 2015 (Table 6). This represented a quarter-on-quarter (QoQ) decrease of 0.04 per cent (provisional) compared with an increase of 3.9 per cent in the previous quarter (Q 3 FY 16). Internal debt constituted 92.0 per cent of public debt, as compared with 92.3 per cent in the previous quarter. Marketable securities (consisting of Rupee denominated dated securities and treasury bills) accounted for 84.8 per cent of total public debt, as compared with 85.0 per cent as on end-december The outstanding internal debt of the Government at `5,130,179 crore constituted 37.8 per cent of GDP at end-march 2016 as compared with 38.7 per cent of GDP at end-december Table 6: Composition of Public Debt Item At end-mar 2016# At end- Dec 2015 At end-mar 2016# At end- Dec 2015 (` crore) (% of Total) Public Debt (1 + 2) 5,573, ,575, Internal Debt 5,130, ,146, Marketable 4,725, ,741, (a) Treasury Bills 362, , (i) Cash Management Bills (ii) 91-days Treasury Bills 136, , (iii) 182-days Treasury Bills 77, , (iv) 364-days Treasury Bills 148, , (b) Dated Securities 4,363, ,316, Non-marketable* 404, , (i) 14-days Treasury Bills* 59, , (ii) Securities Issued to NSSF* 266, , (iii) Compensation and other 34, , bonds* (iv) Securities issued to International Financial Institutions* 44, , (v) Ways and Means Advances* External Debt 443, , (i) Multilateral 294, , (ii) Bilateral 111, , (iii) IMF* 36, , (iv) Rupee debt #: Data are provisional. *These data are not available for Mar 31, So they are carried over from previous quarter. 16
17 Maturity Pattern for Outstanding Government Debt Stock 4.2 The weighted average maturity of outstanding stock of dated securities as at end-march 2016 decreased marginally to years from years at end-december Over the same period, the weighted average coupon of outstanding stock also decreased marginally to per cent from 8.08 per cent (Table 7). Table 7: Maturity and Yield of Central Government's Market Loans Issues during the year Outstanding Stock* Year Weighted Average Yield (%) Weighted Average Maturity (yrs) Weighted Average Coupon (%) Weighted Average Maturity (yrs) Q Q Q Q *As at end of period. 4.3 The proportion of debt (dated securities) maturing in less than one year increased to 4.0 per cent at end-march 2016 from 3.6 per cent a quarter ago. Proportion of debt maturing within 1-5 years stood lower at 22.9 per cent as against 24.7 per cent at end-december The proportion of outstanding debt maturing in less than 10 years was also lower at 56.4 per cent than 57.0 per cent a quarter ago, with corresponding increase in proportion of debt maturing in more than 10 years to 43.6 per cent at end-march 2016 from 43.0 per cent a quarter ago reflecting the continuing efforts of the Government to elongate the maturity profile of its debt portfolio for lower rollover risk. The change in composition of debt in terms of various maturity buckets reflects the maturity structure of securities issued during Q4 of FY16 as well as the maturity dynamics of outstanding securities. Overall, 26.9 per cent of outstanding stock has a residual maturity of up to 5 years, which implies that over the 17
18 next five years, on an average, 5.4 per cent of outstanding stock needs to be rolled over every year (Table 8). Thus, the rollover risk in the debt portfolio continues to be low. The implementation of budgeted buy back/ switches in coming quarters is expected to reduce roll over risk further. Holding Pattern Table 8: Maturity Profile of GoI Outstanding Dated Securities (Amount in ` crore) Maturity Buckets End-Mar 2016 End-Dec 2015 Less than 1 Year (4.0) (3.6) 1-5 Years (22.9) (24.7) 5-10 Years (29.6) (28.7) Years (30.3) (31.9) 20 Years and above (13.3) (11.1) Total 4,363, ,316,079.4 Note: 1. Figures in parentheses represent per cent to total. 4.4 The holding pattern of Government securities is available with a lag of a quarter; the latest data are available for end-december 2015 (Table 9 and Chart 7). Banks (including banks that are primary dealers and co-operative banks) continue to dominate as the major investor category with their share in holding of Government securities increase marginally to 46.3 per cent at end-dec 2015 as against 45.7 per cent as at end-sep Among the long-term investors, while the share of holding by insurance companies decreased marginally during the quarter to 21.9 per cent from 22.1 per cent at end-sep 2015, the share of FPIs, financial institutions and corporate marginally increased at end-december Proportion of securities held by the Reserve Bank at end-december 2015 remained almost same at 12.1 per cent than a quarter ago. 18
19 Table 9: Ownership Pattern of Government of India Dated Securities (Per cent of Outstanding Securities) Category Sep. Dec. Mar. June Sep. Dec. 1. Commercial Banks Non-Bank PDs Insurance Companies Mutual Funds Co-operative Banks Financial Institutions Corporate FPIs Provident Funds RBI Others Total Source: RBI Bulletin, Volume LXX No. 4, April 2016 Note: The holdings of RBI have been revised since December 2014, based on the revised liquidity management. RBI does not subscribe to primary auctions of GoI for securities. Chart 7: Holding Pattern of Oustanding G-securities (Dec-15 : outer ring; Sep-15 : inner ring] 4.5 Commercial Banks Non-Bank PDs Insurance Companies Mutual Funds Co-operative Banks Financial Institutions Corporates FPIs Provident Funds RBI Others 19
20 Section 5 Secondary Market A. Government security yields 5.1 Chart 8 depicts the movement in Government bond yields (10-year yield as benchmark) during the quarter. Yields witnessed significant intra-quarter movements. G-Sec market opened the quarter on weak note tracking the depreciating domestic currency and local equity market. Announcement on auction of new 10yr G-sec, RBI governor s statement in January at the World Economic Forum 2016 at Davos that Global disinflation is opening up room for policy action and expectations of fresh FPI purchases on account of opening of quarterly limits rendered some positive bias to the market. However, global growth concerns led by concerns on China s growth, fall in expected investments due to 13 year low crude prices, falling Yuan, turbulent market conditions, etc., kept the market sentiment nervous in January The hawkish reference by RBI Governor to the 7th Pay commission, in its Sixth Bi-monthly monetary policy statement on February 2, 2016, the higher than expected inflation figures in February, hardening bias in US Treasuries towards latter half of February, continuing rupee depreciation to touch fresh lows since September 2013, higher borrowings of states, uncertainties over issuance of UDAYA bonds, etc., adversely affected the market sentiment in February and 10-year yield touched a high of 7.85 %, general levels last seen in June Since February end, the market reversed its direction and gained significantly. It started with the announcement of Government s adherence to its target of Fiscal deficit of 3.5% in FY 17 and 3.9% in FY16, while presenting Union Budget The budgeted Gross Borrowings for FY17 at ` 6 lakh crores were lower than market expectations. In Mid-March, releases of both CPI and WPI numbers were also lower than market expectations. The market was further supported by the US FOMC meeting, which adopted a dovish stance holding its key rates steady. The more clarity on UDAYA bonds and permission for its private placement and to treat UDAYA bonds in HTM beyond existing limit of 21.5 percent for the banks also supported the market. A pick up in crude prices helped easing pressure due to global risk perspective. In March second half, the government announced reduced savings deposit rates, by bps across maturities with a provision to reset these rates quarterly. This reignited market activity and hopes for immediate RBI rate cut. All the factors together 20
21 resulted in the 10 Yr benchmark paper closing the quarter at 7.46%, lowest yield level since July Ten year benchmark yield closed at 7.46 on March 31, 2016 as against 7.69 on December 31, 2015 after trading between 7.85 and 7.46 during the quarter. Source: FIMMDA 5.2 Due to reasons mentioned above, yields moderated across the curve during the quarter compared to the previous quarter with 10 yr segment gaining the most. The 1yr- 10yr spread decreased to 25 bps at end-march 2016 from 49 bps at end-december 2015, while 10yr-30yr spread increased to 49 bps from 24 bps over the same period. Overall, 1yr- 30yr spread at end of Q4 of FY16 increased marginally to 74 bps from 73 bps at the end of the previous quarter (Chart 9). Source: FIMMDA 21
22 5.3 Due to reasons mentioned above, Treasury Bills yields also saw some decline across the curve during the quarter as compared to previous quarter with 91, 182 and 364 day yields moderating by 2, 11 and 16 bps respectively. The 1m-12m spread was down to 7 bps at end March 2016 as compared with 17 bps at end December The 1m-3m spread was up at 13 bps from 9 bps as at previous quarter end, while 3m-6m spread contracted to (-) 3 bps at March 2016 end from 6 bps as at previous quarter end (Chart 10). Source: FIMMDA B. Trading Pattern for domestic securities 5.4 The total volume of Government securities transacted on an outright basis during Q4 of FY15-16 stood at ` lakh crore, an increase of per cent over volume of ` lakh crores during the preceding quarter (Table 10). G-Secs, showing an increase of per cent, mainly contributed to the increase in trading activity during the quarter. The annualised outright turnover ratio 1 for Central Government dated securities (G-Secs) for Q3 of FY15-16 increased to 4.18 from 3.64 during Q3 of FY Including repo transactions, the annualised total turnover ratio 2 for Q4 of FY increased to from 9.76 during Q3 of FY Annualised Outright Turnover Ratio = 4*[Quarterly Outright Volume *2/(Average of outstanding stock)] 2 Annualised Total Turnover Ratio = 4* [(Quarterly Outright Volume *2 + Quarterly Repo Volume * 4) / (Average of outstanding stock)] 22


23 Table 10 : Transactions in Government Securities (volumes in ` Crore) Period Outright Repo G-Sec T-Bills SDL Total G-Sec T-Bills SDL Total Apr-Jun July-Sep Oct-Dec Jan-Mar Apr-Jun July-Sep Oct -Dec Jan-Mar Source: CCIL 5.5 Central Government dated securities continued to account for a dominant portion of total trading volumes (Chart 11a and 11b). During Q4 of FY15-16, their share stood at per cent of total outright volumes as compared to per cent in Q3 of FY Central government securities accounted for per cent of the total repo volumes during Q4 of FY15-16 as compared to 75.0 per cent in Q3 of FY Source: CCIL 23
24 5.6 The top 10 traded securities accounted for per cent of the total outright transaction volume during the quarter as compared with per cent during Q3 of FY The share of top three traded securities decreased to per cent from per cent during Q3 of FY15-16 (Table 11). Table 11 - Top 10 Traded Securities (in ` Crore) Security Jan Mar 16 Security Oct-Dec G.S ,99, G.S ,95, G.S ,26, G.S ,18, G.S , G.S ,91, G.S ,68, G.S ,37, G.S ,29, G.S , G.S ,46, G.S , G.S , G.S , G.S , G.S , G.S , G.S , G.S , G.S ,357 Source: CCIL 5.7 The trend in outright trading volumes in Government securities under different maturity buckets is given in Table 12. Source: CCIL Table 12: Maturity-wise outright trading volumes in G-sec. (in `Crore) Maturity/ Jan-Mar Oct-Dec Jul-Sep Apr-Jun Jan-Mar Quarter Less than 3 Years Years Years above 10 Years Total The maturity distribution of Government securities transactions in the secondary market is represented in Chart 12a and 12b. Trading was more distributed during the quarter vis-à-vis previous quarter. Reflecting the increased trading activity in 10-year benchmark securities, while share of 10 years and above maturity range increased and accounted for the highest share of trading volumes during Q4 of FY15-16 (33.63 per cent, 24

25 higher than per cent in Q3 of FY15-16) share of 7-10 years maturity range was lowered to percent from percent in previous quarter. The below 3 years maturity bracket continued to had lowest share of trading volume at 3.75 per cent. Share of 3-7 years maturity range saw highest increase from percent to percent during the quarter. 5.9 Foreign banks continued to be the dominant trading category during the quarter with their share in total outright trading activity, and it increased to 31.1 per cent (of total trading volumes) from 28.4 per cent during Q3 of FY 15-16(Chart 13). Public sector banks share decreased to 21.8 percent during the quarter from 23.9 per cent in the last quarter. `Others' category comprising of FIs, Insurance Cos and Others were the largest net buyer (` 29,355 crore) in secondary market during the quarter, followed by Public Sector Banks (` 27,625 crore). Mutual Funds (excluding primary dealers)were largest net sellers category in secondary market (` 25, 725 crore) during the quarter, followed by Foreign Banks (` 1,136 crore). 25

26 Table 13: Category wise - Buying and Selling (% of total ) Jan- Mar 2016 Oct-Dec 2015 July-Sept 2015 Apr - Jun 2015 Jan-Mar 2015 Oct-Dec 2014 July-Sept 2014 Buy Sell Buy Sell Buy Sell Buy Sell Buy Sell Buy Sell Buy Sell Co-operative Banks FIs Foreign Banks Ins. Cos Mutual Funds Primary Dealers Pvt. Sector Banks Pub. Sector Banks Others Total Quarterly share of various categories/participants in the secondary market trading activity (buy + sell) for government securities is shown in Table
27 27

28 i

29 ii


30 iii

31 iv
32 v
33 vi
34 vii
35 viii
36 ix
37 x

38 xi
PUBLIC DEBT MANAGEMENT QUARTERLY REPORT JANUARY-MARCH 2018
 PUBLIC DEBT MANAGEMENT QUARTERLY REPORT JANUARY-MARCH 2018 GOVERNMENT OF INDIA MINISTRY OF FINANCE BUDGET DIVISION DEPARTMENT OF ECONOMIC AFFAIRS JUNE 2018 www.dea.gov.in ii CONTENTS Section Page No. Introduction
Public Debt Management
 Public Debt Management quarterly report JULY SEPTEMBER 2017 Government of India Ministry of finance Budget Division Department of economic affairs NOVEMBER 2017 www.finmin.nic.in I CONTENTS Section Page
Indian Economy. GDP growth slowed down but remained above the comfortable 7% Manufacturing GVAbp
 Indian Economy Economic Growth GDP growth slowed down but remained above the comfortable 7% Domestic economy witnessed 7.1% GDP growth during the first quarter (Apr - Jun) of fiscal 2016-17 (Q1FY17) as
Market Roundup. Macro-Economic Overview. Domestic Macroeconomic Development
 Market Roundup Domestic Macroeconomic Development The Monetary Policy Committee (MPC), in its bi-monthly Monetary Policy meeting in June, decided to increase the repo rate for the first time since January
RBI s Sixth Bi-Monthly Monetary Policy Review ( ) Maintains status quo...neutral Stance
 Maintains status quo...neutral Stance") 7h February 2018 RBI s Sixth Bi-Monthly Monetary Policy Review (2017-18) Maintains status quo...neutral Stance Repo Rate unchanged at Reverse Repo Rate stands at 5.75% Marginal Standing Facility and Bank
7h February 2018 RBI s Sixth Bi-Monthly Monetary Policy Review (2017-18) Maintains status quo...neutral Stance Repo Rate unchanged at Reverse Repo Rate stands at 5.75% Marginal Standing Facility and Bank
MONTHLY ECONOMIC BULLETIN
 MONTHLY ECONOMIC BULLETIN Janu uary 2015,, Volume 1, Issue 3 Vanijya Bhavan (1st Floor) International Trade Facilitation Centre 1/1 Wood Street Kolkata - 700016 http://www.eepcindia.org E E PC India Page
Mid-Quarter Monetary Policy Review
 18 December, 2013 Mid-Quarter Monetary Policy Review RBI maintained status quo in the mid-quarter monetary policy meeting held today preferring to wait and watch for more forthcoming macro-economic data
August 1, 2017 I Economics EXPECTATIONS FROM CREDIT POLICY: AUGUST 2017
 EXPECTATIONS FROM CREDIT POLICY: AUGUST 2017 August 1, 2017 I Economics The third bi-monthly monetary policy review for this fiscal year is to be announced by the RBI on 2nd August 2017. It will be sixth
MONTHLY ECONOMIC BULLETIN
 MONTHLY ECONOMIC BULLETIN Febru ruary 2015,, Volume 1, Issue 4 Vanijya Bhavan (1st Floor) International Trade Facilitation Centre 1/1 Wood Street Kolkata - 700016 http://www.eepcindia.org E E PC India
Amount raised from Primary Market. Turnover in Secondary Market
 ISMR Debt Market 64 5. Debt Market Introduction The debt market in India consists of mainly two categories the government securities or the g-sec markets comprising central government and state government
III. MONETARY AND LIQUIDITY CONDITIONS
 III. MONETARY AND LIQUIDITY CONDITIONS Monetary and liquidity aggregates continued to expand at a strong pace during 2007-08, albeit with some moderation, reflecting large and persistent capital flows.
Sri Lanka: Recent Economic Trends. January 2018
 Sri Lanka: Recent Economic Trends January 2018 1 Agenda Summary Economic Growth Inflation and Monetary Policy External Account Fiscal Scenario of Government of Sri Lanka ICRA Lanka Limited 2 2 Agenda Summary
Fixed Income Update October 2015
 Month Overview Average Liquidity Support by RBI Rs -5,527 Cr. Includes: LAF, MSF, SLF & Term Repo Bank Credit Growth Money Market Bank Deposit Growth 9.6% 11.6% Change in basis points Tenure CD Change
Indian Economy. Industrial output grew highest in four months in June 2015 but volatility continued
 Indian Economy Industrial Production Industrial output grew highest in four months in June 2015 but volatility continued After a slowdown in May 2015, industrial production grew by 3.8% during the month
Market Outlook. Nifty % Sensex %
 Market Outlook 22000 BSE NSE 6500 Key Indices 30-Apr-13 31-Mar-13 % Change 21000 20000 19000 18000 17000 16000 15000 6000 5500 5000 4500 4000 3500 Nifty 5930.20 5682.55 4.36% Sensex 19504.18 18835.77 3.55%
Asia Bond Monitor November 2018
 January 9 asianbondsonline.adb.org Key Developments in Asian Local Currency Markets L ast week, the Philippines raised USD. billion from the sale of -year global bonds priced at basis points above benchmark
MONTHLY ECONOMIC REPORT MARCH 2013 HIGHLIGHTS
 Ministry of Finance Department of Economic Affairs Economic Division 4(3)/Ec. Dn. /2012 MONTHLY ECONOMIC REPORT MARCH 2013 HIGHLIGHTS The overall growth of GDP at factor cost at constant prices, as per
RBI's Annual Monetary Policy
 Amol Agrawal amol@stcipd.com +91-22-66202234 RBI's Annual Monetary Policy 2012-13 In Annual Monetary Policy 2012-13, RBI surprised markets by easing Repo rate by 50 bps to 8%. The consensus market expectations
RBI s Monetary Policy Q : Expectations
 RBI s Monetary Policy Q2 2012-13: Expectations RBI s Monetary Policy for Second Quarter 2012-13 is scheduled to be announced on 30-Oct- 12. The market expectations are once again divided over rate cut
MONETARY POLICY OUTLOOK- THE FIFTH BI-MONTHLY MONETARY POLICY REVIEW OF THE CURRENT FINANCIAL YEAR DECEMBER-MARCH
 MONETARY POLICY OUTLOOK- THE FIFTH BI-MONTHLY MONETARY POLICY REVIEW OF THE CURRENT FINANCIAL YEAR DECEMBER-MARCH 2018-19 Dr. Arun Kumar Misra, Associate Professor, Finance & Accounts, VGSOM, IIT Kharagpur
Wholesale Debt Market Segment 5
 Wholesale Debt Market Segment 5 60 Wholesale Debt Market Segment 5 The Exchange started its trading operations in June 1994 by enabling the Wholesale Debt Market (WDM) segment of the Exchange. This segment
Amount raised from Primary Market. Turnover in Secondary Market
 ISMR Debt Market 70 5. Debt Market Introduction 1 The debt market in India consists of mainly two categories the government securities or the g-sec markets comprising central government and state government
4(8)/Ec. Dn. /2017 Ministry of Finance Department of Economic Affairs Economic Division MONTHLY ECONOMIC REPORT JUNE 2018 ***** HIGHLIGHTS
/Ec. Dn. /2017 Ministry of Finance Department of Economic Affairs Economic Division MONTHLY ECONOMIC REPORT JUNE 2018 ***** HIGHLIGHTS") 4(8)/Ec. Dn. /2017 Ministry of Finance Department of Economic Affairs Economic Division MONTHLY ECONOMIC REPORT JUNE 2018 ***** HIGHLIGHTS The growth of GDP at constant prices for the fourth quarter of
4(8)/Ec. Dn. /2017 Ministry of Finance Department of Economic Affairs Economic Division MONTHLY ECONOMIC REPORT JUNE 2018 ***** HIGHLIGHTS The growth of GDP at constant prices for the fourth quarter of
REFERENCE NOTE. No. 28/RN/Ref./November /2013
 LOK SABHA SECRETARIAT PARLIAMENT LIBRARY AND REFERENCE, RESEARCH, DOCUMENTATION AND INFORMATION SERVICE (LARRDIS) MEMBERS REFERENCE SERVICE REFERENCE NOTE. No. 28/RN/Ref./November /2013 For the use of
Wholesale Debt Market Segment 5
 Wholesale Debt Market Segment 5 64 Wholesale Debt Market Segment 5 The Exchange started its trading operations in June 1994 by enabling the Wholesale Debt Market (WDM) segment of the Exchange. This segment
Indian Economy. Industrial production declined in Nov 2015 for the first time in last 13 months. Fig1: Industrial Output Growth from April 2014
 Indian Economy Industrial Production Industrial production declined in Nov 2015 for the first time in last 13 months Industrial growth dropped to negative in Nov 2015 after 12 successive months of increase,
Ministry of Finance Department of Economic Affairs Economic Division 4(8)/Ec. Dn. /2017 MONTHLY ECONOMIC REPORT OCTOBER 2017 *****
/Ec. Dn. /2017 MONTHLY ECONOMIC REPORT OCTOBER 2017 *****") Ministry of Finance Department of Economic Affairs Economic Division 4(8)/Ec. Dn. /2017 MONTHLY ECONOMIC REPORT OCTOBER 2017 ***** HIGHLIGHTS The growth rate of Gross Domestic Product (GDP) at constant
Ministry of Finance Department of Economic Affairs Economic Division 4(8)/Ec. Dn. /2017 MONTHLY ECONOMIC REPORT OCTOBER 2017 ***** HIGHLIGHTS The growth rate of Gross Domestic Product (GDP) at constant
MONTHLY UPDATE SEPTEMBER 2017
 MONTHLY UPDATE SEPTEMBER 2017 September 2017 "I am a better investor because I am a businessman and a better businessman because I am an investor. - Warren Buffett Equity Markets Indices 31 st Aug 2017
MONTHLY UPDATE NOVEMBER 2018
 MONTHLY UPDATE NOVEMBER 2018 November 2018 A champion is defined not by their wins but by how they can recover when they fall. Equity markets - Serena Williams Indices 31 st Oct 2018 30 th Nov 2018 1 Month
Asia Bond Monitor November 2015
 1 February 16 asianbondsonline.adb.org Key Developments in Asian Local Currency Markets Bangko Sentral ng Pilipinas (BSP) decided on 11 February to keep unchanged the overnight borrowing rate at.% and
Valentyn Povroznyuk, Radu Mihai Balan, Edilberto L. Segura
 September 214 GDP grew by 1.2% yoy in Q2 214. Industrial output growth was equal to 1.4% yoy in June 214. The consolidated budget deficit narrowed to.2% of GDP in January-July 214. Consumer inflation slightly
Balance of Payment Q3 FY (October-December 2012)
") Balance of Payment Q3 FY2012-13 (October-December 2012) Key Highlights: - India s Current Account Deficit (CAD) widened to a record high of 6.7% of GDP in Q3 FY2012-13 on the back of surging oil and gold
Balance of Payment Q3 FY2012-13 (October-December 2012) Key Highlights: - India s Current Account Deficit (CAD) widened to a record high of 6.7% of GDP in Q3 FY2012-13 on the back of surging oil and gold
STCI Primary Dealer Ltd
 Macroeconomic Update: CPI, WPI and IIP Headline CPI inflation for July-18 stood at 4.17%, 75bps lower compared to previous month mainly due to favorable base effect. Retail inflation print for June-18
STCI Primary Dealer Ltd
 Macroeconomic Update: GDP Q3 FY14, Fiscal Balance & Core Sector Highlights: GDP for Q3 FY14 came in at 4.7% compared to downwardly revised 4.4% in Q3 FY13. Agriculture GDP grew less than anticipated at
The real change in private inventories added 0.15 percentage points to the second quarter GDP growth, after subtracting 0.65% in the first quarter.
 QIRGRETA Monthly Macroeconomic Commentary United States The U.S. economy rebounded in the second quarter of 2007, growing at an annual rate of 3.4% Q/Q (+1.8% Y/Y), according to the GDP advance estimates
Reviewing Macro-economic Developments and Understanding Macro-Economic Policy
 MINISTRY OF FINANCE GOVERNMENT OF INDIA Reviewing Macro-economic Developments and Understanding Macro-Economic Policy Module 5 Contemporary Themes in India s Economic Development and the Economic Survey
MONETARY POLICY COMMITTEE STATEMENT FOR THIRD QUARTER Governor s Presentation to the Media. 22 nd November, 2017
 1 MONETARY POLICY COMMITTEE STATEMENT FOR THIRD QUARTER 2017 Governor s Presentation to the Media 22 nd November, 2017 INTRODUCTION 2 The presentation is structured as follows: 1. Decision of the Monetary
Figure 5.1: 6-month Yields Auction cut-off Repo rate percent Sep-03
 5 Money Market Third Quarterly Report for FY4 After the reversal of the December 23 upsurge in short-term rates, the market entered a period of relative stability. While it continued to expect a modest
3rd Bi-Monthly Monetary Policy Review, Kotak Mutual Fund Update as on 9 th August
 3rd Bi-Monthly Monetary Policy Review, 2016-17 Kotak Mutual Fund Update as on 9 th August 2016 1 Monetary Measures: Key Rates Measures CRR Unchanged at 4.00% Reverse Repo rate Unchanged at 6.00% (affixed
VI. THE EXTERNAL ECONOMY
 VI. THE EXTERNAL ECONOMY India s external sector has continued to register robust performance during 2006-07 so far. Merchandise exports have exhibited strong growth, notwithstanding some deceleration.
STCI Primary Dealer Ltd
 Macroeconomic Update: GDP and Fiscal Balance Highlights: GDP: Q1 FY15 Growth for first quarter of the year jumped to nine quarter high of 5.7% as against 4.6% in the previous quarter. The surge in overall
(Narendra Jena) Economic Officer
 Economic Officer") Ministry of Finance Department of Economic Affairs Economic Division 4(3)/Ec. Dn. /2012 MONTHLY ECONOMIC REPORT DECEMBER 2016 ***** HIGHLIGHTS As per the first revised estimates of national income, consumption
Ministry of Finance Department of Economic Affairs Economic Division 4(3)/Ec. Dn. /2012 MONTHLY ECONOMIC REPORT DECEMBER 2016 ***** HIGHLIGHTS As per the first revised estimates of national income, consumption
Major Highlights. Recent Economic Developments. September/October,2016. Central Bank of Swaziland 1
 September/October,20 Major Highlights The country s headline inflation increased to 8.3 per cent in Septmber 20 from 8.0 per cent in August 20. Inflation rate (% y/y) 8.3 (Sep) Discount and prime rates
Monetary Policy Review Premature end to the easing cycle?
 The monetary policy committee (MPC) maintained status quo for the second policy review running, keeping Repo rate at 6.25%, contrary to market expectations of 25bps cut. Consequently, the reverse repo/msf
5 Domestic and External Debt
 flows in billion Rs FY11 FY12 FY13 FY14 FY15 FY16 FY17 percent of GDP 5 Domestic and External Debt 5.1 Overview Gross public debt-to-gdp ratio improved marginally to 67.2 percent by end-june 217 from 67.6
1. Macroeconomic Highlights
 1. Macroeconomic Highlights ht Macroeconomic Highlights Resilient growth over the last 2 years, despite the global economic slowdown Banking industry robust with high level of CAR and low NPLN. In 2008
CANARA ROBECO MEDIUM TERM OPPORTUNITIES FUND FEBRUARY 2018
 CANARA ROBECO MEDIUM TERM OPPORTUNITIES FUND FEBRUARY 2018 This product is suitable for investors who are seeking* Income/Capital appreciation over medium to long-term Investment in Debt and Money Market
MONTHLY ECONOMIC REPORT MARCH 2014
 Ministry of Finance Department of Economic Affairs Economic Division 4(3)/Ec. Dn. /2012 MONTHLY ECONOMIC REPORT MARCH 2014 HIGHLIGHTS The growth of GDP at factor cost at constant (2004-05) prices (real
RBI's Monetary Policy Q : Review
 Amol Agrawal amol@stcipd.com +91-22-66202234 RBI's Monetary Policy Q1 2012-13: Review In First Quarter Review of Monetary Policy 2012-13, RBI kept policy rates unchanged. The policy decision is in line
STCI Primary Dealer Ltd
 Macroeconomic Update: GDP Q3 FY18 Beating expectations, India s Real GDP noted a sharp rebound, coming in at 7.2% for Q3 FY18, higher than the revised estimate of 6.5% witnessed in the previous quarter.
Asia Bond Monitor March 2015
 June 1 asianbondsonline.adb.org Key Developments in Asian Local Currency Markets Consumer price inflation in Malaysia accelerated to.1% year-on-year (y-o-y) in May from 1.8% y-o-y in April, mainly due
MONETARY POLICY COMMITTEE STATEMENT FOR FIRST QUARTER Governor s Presentation to the Media. 16 th May, 2018
 1 MONETARY POLICY COMMITTEE STATEMENT FOR FIRST QUARTER 2018 Governor s Presentation to the Media 16 th May, 2018 INTRODUCTION 2 The presentation is structured as follows: 1. Decision of the Monetary Policy
PRESENTATION BY PROF. E. TUMUSIIME-MUTEBILE, GOVERNOR, BANK OF UGANDA, TO THE NRM RETREAT, KYANKWANZI, JANUARY
 BANK OF UGANDA PRESENTATION BY PROF. E. TUMUSIIME-MUTEBILE, GOVERNOR, BANK OF UGANDA, TO THE NRM RETREAT, KYANKWANZI, JANUARY 19, 2012 MACROECONOMIC MANAGEMENT IN TURBULENT TIMES Introduction I want to
CENTRAL BANK OF OMAN. Mid-Year Review of the Omani Economy 2010
 CENTRAL BANK OF OMAN Mid-Year Review of the Omani Economy 2010 December 2010 CENTRAL BANK OF OMAN Mid-Year Review of the Omani Economy 2010 Economic Research and Statistics Department CONTENTS Page Foreword
Government Cash Balances - Linkages with Liquidity
 Amol Agrawal amol@stcipd.com +91-22-6622234 Government Cash Balances - Linkages with Liquidity We have been releasing reports in the nature of primers on RBI s operations and accounts (Refer Guide to Weekly
Economic activity gathers pace
 Produced by the Economic Research Unit October 2014 A quarterly analysis of trends in the Irish economy Economic activity gathers pace Positive data flow Recovery broadening out GDP growth revised up to
November 21, Economic Intelligence Unit Baroda Corporate Center Bank of Baroda Mumbai Indian Economic Briefs
 Economic Intelligence Unit Baroda Corporate Center Bank of Baroda Mumbai eiu.bcc@bankofbaroda.com November 21, 2015 Weekly Macro Perspectives --------------------------------------------------------------------------------------------------------------------------------------
STCI Primary Dealer Ltd
 Impact of SLR cut on G-Sec appetite December 30, 2010 Meghna Patel meghna@stcipd.com 022 66202229 The financial year 2010-11 has been a year of steady transformations for the bond market. Transformations
BANKING SECTOR PERFORMANCE STUDY H1FY14
 BANKING SECTOR PERFORMANCE STUDY H1FY14 Our study covers 39 banks 26 Public Sector Banks & 13 Private Sector Banks. Banking December 11, 2013 Foreword As per the Central Statistical Organization (CSO)
STCI Primary Dealer Ltd
 Revisions in India s GDP With MOSPI revising India s GDP estimate to 7.4% for FY15 followed by 6.9% in FY14 and 5.1% in FY13, policymakers are confronted with another conundrum with regards to growth prospects
WHAT'S NEW. International Developments. The Bank of Canada raised its key interest rate by 25 basis points to 1.25%.
 International Developments The Bank of Canada raised its key interest rate by 25 basis points to 1.25%. The Bank of Japan boosted its bond buying plan and reassured markets that monetary policy will remain
Markets at a Glance. India Q2 CY For Distributors use only
 Markets at a Glance India Q CY 17 For Distributors use only India Macro Economy Trade Inflation Monetary Sector Valuations Liquidity Macro Economy GDP Emerging vs Developed (In % YoY) Credit Growth vs
Asia Bond Monitor November 2018
 7 December 8 Key Developments in Asian Local Currency Markets T he monetary board of the Bangko Sentral ng Pilipinas decided to keep its key policy rates steady during its final meeting for the year on
Monetary Policy in India
 Monetary Policy in India Deepak Mohanty Executive Director Reserve Bank of India September 16, 2013 1 I. Objective(s) An Outline II. III. IV. Policy Framework Operating Procedure Outcome V. Conclusion
Indian Economy. Industrial production slowed down in June 2016 on a year-on-year basis
 Indian Economy Industrial Production Industrial production slowed down in June 2016 on a year-on-year basis Despite a rise in industrial production growth to 2.1% in June 2016 from 1.1% (revised downward
Results of the Survey of Professional Forecasters on Macroeconomic Indicators Round 44 1
 Results of the Survey of Professional Forecasters on Macroeconomic Indicators Round 44 1 In the 44 th round of the Survey of Professional Forecasters, output growth for 2016-17 measured by gross value
II. FISCAL SITUATION
 II. FISCAL SITUATION Combined Government Finances: 2006-07 With the resumption of fiscal consolidation process at the Centre in terms of the Fiscal Responsibility and Budget Management (FRBM) Rules, 2004
PERFORMANCE OF THE ECONOMY REPORT NOVEMBER 2017
 PERFORMANCE OF THE ECONOMY REPORT NOVEMBER 2017 MACROECONOMIC POLICY DEPARTMENT MINISTRY OF FINANCE, PLANNING AND ECONOMIC DEVELOPMENT www.finance.go.ug Table of Contents SUMMARY... 2 REAL SECTOR DEVELOPMENTS...
RBI Q1 FY11 Monetary Policy Review
 RBI Q1 FY11 Monetary Policy Review The Policy Measures In Brief In its First Quarter Review of the Annual Monetary Policy for 2010-11, the Reserve Bank of India increased its policy rates with immediate
AsianBondsOnline WEEKLY DEBT HIGHLIGHTS
 AsianBondsOnline WEEKLY 9 January 7 asianbondsonline.adb.org Key Developments in Asian Local Currency Markets Consumer price inflation in Indonesia eased to.% year-on-year (y-o-y) in December from.6% y-o-y
ACUMEN. Life of CPI. Three Year Average Inflation
 Life of CPI Monetary policy in India has shifted decisively to using the Consumer Price Index (CPI) based inflation rather than Wholesale Price inflation since September 2013. We look at the history of
Economic Outlook Survey. January 2017
 January 2017 GDP growth estimated at 6.8% in 2016-17: FICCI s Economic Outlook Survey HIGHLIGHTS GDP growth for FY 17 estimated at 6.8% The latest round of FICCI s Economic Outlook Survey puts forth an
RBI s Q Monetary Policy: Expectations
 Amol Agrawal amol@stcipd.com +91-22-66202234 RBI s Q2 2011-12 Monetary Policy: Expectations RBI is scheduled to announce its second quarter 2011-12 monetary policy review on October 25, 2011. We expect
IGI Life. Funds Performance Report January IGI Life Insurance Limited
 IGI Life Funds Performance Report January 2019 IGI Life Insurance Limited July 2015 Macro Review and Outlook: Headline inflation at +7.2% above market consensus CPI Inflation On the domestic macroeconomic
Ministry of Finance Department of Economic Affairs Economic Division 4(3)/Ec. Dn. /2012 MONTHLY ECONOMIC REPORT NOVEMER 2016 ***** HIGHLIGHTS
/Ec. Dn. /2012 MONTHLY ECONOMIC REPORT NOVEMER 2016 ***** HIGHLIGHTS") Ministry of Finance Department of Economic Affairs Economic Division 4(3)/Ec. Dn. /2012 MONTHLY ECONOMIC REPORT NOVEMER 2016 ***** HIGHLIGHTS As per the estimates of Gross Domestic Product (GDP) for the
Ministry of Finance Department of Economic Affairs Economic Division 4(3)/Ec. Dn. /2012 MONTHLY ECONOMIC REPORT NOVEMER 2016 ***** HIGHLIGHTS As per the estimates of Gross Domestic Product (GDP) for the
18. Real gross domestic product
 18. Real gross domestic product 6 Percentage change from quarter to quarter 4 2-2 6 4 2-2 1997 1998 1999 2 21 22 Total Non-agricultural sectors Seasonally adjusted and annualised rates South Africa s real
Exports decline 4.7% during Rising rupee a concern for exporters
 Exports decline 4.7% during 2009-10 Rising rupee a concern for exporters India s merchandise exports for the fiscal year 2009-10, declined by 4.7% from around US$ 184 billion at the end of 2008-09 to US$
4(8)/Ec. Dn. /2017 Ministry of Finance Department of Economic Affairs Economic Division MONTHLY ECONOMIC REPORT NOVEMBER 2018 ***** HIGHLIGHTS
/Ec. Dn. /2017 Ministry of Finance Department of Economic Affairs Economic Division MONTHLY ECONOMIC REPORT NOVEMBER 2018 ***** HIGHLIGHTS") 4(8)/Ec. Dn. /2017 Ministry of Finance Department of Economic Affairs Economic Division MONTHLY ECONOMIC REPORT NOVEMBER 2018 ***** HIGHLIGHTS The growth of real GDP for the first half of 2018-19 was 7.6
4(8)/Ec. Dn. /2017 Ministry of Finance Department of Economic Affairs Economic Division MONTHLY ECONOMIC REPORT NOVEMBER 2018 ***** HIGHLIGHTS The growth of real GDP for the first half of 2018-19 was 7.6
ROYAL MONETARY AUTHORITY OF BHUTAN SELECTED ECONOMIC INDICATORS
 ROYAL MONETARY AUTHORITY OF BHUTAN SELECTED ECONOMIC INDICATORS JUNE 2012 ROYAL MONETARY AUTHORITY OF BHUTAN SELECTED ECONOMIC INDICATORS Vol.26 No.2 JUNE 2012 Postal Address Royal Monetary Authority of
MONTHLY REPORT. USDINR Gone By. 2 nd March 2015
 USDINR Gone By 2 nd March 2015 Rupee opened the month at 61.99 levels and initially remained on weaker note owing to negative sentiments in Global equities. According to the latest data, US GDP faltered
Asia Bond Monitor November 2018
 January 9 asianbondsonline.adb.org Key Developments in Asian Local Currency Markets Japan s November industrial production was revised upward to.% year-on-year (y-o-y) from the preliminary estimate of.%
Monetary Policy Report I / 2018
 Central Bank of Egypt Monetary Policy Report I / 218 Monetary Policy Report I / 218 Central Bank of Egypt Disclaimer The cut-off date for the data included in this report is May 17, 218. Some of the data
Debt Perspective. May 2018
 Debt Perspective May 2018 Debt Markets - Review Bond Market Overview Government bond yields rose in April. The 10-year government bond yield rose 47bps during the month, to end at 7.77%. Bond markets traded
FIXED INCOME UPDATE AUGUST 17
 1 FIXED INCOME UPDATE AUGUST 17 Aug-16 Aug-16 Sep-16 Sep-16 Oct-16 Oct-16 Nov-16 Nov-16 Dec-16 Dec-16 Jan-17 Jan-17 Feb-17 Feb-17 Mar-17 Mar-17 Apr-17 Apr-17 May-17 May-17 Jun-17 Jun-17 Jul-17 Jul-17 Aug-17
Major Economic Indicators: Monthly Update
 Volume 02/2018 February 2018 Major Economic Indicators: Monthly Update Monetary Policy Department BANGLADESH BANK Contents Page No. Executive summary 1-2 1. Monetary and credit developments 3 2. Reserve
Debt Management and Sustainability: Strengthening Liability Management
 Debt Management and Sustainability: Strengthening Liability Management Sri Lankan Perspective 27 February 2018 Colombo, Sri Lanka C J P Siriwardana Deputy Governor 2 Overview 1. Evolution of Public Debt
1 RED June/July 2018 JUNE/JULY 2018
 1 RED June/July 20 JUNE/JULY 20 2 RED June/July 20 MAJOR HIGHLIGHTS Headline consumer inflation grew by 4.9 per cent in June 20 compared to 4.8 per cent recorded in May 20 Inflation rate (% y/y) 4.9 (June)
2017 FIRST QUARTER ECONOMIC REVIEW
 2017 FIRST QUARTER ECONOMIC REVIEW MAY 2017 0 P a g e Overview The performance of the economy in the first quarter of 2017 was on a positive trajectory with annual growth projected to be about 3.9 % from
Weekly Macroeconomic Review
 20/12/2011 Weekly Macroeconomic Review Expectations derived from the capital market Our forecast Inflation in the coming months Future cumulative inflation next 12 CPIs (through November 2012 CPI) Inflation
RBI hikes repo rate in Third Bi-monthly Monetary Policy Statement,
 RBI hikes repo rate in Third Bi-monthly Monetary Policy Statement, -19 Policy repo rate increased to 6.50 and the reverse repo rate under the LAF stands at 6.25 On the basis of an assessment of the current
Republic of Korea. Yield Movements. 68 Asia Bond Monitor
 68 Asia Bond Monitor Republic of Korea Yield Movements Between 1 March and 15 May, local currency (LCY) government bond yields in the Republic of Korea rose for all tenors, albeit marginally (Figure 1).
January 25, 2017 Financial Markets & Debt Portfolio Update Contra Costa Transportation Authority Introduction Public Financial Management Inc. (PFM),
,") January 25, 2017 Introduction Public Financial Management Inc. (PFM), financial advisor to the (CCTA) has prepared the following report as an update of market conditions through December 30, 2016. The
January 25, 2017 Introduction Public Financial Management Inc. (PFM), financial advisor to the (CCTA) has prepared the following report as an update of market conditions through December 30, 2016. The
MonitorING Turkey ING BANK A.Ş. Further fiscal support in the Medium Term Plan. Emerging Markets 4 October 2017
 q ING BANK A.Ş. ECONOMIC RESEARCH GROUP MonitorING Turkey October 17 Emerging Markets October 17 USD/TRY MonitorING Turkey Further fiscal support in the Medium Term Plan In 17, accelerated spending and
Saudi Arabian Economy
 Saudi Arabian Economy Research Department ARC Research Team, Tel. +966 11 211 9370, devassyp@alrajhi-capital.com Saudi Arabian economy continued to expand in Q3 Saudi Arabian economy has continued to expand
The Economic Letter December 2010
 ASSOCIATION OF BANKS IN LEBANON Research & Statistics Department The Economic Letter December 2010 Summary: Despite the deceleration in the activities of a number of economic sectors in the fourth quarter,
Zambia s Economic Outlook
 Zambia s Economic Outlook F R A N C I S C H I P I M O D I R E C T O R E C O N O M I C S B A N K O F Z A M B I A Z A M B I A I N V E S T M E N T C O N F E R E N C E N O V E M B E R 4, 2 0 1 5 L O N D O
Major Economic Indicators: Monthly Update
 Volume 12/2017 December 2017 Major Economic Indicators: Monthly Update Monetary Policy Department BANGLADESH BANK Contents Page No. Executive summary 1-2 1. Monetary and credit developments 3 2. Reserve
7. Foreign Investments in India
 81 7. 7.1 Introduction Since 1992, Foreign Institutional Investors (FIIs) have been allowed to invest in all traded securities on the primary and secondary markets, including shares, debentures and warrants
IGI Life. Funds Performance Report February IGI Life Insurance Limited
 IGI Life Funds Performance Report February 2019 IGI Life Insurance Limited FUND MANAGER REPORT July 2015 Macro Review and Outlook: Headline inflation at +8.2% above market consensus CPI Inflation On the
Asia Bond Monitor June 2018
 September 8 asianbondsonline.adb.org Key Developments in Asian Local Currency Markets Japan s industrial production fell.% on a month-on-month (m-o-m) basis but rose.% on a year-on-year (y-o-y) basis in