Public Debt Management
|
|
|
- Diana Holmes
- 5 years ago
- Views:
Transcription
1 Public Debt Management quarterly report JULY SEPTEMBER 2017 Government of India Ministry of finance Budget Division Department of economic affairs NOVEMBER I
2 CONTENTS Section Page No. Introduction 1 1 Macroeconomic Developments 2 2 Debt Management - Primary Market Operations 6 3 Cash Management 9 4 Trends in Outstanding Public Debt 11 5 Secondary Market 16 II
3 List of Tables and Charts List of Tables Table No. Title Page No. 1 Fiscal Outcome during July-September Issuance of Dated Securities 7 3 Primary Issuance by Maturity Buckets, Q2 of Issuance of Treasury Bills 8 5 Repayments and Issuance of Treasury Bills in July September Composition of Public Debt 11 7 Maturity and Yield of Central Government's Market Loans 12 8 Maturity Profile of Outstanding GoI Dated Securities 13 9 Ownership Pattern of Government of India Dated Securities Transactions in Government Securities Top 10 Traded Securities Maturity Pattern of Outright Transactions 19 12(a) Share of various categories of participants in G-Sec trading Category wise Buying and Selling 21 List of Charts Chart No. Title Page No. 1 Growth Rate in GDP at constant ( ) prices 2 2 Inflation Rate Based on WPI and CPI 3 3 Growth Rate in IIP 3 4 Monthly Exports and Imports 4 5 Foreign Investment Flow and Exchange Rate 5 6 Liquidity Infusion in the System 9 7 Holding Pattern of Outstanding Government Securities 14 8 Movement of 10-year G-Sec Yields 16 9 Government Bond comparative Yield Curve Comparative Treasury Bill Yield Curve 17 11a Progressive Outright volume-instrument composition 18 11b Composition of Instruments in outright and repo volume 18 12a Maturity wise Trading Activity - July-Sept b Maturity wise Trading Activity -Apr-Jun Category wise total 20 List of Statements Statement No. Title Page No. 1 Issuance of Dated Securities During Q2 of FY18 i 2 Treasury Bills Issued During Q2 of FY18 ii 3 List of Dated Securities Outstanding at end-sept 2017 iii Maturity Profile of Government Securities at end-sept 2017 Calendar for Auction of Treasury Bills during Oct-December 2017 Calendar for auction of G-Sec during Oct 2017 Mar 2018 v vi vii III
4 Introduction The Middle Office for public debt management was set up in September 2008, in Department of Economic Affairs, Ministry of Finance, Government of India. With the objective of enhancing transparency of debt management operations, Middle Office, DEA began publishing on its website a quarterly report, titled Public Debt Management - Quarterly Report from the first quarter of the fiscal year The previous reports are available on the website of Ministry of Finance ( This report pertains to the Q2 of the fiscal year , viz., July-Sept 2017 (Q2 FY 18). The report gives an account of the public debt management and cash management operations during the quarter, and attempts a rationale for major activities. The report also tries to provide detailed information on various aspects of debt management. While all attempts have been made to provide authentic and accurate information, it is possible that some errors might have crept in inadvertently. Readers may inform us of such errors, as indeed their valuable suggestions, at pdmc-dea@nic.in. 1
5 Section 1 Macroeconomic Developments 1.1 As per Central Statistics Organization (CSO) estimates, India s real GDP growth in Q1 (Apr Jun ) FY 18 (at constant price ) stood at 5.7 per cent, as against 6.1 per cent growth in Q 4 FY 17 (Chart 1). Correspondingly, Gross Value Addition (GVA) growth stood at 5.6 per cent in Q1 FY18 compared to 7.6 per cent observed in Q1 FY17. These numbers are reflective of the subdued performance of the Industrial sector, mainly manufacturing activity, as reflected by the IIP data and a slowdown in services growth. Of the sectors, agriculture output grew by 2.3 per cent, manufacturing grew by 1.2 per cent, and construction grew by 2.0 per cent in Q1 of FY over previous year same quarter. Growth in financial, insurance, real estate and professional services was estimated at 6.4 per cent. While real GVA was unchanged from the previous quarter, nominal GDP stood at its lowest level in 5 quarters at 9.3 per cent. 1.2 Headline CPI retail inflation in September 2017 came in at 3.28 per cent, unchanged from the revised estimate of 3.28 per cent for August Much below market expectation of 3.60 per cent, the deceleration was attributed to a decline in price pressures in the food and beverages component. Core CPI, however, rose higher to 4.61 per cent in September 2017 from 4.50 per cent a month ago as price pressures arising from the impact of rise in house rent allowances for the Central Government employees sustained. Food inflation, which accounts for about 47 per cent of the overall CPI basket, decelerate to 1.25 per cent in Sep 2017 compared to 1.52 per cent in August 2017 and 3.88 per cent in September The prices of fruits and vegetables observed disinflation while prices of pulses saw an upward movement of 0.60 per cent in September 2017 after 9 months of continued descent. The housing component with a weight of per cent in CPI saw an increase of 0.97 per cent in Sep 2017 as compared to
6 per cent observed in the previous month although some slackening of the HRA impact was observed. Average CPI inflation rate during Q 2 FY 18 was at 3.0 per cent as compared with 2.2 per cent during Q1 of FY 18. WPI Inflation in Sep 2017 came in at 2.60 per cent as against 3.24 per cent in August. Deceleration in food prices contributed to this deflationary bias to the headline. On a cumulative basis, WPI stood at 0.97 per cent for FY 18 as compared to 3.44 per cent in the corresponding period in the previous year (Chart 2). 1.3 Industrial growth, as measured by index of industrial production (IIP) [base year ] registered 3.8 per cent rise in September 2017 as compared to 4.5 per cent rise in August 2017 (revised from 4.3 per cent). Though an upward momentum sustained across sectors, growth in manufacturing and electricity was at a lower rate on a sequential basis. Sequentially, September IIP grew by 0.82 per cent vis-à-vis 3.28 per cent growth seen the previous month and 1.46 per cent in the corresponding period last fiscal. Driven by a higher coal output, high growth in the mining sector positively impacted the headline IIP index. As per sectoral classification, mining (weight of 14.4 per cent) saw a y-o-y growth of 7.9 per cent, manufacturing (weight of 77.6 per cent) grew by 3.4 per cent and electricity (weight of 7.99 per cent) grew by 3.8 per cent in May Cumulatively, April-Sep 2017 IIP growth (y-o-y) stood at 2.5 per cent as compared to 5.8 per cent a year ago (Chart 3). As the impact of GST introduction eases, momentum in industrial production is expected to rebound. CSO periodically revises the base year of the macroeconomic indicators that include all-india Index of Industrial Production (IIP) the base of which also revised from to to not only reflect the changes in the industrial sector but to also align it with the base year of other macroeconomic indicators like the gross domestic product (GDP), wholesale price index (WPI). 3
7 1.4 In continuation with positive growth exhibited by exports for the last thirteen months, India s exports, in dollar terms, valued at USD 28.6 billion in Sep 2017 exhibited double digit growth for second month in succession at 25.7 per cent over Sep 2016 (valued at USD 22.8 billion). Imports growth, on other hand, weakened in September 2017 from August All the top ten commodity groups of export exhibited positive growth comprising per cent share in total exports comprising Engineering Goods (44.24 per cent), Gems and Jewellery (7.10 per cent), Petroleum Products (39.69 per cent), Organic & Inorganic Chemicals (46.06 per cent), Rice (45.66 per cent) and Electronic Goods (14.32 per cent). POL imports (valued at USD 8.19 billion) during September, 2017 was per cent higher than in September The global Brent crude prices ($/bbl) increased by per cent in September 2017 vis-à-vis September 2016 as per World Bank commodity price data. As import growth moderated vis a vis export growth, the trade deficit narrowed to US$ 32.1 billion in Q2 that from US$ 41.6 in Q1 (Chart 4). 1.5 Net foreign direct investment at USD 13.6 billion during Jul-Sep 2017 was more than doubled as compared to Q1, flowing mainly into manufacturing, retail and wholesale trade and 4
8 business services. While the debt segment of the domestic capital market attracted foreign portfolio investment of USD 14.4 billion, there were significant outflows in the equity segment in August-September 2017 on account of geo-political uncertainties and expected normalisation of Fed asset purchases. India s foreign exchange reserves were at US$ billion as on September 29, Rupee mostly exhibited an appreciating trend during the quarter driven by positive macroeconomic factors such as high capital inflows, ample liquidity, etc. As compared with previous quarter closing of INR at `64.74 per USD on June 30, 2017, INR traded in range of ` per USD during the quarter and closed at level of `63.36 per USD on Sep 29, The average INR exchange rate was `64.29 per USD during the Q2 as compared with `64.45 per USD during Q1 quarter (Chart 5). 5
9 Section 2 Debt Management - Primary Market Operations A. Government Finances 2.1 The fiscal deficit of the Central Government in budget estimates (BE) (FY 18) was placed at `. 5,46,532 crore (3.2 per cent of GDP) as against `. 5,34,274 crore (3.5 per cent of GDP) in the revised estimates (RE) for The fiscal outcome for first half (HY1) of the FY18 (Apr-Sep 2017) of Central government shows that gross fiscal deficit during Apr-Sep 2017 touched ` 4.99 trillion or 91.3 per cent of BE as against 83.9 per cent in Apr-Sep 2016 of BE. Total receipts (from revenue and non-tax) during the first half was over ` 6.23 trillion or 41.1 per cent of the BE vis-a-vis 41.2 per cent of BE last year. Total expenditure of the government during April-Sep 2017 was nearly ` 11.5 trillion or 53.5 per cent of BE as compared to 52.0 per cent of (BE) (Table 1). Table 1: Fiscal Outcome during the April -Sep (Amount in ` crore) Item BE April-Sep Actuals April-Sep (% of BE) April-Sep (% of BE) Revenue Receipts Tax Receipts Non-Tax Receipts Other Non-debt Receipts Total Expenditure Revenue Expenditure Capital Expenditure Revenue Deficit Primary Deficit Gross Fiscal Deficit Financing Market Loans* External Assistance Securities against Small Savings Others *:- Includes borrowings through treasury bills. Source: Controller General of Accounts (CGA) website; cga.nic.in B. Issuance Details This section discusses the issuance details of market loans during the first half of FY Gross and net market borrowing requirements of the Government for FY 18 were budgeted at ` 5,80,000 crore and ` 4,23,226 crore respectively, which were lower by 3.33 per cent and 0.5 per cent, respectively, than ` 6,00,000 crore and ` 4,25,181 crore in the revised estimates for FY17. During Q2 of 6
10 FY18, the Government issued dated securities worth ` 1,89,000 crore taking the gross borrowings during H1 FY18 to ` 3,57,000 crore or per cent of BE, vis-a-vis 56.8 per cent of BE in H1 FY 17 (Table 2). Net market borrowings during H1 FY 18 at 89.1 per cent of BE were, also higher than 61.1 per cent of BE in the previous year. Item BE Table 2: Issuance of Dated Securities (Amount in ` crore) H1 FY H1 FY 18 % H1 FY 17 % Q2 FY 18 H1 FY of BE of BE Gross Amount 5,80,000 1,89,000 3,57,000 3,41, Repayments 1,56,774 1,02,952 1,39,719 1,06, Switching/Buy Back 75, Net Issuance 4,23,226 86,048 2,17,281 2,34, Auctions during Q2 of FY18 were held more or less in accordance with the pre-announced calendar. Seeing the robust demand for the securities in year segment, issuance in this maturity bucket was kept higher than the projected issuance to meet the requirements of market participants. (Table 3). During Q2 FY 18, 12 tranches of auctions were held towards issuances of dated securities worth ` 1,89,000 crore. One new security, namely, 6.68% GS 2031 was issued during the quarter on Sep 01, The amount issued under new security constituted ` 17,000 crore or 8.99 per cent of total issuances in Q2, remaining being re-issues under the existing securities. There was no devolvement of G-securities on PDs during Q2 FY 17. Table 3 Primary Issuance by Maturity Buckets, Q 2 of (Amount in ` crore) Column1 5-9 years years Years Years Total % of Total % of Total H 1 FY18 (Projected) % of Total Q2 FY18 (Projected) % of Total Q2 FY18 (Actual) % of Total H 1 FY18-Actual % of Total
11 2.5 The gross amount raised through treasury bills (91, 182 and 364 day treasury bills) during Q2 of FY 18 amounted to ` 3,18,644 crore while total repayments amounted to ` 2,68,899 crore resulting in net issuance of ` 49,744 crore in Q2 FY 18, as compared to net issuance of ` 91,514 crore in Q1 FY 18 (Table 4). Net issuance of Treasury Bills in HY 1 FY 18 stood at ` 1,41,258 crore. The details of issuance of bills during Q2 of FY18 are given in Statement 2. Table 4: Issuance of Treasury Bills* (Amount in ` crore) Item BE Q2 FY 18 H 1 FY 18 H1 FY 18 % of BE H1 FY 17 % of BE 364 DTB Gross Amount Repayment Net Issuance DTB Gross Amount Repayment Net Issuance DTB Gross Amount Repayment Net Issuance All T-bills Gross Amount Repayment Net Issuance *:- Including amount through non-competitive route. 2.6 Taking cognisance of market demand and yield curve movements, the weighted average maturity of primary issuance was kept long during the Q2 FY18, although it moderated marginally as compared with Q1 FY 18. The weighted average maturity (WAM) of dated securities issued during Q2 FY18 was years as against years for dated securities issued in Q1 FY 18. The weighted average yield (cut-off) of issuance during Q2 FY18 was at 6.76 per cent as against 7.01 per cent in Q1 FY18, reflecting easing of G-sec yields during the quarter. 8
 facility from the Reserve Bank and issuance of Cash")
12 Section 3 Cash Management 3.1 Government s cash account is maintained with RBI. The cash-flow mismatches of the Government are largely managed through issuance of Treasury Bills, access to the Ways and Means Advances (WMA) facility from the Reserve Bank and issuance of Cash Management Bills when in deficit and through auctions of its cash balance in market (through RBI) and buybacks of securities from market, when in surplus. The limits for Ways and Means Advances (WMA) for the second quarter of the Financial Year (July 2017-Sept 2017) was fixed at ` 25,000 crore. Also based on assessment of prevailing and evolving liquidity conditions, RBI conducted sale of Government securities under Open Market Operations for an aggregate amount of 600 billion during the quarter. 3.2 Liquidity conditions in the economy continued to remain in surplus mode post demonetisation and were comfortable and in surplus mode during the quarter (Chart 6). The liquidity surplus(-), (net borrowings from RBI under Liquidity Adjustment Facility (LAF) including MSF & MSS) during the quarter, was at an average of ` 3,98,693 crore in July 2017, decreasing to an average surplus of ` 3,78,080 crore in August 2017 and decreasing further in September 2017 to an average surplus of ` 3,22,579 crore. The average net surplus under LAF(including MSF & MSS) during Q2 of FY was at ` 3,66,263 crore as against surplus of ` 4,24,768 crore in the previous quarter (Q1 of FY 17-18). In the third Bi-monthly Monetary Policy Statement for FY on August 2, 2017, RBI reduced the policy Repo rate by 25 bps from 6.25 percent to 6.00 per cent with immediate effect while maintaining a neutral stance and maintaining a wait and watch approach with regard to incoming data. Consequently, the repo rate under LAF stands adjusted to 5.75%, with MSF and Bank rate at 6.25%. 9
13 3.3 The cash position of the Government during Q2 of FY17-18 was tight and the Government had to resort to W & M Advances from RBI on many occasions. The Net amount of Treasury Bills issued through competitive route during the quarter was ` 46,004 crore. The net amount of Treasury Bills issued through non-competitive route during the quarter was ` 3, crore. Overall, the net amount mobilised through treasury bills (under competitive and noncompetitive routes) during Q2 of FY17 increased leading to issuance of ` 49, crore. Details of treasury bills issued and matured in Q2 of FY17 are given in Table 5. Date of Issue Table 5: Repayments and Issuance Treasury Bills in July Sept 2017 (Amount in ` crore) Repayments Issued Amount Variation in Issued amount 91 DTB 182 DTB 364 DTB 91 DTB 182 DTB 364 DTB over Repayments 6-July July July July July Aug Aug Aug Aug Aug Aug Sep Sep Sep Sep Total Under Competitive Route Q2 1,04,000 23,996 40,000 1,30,000 42,000 42,000 46,004 Total Under Non-Competitive Route Q2 91, , ,02, , , The calendar for issuance of treasury bills during October - December 2017 was announced on September 28, 2017, with gross borrowings at ` 1,43,000 crore (Statement 5). 10
14 Section 4 Trends in Outstanding Public Debt 4.1 The total Public Debt (excluding liabilities under the Public Account ) of the Government provisionally increased to ` 65,65,652 crore at end-sep 2017 from ` 64,03,138 crore at end- June 2017 (Table 6). This represented a quarter-on-quarter (QoQ) increase of 2.5 per cent (provisional) in Q2 FY 18 as compared with an increase of 4.7 per cent in the previous quarter (Q1 of FY 18). Internal debt constituted 93.0 per cent of Public Debt at the end of quarter, same as that in the previous quarter. Marketable securities (consisting of Rupee denominated dated securities and Treasury Bills) accounted for 82.6 per cent of total Public Debt at end-sep The outstanding internal debt of the Government at ` 6,105,458 crore constituted 38.2 per cent of GDP at end-sep 2017 as compared with 38.1 per cent at end-june Item Table 6: Composition of Public Debt At end-sep 2017# At end-june 2017 At end-sep 2017# At end-june 2017 (` crore) (% of Total) Public Debt (1 + 2) 65,65,652 64,03, Internal Debt 61,05,458 59,53, Marketable 54,24,650 52,77, (a) Treasury Bills 4,76,050 4,31, (i) Cash Management Bills - 5, (ii) 91-days Treasury Bills 2,32,526 1,95, (iii) 182-days Treasury Bills 98,545 87, (iv) 364-days Treasury Bills 1,44, , (b) Dated Securities 49,48,599 48,45, Non-marketable 6,80,808 6,76, (i) 14-days Treasury Bills 1,25,172 1,18, (ii) Securities Issued to NSSF* 4,00,796 4,00, (iii) Compensation and other 52,852 52, bonds* (iv) Securities issued to 1,01,989 1,01, International Financial Institutions* (v) Ways and Means Advances 2, External Debt 4,60,194 4,49, (i) Multilateral 2,99,355 2,92, (ii) Bilateral 1,24,469 1,20, (iii) IMF* 35,834 35, (iv) Rupee debt #: Data are provisional. *These data are not available for end-sep So they are carried over from previous quarter. 11
15 Maturity Pattern for Outstanding Government Debt Stock 4.2 The weighted average yield of primary issuance during Q2 FY 18 came down to 6.77 per cent from 7.01 per cent in the previous quarter, indicating lower yield environment. The weighted average maturity of outstanding stock of dated securities as on end-sep 2017 increased marginally to years from years as on end June Over the same period, the weighted average coupon of outstanding stock decreased marginally to 7.91 per cent from 7.95 per cent (Table 7). Table 7: Maturity and Yield of Central Government's Market Loans Year Issues during the year Outstanding Stock* Weighted Average Yield (%) Weighted Average Maturity (yrs) Weighted Average Coupon (%) Weighted Average Maturity (yrs) Q Q Q Q Q Q *As at end of period. 4.3 The proportion of debt (dated securities) maturing in less than one year decreased to 3.7 per cent at end-sep 2017 from 5.3 per cent a quarter ago. However, proportion of debt maturing within 1-5 years was higher at 24.1 per cent as against 21.3 per cent at end-jun Accordingly, debt maturing in next five years increased to 27.3 per cent in Q2 FY 18 from 26.6 per cent of outstanding during the previous quarter. The proportion of outstanding debt maturing in less than 10 years was also higher at 59.4 per cent as against 57.3 per cent a quarter ago, with corresponding decrease in share in proportion of debt maturing in more than 10 years. The change in composition of debt in terms of various maturity buckets reflects the maturity 12
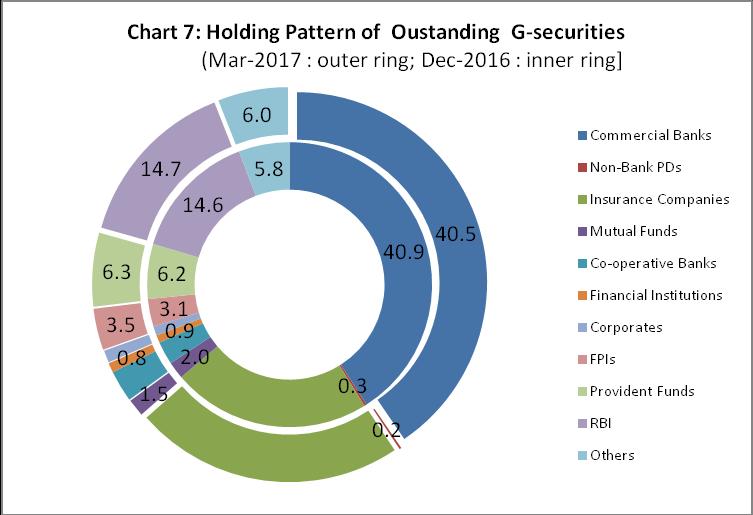
16 structure of securities issued during Q2 of FY18 as well as the maturity dynamics of outstanding securities. Overall, 27.3 per cent of outstanding stock has a residual maturity of up to 5 years at end-sep 2017, which implies that over the next five years, on an average, 5.5 per cent of outstanding stock needs to be repaid every year (Table 8). Thus, the rollover risk in the debt portfolio continues to be low. A switch operation of GoI securities worth face value 17,016 crore was conducted in Q1 on June 12, The implementation of budgeted buy back/ switches in coming months is expected to reduce roll over risk further. Holding Pattern Table 8: Maturity Profile of GoI Outstanding Dated Securities (Amount in ` crore) Maturity Buckets End-Jun 2017 End-Sep 2017 Less than 1 Year 2,54, ,84,732.8 (5.3) (3.7) 1-5 Years 10,32, ,66,367.2 (21.3) (24.1) 5-10 Years 14,89, ,86,827.7 (30.7) (32.7) Years 14,56, ,68,199.3 (30.1) (28.2) 20 Years and above 6,12, ,42,472.3 (12.6) (13.3) Total 4,845, ,948, Note: 1. Figures in parentheses represent per cent to total. 4.4 The holding pattern of Government securities is available with a lag of a quarter; the latest data is available for end-june 2017 (Table 9 and Chart 7). Banks (including banks that are primary dealers) continue to dominate as the major investor category, even with their share in holding of Government securities decreasing to 39.7 per cent at end-jun 2017 from 40.5 per cent as at end-mar Among the long-term investors, the share of holding by insurance companies increased marginally at end-jun 2017 to 23.1 per cent from 22.9 per cent at end- March The share of FPIs increased to 4.3 per cent at end-jun 2017 from 3.5 per cent a quarter ago. Share of Mutual Funds decreased marginally to 1.44 per cent at end-jun 2017 from 1.99 per cent a quarter ago. Proportion of securities held by the Reserve Bank at end-jun 2017 decreased marginally to 14.3 per cent (from 14.7 per cent a quarter ago) reflecting liquidity operations conducted by it as a part of its monetary policy stance. 13
17 Table 9: Ownership Pattern of Government of India Dated Securities (Per cent of Outstanding Securities) Category Mar. Jun. Sep. Dec. Mar Jun 1. Commercial Banks Non-Bank PDs Insurance Companies Mutual Funds Co-operative Banks Financial Institutions Corporates FPIs Provident Funds RBI Others Total Source: RBI Bulletin, Volume LXXI Number 9, Sep
18 15
19 Section 5 Secondary Market A. Government security yields 5.1 G-Sec yields showed a falling trend till August 3, 2017 but an increasing trend was seen thereafter. Yields initially softened due to increase in FPI limits by RBI to ` 2.42 lakh crore in G-Secs and ` 0.33 lakh crore for SDLs under the revised medium term framework for investment by FPIs. The FPIs utilized these limits within a few days from the announcement reflecting strong appetite for Government bonds. Marginal fall in US yield also helped to soften the yields in India. Fall in inflation, both WPI and CPI which touched historical low (WPI: 0.90% and CPI: 1.46% in June 2017) also supported the low yield sentiments. Surplus liquidity prevailing in the system as reflected in huge mobilization of funds under reverse repos by RBI also helped. Repo rate cut by RBI by 25 bps (from 6.25% to 6.00% on August 2, 2017) also supported the yields. 5.2 Yields, however, started hardening from beginning of August due to rise in inflation (WPI 3.24% in August 2017, 2.60% in September 2017 and CPI 3.28% in August 2017 as also in September 2017 vs. WPI of 0.90% and CPI of 1.46% in June). Rise in trade deficit in August 2017 ($11.7 bn in Aug 17 vs. $7.7 bn in Aug 16) and adverse Dollar-Rupee movement (Rupee depreciated from in Aug end to on Sep 27, 2017, a fall of almost Rupees 2 in a month) added to the pressure. Crude oil prices jumped from $ 47 in June to $ 59/barrel on September 27, 2017 putting pressure on balance of trade and BoP position and its likely effect on inflation. Concerns over GST revenues (after net of refund claims) and rumours about fiscal stimulus by the Government also affected yields. 5.3 GDP growth slowed to 5.70 percent in Q1 of FY 18, which is a 3 year low. Global geo-political tension (missile threats by North Korea and subsequent military exercise by South Korea, Japan and USA in Pacific Ocean). Lowering the GDP growth projections for India by various multilateral organisations like World Bank, IMF, ADB, etc. also led to hardening of the yields. Ten year benchmark yield closed at 6.67% on Sep 30, 2017 compared to 6.51% on June 30, The yield was in the range of 6.41% and 6.68% during the quarter. 5.4 G-Sec yields at the end of September 2017 were broadly higher across the Yield curve compared to end-june 2017, mainly due to the reasons detailed in para above. There was, however, some moderation in the yields at upto 1 year and 14 year points. The 1 yr-10 yr spread hardened to 56 bps at the end of Sep 2017 from 18 bps at the end of June 2017 while 10yr-30yr spread narrowed to 43 bps from 16
20 56 bps over the same period. Overall, 1yr-30yr spread at end of Q2 of FY17-18 widened to 99 bps compared to 74 bps at the end of the Q1 (Chart 9). 5.5 The surplus liquidity in the system remained comfortable at about ` lakh crore during July-September The 91, 182 and 364 day yields softened by 21, 13 and 13 bps respectively. The spread between 1 month yield and 12 months yield, however, jumped by 16 bps on Sep 30, 2017 compared to 10 bps on June 30, The spread between 1 month yield and 3 months yield also fell to 1 bp on September 30, 2017 compared to 3 bps in June The spread between 3 month and 6 month yields hardened to 11 bps on September 30, 2017 from 3 bps on June 30, B. Trading Pattern for domestic securities 5.6 The total outright volume of G-Secs traded during Q2 of FY17-18 was ` lakh crore, an increase of 10.2% compared to volume of ` lakh crore during Q1 (Table 10). The G-Secs trading saw the increase of 8.79% while T-Bills and SDLs trading activity improved by 15.1% and 25.4% respectively during the quarter. The annualised outright turnover ratio 1 for G-Secs for Q2 of FY17-18 improved to 4.73 from 4.48 during Q1. The annualised total turnover ratio 2 including the repo transactions, for Q2 of FY also increased to from during Q1. 1 Annualised Outright Turnover Ratio = 4*[Quarterly Outright Volume *2/(Average of outstanding stock)] 2 Annualised Total Turnover Ratio = 4* [(Quarterly Outright Volume *2 + Quarterly Repo Volume * 4) / (Average of outstanding stock)] 17
21 Table 10: Transactions in Government Securities (volume in ` Crore) Outright Period G-Sec T-Bills SDL Total G-Sec T-Bills SDL Total Oct-Dec 13 13,12,75 2,10,20 33,062 15,56,02 7,23,963 9,78,151 5,018 17,07,13 Jan-Mar 14 15,99,76 1,99,69 41,768 18,41,22 6,84,264 9,89,645 14,168 16,88,07 Apr-Jun 14 23,67,77 2,28,29 49,700 26,45,76 9,50,413 10,13,22 6,726 19,70,36 July-Sept 14 18,06,27 2,01,53 24,824 20,32,63 10,12,13 9,24,362 26,401 19,62,89 Oct-Dec 14 26,90,53 2,04,13 43,601 29,38,26 11,83,00 5,80,690 60,785 18,24,47 Jan-Mar 15 22,85,02 1,89,50 64,959 25,39,49 13,26,35 7,40,729 50,431 21,17,51 Apr-Jun 15 22,80,74 2,25,23 56,618 25,62,60 12,67,88 7,73,487 10,096 20,51,47 July-Sept 15 21,54,20 2,26,05 77,147 24,57,40 14,56,16 5,33,733 41,476 20,31,37 Oct-Dec 15 19,31,99 2,15,03 87,086 22,34,11 16,22,56 4,95,476 45,462 21,63,50 Jan-Mar 16 21,90,73 1,88,06 95,627 24,74,42 18,84,07 4,45,508 45,731 23,75,31 Apr-June 16 28,27,81 2,35,85 1,13,27 31,76,94 20,64,06 4,35,971 1,18,26 26,18,30 July-Sept 16 52,05,35 2,76,67 1,87,32 56,69,35 26,81,22 3,27,322 1,80,49 31,89,03 Oct-Dec 16 45,92,86 2,60,52 1,42,80 49,96,20 24,44,86 3,78,260 1,34,36 29,57,48 Jan-Mar 17 25,72,43 3,00,40 1,58,80 30,31,64 23,09,65 6,61,235 99,290 30,70,17 Apr-June 17 26,64,38 2,94,36 1,53,17 31,11,92 21,86,20 6,37,634 1,96,87 30,20,71 Jul-Sep 17 28,98,61 7 3,38,69 6 1,92, ,29, ,84,486 7 Repo 7,91,658 2,26, ,02, Central Government dated securities continued to account for a dominant portion of total trading volumes (Chart 11a and 11b) although their share fell during the Q2 to 84.52% of total outright volumes, as compared to 85.62% in Q1. In Repo market also, Central Government securities accounted for majority of transactions but their share fell to 69.18% of the total repo volumes during Q2 of FY17-18 as compared to 72.37% in Q1. 18
22 5.8 The top 10 traded securities accounted for 70.06% of the total outright transaction volume during the Q2 compared to 66.55% during Q1, reflecting that trading has again concentrated to fewer securities as compared to Q1. The share of top three traded securities also increased to 58.88% during Q2 from 48.09% during Q1. (Table 11) Table 11 - Top 10 Traded Securities (in ` Crore) Security Volume in Jul-Sep 17 Security Volume in Apr-June % GS ,79, % GS ,26, % GS ,54, % GS ,63, % GS , % GS ,05, % GS , % GS ,96, % GS , % GS ,50, % GS , % GS , % GS , % GS , % G.S , % G.S , % GS , % G.S , % GS , % GS ,397 Total 24,02,591 Total 20,71, The trend in outright trading volumes in Government securities under different maturity buckets is given in Table 12. Table 12: Maturity wise outright trading volumes in G-Secs (in ` Crore) Maturity/ Jul-Sep Apr-June Jan-Mar Oct-Dec July - Apr-Jun Quarter Sept Less than 23,490 36,298 91,827 84,902 76, ,611 3,62,729 2,24,817 3 Years 3-7 Years 3,31,725 4,19,757 3,55,658 7,63, , ,652 27,87,632 15,68, ,22,507 11,40,696 14,06,383 19,81, , ,690 61,99,880 42,72,320 Years > 10 12,20,895 10,67,629 7,18,569 17,62,511 2,324,288 1,042,860 58,48,228 24,91,828 Years Total 28,98,617 26,64,380 25,72,437 45,92,866 5,205,353 2,827,813 1,51,98,469 85,57,673 19
 of bond market during the quarter vis-à-vis previous quarter.")
23 5.10 The maturity distribution of Government securities transactions in the secondary market is represented in Chart 12a and 12b for Q1 and Q2 2 of respectively. Trading fell in short end (less than 3 years and 3-7 years) of bond market during the quarter vis-à-vis previous quarter. Share of 7-10 year and 10 years and above maturity bucket saw a marginal rise in share of trading volumes during Q2 of FY compared to Q1. The below 3 years maturity bracket continued to have lowest share of trading volume 0.81% in Q1 vs. 1.36% in Q1 of FY Table 12 a: Maturity wise composition of G-Secs trading Jul-Sep 17 Jul-Sep 17 (%) Apr-June 17 (` Cr) Apr-June 17 (%) Maturity/Quarter (` Cr) Less than 3 Years 23, % 36, % 3-7 Years 3,31, % 4,19, % 7-10 Years 13,22, % 11,40, % > 10 years 12,20, % 10,67, % Total 28,98, % 26,64, % 5.11 PSBs were the dominant trading category during the Jul-Sep 2017 quarter with a 25.6% share in total outright trading activity. (Chart 13). Foreign banks vouched for the 2 nd highest share at 18.9%. On net basis, PSBs were the largest net buyer (` 50,869 crore) in secondary market during the quarter, followed by `Mutual Funds category (` 41,163 crore). PDs were the largest net sellers category in secondary market (` 64,533 crore) during the quarter, followed by foreign banks (` 47,171 crore). 20
24 5.10 Quarterly share of various categories/participants in the secondary market trading activity (buy + sell) for government securities is shown in Table 13. Table 13: Share of various categories of participants in G-Secs trading Jul-Sep 2017 Apr-June 17 Jan-March 17 Oct-Dec 16 July-Sept 16 Category Buy Sell Buy Sell Buy Sell Buy Sell Buy Sell Co-op Banks 2.96% 2.71% 4.16% 3.89% 3.84% 3.48% 4.98% 4.72% 4.97% 4.89% FIs 1.12% 0.67% 0.44% 0.22% 0.44% 0.36% 0.45% 0.36% 0.35% 0.31% Foreign Banks 18.18% 19.55%22.66% 21.96% 28.67% 28.59% 24.90% 26.81% 24.74% 25.04% Ins. Cos 8.18% 8.43% 2.08% 1.68% 2.08% 1.66% 1.19% 1.14% 1.07% 0.95% MFs 15.78% 14.58% 10.55% 7.78% 12.19% 10.64% 9.64% 9.47% 8.24% 7.69% Others 2.45% 1.64% 2.23% 1.20% 1.82% 0.90% 1.19% 0.65% 16.92% 18.11% Primary Dealers 11.00% 12.89% 15.33% 18.00% 12.19% 13.56% 14.65% 16.22% 13.32% 13.75% Pvt Banks 14.02% 14.71% 17.09% 17.66% 13.17% 14.46% 13.51% 13.27% 29.23% 28.59% PSBs 26.30% 24.82% 25.46% 27.61% 25.60% 26.35% 29.49% 27.36% 1.15% 0.69% Total 100% 100% 100% 100% 100% % 100% 100% 100% 21
25 Name of Stock Statement 1: Issuance of Dated securities During Q2 FY Date of Auction Date of Issue Amount Raised Devolve ment on PDs Cut off price Cut off yield (%) (Amount in `Crore) Date of Maturity Residual Maturity (Years) 6.30% FRB 2024 $ M 30-Jun Jul Nov % GS 2027 $ M 30-Jun Jul May % GS 2034 $ M 30-Jun Jul Dec % GS 2046 $ M 30-Jun Jul Oct % GS 2022 $ M 07-Jul Jul Dec % GS 2029 $ M 07-Jul Jul Dec % GS 2033 $ M 07-Jul Jul Dec % GS 2051 $ M 07-Jul Jul Nov % FRB 2024 $ M 14-Jul Jul Nov % GS 2027 $ M 14-Jul Jul May % GS 2034 $ M 14-Jul Jul Dec % GS 2046 $ M 14-Jul Jul Oct % GS 2022 $ M 21-Jul Jul Dec % GS 2029 $ M 21-Jul Jul Dec % GS 2033 $ M 21-Jul Jul Dec % GS 2051 $ M 21-Jul Jul Nov % FRB 2024 $ M 28-Jul Jul Nov % GS 2027 $ M 28-Jul Jul May % GS 2034 $ M 28-Jul Jul Dec % GS 2046 $ M 28-Jul Jul Oct % GS 2022 $ M 04-Aug Aug Dec % GS 2029 $ M 04-Aug Aug Dec % GS 2033 $ M 04-Aug Aug Dec % GS 2055 $ M 04-Aug Aug Oct % FRB 2024 $ M 11-Aug Aug Nov % GS 2027 $ M 11-Aug Aug May % GS 2034 $ M 11-Aug Aug Dec % GS 2046 $ M 11-Aug Aug Oct % GS 2022 $ M 18-Aug Aug Dec % GS 2029 $ M 18-Aug Aug Dec % GS 2033 $ M 18-Aug Aug Dec % GS 2051 $ M 18-Aug Aug Nov % FRB 2024 $ M 24-Aug Aug Nov % GS 2027 $ M 24-Aug Aug May % GS 2034 $ M 24-Aug Aug Dec % GS 2046 $ M 24-Aug Aug Oct % GS 2022 $ M 01-Sep Sep Dec % GS 2031 # M 01-Sep Sep Sep % GS 2033 $ M 01-Sep Sep Dec % GS 2055 $ M 01-Sep Sep Oct % FRB 2024 $ M 08-Sep Sep Nov % GS 2027 $ M 08-Sep Sep May % GS 2034 $ M 08-Sep Sep Dec % GS 2051 $ M 08-Sep Sep Nov % GS 2022 $ M 22-Sep Sep Dec % GS 2031 $ M 22-Sep Sep Sep % GS 2033 $ M 22-Sep Sep Dec % GS 2046 $ M 22-Sep Sep Gross Nominal Amount Raised Weighted Average Yield 6.77 Weighted Average Maturity $ - Reissues/Price based auctions # New Issue/Yield Based Auction M-Multiple Price based auction 10-Oct i
26 Name of Security Date of Auction Statement 2:Treasury Bills Issued During Q1 FY Date of Issue Competitive amount raised ii Non- Gross Competitive Nominal amount raised amount raised (Amount in `crore) Cut off Yield (%) 364 DTB 12-Apr Apr DTB 26-Apr Apr DTB 9-May May DTB 24-May May DTB 7-Jun-17 8-Jun DTB 21-Jun Jun DTB 5-Apr-17 6-Apr DTB 19-Apr Apr DTB 3-May-17 4-May DTB 17-May May DTB 31-May-17 1-Jun DTB 14-Jun Jun DTB 28-Jun Jun DTB 5-Apr-17 6-Apr DTB 12-Apr Apr DTB 19-Apr Apr DTB 26-Apr Apr DTB 3-May-17 4-May DTB 9-May May DTB 17-May May DTB 24-May May DTB 31-May-17 1-Jun DTB 7-Jun-17 8-Jun DTB 14-Jun Jun DTB 21-Jun Jun DTB 28-Jun Jun ,82, ,06, ,88,755.5
27 Statement 3: List of Dated Securities Outstanding at end-sept 2017 Nomenclature Date of maturity Outstanding Stock (` Crore) of which: MSS 6.25% 2018 (conv) 02-Jan-18 16, % GS Apr-18 73, % GS Apr-18 75, % GS Apr-18 3, % GS 2018(Conv)] 25-Sep-18 16, % GS Nov-18 12, % GS Jan-19 10, % GS Feb-19 53, % GS Jun-19 53, % GS 2019 (con) 12-Jun-19 11, % GS Jul-19 45, % GS Aug-19 6, % GS 2020 (con) 02-Jan-20 61, % GS Jan-20 74, % GS Apr-20 6, % GS May-20 75, % GS Jun-20 73, % GS Dec-20 76, FRB Dec-20 13, % GS Dec-20 5, % GS Apr-21 66, % GS May-21 49, % GS May-21 26, % GS Nov-21 83, % GS Feb-22 57, % GS May-22 77, % GS Jun-22 83, % GS Aug-22 68, % GS 2022 (conv) 28-Aug-22 11, % GS Sep-22 70, % GS Dec-22 63, % GS Apr-23 13, % GS May-23 77, % II GS Jun-23 1, % GS 2023 (conv) 12-Jun-23 14, % GS Nov-23 83, % GS Dec-23 88, IINSS -Cumulative 1.5% GS Dec % GS Jun-24 90, % GS Jul-24 90, FRB Nov % GS Nov-24 92, % GS May-25 86, % GS Sep-25 90, % GS 2025 (Conv) 25-Sep-25 16, % GS Jan-26 87, % GS Jul-26 90, % GS Sep-26 91, % GS Sep-26 15, % GS Nov-26 86, % GS Feb-27 93, % GS May-27 73, % GS Aug-27 73, % GS Sep-27 89, % GS GS 2028 (C Align) 25-Mar-28 15, % GS Jun-28 84, % GS Jun-28 11, % GS Mar-29 88, Contd. iii
28 Nomenclature Date of maturity Outstanding Stock (` Crore) of which: MSS 6.79% GS Dec % GS Mar-30 89, % GS May-30 85, % GS Sep-30 61, % GS Dec-30 90, % GS Sep-31 17, % GS Feb-32 90, % GS Aug-32 89, % GS Aug-32 89, % GS Sep-32 1, % GS Nov % GS Dec-33 36, % GS Aug-34 90, % GS Dec-34 86, FRB Jan % GS Sep % GS Jun-36 86, % GS Jan-39 13, % GS Jul-40 90, % GS Dec-41 90, % GS Dec-42 90, % GS Dec-43 79, % GS Dec-44 86, % GS Jun-45 73, % GS Oct-46 47, % GS Nov-51 36, % GS Oct-55 38, Total 4,948,599 iv
29 Statement 4: Maturity Profile of Government Securities as on End-September 2017 Year of maturity Outstanding Stock (` crore) , , , , , , , , , , , , , , , , , , , , , , , , , , , , , ,000 Total 4,948,599 v
30 Statement 5:Calendar for Auction of Treasury Bills during Oct December 2017 (Amount in ` crore) Date of Auction 91 Days 182 Days 364 Days Total Oct 4, ,000 2,000 2,000 11,000 Oct 11, ,000 2,000 2,000 11,000 Oct 17, ,000 2,000 2,000 11,000 Oct 25, ,000 2,000 2,000 11,000 Nov 1, ,000 2,000 2,000 11,000 Nov 8, ,000 2,000 2,000 11,000 Nov 15, ,000 2,000 2,000 11,000 Nov 22, ,000 2,000 2,000 11,000 Nov 29, ,000 2,000 2,000 11,000 Dec 6, ,000 2,000 2,000 11,000 Dec 13, ,000 2,000 2,000 11,000 Dec 20, ,000 2,000 2,000 11,000 Dec 27, ,000 2,000 2,000 11,000 Total 91,000 26,000 26,000 1,43,000 vi
31 Statement 6: Calendar for Auction of G-Secs Bills during Oct 17 - March 2018 (Amount in ` Crore) Sr. No. Week of Auction Amount Security-Wise allocation 1 Oct 2-6, ,000 i) 5-9 Years for ` 3,000 crore ii) Years for ` 8,000 crore iii) Years for ` 2,000 crore iv) 20 Years & Above for ` 2,000 crore 2 Oct 9-13, ,000 i) 5-9 Years for ` 3,000 crore ii) Years for ` 8,000 crore iii) Years for ` 2,000 crore iv) 20 Years & Above for ` 2,000 crore 3 Oct 23-27, ,000 i) 5-9 Years for ` 3,000 crore ii) Years for ` 8,000 crore iii) Years for ` 2,000 crore iv) 20 Years & Above for ` 2,000 crore 4 Oct 30- Nov 3, ,000 i) 5-9 Years for ` 3,000 crore ii) Years for ` 8,000 crore iii) Years for ` 2,000 crore iv) 20 Years & Above for ` 2,000 crore 5 Nov 6-10, ,000 i) 5-9 Years for ` 3,000 crore ii) Years for ` 8,000 crore iii) Years for ` 2,000 crore iv) 20 Years & Above for ` 2,000 crore 6 Nov 13-17, ,000 i) 5-9 Years for ` 3,000 crore ii) Years for ` 8,000 crore iii) Years for ` 2,000 crore iv) 20 Years & Above for ` 2,000 crore 7 Nov 20-24, ,000 i) 5-9 Years for ` 3,000 crore ii) Years for ` 8,000 crore iii) Years for ` 2,000 crore iv) 20 Years & Above for ` 2,000 crore 8 Nov 27- Dec 1, ,000 i) 5-9 Years for ` 3,000 crore ii) Years for ` 8,000 crore iii) Years for ` 2,000 crore iv) 20 Years & Above for ` 2,000 crore 9 Dec 4-8, ,000 i) 5-9 Years for ` 3,000 crore ii) Years for ` 8,000 crore iii) Years for ` 2,000 crore iv) 20 Years & Above for ` 2,000 crore 10 Dec 18-22, ,000 i) 5-9 Years for ` 3,000 crore ii) Years for ` 8,000 crore iii) Years for ` 2,000 crore iv) 20 Years & Above for ` 2,000 crore 11 Dec 25-29, ,000 i) 5-9 Years for ` 3,000 crore ii) Years for ` 8,000 crore iii) Years for ` 2,000 crore iv) 20 Years & Above for ` 2,000 crore 12 Jan 1-5, ,000 i) 5-9 Years for ` 4,000 crore ii) Years for ` 9,000 crore iii) Years for ` 2,000 crore iv) 20 Years & Above for ` 3,000 crore vii
32 13 Jan 8-12, ,000 i) 5-9 Years for ` 1,000 crore ii) Years for ` 2,000 crore iii) Years for ` 1,000 crore iv) 20 Years & Above for ` 1,000 crore 14 Jan 15-19, ,000 i) 5-9 Years for ` 1,000 crore ii) Years for ` 2,000 crore iii) Years for ` 1,000 crore iv) 20 Years & Above for ` 1,000 crore 15 Jan 22-26, ,000 i) 5-9 Years for ` 1,000 crore ii) Years for ` 2,000 crore iii) Years for ` 1,000 crore iv) 20 Years & Above for ` 1,000 crore 16 Jan 29 -Feb 2, ,000 i) 5-9 Years for ` 1,000 crore ii) Years for ` 2,000 crore iii) Years for ` 1,000 crore iv) 20 Years & Above for ` 1,000 crore 17 Feb 5-9, ,000 i) 5-9 Years for ` 1,000 crore ii) Years for ` 2,000 crore iii) Years for ` 1,000 crore iv) 20 Years & Above for ` 1,000 crore Total 2,08,000 viii
PUBLIC DEBT MANAGEMENT QUARTERLY REPORT JANUARY-MARCH 2018
 PUBLIC DEBT MANAGEMENT QUARTERLY REPORT JANUARY-MARCH 2018 GOVERNMENT OF INDIA MINISTRY OF FINANCE BUDGET DIVISION DEPARTMENT OF ECONOMIC AFFAIRS JUNE 2018 www.dea.gov.in ii CONTENTS Section Page No. Introduction
Public Debt Management
 Public Debt Management quarterly report january- march 2016 Government of India Ministry of finance Budget Division Department of economic affairs May 2016 www.finmin.nic.in 1 CONTENTS Section Page No.
RBI s Sixth Bi-Monthly Monetary Policy Review ( ) Maintains status quo...neutral Stance
 Maintains status quo...neutral Stance") 7h February 2018 RBI s Sixth Bi-Monthly Monetary Policy Review (2017-18) Maintains status quo...neutral Stance Repo Rate unchanged at Reverse Repo Rate stands at 5.75% Marginal Standing Facility and Bank
7h February 2018 RBI s Sixth Bi-Monthly Monetary Policy Review (2017-18) Maintains status quo...neutral Stance Repo Rate unchanged at Reverse Repo Rate stands at 5.75% Marginal Standing Facility and Bank
Market Roundup. Macro-Economic Overview. Domestic Macroeconomic Development
 Market Roundup Domestic Macroeconomic Development The Monetary Policy Committee (MPC), in its bi-monthly Monetary Policy meeting in June, decided to increase the repo rate for the first time since January
MONTHLY ECONOMIC BULLETIN
 MONTHLY ECONOMIC BULLETIN Febru ruary 2015,, Volume 1, Issue 4 Vanijya Bhavan (1st Floor) International Trade Facilitation Centre 1/1 Wood Street Kolkata - 700016 http://www.eepcindia.org E E PC India
Indian Economy. Industrial production declined in Nov 2015 for the first time in last 13 months. Fig1: Industrial Output Growth from April 2014
 Indian Economy Industrial Production Industrial production declined in Nov 2015 for the first time in last 13 months Industrial growth dropped to negative in Nov 2015 after 12 successive months of increase,
Indian Economy. GDP growth slowed down but remained above the comfortable 7% Manufacturing GVAbp
 Indian Economy Economic Growth GDP growth slowed down but remained above the comfortable 7% Domestic economy witnessed 7.1% GDP growth during the first quarter (Apr - Jun) of fiscal 2016-17 (Q1FY17) as
III. MONETARY AND LIQUIDITY CONDITIONS
 III. MONETARY AND LIQUIDITY CONDITIONS Monetary and liquidity aggregates continued to expand at a strong pace during 2007-08, albeit with some moderation, reflecting large and persistent capital flows.
Mid-Quarter Monetary Policy Review
 18 December, 2013 Mid-Quarter Monetary Policy Review RBI maintained status quo in the mid-quarter monetary policy meeting held today preferring to wait and watch for more forthcoming macro-economic data
Indian Economy. Industrial output grew highest in four months in June 2015 but volatility continued
 Indian Economy Industrial Production Industrial output grew highest in four months in June 2015 but volatility continued After a slowdown in May 2015, industrial production grew by 3.8% during the month
MONTHLY ECONOMIC BULLETIN
 MONTHLY ECONOMIC BULLETIN Janu uary 2015,, Volume 1, Issue 3 Vanijya Bhavan (1st Floor) International Trade Facilitation Centre 1/1 Wood Street Kolkata - 700016 http://www.eepcindia.org E E PC India Page
MONTHLY UPDATE NOVEMBER 2018
 MONTHLY UPDATE NOVEMBER 2018 November 2018 A champion is defined not by their wins but by how they can recover when they fall. Equity markets - Serena Williams Indices 31 st Oct 2018 30 th Nov 2018 1 Month
Asia Bond Monitor November 2018
 January 9 asianbondsonline.adb.org Key Developments in Asian Local Currency Markets L ast week, the Philippines raised USD. billion from the sale of -year global bonds priced at basis points above benchmark
Asia Bond Monitor November 2018
 7 December 8 Key Developments in Asian Local Currency Markets T he monetary board of the Bangko Sentral ng Pilipinas decided to keep its key policy rates steady during its final meeting for the year on
Fixed Income Update October 2015
 Month Overview Average Liquidity Support by RBI Rs -5,527 Cr. Includes: LAF, MSF, SLF & Term Repo Bank Credit Growth Money Market Bank Deposit Growth 9.6% 11.6% Change in basis points Tenure CD Change
MONTHLY UPDATE SEPTEMBER 2017
 MONTHLY UPDATE SEPTEMBER 2017 September 2017 "I am a better investor because I am a businessman and a better businessman because I am an investor. - Warren Buffett Equity Markets Indices 31 st Aug 2017
Reviewing Macro-economic Developments and Understanding Macro-Economic Policy
 MINISTRY OF FINANCE GOVERNMENT OF INDIA Reviewing Macro-economic Developments and Understanding Macro-Economic Policy Module 5 Contemporary Themes in India s Economic Development and the Economic Survey
RBI s Monetary Policy Q : Expectations
 RBI s Monetary Policy Q2 2012-13: Expectations RBI s Monetary Policy for Second Quarter 2012-13 is scheduled to be announced on 30-Oct- 12. The market expectations are once again divided over rate cut
MONETARY POLICY OUTLOOK- THE FIFTH BI-MONTHLY MONETARY POLICY REVIEW OF THE CURRENT FINANCIAL YEAR DECEMBER-MARCH
 MONETARY POLICY OUTLOOK- THE FIFTH BI-MONTHLY MONETARY POLICY REVIEW OF THE CURRENT FINANCIAL YEAR DECEMBER-MARCH 2018-19 Dr. Arun Kumar Misra, Associate Professor, Finance & Accounts, VGSOM, IIT Kharagpur
STCI Primary Dealer Ltd
 Macroeconomic Update: CPI, WPI and IIP Headline CPI inflation for July-18 stood at 4.17%, 75bps lower compared to previous month mainly due to favorable base effect. Retail inflation print for June-18
Asia Bond Monitor March 2015
 June 1 asianbondsonline.adb.org Key Developments in Asian Local Currency Markets Consumer price inflation in Malaysia accelerated to.1% year-on-year (y-o-y) in May from 1.8% y-o-y in April, mainly due
August 1, 2017 I Economics EXPECTATIONS FROM CREDIT POLICY: AUGUST 2017
 EXPECTATIONS FROM CREDIT POLICY: AUGUST 2017 August 1, 2017 I Economics The third bi-monthly monetary policy review for this fiscal year is to be announced by the RBI on 2nd August 2017. It will be sixth
RBI Q1 FY11 Monetary Policy Review
 RBI Q1 FY11 Monetary Policy Review The Policy Measures In Brief In its First Quarter Review of the Annual Monetary Policy for 2010-11, the Reserve Bank of India increased its policy rates with immediate
MONTHLY ECONOMIC REPORT MARCH 2013 HIGHLIGHTS
 Ministry of Finance Department of Economic Affairs Economic Division 4(3)/Ec. Dn. /2012 MONTHLY ECONOMIC REPORT MARCH 2013 HIGHLIGHTS The overall growth of GDP at factor cost at constant prices, as per
3rd Bi-Monthly Monetary Policy Review, Kotak Mutual Fund Update as on 9 th August
 3rd Bi-Monthly Monetary Policy Review, 2016-17 Kotak Mutual Fund Update as on 9 th August 2016 1 Monetary Measures: Key Rates Measures CRR Unchanged at 4.00% Reverse Repo rate Unchanged at 6.00% (affixed
Monetary Policy Review Premature end to the easing cycle?
 The monetary policy committee (MPC) maintained status quo for the second policy review running, keeping Repo rate at 6.25%, contrary to market expectations of 25bps cut. Consequently, the reverse repo/msf
19 th OECD Global Forum on Public Debt Management Session II: Urgent Policy Challenges for Asian Debt Managers
 19 th OECD Global Forum on Public Debt Management Session II: Urgent Policy Challenges for Asian Debt Managers A Case Study of India A.K.Mitra Structure Of Presentation I. Fiscal Situation II. Financing
Sri Lanka: Recent Economic Trends. January 2018
 Sri Lanka: Recent Economic Trends January 2018 1 Agenda Summary Economic Growth Inflation and Monetary Policy External Account Fiscal Scenario of Government of Sri Lanka ICRA Lanka Limited 2 2 Agenda Summary
BANKING SECTOR PERFORMANCE STUDY H1FY14
 BANKING SECTOR PERFORMANCE STUDY H1FY14 Our study covers 39 banks 26 Public Sector Banks & 13 Private Sector Banks. Banking December 11, 2013 Foreword As per the Central Statistical Organization (CSO)
VI. THE EXTERNAL ECONOMY
 VI. THE EXTERNAL ECONOMY India s external sector has continued to register robust performance during 2006-07 so far. Merchandise exports have exhibited strong growth, notwithstanding some deceleration.
Debt Perspective. May 2018
 Debt Perspective May 2018 Debt Markets - Review Bond Market Overview Government bond yields rose in April. The 10-year government bond yield rose 47bps during the month, to end at 7.77%. Bond markets traded
FIXED INCOME UPDATE AUGUST 17
 1 FIXED INCOME UPDATE AUGUST 17 Aug-16 Aug-16 Sep-16 Sep-16 Oct-16 Oct-16 Nov-16 Nov-16 Dec-16 Dec-16 Jan-17 Jan-17 Feb-17 Feb-17 Mar-17 Mar-17 Apr-17 Apr-17 May-17 May-17 Jun-17 Jun-17 Jul-17 Jul-17 Aug-17
Republic of Korea. Yield Movements. 68 Asia Bond Monitor
 68 Asia Bond Monitor Republic of Korea Yield Movements Between 1 March and 15 May, local currency (LCY) government bond yields in the Republic of Korea rose for all tenors, albeit marginally (Figure 1).
AsianBondsOnline WEEKLY DEBT HIGHLIGHTS
 AsianBondsOnline WEEKLY 9 January 7 asianbondsonline.adb.org Key Developments in Asian Local Currency Markets Consumer price inflation in Indonesia eased to.% year-on-year (y-o-y) in December from.6% y-o-y
MONTHLY ECONOMIC REPORT MARCH 2014
 Ministry of Finance Department of Economic Affairs Economic Division 4(3)/Ec. Dn. /2012 MONTHLY ECONOMIC REPORT MARCH 2014 HIGHLIGHTS The growth of GDP at factor cost at constant (2004-05) prices (real
Monetary Policy Report I / 2018
 Central Bank of Egypt Monetary Policy Report I / 218 Monetary Policy Report I / 218 Central Bank of Egypt Disclaimer The cut-off date for the data included in this report is May 17, 218. Some of the data
Asia Bond Monitor November 2015
 1 February 16 asianbondsonline.adb.org Key Developments in Asian Local Currency Markets Bangko Sentral ng Pilipinas (BSP) decided on 11 February to keep unchanged the overnight borrowing rate at.% and
ROYAL MONETARY AUTHORITY OF BHUTAN SELECTED ECONOMIC INDICATORS
 ROYAL MONETARY AUTHORITY OF BHUTAN SELECTED ECONOMIC INDICATORS JUNE 2012 ROYAL MONETARY AUTHORITY OF BHUTAN SELECTED ECONOMIC INDICATORS Vol.26 No.2 JUNE 2012 Postal Address Royal Monetary Authority of
Mongolia Monthly Economic Brief
 Mongolia Monthly Economic Brief June 21 Mongolia s economic growth in Q1 21, slowed to.% (y/y), down from % in the previous quarter. Investment sharply contracted by 1.% from the same quarter a year ago,
CENTRAL BANK OF OMAN. Mid-Year Review of the Omani Economy 2010
 CENTRAL BANK OF OMAN Mid-Year Review of the Omani Economy 2010 December 2010 CENTRAL BANK OF OMAN Mid-Year Review of the Omani Economy 2010 Economic Research and Statistics Department CONTENTS Page Foreword
5 Domestic and External Debt
 flows in billion Rs FY11 FY12 FY13 FY14 FY15 FY16 FY17 percent of GDP 5 Domestic and External Debt 5.1 Overview Gross public debt-to-gdp ratio improved marginally to 67.2 percent by end-june 217 from 67.6
4(8)/Ec. Dn. /2017 Ministry of Finance Department of Economic Affairs Economic Division MONTHLY ECONOMIC REPORT JUNE 2018 ***** HIGHLIGHTS
/Ec. Dn. /2017 Ministry of Finance Department of Economic Affairs Economic Division MONTHLY ECONOMIC REPORT JUNE 2018 ***** HIGHLIGHTS") 4(8)/Ec. Dn. /2017 Ministry of Finance Department of Economic Affairs Economic Division MONTHLY ECONOMIC REPORT JUNE 2018 ***** HIGHLIGHTS The growth of GDP at constant prices for the fourth quarter of
4(8)/Ec. Dn. /2017 Ministry of Finance Department of Economic Affairs Economic Division MONTHLY ECONOMIC REPORT JUNE 2018 ***** HIGHLIGHTS The growth of GDP at constant prices for the fourth quarter of
Axis Corporate Debt Fund. (An open ended debt scheme predominantly investing in AA+ and above rated corporate bonds)
") Axis Corporate Debt Fund (An open ended debt scheme predominantly investing in AA+ and above rated corporate bonds) Macro economic indicators are showing signs of stability Indicator Current* Outlook Inflation
Axis Corporate Debt Fund (An open ended debt scheme predominantly investing in AA+ and above rated corporate bonds) Macro economic indicators are showing signs of stability Indicator Current* Outlook Inflation
Monetary Policy in India
 Monetary Policy in India Deepak Mohanty Executive Director Reserve Bank of India September 16, 2013 1 I. Objective(s) An Outline II. III. IV. Policy Framework Operating Procedure Outcome V. Conclusion
SACU INFLATION REPORT. February 2016
 SACU INFLATION REPORT February 2016 The content of this publication is intended for general information only. While precaution is taken to ensure the accuracy of information, the SACU Secretariat shall
INFLATION ANALYSIS AND PRICE SITUATION
 8.9.8 INFLATION ANALYSIS AND PRICE SITUATION Annual Inflation. / / / /5 5/ /7* NCPI * Projected for FY /7 Year.5 Y-O-Y CPI Inflation 8... Inflation Projection for / (/7) A major objective of Nepal Rastra
Economic Outlook: Global and India. Ajit Ranade IEEMA T & D Conclave December 12, 2014
 Economic Outlook: Global and India Ajit Ranade IEEMA T & D Conclave December 12, 2014 Global scenario US expected to drive global growth in 2015 Difference from % YoY Growth October Actual October Projections
MonitorING Turkey ING BANK A.Ş. Further fiscal support in the Medium Term Plan. Emerging Markets 4 October 2017
 q ING BANK A.Ş. ECONOMIC RESEARCH GROUP MonitorING Turkey October 17 Emerging Markets October 17 USD/TRY MonitorING Turkey Further fiscal support in the Medium Term Plan In 17, accelerated spending and
18. Real gross domestic product
 18. Real gross domestic product 6 Percentage change from quarter to quarter 4 2-2 6 4 2-2 1997 1998 1999 2 21 22 Total Non-agricultural sectors Seasonally adjusted and annualised rates South Africa s real
Market Roundup. Chart M1: Sector-wise Growth Rate (%) in Production Petroleum. Fertilizers Natural Gas. Products -7.
 in Production Petroleum. Fertilizers Natural Gas. Products -7.") Macro-Economic Overview Market Roundup Domestic Macroeconomic Development After a robust first quarter, the Indian economy experienced a tepid growth in the next three months of the fiscal, as is evident
Macro-Economic Overview Market Roundup Domestic Macroeconomic Development After a robust first quarter, the Indian economy experienced a tepid growth in the next three months of the fiscal, as is evident
Valentyn Povroznyuk, Radu Mihai Balan, Edilberto L. Segura
 September 214 GDP grew by 1.2% yoy in Q2 214. Industrial output growth was equal to 1.4% yoy in June 214. The consolidated budget deficit narrowed to.2% of GDP in January-July 214. Consumer inflation slightly
Market Roundup. Chart M1: Sectro-wise Growth Rate (%) in Production Steel. Petroleum. Fertilizers. Products
 in Production Steel. Petroleum. Fertilizers. Products") Market Roundup Macro-Economic Overview Domestic Macroeconomic Development In a major move towards addressing the non-performing assets (NPA) problem in the banking system, the Government of India announced
Market Roundup Macro-Economic Overview Domestic Macroeconomic Development In a major move towards addressing the non-performing assets (NPA) problem in the banking system, the Government of India announced
Ministry of Finance Department of Economic Affairs Economic Division 4(8)/Ec. Dn. /2017 MONTHLY ECONOMIC REPORT OCTOBER 2017 *****
/Ec. Dn. /2017 MONTHLY ECONOMIC REPORT OCTOBER 2017 *****") Ministry of Finance Department of Economic Affairs Economic Division 4(8)/Ec. Dn. /2017 MONTHLY ECONOMIC REPORT OCTOBER 2017 ***** HIGHLIGHTS The growth rate of Gross Domestic Product (GDP) at constant
Ministry of Finance Department of Economic Affairs Economic Division 4(8)/Ec. Dn. /2017 MONTHLY ECONOMIC REPORT OCTOBER 2017 ***** HIGHLIGHTS The growth rate of Gross Domestic Product (GDP) at constant
Market Roundup. Chart M1: Sector-wise Growth Rate (%) in Production Petroleum. Fertilizers. Products
 in Production Petroleum. Fertilizers. Products") Macro-Economic Overview Market Roundup Domestic Macroeconomic Development The International Monetary Fund's (IMF) bi-annual publication, World Economic Outlook (WEO), has projected India's growth to emerge
Macro-Economic Overview Market Roundup Domestic Macroeconomic Development The International Monetary Fund's (IMF) bi-annual publication, World Economic Outlook (WEO), has projected India's growth to emerge
Amount raised from Primary Market. Turnover in Secondary Market
 ISMR Debt Market 70 5. Debt Market Introduction 1 The debt market in India consists of mainly two categories the government securities or the g-sec markets comprising central government and state government
Asia Bond Monitor June 2018
 September 8 asianbondsonline.adb.org Key Developments in Asian Local Currency Markets Japan s industrial production fell.% on a month-on-month (m-o-m) basis but rose.% on a year-on-year (y-o-y) basis in
The real change in private inventories added 0.15 percentage points to the second quarter GDP growth, after subtracting 0.65% in the first quarter.
 QIRGRETA Monthly Macroeconomic Commentary United States The U.S. economy rebounded in the second quarter of 2007, growing at an annual rate of 3.4% Q/Q (+1.8% Y/Y), according to the GDP advance estimates
Market Outlook. Nifty % Sensex %
 Market Outlook 22000 BSE NSE 6500 Key Indices 30-Apr-13 31-Mar-13 % Change 21000 20000 19000 18000 17000 16000 15000 6000 5500 5000 4500 4000 3500 Nifty 5930.20 5682.55 4.36% Sensex 19504.18 18835.77 3.55%
STCI Primary Dealer Ltd
 Impact of SLR cut on G-Sec appetite December 30, 2010 Meghna Patel meghna@stcipd.com 022 66202229 The financial year 2010-11 has been a year of steady transformations for the bond market. Transformations
04 CHAPTER. Prices and Inflation
 Prices and Inflation 04 CHAPTER Inflation in the country continued to moderate during 2017-18. CPI based headline inflation averaged 3.3 per cent during April-December 2017-18, the lowest in the last six
November 21, Economic Intelligence Unit Baroda Corporate Center Bank of Baroda Mumbai Indian Economic Briefs
 Economic Intelligence Unit Baroda Corporate Center Bank of Baroda Mumbai eiu.bcc@bankofbaroda.com November 21, 2015 Weekly Macro Perspectives --------------------------------------------------------------------------------------------------------------------------------------
CANARA ROBECO MEDIUM TERM OPPORTUNITIES FUND FEBRUARY 2018
 CANARA ROBECO MEDIUM TERM OPPORTUNITIES FUND FEBRUARY 2018 This product is suitable for investors who are seeking* Income/Capital appreciation over medium to long-term Investment in Debt and Money Market
REFERENCE NOTE. No. 28/RN/Ref./November /2013
 LOK SABHA SECRETARIAT PARLIAMENT LIBRARY AND REFERENCE, RESEARCH, DOCUMENTATION AND INFORMATION SERVICE (LARRDIS) MEMBERS REFERENCE SERVICE REFERENCE NOTE. No. 28/RN/Ref./November /2013 For the use of
MONETARY POLICY COMMITTEE STATEMENT FOR FIRST QUARTER Governor s Presentation to the Media. 16 th May, 2018
 1 MONETARY POLICY COMMITTEE STATEMENT FOR FIRST QUARTER 2018 Governor s Presentation to the Media 16 th May, 2018 INTRODUCTION 2 The presentation is structured as follows: 1. Decision of the Monetary Policy
Results of the Survey of Professional Forecasters on Macroeconomic Indicators Round 44 1
 Results of the Survey of Professional Forecasters on Macroeconomic Indicators Round 44 1 In the 44 th round of the Survey of Professional Forecasters, output growth for 2016-17 measured by gross value
Wholesale Debt Market Segment 5
 Wholesale Debt Market Segment 5 60 Wholesale Debt Market Segment 5 The Exchange started its trading operations in June 1994 by enabling the Wholesale Debt Market (WDM) segment of the Exchange. This segment
Amount raised from Primary Market. Turnover in Secondary Market
 ISMR Debt Market 64 5. Debt Market Introduction The debt market in India consists of mainly two categories the government securities or the g-sec markets comprising central government and state government
MONETARY POLICY COMMITTEE STATEMENT FOR THIRD QUARTER Governor s Presentation to the Media. 22 nd November, 2017
 1 MONETARY POLICY COMMITTEE STATEMENT FOR THIRD QUARTER 2017 Governor s Presentation to the Media 22 nd November, 2017 INTRODUCTION 2 The presentation is structured as follows: 1. Decision of the Monetary
Republic of Korea. Yield Movements
 Republic of Korea 101 Republic of Korea Yield Movements Between 1 September and 31 October, local currency (LCY) government bond yields in the Republic of Korea rose for all tenors (Figure 1). The rise
APPENDIX: A SNAPSHOT OF INDONESIAN ECONOMIC INDICATORS
 APPENDIX: A SNAPSHOT OF INDONESIAN ECONOMIC INDICATORS Appendix Figure : Quarterly and annual GDP growth (percent growth) Appendix Figure : Contributions to GDP expenditures (quarter-on-quarter, seasonally
BANK OF UGANDA MONTHLY ECONOMIC REVIEW
 BANK OF UGANDA MONTHLY ECONOMIC REVIEW JANUARY 2010 MONTHLY REPORT ON ECONOMIC AND MONETARY DEVELOPMENTS AS AT December 30, 2009 RESEARCH DEPARTMENT BANK OF UGANDA ii TABLE OF CONTENTS TABLE OF CONTENTS.i
Wholesale Debt Market Segment 5
 Wholesale Debt Market Segment 5 64 Wholesale Debt Market Segment 5 The Exchange started its trading operations in June 1994 by enabling the Wholesale Debt Market (WDM) segment of the Exchange. This segment
Government Cash Balances - Linkages with Liquidity
 Amol Agrawal amol@stcipd.com +91-22-6622234 Government Cash Balances - Linkages with Liquidity We have been releasing reports in the nature of primers on RBI s operations and accounts (Refer Guide to Weekly
SACU INFLATION REPORT. February 2017
 SACU INFLATION REPORT February 2017 The content of this publication is intended for general information only. While precaution is taken to ensure the accuracy of information, the SACU Secretariat shall
Indian Economy. Industrial production slowed down in June 2016 on a year-on-year basis
 Indian Economy Industrial Production Industrial production slowed down in June 2016 on a year-on-year basis Despite a rise in industrial production growth to 2.1% in June 2016 from 1.1% (revised downward
QUARTERLY ECONOMIC REVIEW (QER)
") QUARTERLY ECONOMIC REVIEW (QER) Volume 2 No 4 January - March 2018 OBJECTIVES OF THE CENTRAL BANK OF KENYA The principal objectives of the Central Bank of Kenya (CBK) as established in the CBK Act are:
QUARTERLY ECONOMIC REVIEW (QER) Volume 2 No 4 January - March 2018 OBJECTIVES OF THE CENTRAL BANK OF KENYA The principal objectives of the Central Bank of Kenya (CBK) as established in the CBK Act are:
RBI Monetary Policy Update - RBI maintains the neutral stance with cautious outlook on inflation and growth
 RBI Monetary Policy Update - RBI maintains the neutral stance with cautious outlook on inflation and growth In the latest policy meeting, the RBI kept the key policy rate unchanged at 6% and maintained
(Narendra Jena) Economic Officer
 Economic Officer") Ministry of Finance Department of Economic Affairs Economic Division 4(3)/Ec. Dn. /2012 MONTHLY ECONOMIC REPORT DECEMBER 2016 ***** HIGHLIGHTS As per the first revised estimates of national income, consumption
Ministry of Finance Department of Economic Affairs Economic Division 4(3)/Ec. Dn. /2012 MONTHLY ECONOMIC REPORT DECEMBER 2016 ***** HIGHLIGHTS As per the first revised estimates of national income, consumption
Fifth Bi-monthly Monetary Policy Statement, Resolution of the Monetary Policy Committee (MPC) Reserve Bank of India*
 Reserve Bank of India*") Fifth Bi-monthly Monetary Policy Statement, 2017-18 Resolution of the Monetary Policy Committee (MPC) Reserve Bank of India* On the basis of an assessment of the current and evolving macroeconomic situation
Fifth Bi-monthly Monetary Policy Statement, 2017-18 Resolution of the Monetary Policy Committee (MPC) Reserve Bank of India* On the basis of an assessment of the current and evolving macroeconomic situation
FIXED INCOME UPDATE 1
 1 FIXED INCOME UPDATE Abstract Rates are headed down on lower inflation Inflation is likely to hit the RBI s disinflationary path Bond yields may further fall on continuation of rate cuts Macro conditions
4(8)/Ec. Dn. /2017 Ministry of Finance Department of Economic Affairs Economic Division MONTHLY ECONOMIC REPORT NOVEMBER 2018 ***** HIGHLIGHTS
/Ec. Dn. /2017 Ministry of Finance Department of Economic Affairs Economic Division MONTHLY ECONOMIC REPORT NOVEMBER 2018 ***** HIGHLIGHTS") 4(8)/Ec. Dn. /2017 Ministry of Finance Department of Economic Affairs Economic Division MONTHLY ECONOMIC REPORT NOVEMBER 2018 ***** HIGHLIGHTS The growth of real GDP for the first half of 2018-19 was 7.6
4(8)/Ec. Dn. /2017 Ministry of Finance Department of Economic Affairs Economic Division MONTHLY ECONOMIC REPORT NOVEMBER 2018 ***** HIGHLIGHTS The growth of real GDP for the first half of 2018-19 was 7.6
Asia Bond Monitor November 2018
 January 9 asianbondsonline.adb.org Key Developments in Asian Local Currency Markets Japan s November industrial production was revised upward to.% year-on-year (y-o-y) from the preliminary estimate of.%
MONTHLY UPDATE FEBRUARY 2018
 MONTHLY UPDATE FEBRUARY 2018 February 2018 One of the reasons so many people get burned in the market is because they start buying as they see prices going up. Equity Markets - Robert Kiyosaki Indices
Real Effective Exchange Rate based on CPI as Price Index for India*
 Real Effective Exchange Rate based on CPI as Price Index for India ARTICLE Real Effective Exchange Rate based on CPI as Price Index for India* Effective exchange rates are summary indicators of movements
SBI DYNAMIC BOND FUND
 SBI DYNAMIC BOND FUND This product is suitable for investors who are seeking: Investment in debt and money- market securities Regular income for medium term Moderate risk SBI Dynamic Bond Fund Disclaimer:
RBI hikes repo rate in Third Bi-monthly Monetary Policy Statement,
 RBI hikes repo rate in Third Bi-monthly Monetary Policy Statement, -19 Policy repo rate increased to 6.50 and the reverse repo rate under the LAF stands at 6.25 On the basis of an assessment of the current
ACUMEN. Life of CPI. Three Year Average Inflation
 Life of CPI Monetary policy in India has shifted decisively to using the Consumer Price Index (CPI) based inflation rather than Wholesale Price inflation since September 2013. We look at the history of
MONTHLY UPDATE APRIL 2018
 MONTHLY UPDATE APRIL 2018 April 2018 The stock market is the story of cycles and of the human behavior that is responsible for overreactions in both directions. Equity Markets - Seth Klarman Indices 28
Debt Management and Sustainability: Strengthening Liability Management
 Debt Management and Sustainability: Strengthening Liability Management Sri Lankan Perspective 27 February 2018 Colombo, Sri Lanka C J P Siriwardana Deputy Governor 2 Overview 1. Evolution of Public Debt
RBI's Annual Monetary Policy
 Amol Agrawal amol@stcipd.com +91-22-66202234 RBI's Annual Monetary Policy 2012-13 In Annual Monetary Policy 2012-13, RBI surprised markets by easing Repo rate by 50 bps to 8%. The consensus market expectations
О КЛЮЧЕВОЙ СТАВКЕ RUSSIAN ECONOMIC OUTLOOK AND CHALLENGES TO MONETARY POLICY. December Bank of Russia Presentation for Investors
 О КЛЮЧЕВОЙ СТАВКЕ RUSSIAN ECONOMIC OUTLOOK AND CHALLENGES TO MONETARY POLICY Bank of Russia Presentation for Investors December 16 USD per barrel RUB / USD 2 Oil Eхporters Production-cut Agreements Support
II. FISCAL SITUATION
 II. FISCAL SITUATION Combined Government Finances: 2006-07 With the resumption of fiscal consolidation process at the Centre in terms of the Fiscal Responsibility and Budget Management (FRBM) Rules, 2004
Indian Economy. Fig1: Industrial Output Growth from May 2014
 Indian Economy Industrial Production Industrial production surged to 13-month high in Nov 2016 After several months of subdued or negative growth, industrial production in India jumped to 5.7% year-on-year
2018 The year of promise
 2018 The year of promise January 2018 Tushar Pradhan, Chief Investment Officer We have come a long way in 2017 Source: Kotak Institutional Equities Dec 2017 Key events and performance of the Indian market
Buoyancy in industrial sector growth continues. This year s first quarter IIP growth is at 10.3% compared to 7.7% in
 Prepared by N. R. Bhanumurthy August 25 Buoyancy in industrial sector growth continues. This year s first quarter IIP growth is at 1.3% compared to 7.7% in 24-5. TOP STORIES The index of industrial production
Survey of Professional Forecasters on Macroeconomic Indicators Results of the 47 th Round 1
 Survey of Professional Forecasters on Macroeconomic Indicators Results of the 47 th Round 1 ----------------------------------------------------------------------------------------------------------------------
Weekly Macroeconomic Review
 20/12/2011 Weekly Macroeconomic Review Expectations derived from the capital market Our forecast Inflation in the coming months Future cumulative inflation next 12 CPIs (through November 2012 CPI) Inflation
Monetary Policy Report
 CENTRAL BANK OF THE GAMBIA Monetary Policy Report November 20 The Central Bank of The Gambia Monetary Policy Report provides summary of reports presented at the Monetary Policy Committee Meeting. It entails
Exports decline 4.7% during Rising rupee a concern for exporters
 Exports decline 4.7% during 2009-10 Rising rupee a concern for exporters India s merchandise exports for the fiscal year 2009-10, declined by 4.7% from around US$ 184 billion at the end of 2008-09 to US$
1 RED June/July 2018 JUNE/JULY 2018
 1 RED June/July 20 JUNE/JULY 20 2 RED June/July 20 MAJOR HIGHLIGHTS Headline consumer inflation grew by 4.9 per cent in June 20 compared to 4.8 per cent recorded in May 20 Inflation rate (% y/y) 4.9 (June)