REVIEWED FINANCIAL RESULTS AUDITED FINANCIAL RESULTS. For the year ended 30 June 2011
|
|
|
- Noah Garrison
- 5 years ago
- Views:
Transcription

1 REVIEWED FINANCIAL RESULTS AUDITED FINANCIAL RESULTS For the year ended 30 June 2011

2 Contents page Highlights Louwtjie Nel 3 Sustainable development Health, safety and environmental Transformation Management continuity Operational review Building and civil engineering Roads and earthworks Australia Other operations Louwtjie Nel Paul Foley Kobie Botha Mike Wylie Charles Henwood 8 Financial overview John Abbott 84 Prospects Group order book Project pipeline Conclusion Questions Louwtjie Nel 98 WBHO Overview


3 FY11 HIGHLIGHTS & COMMENT
4 THE YEAR IN PERSPECTIVE
5 COMPETITION COMMISSION
6 FINANCIAL HIGHLIGHTS FINANCIAL PERFORMANCE AND KEY RATIOS % change AUDITED FY11 Audited FY10 Revenue () 3% Operating profit before non-trading items () 14% Margin 12% 7,4% 8,4% Earnings per share (cents) 24% Headline earnings per share (cents) 20% Dividend per share (cents) 0%


7 SEGMENTAL ANALYSIS REVENUE CONTRIBUTION Other Operations R305m 2% Building & Civil Eng R4,378m 30% Other Operations R587m 4% Building & Civil Eng R5,470m 36% FY2011 R14,767m FY2010 R15,201m Australia R5,973m 40% Roads & Earthworks R4,111m 28% Australia R4,534m 30% Roads & Earthworks R4,610m 30%


8 SEGMENTAL ANALYSIS GEOGRAPHIC SPREAD Africa R1,686m 12% South Africa R7,108m 48% Africa R975m 6% South Africa R9,692m 64% FY2011 R14,767m FY2010 R15,201m Australia R5,973m 40% Australia R4,534m 30%


9 SUSTAINABLE DEVELOPMENT
10 SUSTAINABLE DEVELOPMENT
11 SUSTAINABLE DEVELOPMENT
12 SUSTAINABLE DEVELOPMENT SENIOR MANAGEMENT No. Average years of service Average age Average years of experience Exco Regional managing directors Divisional directors Alternate divisional directors TOTAL


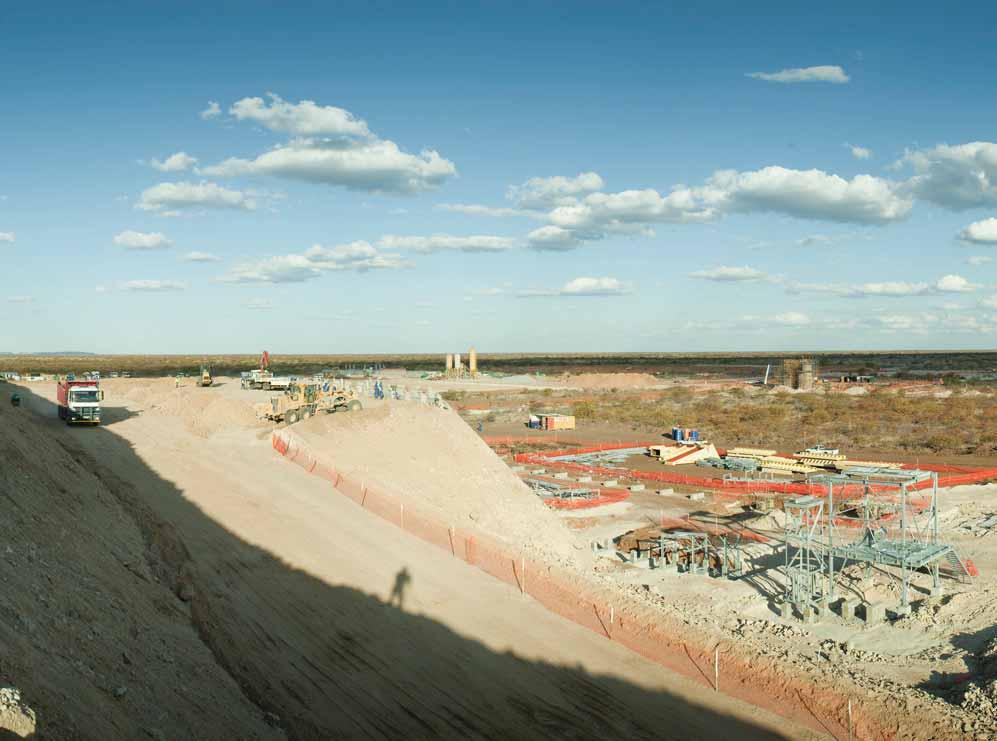
13 OPERATIONAL REVIEW


14 BUILDING AND CIVIL ENGINEERING
15 BUILDING AND CIVIL ENGINEERING PERFORMANCE
16 BUILDING AND CIVIL ENGINEERING PERFORMANCE Revenue contribution % AUDITED FY11 Audited FY10 Revenue 20 4,377 5,470 Operating profit Margin 7,6% 7,9% Operating profit contribution
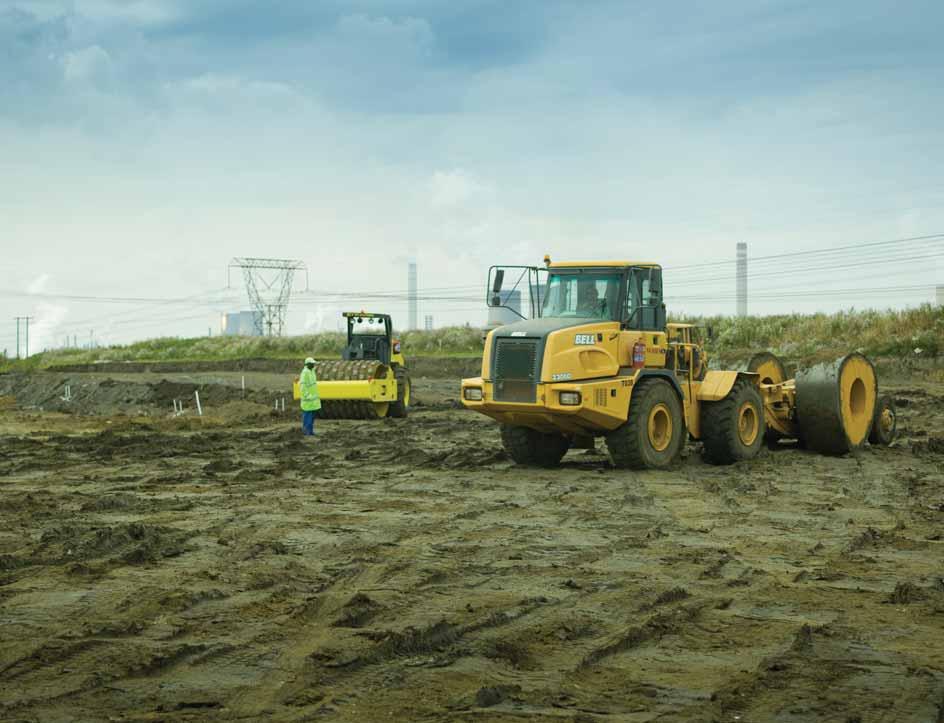

17 ROADS AND EARTHWORKS
18 ROADS AND EARTHWORKS PERFORMANCE


19 ROADS AND EARTHWORKS PERFORMANCE Revenue contribution % AUDITED FY11 Audited FY10 Revenue 11 4,111 4,610 Operating profit Margin 12,7% 13,7% Operating profit contribution


20 AUSTRALIA
21 AUSTRALIA PERFORMANCE


22 AUSTRALIA PERFORMANCE Revenue contribution % AUDITED FY11 Audited FY10 Revenue 33 5,973 4,534 Operating profit Margin 2,9% 3,6% Operating profit contribution
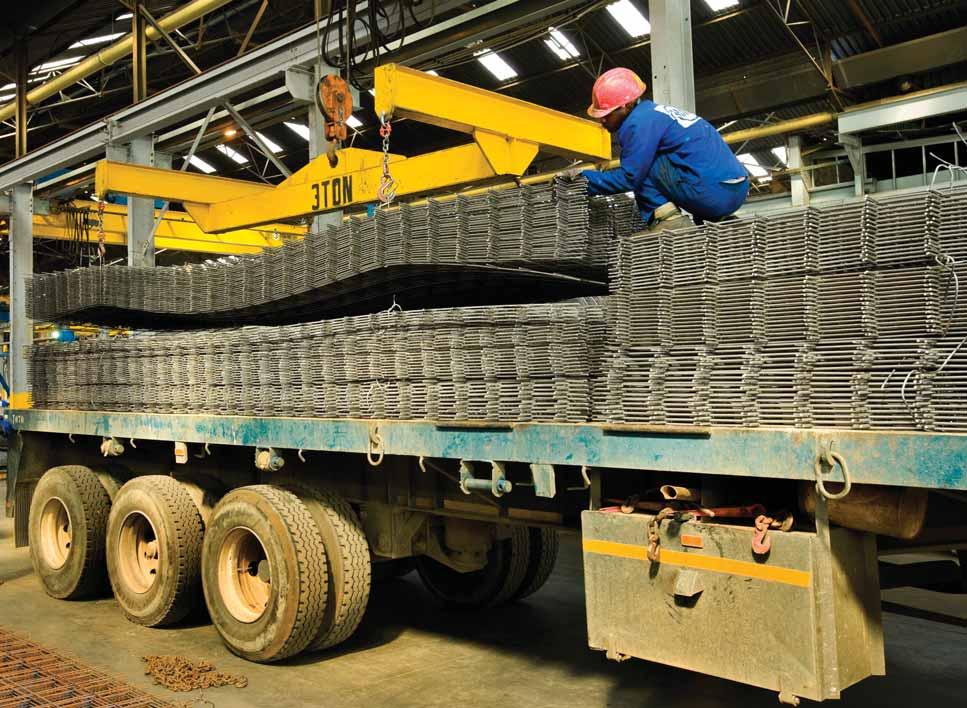

23 OTHER OPERATIONS

24 OTHER OPERATIONS PERFORMANCE Revenue contribution % AUDITED FY11 Audited FY10 Revenue Operating profit Margin 20,1% 10,6% Operating profit contribution

 Shareholder interest")
 (76) Impairment of loan")
25 OTHER OPERATIONS CAPITAL AFRICA STEEL Revenue mix AUDITE D FY11 Audited FY10 Revenue Profit before interest 12 (13) Shareholder interest (89) (89) Other interest (15) (15) Loss after tax (78) (76) Impairment of loan - WBHO (66) -


26 FINANCIAL OVERVIEW
27 FINANCIAL OVERVIEW STATEMENT OF FINANCIAL PERFORMANCE AUDITED FY11 Audited FY10 Revenue ()
28 FINANCIAL OVERVIEW STATEMENT OF FINANCIAL PERFORMANCE % change AUDITED FY11 Audited FY10 Revenue () Operating profit before non-trading items ()
29 FINANCIAL OVERVIEW STATEMENT OF FINANCIAL PERFORMANCE % change AUDITED FY11 Audited FY10 Revenue () Operating profit before non-trading items () Fair value adjustments to investments - 3 Impairment of goodwill (36) - Impairment of goodwill in Roadspan P/L arising from the initial 70% acquired Remaining 30% acquired in FY11 Company profitable old loss-making contracts now worked out of results Conservative valuation led to impairment
30 FINANCIAL OVERVIEW STATEMENT OF FINANCIAL PERFORMANCE % change AUDITED FY11 Audited FY10 Revenue () Operating profit before non-trading items () Fair value adjustments to investments - 3 Impairment of goodwill (36) - Impairment of loan to associate (66) - Loan to Capital Africa Steel P/L impaired at interim reporting period No further impairment considered necessary Pipe factory profitable but not yet at full capacity RMS at full capacity - June profits exceeding expectations Overall group profitable at EBITDA Capital structure currently being examined
31 FINANCIAL OVERVIEW STATEMENT OF FINANCIAL PERFORMANCE % change AUDITED FY11 Audited FY10 Revenue () Operating profit before non-trading items () Fair value adjustments to investments - 3 Impairment of goodwill (36) - Impairment of loan to associate (66) - Profit /loss on disposal of investment 58 (6) Disposal of non-controlling interest in Bakwena Platinum Concession Company Proceeds of R86m Cost plus fair value adj amounted to R28m
32 FINANCIAL OVERVIEW STATEMENT OF FINANCIAL PERFORMANCE % change AUDITED FY11 Audited FY10 Revenue () Operating profit before non-trading items () Fair value adjustments to investments - 3 Impairment of goodwill (36) - Impairment of loan to associate (66) - Profit /loss on disposal of investment 58 (6) Share based payment expense (32) (9) R13m relates to Akani WBHO share scheme R19m relates to Edwin Construction P/L cash settled scheme anticipated cash settlement to be recognised as an expense
33 FINANCIAL OVERVIEW STATEMENT OF FINANCIAL PERFORMANCE % change AUDITED FY11 Audited FY10 Revenue () Operating profit before non-trading items () Fair value adjustments to investments - 3 Impairment of goodwill (36) - Impairment of loan to associate (66) - Profit /loss on disposal of investment 58 (6) Share based payment expense (32) (9) Operating profit Net investment income Share profits and losses in associates (51) (30) Profit before tax
34 FINANCIAL OVERVIEW STATEMENT OF FINANCIAL PERFORMANCE % change AUDITED FY11 Audited FY10 Revenue () Operating profit before non-trading items () Fair value adjustments to investments - 3 Impairment of goodwill (36) - Impairment of loan to associate (66) - Profit /loss on disposal of investment 58 (6) Share based payment expense (32) (9) Operating profit Net investment income Share profits and losses in associates (51) (30) Profit before tax Taxation (380) (467) Profit for the year

35 FINANCIAL OVERVIEW CASH FLOW AND RELATED RATIOS % change AUDITED FY11 Audited FY10 Cash generated from operations 68% Operating profit adjusted for non-cash items R1 233 Working capital changes (R 888)
36 FINANCIAL OVERVIEW CASH FLOW AND RELATED RATIOS % change AUDITED FY11 Audited FY10 Cash generated from operations 68% Cash on hand 26% Dividend cover (times) 23% 4,1 5,3 Acquisitions 22%
37 FINANCIAL OVERVIEW ACQUISITIONS % South Africa Renniks Construction P/L 60 Non-controlling interests Roadspan P/L Insitu Pipelines P/L 30 30
38 FINANCIAL OVERVIEW ACQUISITIONS % Australia Monaco Hickey P/L 60 Contexx P/L 50 CARR Civil Contracting P/L 51 Non-controlling interests Probuild CECK P/L 5 15
39 FINANCIAL OVERVIEW CAPEX APPROVED FY11 SPEND FY10 APPROVED FY10 Replacement Additions Special projects TOTAL

40 PROSPECTS
41 PROSPECTS ORDER BOOK ORDER BOOK SUMMARY Total Awards after 30 June Total /14 Building and civil engineering Roads and earthworks Australia Other Operations Less: utilised (2407) (2407) TOTAL FY % FY11 Revenue 137% - 110% 85% 25% TOTAL FY
42 PROSPECTS EPC CAPABILITIES
43 PROSPECTS EPC CAPABILITIES
44 PROSPECTS MARKET OVERVIEW
45 PROSPECTS PROJECT PIPELINE BUILDING Private Casinos Retail Hospitals Office developments Other Public Education Hospitals (Excl PPPs) PPPs TOTAL
46 PROSPECTS PROJECT PIPELINE CIVIL ENGINEERING South Africa Mining infrastructure ESKOM 460 Private Power Water Works Rest of Africa Mining infrastructure Ports 440 Power TOTAL 8 494
47 PROSPECTS PROJECT PIPELINE ROADS AND EARTHWORKS South Africa Roads SANRAL / Provincial / Toll Mining infrastructure Water storage / treatment / reticulation ESKOM Rest of Africa Mining Ports / Industrial / Water TOTAL
48 PROSPECTS PROJECT PIPELINE AUSTRALIA Retail Residential Commercial Healthcare Education Government Civil (QLD) 300 CECK (WA) 450 CARR (WA) TOTAL
49 PROSPECTS PROJECT PIPELINE PROJECT PIPELINE SUMMARY Building and civil engineering Roads and Earthworks Australia TOTAL
50 CONCLUSION
51 DISCLAIMER
WBHO AUDITED RESULTS 2013 AUDITED RESULTS
 2013 AUDITED RESULTS CONTENTS 2 CONTENTS SUBJECT PRESENTER 1. Welcome Louwtjie Nel 2. Operating context and financial highlights Louwtjie Nel 3. Operational review Roads and earthworks Building and civil
GOVERNANCE AND REMUNERATION REVIEW CONTINUED
 46 REMUNERATION REPORT Remuneration within WBHO is aligned to corporate strategy and in adherence to the principles set out in King III, the requirements of the Companies Act of South Africa in relation
Period overview Operational Overview Financial Results Conclusion
 Interim Results Six months ended 31 ust 2015 Bridging y expectations Agenda Period overview Operational Overview Financial Results Conclusion Bridging y expectations 2 1 Six month overview Satisfactory
HIGHLIGHTS. Contribution by Segment (%) Contribution by Geography (%) Operating profit. Revenue. Operating profit. Revenue 37% 37% 12%
 Contribution by Geography (%) Operating profit. Revenue. Operating profit. Revenue 37% 37% 12%") AUDITED RESULTS 2016 HIGHLIGHTS Contribution by Segment (%) Revenue Operating profit 2 4 25 59 2016 2013 37% 14 30 2016 2013 38 37% 12% 28 Building and civil engineering Building and civil engineering
AUDITED RESULTS 2016 HIGHLIGHTS Contribution by Segment (%) Revenue Operating profit 2 4 25 59 2016 2013 37% 14 30 2016 2013 38 37% 12% 28 Building and civil engineering Building and civil engineering
STATEMENT OF RESPONSIBILITY BY THE BOARD
 AUDITED CONSOLIDATED FINANCIAL STATEMENTS FOR THE YEAR ENDED 30 JUNE 2 STATEMENT OF RESPONSIBILITY BY THE BOARD for the year ended 30 June The directors are responsible for the preparation, integrity and
Annual Results. 12 months ended 28 February Agenda
 Annual Results 28 ruary 2015 Bridging y expectations Agenda 2015 2014 2 1 12 month overview Phase 1 of turnaround strategy successfully implemented Closed-out problem contracts Closed non-performing Power
FINANCIAL PERFORMANCE
 30 WBHO INTEGRATED REPORT 2012 ECONOMIC PERFORMANCE The Chief Financial Officer s report FINANCIAL PERFORMANCE We have identified the above financial indicators* as being critical to the growth and maximisation
AUDITED RESULTS 2015
 www.wbho.co.za AUDITED RESULTS HIGHLIGHTS Contribution by Segment Revenue 15% to R29,5 billion : R25,7 billion 51% 52% Revenue 5% 2013 25% 37% 18% 1% 51% 48% 5% 2013 12% 46% 37% Building and civil engineering
GOVERNANCE AND REMUNERATION REVIEW
 44 GOVERNANCE AND REMUNERATION REVIEW This section of the report presents the corporate governance and remuneration practices of the group for the reporting period. This year, key governance tasks have
Interim Results. Six months ended 31 August 2016
 Interim Results Six months ended 31 August 2016 Stefanutti Stocks City A multi-disciplinary construction group (Vision) (Mission) 2 www.stefanuttistocks.com y 2 Agenda Six month overview Operational Overview
* In terms of revised accounting standards, the R91m discount arising on the issue of shares to
 Annexure Interim Results Summary 1 R Year-end June Income Statement H1 27 Unaudited H2 26 Unaudited H1 26 Unaudited as restated Revenue 4 4 824 2 955 4 2 99 321 Operating margin % Operating profit 3,4%
12 month overview. Operational Overview. Financial Results. Conclusion
 Annual Results 12 months ended 29 ruary 2016 Agenda 12 month overview Operational Overview Financial Results Conclusion 2 1 12 month overview Reasonable financial performance in current market All Business
AUDITED SUMMARY CONSOLIDATED FINANCIAL STATEMENTS FOR THE PERIOD ENDED 30 JUNE 2017 HIGHLIGHTS. REVENUE 2017: R31,9 billion 2016: R30,7 billion
 WILSON BAYLY HOLMES-OVCON LIMITED (Incorporated in the Republic of South Africa) (Registration number: 1982/011014/06) Share code: WBO ISIN: ZAE000009932 ("WBHO") AUDITED SUMMARY CONSOLIDATED FINANCIAL
Wilson Bayly Holmes-Ovcon Ltd
 Wilson Bayly Holmes-Ovcon Ltd 28 September 2017 Disclaimer The information and content made available through this webinar is provided by PSG as general information about the companies and their products
Unaudited interim results
 Unaudited interim results for the six months ended 31 August 2018 Raubex Group Limited (Incorporated in the Republic of South Africa) Registration number 2006/023666/06 Share code: RBX ISIN: ZAE000093183
Watpac Limited. 30 June 2018 Full Year Results Presentation. 23 August 2018
 Watpac Limited 30 June 2018 Full Year Results Presentation 23 August 2018 Full year group snapshot Capital Earnings Asset Values Work-in-hand Strategy Strong liquidity maintained Full repayment of equipment
WBHO.CO.ZA AUDITED SUMMARY CONSOLIDATED FINANCIAL STATEMENTS FOR THE YEAR ENDED 30 JUNE 2018
 WBHO.CO.ZA AUDITED SUMMARY CONSOLIDATED FINANCIAL STATEMENTS FOR THE YEAR ENDED 30 JUNE Revenue CONTRIBUTION BY SEGMENT (%) HIGHLIGHTS 63 1 21 15 Building and civil engineering Roads and earthworks Australia
Audited annual results
 Audited annual results for the year ended 28 February 2017 Raubex Group Limited (Incorporated in the Republic of South Africa) Registration number 2006/023666/06 JSE share code: RBX ISIN: ZAE000093183
AUDITED SUMMARY CONSOLIDATED FINANCIAL STATEMENTS FOR THE YEAR ENDED 30 JUNE
 www.wbho.co.za AUDITED SUMMARY CONSOLIDATED FINANCIAL STATEMENTS FOR THE YEAR ENDED 30 JUNE 2017 A AUDITED SUMMARY CONSOLIDATED FINANCIAL STATEMENTS AUDITED SUMMARY CONSOLIDATED FINANCIAL STATEMENTS B
Agenda. The Year in Review Group Financial Highlights Financial Review Divisional Review Order Book Acquisitions Major Projects Progress Conclusion
 Agenda The Year in Review Group Financial Highlights Financial Review Divisional Review Order Book Acquisitions Major Projects Progress Conclusion The Year in Review Satisfactory performance given market
Calibre Group FY18 Full Year Results. September 2018
 Calibre Group FY18 Full Year Results September 2018 Group Overview Operating cash flow up 110% Increased revenue up 25% Strategic divestment of G&S finalised Strong forward FY19 order book $420m FY2018
NRW HOLDINGS LIMITED ANNUAL GENERAL MEETING 28 th November 2012
 NRW HOLDINGS LIMITED 2012 ANNUAL GENERAL MEETING 28 th November 2012 DISCLAIMER AND IMPORTANT NOTICE 2 Information, including forecast financial information in this presentation should not be considered
For personal use only
 23 August 2013 Full Year Results June 2013 We attach an Investor Presentation for the FY13 Full Year Results. As previously announced, a results briefing for analysts will be held at 10:30am Sydney time
TRELLIDOR HOLDINGS LIMITED UNAUDITED INTERIM RESULTS FOR THE SIX MONTHS ENDED 31 DECEMBER 2017
 TRELLIDOR HOLDINGS LIMITED UNAUDITED INTERIM RESULTS FOR THE SIX MONTHS ENDED 31 DECEMBER 2017 GROUP HIGHLIGHTS 5% Revenue 5% PAT 5% HEPS 35.2c 5% Interim dividend declared 11.0 cents per share Slide 2
R30,6 billion. R2,3 billion Strategic review resulted in a change in the measurement criteria and adjustment to non-core asset values.
 Aveng Group Salient features financial performance for the year ended 30 June 2018 Revenue R30,6 billion Increase mainly due to increased activity in McConnell Dowell and signs of improvement in commodities
Smart Company Analysis
 Wealth and Investment Management 16 May 2017 Smart Company Analysis equities@absa.co.za www.absastockbrokers.co.za Raubex Group Ltd Still some upside following stellar run although top-line growth will
2011 Interim Results. Keith Gordon, Managing Director & Chief Executive Officer Stephen Gobby, Chief Financial Officer
 2011 Interim Results Keith Gordon, Managing Director & Chief Executive Officer Stephen Gobby, Chief Financial Officer Emeco 2011 Interim Results Overview Financials Strategy & Outlook Questions Appendices
PRESENTATION TO FUND MANAGERS & FINANCIAL ANALYSTS. 25 November 2013
 1 PRESENTATION TO FUND MANAGERS & FINANCIAL ANALYSTS Business update 25 November 2013 2 Agenda 01 02 03 04 02 03 04 SECTION 1 SECTION 2 SECTION 3 SECTION 4 Focusing on growth Group Five business model
Final results presentation for the year ended 29 February Johannesburg 19 May 2016 Cape Town 23 May 2016
 Final results presentation for the year ended 29 February 2016 Johannesburg 19 May 2016 Cape Town 23 May 2016 Presentation coverage 1 2 3 4 5 6 Group overview Financial performance Operating review What
2018 HALF YEAR RESULTS
 NRW HOLDINGS 2018 HALF YEAR RESULTS Forrestfield-Airport Link, Perth WA 20 FEBRUARY 2018 RESULTS OVERVIEW Revenue of $345.3M (1) up 95% on the same period last year Underlying EBITDA(2) of $40.3M up 38%
Supplementary Data on Financial Results for 3rd Quarter (cumulative) of FY2016 Ending March February 14, 2017
 of FY2016 Ending March February 14, 2017") Supplementary Data on Financial Results for 3rd Quarter (cumulative) of FY2016 Ending March 2017 February 14, 2017 Contents Page 1 Construction business - Transition of orders received (non-consolidated)
Supplementary Data on Financial Results for 3rd Quarter (cumulative) of FY2016 Ending March 2017 February 14, 2017 Contents Page 1 Construction business - Transition of orders received (non-consolidated)
May 30, Analyst Presentation FY15
 May 30, 2015 Analyst Presentation FY15 Disclaimer This presentation contains certain forward looking statements concerning L&T s future business prospects and business profitability, which are subject
REPORT TO STAKEHOLDERS
 REPORT TO STAKEHOLDERS FOR THE YEAR ENDED 30 JUNE 2011 RECOVERY & GROWTH MEDUPI POWER STATION 2 Salient points FY2011 Summarised financial results Hot topics Group financials Purpose, values and vision
AVENG CAPITAL PARTNERS Investor conference 19 & 20 October 2015
 AVENG CAPITAL PARTNERS Investor conference 19 & 20 October 2015 AGENDA OVERVIEW PORTFOLIO PORTFOLIO VALUATION MARKET UPDATE STRATEGY VALUE PROPOSITION Q & A 2 3 OVERVIEW OVERVIEW Background to Aveng Capital
Larsen & Toubro Analyst Presentation H1 FY16 October 30, 2015
 Larsen & Toubro Analyst Presentation H1 FY16 October 30, 2015 Disclaimer This presentation contains certain forward looking statements concerning L&T s future business prospects and business profitability,
Interim Financial Report
 Interim Financial Report For Half Year Ended 31 December 2016 Table of Contents Page Results for Announcement to the Market Appendix 4D 2 Directors Report 3 Auditor s Independence Declaration 7 Consolidated
Transpacific FY15 Half Year Results Presentation
 Transpacific FY15 Half Year Results Presentation Robert Boucher CEO Brendan Gill CFO 20 February 2015 - Disclaimer Forward looking statements - This presentation contains certain forward-looking statements,
UNAUDITED INTERIM GROUP RESULTS. for the six months ended 31 December 2016
 2016 UNAUDITED INTERIM GROUP RESULTS for the six months ended 31 December 2016 WE CREATE INFRASTRUCTURE SOLUTIONS. CONTENTS GROUP FIVE UNAUDITED INTERIM GROUP RESULTS FOR THE SIX MONTHS ENDED 31 DECEMBER
Sales increased 8.1% to $128.0m (HY17: $118.4m) Increase assisted by sales from new stores opened in FY17 and HY18
 Increase assisted by sales from new stores opened in FY17 and HY18") Nick Scali Limited NCK.ASX Macquarie Conference 2nd May 2018 Key H1-18 Highlights Sales Sales increased 8.1% to $128.0m (HY17: $118.4m) Increase assisted by sales from new stores opened in FY17 and HY18
Nick Scali Limited NCK.ASX Macquarie Conference 2nd May 2018 Key H1-18 Highlights Sales Sales increased 8.1% to $128.0m (HY17: $118.4m) Increase assisted by sales from new stores opened in FY17 and HY18
Audited results. for the year ended 29 February 2016
 results for the year ended 29 February 2016 Raubex Group Limited (Incorporated in the Republic of South Africa) Registration number 2006/023666/06 Share Code: RBX ISIN Code: ZAE000093183 ( Raubex or the
LogiCamms Limited ABN
 ABN 90 127 897 689 Interim Financial Report 31 December 2015 1 Contents Page Directors report 3 Lead auditor s independence declaration 5 Condensed consolidated statement of financial position 6 Condensed
Full Year Results Presentation 30 June 2007
 Full Year Results Presentation 30 June 2007 FY2007 Summary Performance Dividend Acquisitions Safety Revenue - $350.0m increase of 38% EBITDA - $ 96.2m increase of 26% NPAT - $ 36.6m increase of 11% NPAT
6M2017 Group Results 14/9/2017
 6M2017 Group Results 14/9/2017 6M2017 highlights 6M2017 Highlights : in August 2017 construction at Olympia Odos and Maliakos was concluded, and the BOT projects are now fully operational in June 2017
Photo by James Ball - Coffey International Limited FY2013 Half Year Results Presentation. 11 February 2013
 Photo by James Ball - www.dlscape.com Coffey International Limited FY2013 Half Year Results Presentation 11 February 2013 Agenda Financial Performance Business Performance Outlook Presenters John Douglas
Strong start to the year with record partner signings in the USA
 Strong start to the year with record partner signings in the USA Good customer growth up 14% to 7.5m Group profit up 9% to 28.7m Group retention at 82% Adjusted profit before tax 1 ( m) 26.0 26.2 8.4 9.4
For personal use only
 NRW Holdings Limited (ASX: NWH) ABN 95 118 300 217 Interim Financial Report For the Half-Year Ended 31 December 2015 In t er im Fin an cial Rep o r t 1 APPENDIX 4D RESULTS FOR ANNOUNCEMENT TO THE MARKET
Investor Briefing RIGHT S O L U T I O N S RIGHT PARTNER. Singapore & United Kingdom April Greg Kilmister - CEO
 Investor Briefing Singapore & United Kingdom April 2013 Greg Kilmister - CEO RIGHT S O L U T I O N S RIGHT PARTNER IMPORTANT NOTICE AND DISCLAIMER This presentation has been prepared by ALS Limited, (ALS
INTEGRATED REPORT 2011
 INTEGRATED REPORT 2011 ABOUT THIS REPORT The objective of this report is to provide our stakeholders with an integrated view of our economic, social and environmental performance for the financial year
Barloworld Limited. Reviewed interim results to 31 March May 15, 2006
 Barloworld Limited Reviewed interim results to 31 March 2006 May 15, 2006 BARLOWORLD IS A DIVERSIFIED INDUSTRIAL COMPANY Over 26 000 people in 31 countries Barloworld s way of doing business - market-leading
For personal use only
 NRW Holdings Limited (ASX: NWH) ABN 95 118 300 217 For the Half-Year Ended 31 December 2014 220142013 1 APPENDIX 4D RESULTS FOR ANNOUNCEMENT TO THE MARKET For the Half-Year Ended 31 December 2014 NRW Holdings
Watpac Limited. 31 December 2016 Half Year Results Presentation. 16 February 2017
 Watpac Limited 31 December 2016 Half Year Results Presentation 16 February 2017 1H FY17 Group financial summary Construction earnings down; Civil & Mining improves and project funding capacity substantially
Netcare Limited Interim results presentation For the six months ended 31 March 2008
 1 Netcare Limited Interim results presentation For the six months ended 31 March 2008 Note regarding forward looking statements The Company advises investors that any forward looking statements or projections
enx Group Limited results presentation
 enx Group Limited results presentation for the year ended 31 August 2018 Disclaimer Certain statements in this presentation regarding enx s business operations may constitute forward looking statements.
TFG INTEGRATED ANNUAL REPORT ABOUT THIS REPORT INVESTMENT CASE OUR STRATEGY AND PERFORMANCE OUR PROFILE
 INVESTMENT CASE ABOUT THIS REPORT OUR OUR OPERATING ENVIRONMENT OUR STRATEGY AND PERFORMANCE Summary consolidated statement of financial position 140 Summary consolidated income statement 141 Summary consolidated
For personal use only
 Preliminary Final Report Appendix 4E Results for announcement to the market Pulse Health Limited (ACN 104 113 760) This Preliminary Final Report is provided to the Australian Securities Exchange (ASX)
INTERIM RESULTS 31 DECEMBER 2014
 INTERIM RESULTS 31 DECEMBER 2014 DEVELOPING OUR PORTFOLIO DELIVERING ON STRATEGY 26 February 2015 David Carr, Chief Executive Officer Stuart Harrison, Chief Financial Officer AGENDA Result summary Financial
RESULTS ANNOUNCEMENT TO THE MARKET Full Year Financial Results [Based on accounts currently being audited]
![RESULTS ANNOUNCEMENT TO THE MARKET Full Year Financial Results [Based on accounts currently being audited]](/thumbs/84/89825998.jpg "RESULTS ANNOUNCEMENT TO THE MARKET Full Year Financial Results [Based on accounts currently being audited]") DWS Limited (and Controlled Entities) ACN 085 656 088 RESULTS ANNOUNCEMENT TO THE MARKET Full Year Financial Results [Based on accounts currently being audited] DWS Limited (DWS) announces the following
DWS Limited (and Controlled Entities) ACN 085 656 088 RESULTS ANNOUNCEMENT TO THE MARKET Full Year Financial Results [Based on accounts currently being audited] DWS Limited (DWS) announces the following
FY2013 Results Presentation By Chris Sutherland, Managing Director 29 May 2013
 FY2013 Results Presentation By Chris Sutherland, Managing Director 29 May 2013 Important notice and disclaimer The information contained in this presentation is for information purposes p only and does
Sales increased 8.1% to $128.0m (HY17: $118.4m)
") Nick Scali Limited NCK.ASX HY18 Results Presentation 7th February 2018 Key Highlights Sales increased 8.1% to $128.0m (HY17: $118.4m) Sales Like for like sales growth of +2.6% for Nick Scali Furniture
Nick Scali Limited NCK.ASX HY18 Results Presentation 7th February 2018 Key Highlights Sales increased 8.1% to $128.0m (HY17: $118.4m) Sales Like for like sales growth of +2.6% for Nick Scali Furniture
INTERIM FINANCIAL RESULTS
 Presentation Tuesday, 14 November 2017 INTERIM FINANCIAL RESULTS For the six months ended 30 September 2017 Contents EXECUTIVE OVERVIEW FINANCIAL REVIEW OPERATIONAL REVIEW OUTLOOK & STRATEGY Presented
Agenda. Group highlights. Strategy update. Financial review. Outlook Full Year Results
 FY 2017 Results Agenda Group highlights Strategy update Financial review Outlook 2 Group highlights Profit before tax up 45.4% to 14.1m (FY 2016: 9.7m) Diluted EPS up 48.2% to 30.94p (FY 2016: 20.88p)
Gardner Denver Investor Presentation. UBS Conference, June 2018 Vicente Reynal, CEO Todd Herndon, CFO
 Gardner Denver Investor Presentation UBS Conference, June 2018 Vicente Reynal, CEO Todd Herndon, CFO Disclaimer Forward-Looking Statements During the course of this presentation, we may make forward-looking
MONACO RESOURCES HALF-YEAR REPORT
 2018 HALF-YEAR REPORT CONTENT KEY DATA REVENUES HY 2018 395 M 01 STRATEGIC REPORT 4 At a Glance 6 Business Performance 8 Outlook 10 Risks & Uncertainties GROSS PROFIT HY 2018 53 M 02 CONSOLIDATED FINANCIAL
Larsen & Toubro Analyst Presentation Q1 FY16 July 31, 2015
 Larsen & Toubro Analyst Presentation Q1 FY16 July 31, 2015 Disclaimer This presentation contains certain forward looking statements concerning L&T s future business prospects and business profitability,
PRO FORMA FINANCIAL EFFECTS
 WESTONARIA 17 December 2015: Sibanye Gold Limited ("Sibanye" or the "Group") presents the pro forma financial effects of the acquisitions of Bathopele, Siphumelele (including Khomanani) and Thembelani
INTERIM RESULTS FOR THE SIX MONTH PERIOD ENDED 31 DECEMBER DECEMBER 2018
 INTERIM RESULTS RESULTS INTERIM FOR THE RESULTS YEAR ENDED FOR THE 30 PERIOD JUN 2017 ENDED FOR THE SIX MONTH PERIOD ENDED 31 DECEMBER 2017 31 DECEMBER 2018 GOVERNANCE UPDATE GOVERNANCE UPDATE Executive
Audited results. Audited results for the year ended 28 February 2018
 results for the year ended 2018 Raubex Group Limited (Incorporated in the Republic of South Africa) Registration number 2006/023666/06 Share Code: RBX ISIN code: ZAE000093183 ( Raubex or the Group ) results
For personal use only. NRW HOLDINGS Macquarie Western Australia Forum 2018
 NRW HOLDINGS Macquarie Western Australia Forum 2018 1 RESULTS OVERVIEW Revenue: $754.3M (1) double the same period last year. EBITDA (2): $93.5M compared to $58.9M in the prior comparative period. Net
1H14 HIGHLIGHTS. EBITDA of $165.6m, 19% increase on 1H13 (excl one-off items*). NPAT and EPS up 15% vs 1H13.
. NPAT and EPS up 15% vs 1H13.") -1- 1H14 HIGHLIGHTS EBITDA of $165.6m, 19% increase on 1H13 (excl one-off items*). NPAT and EPS up 15% vs 1H13. Consumer division EBITDA up 17% vs 1H13 (excl one-off items*), driven by organic broadband
-1- 1H14 HIGHLIGHTS EBITDA of $165.6m, 19% increase on 1H13 (excl one-off items*). NPAT and EPS up 15% vs 1H13. Consumer division EBITDA up 17% vs 1H13 (excl one-off items*), driven by organic broadband
For personal use only
 Results Presentation First Half Financial Results 31 December 2018 www.pscgroup.com.au Highlights 1 50 Revenue ($m) Revenue of $40.8m up 42% on 1HFY18 ($28.8m) Underlying EBITDA of $3.1m up 46.1% on 1HFY18
LogiCamms Limited ABN: Interim Financial Report
 ABN: 90 127 897 689 Interim Financial Report Contents Page Directors report 2 Auditor s Independence Declaration 4 Condensed consolidated statement of profit or loss and other comprehensive income 5 Condensed
INVESTOR UPDATE ROADSHOW 2014
 INVESTOR UPDATE ROADSHOW 2014 CREATING CAPACITY TO MEET DEMAND 24-26 November 2014 David Carr Chief Executive Officer Stuart Harrison Chief Financial Officer Stephen Freundlich Fund Analyst and Investor
Annual F inancial Financial Results 2008
 Annual Financial Results 2008 16 February 2009 Disclaimer Our presentation contains some forward looking statements with respect to the financial Our presentation contains some forward looking statements
Cameron Judson, CEO Glynn Wright, CFO. McGrath Limited (ASX: MEA) Results for the 6 months ended 31 December February 2018
 Results for the 6 months ended 31 December February 2018") Cameron Judson, CEO Glynn Wright, CFO McGrath Limited (ASX: MEA) Results for the 6 months ended 31 December 2017 15 February 2018 1H18 A SNAPSHOT REVENUE DOWN 23% TO $51.6M GOODWILL IMPAIRMENT ($21.8)
Cameron Judson, CEO Glynn Wright, CFO McGrath Limited (ASX: MEA) Results for the 6 months ended 31 December 2017 15 February 2018 1H18 A SNAPSHOT REVENUE DOWN 23% TO $51.6M GOODWILL IMPAIRMENT ($21.8)
For personal use only
 SPOTLESS WITHIN FORECAST RANGE 24 August Results for the year ended 30 June Sales Revenue of $3,006.3m, down 5.3 from the prior corresponding period reflecting prior period lost contracts and scope reductions,
UNAUDITED INTERIM RESULTS FOR THE SIX MONTHS ENDED 31 DECEMBER 2013
 UNAUDITED INTERIM RESULTS FOR THE SIX MONTHS ENDED 31 DECEMBER 2013 AGENDA AGENDA GROUP OVERVIEW FINANCIAL REVIEW DIVISIONAL REVIEW OUTLOOK QUESTIONS 2 3 GROUP OVERVIEW GROUP STRUCTURE INDUSTRIAL EQUIPMENT
Highlights. Financial review. Business review. Frequently Asked Questions. Group Prospects
 Unaudited group results for the six months ended 31 December 2007 1 2 Highlights Financial review Business review Frequently Asked Questions Group Prospects 3 4 Improved order book quality, improved contract
For personal use only
 Mantra Group H1FY2015 Results Presentation 26 February 2015 Important notice and disclaimer Important notice and disclaimer This document is a presentation of general background information about the activities
RPC GROUP PLC 2017 / 18 RESULTS
 RPC THE ESSENTIAL INGREDIENT RPC GROUP PLC 2017 / 18 RESULTS Supplemental Information 1 2018 RPC Group Plc. All Rights Reserved. Key figures Sales ( m) +36% Adjusted Operating Profit ( m) +38% Adjusted
Credit Suisse Annual Asian Investment Conference
 Adelaide Brighton Limited Credit Suisse Annual Asian Investment Conference Hong Kong, 27 30 March 2017 Martin Brydon Chief Executive Officer and Managing Director Adelaide Brighton Limited Overview of
For personal use only
 Nick Scali Limited NCK.ASX FY18 Results Presentation 16 th August 2018 Key Highlights Sales Sales increased 7.7% to $250.8m (FY17: $232.9m) Increase assisted by full year of sales from 4 stores opened
Introduction Stephen Harris
 Introduction Stephen Harris Group Chief Executive 2 Agenda Summary Financial review Business review Outlook 3 Summary Growth - Strong constant currency revenue growth of 8.3% - 3.5% contribution from acquisitions
FINANCIAL REVIEW INTRODUCTION. Jurgens Myburgh Chief Financial Officer
 FINANCIAL REVIEW OUR COMMITMENT TO SHAREHOLDER VALUE IS MEASURED USING RETURNS ON INVESTED CAPITAL, THEREBY FOCUSING STRATEGIC DELIBERATIONS ON WAYS TO IMPROVE RETURNS ON THE GROUP S INVESTED ASSET BASE.
SIX MONTHS ENDED 30 SEPTEMBER 2018
 PRESENTATION TUESDAY, 20 NOVEMBER 2018 SIX MONTHS ENDED 30 SEPTEMBER 2018 CONTENTS PRESENTED BY Neil Birch Chief Executive Officer Harry Todd Chief Financial Officer 2 EXECUTIVE OVERVIEW 3 RESULTS SUMMARY
FY13 INTERIM RESULTS 13 December 2012
 FY13 INTERIM RESULTS 13 December 2012 BUSINESS REVIEW BETFAIR STRENGTHS Unique product offering Market leading exchange position Brand affinity Clear value proposition Strong customer retention Scale in
For personal use only
 Affinity Education Group Full Year 2014 Results 27 February 2015 2014 Highlights FY 2014 Earnings Growth Underlying EBITDA of $17.9m (1) and underlying NPAT of $11.4m (1) Underlying EPS of 8.1 cents (1)
25 February The Manager Market Announcements Australian Securities Exchange Limited 20 Bridge Street SYDNEY NSW 2000.
 Level 1 157 Grenfell Street Adelaide SA 5000 GPO Box 2155 Adelaide SA 5001 Adelaide Brighton Ltd ACN 007 596 018 Telephone (08) 8223 8000 International +618 8223 8000 Facsimile (08) 8215 0030 www.adbri.com.au
Investor Conference Call
 Investor Conference Call FY/Q4 2015 Results February 25, 2016 / Marijn Dekkers, CEO Page 1 Q4/FY 2015 Investor Conference Call Marijn Dekkers Disclaimer This presentation may contain forward-looking statements
ADVANCED HEALTH LIMITED
 ADVANCED HEALTH LIMITED (Incorporated in the Republic of South Africa) (Registration number 2013/059246/06) ( the Company or Advanced ) ISIN Code: ZAE000189049 JSE Code: AVL REVIEWED CONDENSED CONSOLIDATED
Living our values. Netcare Limited Audited Group Results. for the year ended 30 September 2008 CARE DIGNITY PARTICIPATION TRUTH PASSION
 CARE DIGNITY PARTICIPATION TRUTH PASSION Netcare Limited Audited Group Results for the year ended tember 2008 CARE DIGNITY PARTICIPATION TRUTH PASSION Note regarding forward looking statements The Company
For personal use only
 HUGHES DRILLING LIMITED ABN 12 124 279 750 APPENDIX 4D FINANCIAL REPORT HALF YEAR ENDED 31 DECEMBER 2014 Contents Results for Announcement to the Market 3 Page Directors Report 4 Auditors declaration of
2016 Preliminary Results 8 March 2017
 Half Year Results Six Months Ended 30 June 2015 8 March 2017 Derek Muir Group Chief Chief Executive Executive Mark Pegler Group Group Finance Finance Director Director Hill & Smith Holdings PLC Key messages
Integrated Solutions Provider
 Stringing Energy Automation Railway Trencher Integrated Solutions Provider 2017 Results Presentation 1 st March 2018 www.tesmec.com Index Corporate Strategy 2017 Results 2018 Outlook 1 st March 2018 2
FLETCHER BUILDING HALF YEAR RESULTS TO 31 DECEMBER 2012
 FLETCHER BUILDING HALF YEAR RESULTS TO 31 DECEMBER 2012 20 February 2013 Mark Adamson Chief Executive Officer Bill Roest Chief Financial Officer Page 2 Disclaimer This half year results presentation dated
NETCARE LIMITED UNAUDITED INTERIM GROUP RESULTS FOR THE SIX MONTHS ENDED 31 MARCH 2016 CARE DIGNITY TRUTH PARTICIPATION PASSION
 NETCARE LIMITED UNAUDITED INTERIM GROUP RESULTS FOR THE SIX MONTHS ENDED 31 MARCH 2016 Group Overview South Africa United Kingdom Financial Review Guidance GROUP OVERVIEW 4 Group A comprehensive network
INTERIM RESULTS ANNOUNCEMENT MONDAY, 26 FEBRUARY 2018 AT 10H00 JOHANNESBURG MEDIA PRESENTATION SPEAKER NOTES SASOL CFO PAUL VICTOR
 INTERIM RESULTS ANNOUNCEMENT MONDAY, 26 FEBRUARY 2018 AT 10H00 JOHANNESBURG MEDIA PRESENTATION SPEAKER NOTES SASOL CFO PAUL VICTOR 1 SLIDE 11: TITLE SLIDE Thank you Steve and Bongani, and good morning
ANNUAL FINANCIAL RESULTS 2017 KEY HIGHLIGHTS. Global healthcare business with 60% earnings outside SA. Revenue up 64% to R6.
 Ascendis Health Limited (Incorporated in the Republic of South Africa) Registration number 2008/005856/06 JSE share code ASC ISIN ZAE000185005 ("Ascendis" or "the group") ANNUAL FINANCIAL RESULTS 2017
Whitehaven Coal Limited ASX Investor Series Presentation
 Whitehaven Coal Limited Presentation Achieving a major milestone Sydney, Australia 17 February 2015 Disclaimer Statements contained in this material, particularly those regarding the possible or assumed
For personal use only
 Financial Results Half year ended 31 December 2016 15 February 2017 Agenda Results Overview Galdino Claro, Group CEO Financial Results Fred Knechtel, Group CFO Strategic Progress & Outlook Galdino Claro,
FLETCHER BUILDING 2012 ANNUAL RESULTS PRESENTATION
 FLETCHER BUILDING 2012 ANNUAL RESULTS PRESENTATION 22 August 2012 Jonathan Ling Chief Executive Officer Bill Roest Chief Financial Officer Mark Adamson Chief Executive Laminates & Panels Hunua Quarry,