Investor Presentation
|
|
|
- Steven Crawford
- 5 years ago
- Views:
Transcription

1 Investor Presentation October, 2008 Andrew F. Puzder, President & CEO Ted Abajian, EVP and CFO
2 CKE Restaurants, Inc. (NYSE: CKR) DISCLOSURE REGARDING FORWARD-LOOKING STATEMENTS Matters discussed in this presentation contain forward-looking statements relating to future plans and developments, financial goals, and operating performance and are based on management s current beliefs and assumptions. Such statements are subject to risks and uncertainties that are often difficult to predict and beyond our control. Factors that could cause the Company s results to differ materially from those described include, but are not limited to, anticipated and unanticipated restaurant closures for the Company and its franchisees, whether or not restaurants will be closed and the number of restaurant closures, consumers concerns or adverse publicity regarding the Company s products, effectiveness of operating initiatives and advertising and promotional efforts (particularly at the Hardee s brand), changes in economic conditions, changes in the price or availability of commodities, availability and cost of energy, workers compensation and general liability premiums and claim experience, changes in the Company s suppliers ability to provide quality and timely products to the Company, delays in opening new restaurants or completing remodels, severe weather conditions, the operational and financial success of the Company s franchisees, franchisees willingness to participate in our strategy, availability of financing for the Company and its franchisees, unfavorable outcomes on litigation, changes in accounting policies and practices, new legislation or government regulation (including environmental laws), the availability of suitable locations and terms for the sites designed for development, and other factors as discussed in the Company s filings with the Securities and Exchange Commission. Forward-looking statements speak only as of the date they are made. The Company undertakes no obligation to publicly update or revise any forward-looking statement, whether as a result of new information, future events or otherwise, except as required by law or the rules of the New York Stock Exchange. 2

3 Who Are We? Carl s Jr. 1,100+ unit chain based mainly in Western U.S. and Mexico Signature Products Six Dollar Burger and Western Bacon Cheeseburger Hardee s 1,900+ unit chain based in Midwest and Southeast U.S. and Middle East Signature Products Thickburger and Made From Scratch Biscuits Industry Leader with Innovative, Premium Product Strategy and Cutting-Edge Advertising Dual-Branding of Green Burrito and Red Burrito Mexican-Style Menu Within Carl s Jr. and Hardee s Locations 3
4 Why Invest in CKE? Core Strengths That Will Sustain Our Brands Through Difficult Economic Conditions Avoiding the Falling Knives for Investors Limited Business Risk in Key Areas Open and Regular Communication with Investors 4
5 1. Core Strengths That Will Sustain Our Brands Through Difficult Economic Conditions 5
6 Fast Food is Not a Luxury Item People are going to continue eating People are going to continue eating fast food QSR has done well in prior economic downturns Carl s Jr. and Hardee s are now recognized for serving casual dining quality products at fast food prices Competitive advantage as consumers have less disposable income 6
7 Carl s Jr./QSR Same-store Sales History 10% 8% Dot-com bubble 9/11 Iraq War Begins 7.7% Hurricane Katrina Subprime Mortgage Crisis 6% 4% 2% 0% 4.8% 2.1% 3.0% 3.0% 4.0% 1.8% 0.8% 2.9% 1.2% 2.9% 0.7% 0.3% 0.2% 5.6% 2.2% 2.1% 4.9% 3.6% 3.9% 3.4% 1.9% 0.9% -2% -3.0% -4% YTD 2008 Carl's Jr QSR QSR segment includes: BKC, JBX,MCD and WEN. 7
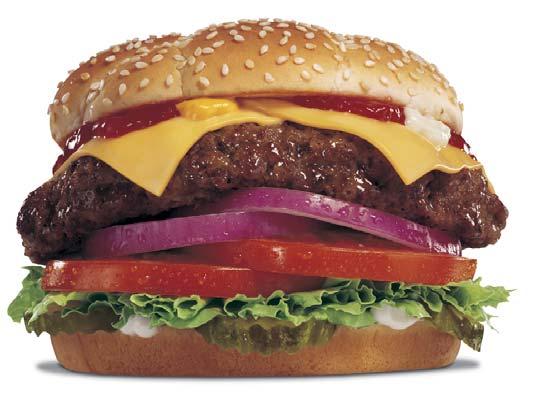
8 Cravable, Innovative Products Our premium, innovative products are second to none and copied by most. Western Bacon Cheeseburger 8


9 Cravable, Innovative Products Ability to Adjust Our Menu For Changes In Consumer Tastes And Spending Levels Guacamole Bacon Six Dollar Burger Pork Chop N Gravy Biscuit Monster Breakfast Sandwich Banana Cream Pie Shake w/ NILLA Wafers Frisco Thickburger 9


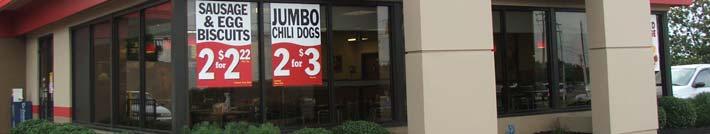
10 Cravable, Innovative Products Low- and mid-priced items focused on both sales and profitability Little Thickburger Famous Star Double Cheeseburger Jumbo Chili Dog 10


11 Food Focused, Cutting-Edge Advertising Aspirational Young Hungry Guy Target Supports Our Image 11
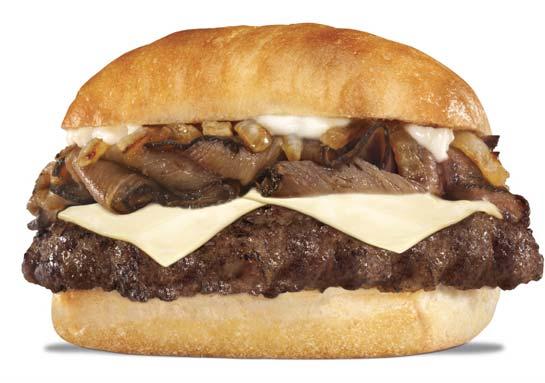


12 High-Quality/Reasonable Price Strategy Able to Compete with Fast Food Competitors and Draw Customers From Higher-priced, Comparable Quality Casual Dining Restaurants Natural Cut Fries Prime Rib Burger Six Dollar Burger 12
13 Reasonable Pricing Structure Protects Profits Avoiding Deep Discounting / Low Margin Promotions Reasonable Price Increases Over Time Have Allowed Us to Adjust for Changes in Commodity, Labor, and Energy Costs % of Company-Operated Revenue 83.0% 81.0% 79.0% 77.0% 190 bp increase 30 bp increase 80 bp decrease 160 bp increase 79.7% 81.6% 80.3% 81.9% 79.8% 80.1% 81.5% 80.7% 75.0% Q3 FY'07 Q3 FY'08 Q4 FY'07 Q4 FY'08 Q1 FY'08 Q1 FY'09 Q2 FY'08 Q2 FY'09 13
14 Carl s Jr. Restaurant Operating Costs % of Company-Operated Revenue 81.0% 79.0% 77.0% 80.6% 80.1% 79.0% 79.8% 78.9% 76.6% 76.3% 3 rd best since FY % 78.3% 75.0% FY 2001 FY 2002 FY 2003 FY 2004 FY 2005 FY 2006 FY 2007 FY 2008 YTD FY
15 Hardee s Restaurant Operating Costs 93.0% 92.5% % of Company-Operated Revenue 91.0% 89.0% 87.0% 85.0% 83.0% 90.4% 89.5% 90.7% 85.7% 84.5% 81.9% 83.6% 2 nd best since FY % 81.0% FY 2001 FY 2002 FY 2003 FY 2004 FY 2005 FY 2006 FY 2007 FY 2008 YTD FY
16 Focus on Operational Cost Structure Company Rest Op Expense as % of Revenue 89% 87% 85% 83% 81% 79% 77% 75% $1, % 79.3% $ % 82.4% $1, % 80.7% $1, % 84.2% $1, % 82.6% $1,600 $1,400 $1,200 $1,000 $800 $600 $400 $200 $0 Company-operated AUV ($in thousands) Carl's Jr. Hardee's CKE BKC JBX 07 Rest Op Exp 08 Rest Op Exp AUV Restaurant operating expenses for most recent quarter. BKC average unit volume includes worldwide company-operated and franchised units. JBX average unit volume for company-operated stores as of FYE 2007 (Sept.) 16
17 Same-Store Sales History 8% 6% 4% Year-over-Year SSS 2% 0% -2% -4% -6% -8% FY 2001 FY 2002 FY 2003 FY 2004 FY 2005 FY 2006 FY 2007 FY 2008 Carl's Jr. Hardee's YTD FY09 17
18 Average Unit Volume History $1,560 $1,460 $1,527 $976 $1,000 $950 Carl's Jr. AUV ($ in 000's) $1,360 $1,260 $1,160 $900 $850 $800 Hardee's AUV ($ in 000's) $1,060 $750 $960 FY 2001 FY 2002 FY 2003 FY 2004 FY 2005 FY 2006 FY 2007 FY 2008 P8 FY09 Carl's Jr. Hardee's $700 18
19 Average Unit Volumes for QSR Burger Chains (2007) $2,200 $2,075 $2,000 $1,800 DOLLARS (in thousands) $1,600 $1,400 $1,200 $1,000 $1,493 $1,430 $1,422 $1,250 $1,162 $1,109 $954 $800 $600 McDonald's Carl's Jr. Jack in the Box Wendy's Burger King CKE Sonic Hardee's 19
20 Increase in AUV, by Percentage and Dollars 55% 50% 48% 45% 40% 35% 38% 33% 33% 36% AUV Increase 30% 25% 20% 16% 15% 10% 5% 0% 11% $362 $415 $239 $517 $199 $124 $108 8% 7% $ in thousands. Sonic Carl's Jr. Hardee's McDonald's Jack in the Box Burger King Wendy's CKE 20
21 2. Avoiding the Falling Knives for Investors Limited Business Risk in Key Areas 21
22 Strong Balance Sheet, Limited Maturities and Modest Leverage $253 million term loan with minimal maturities through 2011 Total Bank and Other Long-term Debt - $328.4 million, down from $351.1 million at FYE 2008 (a) Trailing 13-Period Adjusted EBITDA - $167.9 million Total Debt/Adjusted EBITDA 2.2x Leverage Ratio Covenants 3.0x at FYE 2009, 2.75x at FYE 2010 (a) Includes $15.2 million of convertible debt callable on Oct. 1,
23 Excellent Credit Facility $253 million term loan & $200 million revolver Pricing significantly below market Term Loan Interest Rate LIBOR + 1 3/8% $200 million of term loan fixed at % $105 million of liquidity available under revolver (expires 2012) Revolver Interest rate LIBOR + 1 ½% Strong Syndicate of Lenders Primary Lenders BNP Paribas, Bank of America, Wells Fargo, Citigroup, JPMorgan, Rabobank, Union Bank of California, US Bank, First Bank, Royal Bank of Canada 23

24 Avoiding the Herd Mentality at a time when fast-food giants have broadened their offerings of salad and other lower-calorie fare, (Hardee s Monster Thickburger has) enough calories to make Ronald McDonald blush. -AP McDonald's to give away free chicken sandwiches -AP, May 6, 2008 Jack in the Box Restaurants to Offer Two Free Tacos to Guests -Corporate release, June 20, 2008 Million (Double Stack) Coupon Giveaway Planned -Wendy s corporate release, Aug. 29,
25 Transitioning to Larger Franchise Base 2, % 2,200 50% 2,000 1,917 Company-operated Units 1,800 1,600 1,400 1,200 1, % 1, % 36.4% 36.7% 36.3% 35.9% 36.4% 31.5% 1,185 1,170 1,147 1,105 1,091 1, % % 30% 20% % of Total Units % FY 2000 FY 2001 FY 2002 FY 2003 FY 2004 FY 2005 FY 2006 FY 2007 FY 2008 FY'09 GOAL Company Operated Units % of Total Units 0% 25
26 Refranchising As A Means To Transition to Larger Franchise Base 136 Hardee s restaurants refranchised in Fiscal stores refranchised in Q1 FY stores in Q2 FY stores in Q3 FY stores in Q4 FY stores refranchised in FY refranchised in Q1 FY refranchised in Q2 FY stores refranchised subsequent to Q2 FY additional units targeted for refranchising Total 235 units 26
27 Refranchising As A Means To Transition to larger Franchise Base Why Refranchise? Reduce Capital Requirement $51 Million in Remodel and R&M Capex Shifted to Franchisees More Stable Income Stream Place Underpenetrated/Underperforming Markets in the Hands of Franchisees Franchisees Commit to Development Agreements in Markets Where We Would Not Build Less Vulnerable to Operating Cost Increases Why Own? Higher Earnings and Cash Flow Keep Control of System Greater Benefit When Costs Decline 27
28 Domestic Growth Opportunity 15,000 13,862 12,000 9,000 Units 6,000 7,482 5,936 3,000 2,785 0 MCD BKC WEN CKE Unit count as of December 31, 2007 for MCD, BKC and WEN and January 28,2008 for CKE. BKC includes US and Canada. 28
29 Domestic Franchise New Unit Growth As A Means To Transition To A Larger Franchise Base Units Carl s Jr GOAL FY 2006 FY 2007 FY 2008 FY'09 GOAL FY 2006 FY 2007 FY 2008 FY'09 GOAL Company-Operated Domestic Franchised International Franchised 35 Hardee s GOAL 45 29
30 Domestic Franchise New Unit Growth As A Means To Transition To A Larger Franchise Base 71 domestic units opened during Fiscal % increase from Fiscal restaurants opened in the past three years Franchised units represent > 70% of overall new restaurant openings Focus on existing Carl s Jr. and Hardee s markets with emphasis on California, Georgia and Florida Carl s Jr. New Markets Seattle, San Antonio and Austin Carl s Jr. Target Markets Dallas and Houston 257 new unit commitments under development agreements through Fiscal % annual domestic unit growth 30
31 Domestic Franchise Development Goals Units FY '09 GOAL FY '10 GOAL FY '11 GOAL FY '12 GOAL FY '13 GOAL FY '14 GOAL Existing Commitments New Development 31
32 International Growth New agreements signed to build 100 units in China and 25 units in Pakistan in the next seven years Openings to commence next year Target markets Australia, Canada, Europe, Japan, Latin America, Turkey Current markets Middle East (192), Mexico(99), Russia (8), Southeast Asia(10), American Samoa (1) 50 international units opened during FY th international unit opened last month 310 units open as of Sept. 29 Currently signed development agreements and development from existing franchisees could grow international unit base to 600+ units by FY
33 International Growth Opportunity 18,000 17,515 15,000 14,341 12,000 Units 9,000 6,000 3,913 3,000 0 MCD YUM BKC WEN CKE Unit count as of December 31, 2007 for MCD, BKC and WEN and September 29,2008 for CKE. 33
34 International Franchise Development Goals Units FY '09 GOAL FY '10 GOAL FY '11 GOAL FY '12 GOAL FY '13 GOAL FY '14 GOAL Existing Commitments New Development 34
35 AcrobatDocument Existing International Presence Russia 8 Mexico 99 Middle East 192 Singapore/ Malaysia 10 Pago Pago 1 35
36 AcrobatDocument Targeted International Markets Signed Agreements Primary Targets Secondary Targets 36
37 Systemwide Unit Count Goals By 2014: Approximately 75% of our system will be franchised 20% of units will be international versus 9% currently 4,500 4,000 3,500 3, % of Total Units Company-Operated 3,067 3, , , , , % 4, Units 2,500 2,000 1,819 1,887 1,947 2,017 2,097 2,187 2,287 1,500 1, ,005 1,037 1,074 0 FY 2008 FY09 GOAL FY10 GOAL FY11 GOAL FY12 GOAL FY13 GOAL FY14 GOAL 37 Company Operated Domestic Franchise International
38 Investing in Our Infrastructure to Protect Our Short and Long-Term Viability Remodel Summary 195 Carl s Jr. units remodeled through Q2 FY 09 18% of total domestic unit base 185 company-operated units 45% of company-operated unit base 11 franchise units 2% of domestic franchise base 163 Hardee s units remodeled through Q2 FY 09 9% of total domestic unit base 131 company-operated units 24% of company-operated units base 32 franchise units 2% of domestic franchise base 38
39 Remodel Schedule Carl s Jr. Goal Units 75 Hardee s Goal FY 2007 FY 2008 FY'09 GOAL FY'10 GOAL FY'11 GOAL Carl's Jr. Hardee's 39

40 Exterior Remodels 40


41 Exterior Remodels 41
42 CKE Restaurants, Inc. Capital Plan Current Capital Plan represents an $86.6 million reduction in planned expenditures from original Capital Plan Reductions from refranchising, slowing of planned new unit growth, and slowing of remodel program Under the current Capital Plan, 50% of planned spending is discretionary Can eliminate or reduce such spending on short notice as we deem prudent While remodels are non-discretionary, we can slow the process on short notice as we deem prudent We do not intend to borrow monies to complete our Capital Plan Bank debt reduced by approximately $25 Million YTD while proceeding with our Capital Plan 42
43 CKE Restaurants, Inc. Capital Plan FY 07 FY 11 FY 09 FY 11 Forecast ($ in millions) Carl's Jr. Hardee's Total Non-Discretionary Remodels $30.6 $62.4 $93.0 Repair/Maint IT/Dist. Center/Corporate Subtotal Discretionary New Units $103.0 $39.4 $142.4 Dual-branding Contingency Subtotal Total Capital Expenditures $189.4 $164.8 $
44 We closely monitor the results of new restaurant openings, refranchising efforts, same-store sales improvements, operating expense reductions and G&A expense reductions to assure a net positive impact to our business and profitability. 44
45 Adjusted EBITDA Q2 FY 08 Bridge to Q2 FY 09 Q2 FY 08 Adjusted EBITDA $ 38,992 Net increase / (decrease) in Adjusted EBITDA resulting from: Changes in Store count Restaurants that closed in FY 08 and FY 09 (1) (171) Sale of La Salsa in FY 08 (2) (224) Net impact of refranchising program (3) (2,925) New restaurants that opened in FY 08 and FY 09 (4) 722 Increased franchise contribution - domestic and international (5) 643 Changes in Operating Results 3.6% blended same-store sales increase 2,111 Same-store operating cost decrease 1,375 G&A decreases and all other 496 Q2 FY 09 Adjusted EBITDA $ 41,018 Increase in Q2 FY 09 Adjusted EBITDA $ 2,026 (1) 15 and 11 store closures in FY 08 and FY 09, respectively. (2) La Salsa was sold on July 16, (3) 136 Hardee's units in FY 08, 65 Hardee s units and 3 Carl s Jr. units in Q2 FY 09 to date. (4) 23 new units in FY 08 & 8 new units in Q2 FY 09 to date. (5) Excludes impact of refranchising activities. 45
46 Adjusted EBITDA 1H FY 08 Bridge to 1H FY 09 1H FY 08 Adjusted EBITDA $ 92,668 Net increase / (decrease) in Adjusted EBITDA resulting from: Changes in Store count Restaurants that closed in FY 08 and FY 09 (1) (368) Sale of La Salsa in FY 08 (2) (426) Net impact of refranchising program (3) (5,034) New restaurants that opened in FY 08 and FY 09 (4) 2,561 Increased franchise contribution - domestic and international (5) 330 Changes in Operating Results 2.6% blended same-store sales increase 4,041 Same-store operating cost increase (55) G&A decreases and all other 1,914 1H FY 09 Adjusted EBITDA $ 95,631 Increase in 1H FY 09 Adjusted EBITDA $ 2,963 (1) 15 and 11 store closures in FY 08 and FY 09, respectively. (2) La Salsa was sold on July 16, (3) 136 Hardee's units in FY 08, 65 Hardee s units and 3 Carl s Jr. units in Q2 FY 09 to date. (4) 23 new units in FY 08 & 8 new units in Q2 FY 09 to date. (5) Excludes impact of refranchising activities. 46
47 EPS Growth (continuing operations) $1.00 $0.80 $0.60 $0.40 $0.39 $0.49* $0.77 $0.57 $0.65 $0.20 $0.00 -$0.20 -$0.40 -$0.26 FY 2004 FY 2005 FY 2006 FY 2007 FY 2008 TTM FY 2009 Note: FY EPS figures reflect de minimums taxes due to the company s valuation allowance for deferred tax assets. FY 2006 EPS has been recalculated to reflect a 40% effective tax rate. Actual FY 2006 EPS was $2.54 and includes a $148.0 million income tax benefit. 47
48 Annual Adjusted EBITDA $195 $ (in millions) $180 $165 $150 $135 $144.1 $152.4 $181.1 $164.9 $167.9 $120 $115.9 $105 FY 2004 FY 2005 FY 2006 FY 2007 FY 2008 TTP FY 2009 Note: In compliance with the Company s credit facility, Fiscal 2007 and all periods thereafter, include an addition to earnings for share-based compensation. 48
49 EBIT Growth (continuing operations) $120 $108.0 $ (in millions) $100 $80 $60 $40 $28.8 $60.4 $82.7 $92.8 $91.2 $20 $0 FY 2004 FY 2005 FY 2006 FY 2007 FY 2008 TTM FY
50 Diluted Shares Outstanding Diluted Shares (in millions) FY 2001 FY 2002 FY 2003 FY 2004 FY 2005 FY 2006 FY 2007 FY 2008 Q2 FY09 50
51 3. Open and Regular Communications with investors 51
52 Regular Communication With Shareholders To help reduce information risk with our shareholders, we will continue to: Release our period same store sales and revenue numbers each period Meet in person and telephonically with our investors and analysts as requested and at equity conferences Forecast our operating expenses in the final period same store sales release we issue for each quarter Hold our quarterly earnings release conference calls with open Q&A 52
53 Summary Core Strengths That Will Sustain Our Brands Through Difficult Economic Conditions Avoiding the Falling Knives for Investors Limited Business Risk in Key Areas Open and Regular Communication with Investors 53
54 Investor Presentation Appendix October,
55 Domestic Presence Carl's Jr. Company-Operated. Hardee s Company-Operated Carl's Jr. Franchised Hardee s Franchised 55
56 Carl s Jr. (Q2 FY 2009)* 1,170 stores (408 company-operated, operated, 762 franchised and licensed) AUVs of $1.527 million as of P8 FY % of company-operated operated restaurants generating $1.0 million or greater in revenue Average guest check of $ dual-branded restaurants with Green Burrito (200 company-operated) operated) Company-operated operated AUVs of $1.56 million as of FY 08 Restaurant operating costs of 79.3% in Q1 FY 09 versus 79.6 in Q1 FY 08 * Company-operated operated restaurants 56
57 Carl s Jr. Cumulative Two-Year Same Store-Sales 10.0% 8.0% 6.0% 4.0% 2.0% 0.0% -2.0% P9 FY'08 P10 FY'08 P11 FY'08 P12 FY'08 P13 FY'08 P1 FY'09 P2 FY'09 P3 FY'09 P4 FY'09 P5 FY'09 P6 FY'09 P7 FY'09 P8 FY'09 Carl's Jr. 6.1% 5.4% 3.0% 8.3% 0.8% -1.3% 7.2% 6.0% 3.3% 5.3% 8.0% 4.2% 1.1% 57
58 Carl s Jr. Year-over-Year Same Store-Sales 7.0% 6.0% 5.0% 4.0% 3.0% 2.0% 1.0% 0.0% -1.0% -2.0% P9 FY'08 P10 FY'08 P11 FY'08 P12 FY'08 P13 FY'08 P1 FY'09 P2 FY'09 P3 FY'09 P4 FY'09 P5 FY'09 P6 FY'09 P7 FY'09 P8 FY'09 Carl's Jr. -1.1% 2.0% 2.5% 2.7% -1.3% 1.4% 6.0% 3.8% 4.2% 2.5% 4.9% 4.2% -0.1% 58
59 Carl's Jr. Company-Owned Restaurants 52-Week Moving Average Unit Volume $29,500 $29,000 $28,500 $28,000 $27,500 $27,000 $26,500 $26,000 $25,500 $25,000 $24,500 $24, /18/03 11/17/03 2/16/04 5/17/04 8/16/04 11/15/04 2/14/05 5/16/05 8/15/05 11/14/05 2/13/06 5/15/06 8/14/06 11/13/06 2/12/07 5/14/07 8/13/07 11/12/07 2/11/08 5/12/08 8/11/08 Week Ending Notes: Historical data, except for the last four weeks, included data for recently closed and/or divested restaurants Weekly AUV ($)
60 Hardee s (Q2 FY 2009)* 1,917 stores (519 company-operated, operated, 1,398 franchised and licensed) AUVs of $976K as of P8 FY % of company-operated operated and 35.4% of franchised restaurants generating $1.0 million or greater in revenue Average guest check of $ dual-branded restaurants with Red Burrito (80 company- operated, 18 franchised) Restaurant operating costs of 82.4% in Q2 FY 09 versus 83.3% in Q2 FY 08 * Company-operated operated restaurants 60
61 Hardee s Cumulative Two-Year Same Store-Sales 10.0% 8.0% 6.0% 4.0% 2.0% 0.0% -2.0% -4.0% P9 FY'08 P10 FY'08 P11 FY'08 P12 FY'08 P13 FY'08 P1 FY'09 P2 FY'09 P3 FY'09 P4 FY'09 P5 FY'09 P6 FY'09 P7 FY'09 P8 FY'09 Hardee's 8.9% 7.0% 8.4% 8.7% -1.8% 3.1% 0.8% 1.6% -0.4% 5.4% 6.8% 6.4% 4.6% 61
62 Hardee s Year-over-Year Same Store-Sales 7.0% 6.0% 5.0% 4.0% 3.0% 2.0% 1.0% 0.0% -1.0% -2.0% -3.0% P9 FY'08 P10 FY'08 P11 FY'08 P12 FY'08 P13 FY'08 P1 FY'09 P2 FY'09 P3 FY'09 P4 FY'09 P5 FY'09 P6 FY'09 P7 FY'09 P8 FY'09 Hardee's 1.3% 3.6% 3.2% -0.6% -1.8% 1.6% -2.1% -0.8% -1.0% 2.8% 5.7% 1.4% 1.1% 62
63 Hardee's Company-Owned Restaurants 52-Week Moving Average Unit Volume $19,000 $18,750 $18,500 $18,250 $18,000 $17,750 $17,500 $17,250 $17,000 $16,750 $16,500 $16,250 $16,000 $15,750 $15,500 $15,250 $15, /18/03 11/17/03 2/16/04 5/17/04 8/16/04 11/15/04 2/14/05 5/16/05 8/15/05 11/14/05 2/13/06 5/15/06 8/14/06 11/13/06 2/12/07 5/14/07 8/13/07 11/12/07 2/11/08 5/12/08 8/11/08 Week Ending Notes: Historical data, except for the last four weeks, includes data for recently closed and/or divested restaurants Weekly AUV ($)


64 Remodel Carl s Jr. Exterior 64

65 Remodel Carl s Jr. Interior 65


66 Remodel Hardee s Exterior 66
67 Refranchising Impact Average unit-level metrics for refranchised store base Average unit volume (AUV) - $848,000 Restaurant operating costs 84.8% of revenue Store-level cash flow - $92,000, or 10.9% of revenue (includes advertising and field G&A costs) 67
68 Refranchising Impact Cash Flow Impact ($ per unit) Decrease in Company-operated Cash Flow Increase in Royalty Income ($848k x 4%) Net Decrease in Cash Flow ($92,000) $34,000 ($58,000) A Capital Expenditures ($ per unit) Decrease in Ongoing Capital Expenditures Decrease in Remodel Capital Expenditures ($175,000 remodel cost over 5-year cycle) Decrease in Capital Expenditures $15,000 $35,000 $50,000 B Theoretical Annual Cash Interest Savings Based on Average Cash Proceeds of $390k per 6.2% $24,180 C Estimated Annual Increase in Free Cash Flow Per Store (A+B+C) $16,180 68
69 Adjusted EBITDA - FY 07 Bridge to FY 08 FY 07 Adjusted EBITDA $ 181,154 Net increase / (decrease) in Adjusted EBITDA resulting from: Changes in Store count Restaurants that closed in FY 07 and FY 08 (1) (425) Sale of La Salsa in FY 08 (2) (3,279) Net impact of refranchising program (3) (3,481) New restaurants that opened in FY 07 and FY 08 (4) 3,772 Changes in Operating Results 1.5% blended same-store sales increase 5,701 Same-store food & packaging cost increase (80 basis points) (9,009) Same-store labor and other operating cost increase (110 basis points) (14,238) General & administrative expense reduction and all other (5) 4,213 } $ (23,247) Unusual Items Conversion inducement expense recognized in FY 07 6,406 Decrease in collection of previously unrecognized revenue from franchisees (4,385) Relocation of the Carl's Jr. distribution center in FY 08 (1,488) FY 08 Adjusted EBITDA $ 164,941 Decrease in FY'08 Adjusted EBITDA $ (16,213) (1) 45 and 15 store closures in FY07 and FY08, respectively. (2) La Salsa generated Adjusted EBITDA of $1,894 in FY 07 and negative Adjusted EBITDA of $1,385 in FY 08 due to loss on disposal. (3) 41 Carl's Jr. units in FY 07 and 136 Hardee's units in FY 08, and includes related G&A cost reductions. (4) 10 new units in FY 07 & 23 new units in FY 08. (5) Excludes share based compensation and reductions related to refranchising. 69
70 Adjusted EBITDA Q2 FY 08 Bridge to Q2 FY 09 Q2 FY 08 Adjusted EBITDA $ 38,992 Net increase / (decrease) in Adjusted EBITDA resulting from: Changes in Store count Restaurants that closed in FY 08 and FY 09 (1) (171) Sale of La Salsa in FY 08 (2) (224) Net impact of refranchising program (3) (2,925) New restaurants that opened in FY 08 and FY 09 (4) 722 Increased franchise contribution - domestic and international (5) 643 Changes in Operating Results 3.6% blended same-store sales increase 2,111 Same-store operating cost decrease 1,375 G&A decreases and all other 496 Q2 FY 09 Adjusted EBITDA $ 41,018 Increase in Q2 FY 09 Adjusted EBITDA $ 2,026 (1) 15 and 11 store closures in FY 08 and FY 09, respectively. (2) La Salsa was sold on July 16, (3) 136 Hardee's units in FY 08, 65 Hardee s units and 3 Carl s Jr. units in Q2 FY 09 to date. (4) 23 new units in FY 08 & 8 new units in Q2 FY 09 to date. (5) Excludes impact of refranchising activities. 70
71 Adjusted EBITDA 1H FY 08 Bridge to 1H FY 09 1H FY 08 Adjusted EBITDA $ 92,668 Net increase / (decrease) in Adjusted EBITDA resulting from: Changes in Store count Restaurants that closed in FY 08 and FY 09 (1) (368) Sale of La Salsa in FY 08 (2) (426) Net impact of refranchising program (3) (5,034) New restaurants that opened in FY 08 and FY 09 (4) 2,561 Increased franchise contribution - domestic and international (5) 330 Changes in Operating Results 2.6% blended same-store sales increase 4,041 Same-store operating cost increase (55) G&A decreases and all other 1,914 1H FY 09 Adjusted EBITDA $ 95,631 Increase in 1H FY 09 Adjusted EBITDA $ 2,963 (1) 15 and 11 store closures in FY 08 and FY 09, respectively. (2) La Salsa was sold on July 16, (3) 136 Hardee's units in FY 08, 65 Hardee s units and 3 Carl s Jr. units in Q2 FY 09 to date. (4) 23 new units in FY 08 & 8 new units in Q2 FY 09 to date. (5) Excludes impact of refranchising activities. 71

72 Hardee s/red Burrito 72


73 Hardee s/red Burrito Menu 73


74 Hardee s New Restaurant 74
75
Jack in the Box Inc. Cowen & Company 7 th Annual Consumer Conference
 Jack in the Box Inc. Cowen & Company 7 th Annual Consumer Conference January 12, 2009 Jack in the Box Inc. Safe Harbor Statement This presentation includes plans and estimates for the future, which are
Jack in the Box Inc. Reports First Quarter FY 2015 Earnings; Updates Guidance for FY 2015
 Investor Contact: Carol DiRaimo, (858) 571-2407 FOR IMMEDIATE RELEASE Media Contact: Brian Luscomb, (858) 571-2291 Jack in the Box Inc. Reports First Quarter FY 2015 Earnings; Updates Guidance for FY 2015
ICR XChange Conference. January 16, 2013
 ICR XChange Conference January 16, 2013 0 Safe Harbor Statement Certain statements made in this presentation that reflect management s expectations regarding future events and economic performance are
Jack in the Box Inc. Reports Second Quarter FY 2015 Earnings; Updates Guidance for FY 2015; Raises Quarterly Cash Dividend by 50%
 Investor Contact: Carol DiRaimo, (858) 571-2407 FOR IMMEDIATE RELEASE Media Contact: Brian Luscomb, (858) 571-2291 Reports Second Quarter FY Earnings; Updates Guidance for FY ; Raises Quarterly Cash Dividend
Jack in the Box Inc. Reports Third Quarter FY 2017 Earnings; Updates Guidance for FY 2017; Declares Quarterly Cash Dividend
 Investor Contact: Carol DiRaimo, (858) 571-2407 FOR IMMEDIATE RELEASE Media Contact: Brian Luscomb, (858) 571-2291 Jack in the Box Inc. Reports Third Quarter FY Earnings; Updates Guidance for FY ; Declares
Jack in the Box Inc. Reports Third Quarter FY 2015 Earnings; Updates Guidance for FY 2015; Declares Quarterly Cash Dividend
 Investor Contact: Carol DiRaimo, (858) 571-2407 FOR IMMEDIATE RELEASE Media Contact: Brian Luscomb, (858) 571-2291 Reports Third Quarter FY Earnings; Updates Guidance for FY ; Declares Quarterly Cash Dividend
Jack in the Box Inc. Reports Second Quarter FY 2014 Earnings; Updates Guidance for FY 2014
 Investor Contact: Carol DiRaimo, (858) 571-2407 FOR IMMEDIATE RELEASE Media Contact: Brian Luscomb, (858) 571-2291 Reports Second Quarter FY Earnings; Updates Guidance for FY SAN DIEGO, May 14, (NASDAQ:
McDonald's Corp (MCD)
") Americas/United States Equity Research Restaurants Rating OUTPERFORM Price (18-Dec-17, US$) 174.20 Target price (US$) (from 178.00) 185.00 52-week price range (US$) 174.20-119.48 Market cap(us$ m) 142,278
Americas/United States Equity Research Restaurants Rating OUTPERFORM Price (18-Dec-17, US$) 174.20 Target price (US$) (from 178.00) 185.00 52-week price range (US$) 174.20-119.48 Market cap(us$ m) 142,278
Steve Schmitt Vice President, Investor Relations & Corporate Strategy
 NEWS Steve Schmitt Vice President, Investor Relations & Corporate Strategy Yum! Brands Reports Second-Quarter EPS of $0.69, a Decline of 5%, Excluding Special Items; Expects Strong Second Half in China;
INVESTOR INFORMATION Press Releases Burger King Worldwide, Inc. Reports Third Quarter 2012 Results
 INVESTOR INFORMATION Press Releases Burger King Worldwide, Inc. Reports Third Quarter 2012 Results Burger King Worldwide Reports Fifth Consecutive Quarter of System wide Comparable Sales Growth and Initiates
Investor Presentation March
 1 Investor Presentation March 2016 Presenters 2 Tim Taft President & Chief Executive Officer President & Chief Executive Officer Lynn Schweinfurth Chief Financial Officer Forward-looking Statements 3 This
COLLINS FOODS LIMITED
 COLLINS FOODS LIMITED 2014 FINANCIAL YEAR RESULTS 25 June 2014 FY14 financial overview $m FY13 FY14 WA impact (1) Significant items (2) FY14 Underlying Change versus FY13 Underlying Revenue 423.9 440.6
5/7/2013. First Quarter 2013 Earnings Conference Call. May 8, Oldemark LLC JOHN BARKER. Chief Communications Officer.
 First Quarter 2013 Earnings Conference Call May 8, 2013 2013 Oldemark LLC JOHN BARKER Chief Communications Officer 2013 Oldemark LLC 2 1 Today s Agenda CEO Overview Financial Update Emil Brolick Steve
30 th Annual Raymond James Institutional Investors Conference March 11, 2009
 30 th Annual Raymond James Institutional Investors Conference March 11, 2009 Safe Harbor Statement Under the Private Securities i Litigation i i Reform Act of 1995 Our presentation includes, and our response
INVESTOR PRESENTATION JANUARY 2018
 INVESTOR PRESENTATION JANUARY 2018 0 FORWARD-LOOKING STATEMENTS Forward-Looking Statements This presentation contains forward-looking statements that are subject to risks and uncertainties. All statements
Jack in the Box Inc. Reports First Quarter FY 2013 Earnings; Updates Guidance for FY 2013
 Investor Contact: Carol DiRaimo, (858) 571-2407 FOR IMMEDIATE RELEASE Media Contact: Brian Luscomb, (858) 571-2291 Reports First Quarter FY 2013 Earnings; Updates Guidance for FY 2013 SAN DIEGO, February
Donny Lau Senior Director, Investor Relations & Corporate Strategy
 NEWS Donny Lau Senior Director, Investor Relations & Corporate Strategy Yum! Brands Reports Second-Quarter GAAP Operating Profit Growth of 32%; Delivered Core Operating Profit Growth of 7%; Raises Full-Year
FOR IMMEDIATE RELEASE. Investor Contact: Carol DiRaimo, (858) Media Contact: Brian Luscomb, (858)
 Media Contact: Brian Luscomb, (858)") Investor Contact: Carol DiRaimo, (858) 571-2407 FOR IMMEDIATE RELEASE Media Contact: Brian Luscomb, (858) 571-2291 Jack in the Box Inc. Reports Second Quarter FY Earnings; Updates Guidance for FY ; Declares
Investor Contact: Carol DiRaimo, (858) 571-2407 FOR IMMEDIATE RELEASE Media Contact: Brian Luscomb, (858) 571-2291 Jack in the Box Inc. Reports Second Quarter FY Earnings; Updates Guidance for FY ; Declares
Keith Siegner Vice President, Investor Relations, Corporate Strategy and Treasurer. % Change. Same-Store Sales
 Yum! Brands Reports Second-Quarter GAAP Operating Profit Growth of 1%; Delivered Second-Quarter Core Operating Profit Growth of 19%; Maintains Full-Year Core Operating Profit Growth Guidance Louisville,
Investor Presentation JANUARY 2016
 Investor Presentation JANUARY 2016 FORWARD-LOOKING STATEMENTS Forward-Looking Statements This presentation contains forward-looking statements that are subject to risks and uncertainties. All statements
Del Taco Restaurants, Inc. Reports Fiscal Fourth Quarter and Fiscal Year 2017 Financial Results
 NEWS RELEASE Del Taco Restaurants, Inc. Reports Fiscal Fourth Quarter and Fiscal Year 2017 Financial Results 3/14/2018 System-wide comparable restaurant sales growth of 2.4% in Fiscal Fourth Quarter Announces
INVESTOR PRESENTATION JUNE 2018
 INVESTOR PRESENTATION JUNE 2018 0 FORWARD-LOOKING STATEMENTS Forward-Looking Statements This presentation contains forward-looking statements that are subject to risks and uncertainties. All statements
Jefferies Winter Consumer Summit Beaver Creek January 26, 2015
 Jefferies Winter Consumer Summit Beaver Creek January 26, 2015 Forward Looking Statements Certain matters discussed in this presentation constitute forward-looking statements within the meaning of the
 Page 1 of 7 Release Yum! Brands Inc. Announces 2011 EPS Growth of 7%, Or $0.63 Per Share, Excluding Special Items; Driven by Outstanding China and Emerging Market Performance LOUISVILLE, Ky., Apr 20, 2011
Quarterly Concept Dashboard 2Q:14 Benchmarking for $1B+ Chains and Other Select Concepts System Stats, Unit Sales & Margins, Build Costs, Valuations
 Quarterly Concept Dashboard 2Q:14 Benchmarking for $1B+ Chains and Other Select Concepts System Stats, Unit Sales & Margins, Build Costs, Valuations Casual Buffalo Wild Wings Cheesecake Factory Chili's
Del Taco Restaurants, Inc. (Exact name of registrant as specified in its charter)
") UNITED STATES SECURITIES AND EXCHANGE COMMISSION WASHINGTON, DC 20549 FORM 8-K CURRENT REPORT Pursuant to Section 13 or 15(d) of the Securities Exchange Act of 1934 Date of Report (Date of earliest event
UNITED STATES SECURITIES AND EXCHANGE COMMISSION WASHINGTON, DC 20549 FORM 8-K CURRENT REPORT Pursuant to Section 13 or 15(d) of the Securities Exchange Act of 1934 Date of Report (Date of earliest event
NEWS. Tim Jerzyk Senior Vice President, Investor Relations
 NEWS Tim Jerzyk Senior Vice President, Investor Relations Yum! Brands Inc. Announces First Quarter 2011 EPS Growth of 7%, Or $0.63 Per Share, Excluding Special Items; Driven by Outstanding China and Emerging
SECURITIES AND EXCHANGE COMMISSION FORM 10-K. Annual report pursuant to section 13 and 15(d)
") SECURITIES AND EXCHANGE COMMISSION FORM 10-K Annual report pursuant to section 13 and 15(d) Filing Date: 2012-04-11 Period of Report: 2012-01-30 SEC Accession No. 0001193125-12-159019 (HTML Version on
SECURITIES AND EXCHANGE COMMISSION FORM 10-K Annual report pursuant to section 13 and 15(d) Filing Date: 2012-04-11 Period of Report: 2012-01-30 SEC Accession No. 0001193125-12-159019 (HTML Version on
EARNINGS CALL. FISCAL 2018: Q3 RESULTS March 22, 2018
 EARNINGS CALL FISCAL 2018: Q3 RESULTS March 22, 2018 Disclaimer/Non-GAAP Information IMPORTANT NOTICE The following slides are part of a presentation by Darden Restaurants, Inc. (the "Company") and are
NEWS. Tim Jerzyk Senior Vice President, Investor Relations
 NEWS Tim Jerzyk Senior Vice President, Investor Relations Yum! Brands Reports First-Quarter EPS Growth of 21%, or $0.76 Per Share, Excluding Special Items; Strong Sales and Operating Profit Growth Across
Dunkin' Brands Reports First Quarter 2013 Results
 April 25, 2013 Dunkin' Brands Reports First Quarter 2013 Results CANTON, Mass., April 25, 2013 /PRNewswire/ -- First quarter highlights include: Dunkin' Donuts U.S. comparable store sales growth of 1.7%
November 20 th, Company: Sonic Corp. (NASDAQ SONC) Action: Long Price Target: $34.00 Students: Peiheng Xu, Devon Pennington, Elise Radolf
 Action: Long Price Target: $34.00 Students: Peiheng Xu, Devon Pennington, Elise Radolf") November 20 th, 2015 Company: Sonic Corp. (NASDAQ SONC) Action: Long Price Target: $34.00 Students: Peiheng Xu, Devon Pennington, Elise Radolf Long: SONC Company Overview Domestic Drive-in Leader Market
November 20 th, 2015 Company: Sonic Corp. (NASDAQ SONC) Action: Long Price Target: $34.00 Students: Peiheng Xu, Devon Pennington, Elise Radolf Long: SONC Company Overview Domestic Drive-in Leader Market
Dunkin' Brands Reports Third Quarter 2013 Results
 October 24, Dunkin' Brands Reports Third Quarter Results CANTON, Mass., Oct. 24, /PRNewswire/ -- Third quarter highlights include: Dunkin' Donuts U.S. comparable store sales growth of 4.2% Added 222 net
COLLINS FOODS LIMITED
 COLLINS FOODS LIMITED FULL YEAR RESULTS 26 June 2017 ACN 151 420 781 : strong growth across key financial metrics $m FY16 Underlying [1] Statutory Significant Items [2] Underlying Change vs FY16 Underlying
AFC Enterprises Reports Financial Results for Third Quarter 2010; Raises Fiscal 2010 Earnings Guidance
 November 10, 2010 AFC Enterprises Reports Financial Results for Third Quarter 2010; Raises Fiscal 2010 Earnings Guidance ATLANTA--(BUSINESS WIRE)-- AFC Enterprises, Inc. (NASDAQ: AFCE), the franchisor
Investor Presentation. January 2017
 Investor Presentation January 2017 Forward-Looking Statements Forward-Looking Statements This presentation contains forward-looking statements that are subject to risks and uncertainties. All statements
Jacky Lo Chief Finance Officer, Yum China
 Jacky Lo Chief Finance Officer, Yum China Cautionary Language Regarding Forward-Looking Statements Forward-Looking Statements. Our presentation may contain forward-looking statements within the meaning
Q4 and FY 2017 Financial Results. March 9, 2018
 and Financial Results March 9, 2018 Safe Harbor The information made available in this presentation contains forward looking statements which reflect the Company s current view of future events, results
Second Quarter 2018 Results
 Second Quarter 2018 Results August 21, 2018 CLASSIFIED INTERNAL USE ONLY Forward-Looking Statements Forward-looking statements in this presentation regarding the Company s future performance, restaurant
Oppenheimer 18 th Annual Consumer Conference June 20, 2018
 Oppenheimer 18 th Annual Consumer Conference June 20, 2018 David Burke, Chief Executive Officer Phyllis Knight, Chief Financial Officer 1 Safe Harbor Some of the statements contained in this presentation
THE WENDY S COMPANY REPORTS STRONG 2013 THIRD-QUARTER RESULTS, RAISES EARNINGS OUTLOOK FOR 2013 COMPANY REPORTS 3Q SAME-STORE SALES INCREASE OF 3.
 THE WENDY S COMPANY REPORTS STRONG 2013 THIRD-QUARTER RESULTS, RAISES EARNINGS OUTLOOK FOR 2013 COMPANY REPORTS 3Q SAME-STORE SALES INCREASE OF 3.2% ADJUSTED EBITDA INCREASES 17% ADJUSTED EPS INCREASES
Dine Brands Global, Inc. Investor Presentation March 2019
 Dine Brands Global, Inc. Investor Presentation March 2019 Disclosures Forward-Looking Information: The content contained in this presentation is as of March 5, 2019. The Company assumes no obligation to
Investor Presentation
 Investor Presentation Sidoti& Company Institutional Investor Forum March 18, 2014 Forward-Looking Statements and Non-GAAP Financial Measures Denny s Corporation urges caution in considering its current
INVESTKentucky Conference Louisville, KY June 6, 2013
 INVESTKentucky Conference Louisville, KY June 6, 2013 Tony Thompson EVP, Chief Operating Officer and President, PJ Food Service Lance Tucker SVP, Chief Financial Officer and Chief Administrative Officer
MANAGEMENT S DISCUSSION AND ANALYSIS OF FINANCIAL CONDITION AND RESULTS OF OPERATIONS
 MANAGEMENT S DISCUSSION AND ANALYSIS OF FINANCIAL CONDITION AND RESULTS OF OPERATIONS Unless otherwise noted, the section references to (i) us, our, we, the Company and YUM refer to YUM Brands, Inc. and
Creating a Global QSR Leader. August 26 th, 2014
 Creating a Global QSR Leader August 26 th, 2014 0 This presentation includes forward-looking statements, which are often identified by the words may, might, believes, thinks, anticipates, expects, intends
Investor Presentation January 2013
 Investor Presentation January 2013 Texas Roadhouse, Inc Safe Harbor Statement and Reconciliation of Non-GAAP Financial Measures Under the Private Securities Litigation Reform Act of 1995 Certain statements
Keith Siegner Vice President, Investor Relations, Corporate Strategy and Treasurer
 NEWS Keith Siegner Vice President, Investor Relations, Corporate Strategy and Treasurer Yum! Brands Reports Fourth-Quarter GAAP Operating Profit Growth of 134%; Fourth-Quarter Core Operating Profit Decline
Burger King Worldwide, Inc. Fourth Quarter 2012 Earnings Conference Call. February 15, 2013
 Burger King Worldwide, Inc. Fourth Quarter 2012 Earnings Conference Call February 15, 2013 0 Safe Harbor Statement Certain statements made in this presentation that reflect management s expectations regarding
(1) Based on unit count (2) Represents FY2016 sales data on a 52 week basis and unit counts as of Q2 FY2017 (3) Represents system-wide sales for
 Based on unit count (2) Represents FY2016 sales data on a 52 week basis and unit counts as of Q2 FY2017 (3) Represents system-wide sales for") (1) Based on unit count (2) Represents FY2016 sales data on a 52 week basis and unit counts as of Q2 FY2017 (3) Represents system-wide sales for fiscal 2016 on a 52 week basis and unit count as of January
(1) Based on unit count (2) Represents FY2016 sales data on a 52 week basis and unit counts as of Q2 FY2017 (3) Represents system-wide sales for fiscal 2016 on a 52 week basis and unit count as of January
Investor Presentation. Domino s Pizza
 Investor Presentation Domino s Pizza July 2005 Forward-Looking Statements This presentation and our accompanying comments may contain forward-looking statements. These statements relate to future events
THE KEG ROYALTIES INCOME FUND FIRST QUARTER REPORT
 THE KEG ROYALTIES INCOME FUND FIRST QUARTER REPORT For the three months ended March 31, 2010 TO OUR UNITHOLDERS On behalf of the Board of Trustees, I am pleased to present the results of The Keg Royalties
Investor Presentation. Russ Bendel Chief Executive Officer. Ira Fils Chief Financial Officer. May 2015 AND
 Investor Presentation May 2015 Russ Bendel Chief Executive Officer AND Ira Fils Chief Financial Officer Forward Looking Statements Forward Looking Statements This presentation contains forward looking
Dine Brands Global, Inc. Investor Presentation. March 5, 2018
 Dine Brands Global, Inc. Investor Presentation March 5, 2018 2 Disclosures Forward-Looking Information: The content contained in this presentation is as of February 21, 2018. The Company assumes no obligation
Second Quarter 2012 Earnings Conference Call. August 9, Oldemark LLC JOHN BARKER CHIEF COMMUNICATIONS OFFICER
 Second Quarter 2012 Earnings Conference Call August 9, 2012 1 2012 Oldemark LLC JOHN BARKER CHIEF COMMUNICATIONS OFFICER 2 1 Today s Agenda Opening Comments Financial Update CEO Overview Emil Brolick Steve
CL King s Annual Best Ideas Conference
 WELCOME TO AMERICA S DINER CL King s Annual Best Ideas Conference September 10, 2015 Forward Looking Statements and Non-GAAP Financial Measures Denny s Corporation urges caution in considering its current
THE WENDY S COMPANY REPORTS SECOND QUARTER 2018 RESULTS. North America same-restaurant sales increase 1.9% (+5.1% on a two-year basis)
") THE WENDY S COMPANY REPORTS SECOND QUARTER 2018 RESULTS North America same-restaurant sales increase 1.9% (+5.1% on a two-year basis) 22nd consecutive quarter of positive same-restaurant sales 36 global
THE WENDY S COMPANY REPORTS SECOND QUARTER 2018 RESULTS North America same-restaurant sales increase 1.9% (+5.1% on a two-year basis) 22nd consecutive quarter of positive same-restaurant sales 36 global
CARA OPERATIONS LIMITED Management s Discussion and Analysis For the 13 weeks ended April 1, 2018
 CARA OPERATIONS LIMITED Management s Discussion and Analysis For the 13 weeks ended April 1, 2018 The following Management s Discussion and Analysis ( MD&A ) for Cara Operations Limited ( Cara or the Company
Macquarie Investor Day Presentation
 RESTAURANT BRANDS NEW ZEALAND LIMITED Macquarie Investor Day Presentation Sydney 4 May 2017 Russel Creedy Group CEO Presentation Outline RBD Who Are We FY17 Trading Results Hawaiian Acquisition Growth
Sonic Reports Improved Sales Performance for the Fourth Fiscal Quarter of 2018
 Sonic Corp. Logo Sonic Reports Improved Sales Performance for the Fourth Fiscal Quarter of 2018 October 16, 2018 OKLAHOMA CITY--(BUSINESS WIRE)--Oct. 16, 2018-- Sonic Corp. (NASDAQ: SONC), the nation s
Q2 FY 2018 Earnings Conference Call March 27, 2018
 Q2 FY 2018 Earnings Conference Call March 27, 2018 Cautionary Statement Certain information in this presentation may constitute forward-looking statements under the Private Securities Litigation Reform
Dine Brands Global, Inc. Investor Presentation December 2018
 Dine Brands Global, Inc. Investor Presentation December 2018 Disclosures Forward-Looking Information: The content contained in this presentation is as of December 4, 2018. The Company assumes no obligation
FirstService Corporation
 FirstService Corporation Investor Presentation November 2017 Forward Looking Statements Certain statements included herein constitute forward looking statements within the meaning of the U.S. Private Securities
Comprehensive Plan to Enhance Shareholder Value. December 19, 2013
 Comprehensive Plan to Enhance Shareholder Value December 19, 2013 Forward-Looking Statements During the course of this presentation, Darden Restaurants officers and employees may make forward-looking statements
Del Taco Restaurants, Inc. (Exact name of registrant as specified in its charter)
") UNITED STATES SECURITIES AND EXCHANGE COMMISSION WASHINGTON, DC 20549 FORM 8-K CURRENT REPORT Pursuant to Section 13 or 15(d) of the Securities Exchange Act of 1934 Date of Report (Date of earliest event
UNITED STATES SECURITIES AND EXCHANGE COMMISSION WASHINGTON, DC 20549 FORM 8-K CURRENT REPORT Pursuant to Section 13 or 15(d) of the Securities Exchange Act of 1934 Date of Report (Date of earliest event
Dunkin Brands Group, Inc.
 Dunkin Brands Group, Inc. Investor Presentation Jefferies Consumer Conference Nigel Travis Chairman & CEO 1 Forward-Looking Statements Certain information contained in this presentation, particularly information
Popeyes Louisiana Kitchen, Inc. Reports Fiscal 2016 Earnings Results
 February 22, 2017 Reports Fiscal 2016 Earnings Results Completes Credit Facility Expansion ATLANTA--(BUSINESS WIRE)-- (NASDAQ: PLKI), the franchisor and operator of Popeyes restaurants, today reported
Restaurant Brands International Reports Third Quarter 2015 Results
 Restaurant Brands International Reports Third Quarter 2015 Results Oakville, Ontario October 27, 2015 Restaurant Brands International Inc. (TSX/NYSE: QSR, TSX: QSP) today reported financial results for
Q Financial Results. August 3, 2017
 Q2 2017 Financial Results August 3, 2017 Safe Harbor The information made available in this presentation contains forward-looking statements which reflect the Company s current view of future events, results
Management s Discussion & Analysis
 Freshii Inc. Management s Discussion & Analysis For the 13 week period ended March 26, 2017 (Expressed in US Dollars) MANAGEMENT S DISCUSSION AND ANALYSIS OF FINANCIAL CONDITION AND RESULTS OF OPERATIONS
COLLINS FOODS LIMITED. MORGANS ANNUAL QLD CONFERENCE 8 October 2014
 COLLINS FOODS LIMITED MORGANS ANNUAL QLD CONFERENCE 8 October 2014 Page 1 Chief Executive Officer Graham Maxwell Collins Foods Limited 170 KFC restaurants across Queensland, Western Australia and Northern
CARA OPERATIONS LIMITED Management s Discussion and Analysis For the 13 and 39 weeks ended September 24, 2017
 CARA OPERATIONS LIMITED Management s Discussion and Analysis For the 13 and 39 weeks ended September 24, 2017 The following Management s Discussion and Analysis ( MD&A ) for Cara Operations Limited ( Cara
JACK IN THE BOX INC.
 UNITED STATES SECURITIES AND EXCHANGE COMMISSION WASHINGTON, D.C. 20549 FORM 10-K x ANNUAL REPORT PURSUANT TO SECTION 13 OR 15(d) OF THE SECURITIES EXCHANGE ACT OF 1934 FOR THE FISCAL YEAR ENDED OCTOBER
CARA OPERATIONS LIMITED Management s Discussion and Analysis For the years ended December 25, 2016 and December 27, 2015
 CARA OPERATIONS LIMITED Management s Discussion and Analysis For the years ended December 25, 2016 and December 27, 2015 The following Management s Discussion and Analysis ( MD&A ) for Cara Operations
UNITED STATES SECURITIES AND EXCHANGE COMMISSION Washington, D.C FORM 8-K
 UNITED STATES SECURITIES AND EXCHANGE COMMISSION Washington, D.C. 20549 FORM 8-K CURRENT REPORT Pursuant to Section 13 or 15(d) of the Securities Exchange Act of 1934 Date of Report (Date of earliest event
Rent-A-Center today is
 INVESTOR PRESENTATION FIRST QUARTER 2014 Safe Harbor This presentation contains forward-looking statements that involve risks and uncertainties. Such forward-looking statements generally can be identified
Denny's Corporation Reports Results for Second Quarter 2013
 July 29, 2013 Denny's Corporation Reports Results for Second Quarter 2013 Adjusted Net Income Per Share* Increased 20.7% to $0.08 SPARTANBURG, S.C., July 29, 2013 (GLOBE NEWSWIRE) -- Denny's Corporation
ARCOS DORADOS Morgan Stanley Conference November 13, 2012 Woods Staton Chief Executive Officer
 Agenda ARCOS DORADOS Morgan Stanley Conference November 13, 2012 Woods Staton Chief Executive Officer Disclaimer This presentation contains forward-looking statements that represent our beliefs, projections
Burger King Holdings Inc ( BKC ) 10 K Annual report pursuant to section 13 and 15(d) Filed on 9/7/2007 Filed Period 6/30/2007
 10 K Annual report pursuant to section 13 and 15(d) Filed on 9/7/2007 Filed Period 6/30/2007") Burger King Holdings Inc ( BKC ) 5505 BLUE LAGOON DRIVE MIAMI, FL, 33126 305 378 3000 http://www.bk.com/ 10 K Annual report pursuant to section 13 and 15(d) Filed on 9/7/2007 Filed Period 6/30/2007 UNITED
Burger King Holdings Inc ( BKC ) 5505 BLUE LAGOON DRIVE MIAMI, FL, 33126 305 378 3000 http://www.bk.com/ 10 K Annual report pursuant to section 13 and 15(d) Filed on 9/7/2007 Filed Period 6/30/2007 UNITED
4Q 2018 Highlights and Operating Results. Products. Technology. Services. Delivered Globally.
 4Q 2018 Highlights and Operating Results Products. Technology. Services. Delivered Globally. Table of Contents Page 3 Safe Harbor Statement and Non-GAAP Financial Measures 4 Sales Overview 9 Overview of
Luby s Reports Fourth Quarter and Fiscal 2015 Results
 For additional information contact: FOR IMMEDIATE RELEASE Dennard-Lascar Associates 713-529-6600 Rick Black / Ken Dennard Investor Relations Luby s Reports Fourth Quarter and Fiscal Results HOUSTON, TX
Burger King Holdings, Inc. Non-Deal Roadshow May 2010
 Burger King Holdings, Inc. Non-Deal Roadshow May 2010 Safe harbor statement Certain statements made in this report that reflect management's expectations regarding future events and economic performance
Q Investor Presentation
 Q3 2017 Investor Presentation FORWARD-LOOKING STATEMENTS This presentation contains forward-looking statements within the meaning of the Private Securities Litigation Reform Act of 1995. These statements
UNITED STATES SECURITIES AND EXCHANGE COMMISSION Washington, D.C FORM 10-Q WINGSTOP INC.
 UNITED STATES SECURITIES AND EXCHANGE COMMISSION Washington, D.C. 20549 FORM 10-Q (Mark one) x QUARTERLY REPORT PURSUANT TO SECTION 13 OR 15(d) OF THE SECURITIES EXCHANGE ACT OF 1934 For the quarterly
COLLINS FOODS LIMITED
 COLLINS FOODS LIMITED FY18 INTERIM RESULTS 29 November 2017 ACN 151 420 781 HY18: solid revenue and earnings growth ($m) HY17 Underlying [1] HY18 Statutory HY18 Significant items [2] HY18 Underlying Change
The Second Cup Ltd. Management s Discussion and Analysis
 The following ( MD&A ) has been prepared as of May 2, 2013 and is intended to assist in understanding the financial performance and financial condition of The Second Cup Ltd. ( Second Cup or the Company
The Second Cup Ltd. Management s Discussion and Analysis
 The following ( MD&A ) has been prepared as of October 31, and is intended to assist in understanding the financial performance and financial condition of The Second Cup Ltd. ( Second Cup or the Company
Del Taco Restaurants, Inc. (Exact name of registrant as specified in its charter)
") UNITED STATES SECURITIES AND EXCHANGE COMMISSION WASHINGTON, DC 20549 FORM 8-K CURRENT REPORT Pursuant to Section 13 or 15(d) of the Securities Exchange Act of 1934 Date of Report (Date of earliest event
UNITED STATES SECURITIES AND EXCHANGE COMMISSION WASHINGTON, DC 20549 FORM 8-K CURRENT REPORT Pursuant to Section 13 or 15(d) of the Securities Exchange Act of 1934 Date of Report (Date of earliest event
COLLINS FOODS LIMITED
 COLLINS FOODS LIMITED FY16 FINANCIAL YEAR RESULTS 28 June 2016 FY16: growth across all key financial metrics $m FY15 Underlying [1] FY16 Statutory FY16 Significant Items [2] FY16 Underlying Change vs FY15
Luby s Reports Third Quarter Fiscal 2011 Results
 For additional information contact: FOR IMMEDIATE RELEASE DRG&L / 713-529-6600 Ken Dennard / Sheila Stuewe Investor Relations Luby s Reports Third Quarter Fiscal 2011 Results HOUSTON, TX June 8, 2011 Luby
EARNINGS CALL. FISCAL 2018: Q4 & ANNUAL RESULTS June 21, 2018
 EARNINGS CALL FISCAL 2018: Q4 & ANNUAL RESULTS June 21, 2018 Disclaimer/Non-GAAP Information IMPORTANT NOTICE The following slides are part of a presentation by Darden Restaurants, Inc. (the "Company")
Luby s Reports Second Quarter Fiscal 2011 Results
 For additional information contact: FOR IMMEDIATE RELEASE DRG&L / 713-529-6600 Ken Dennard / Sheila Stuewe Investor Relations Luby s Reports Second Quarter Fiscal 2011 Results HOUSTON, TX March 10, 2011
Sonic Reports Strong First Quarter of Fiscal 2014 Financial Results
 January 6, 2014 Sonic Reports Strong First Quarter of Fiscal 2014 Financial Results OKLAHOMA CITY--(BUSINESS WIRE)-- Sonic Corp. (NASDAQ: SONC), the nation's largest chain of drive-in restaurants, today
CARA OPERATIONS LIMITED Management s Discussion and Analysis For the years ended December 27, 2015 and December 30, 2014
 CARA OPERATIONS LIMITED Management s Discussion and Analysis For the years ended December 27, 2015 and December 30, 2014 The following Management s Discussion and Analysis ( MD&A ) for Cara Operations
JACK IN THE BOX INC. ICR CONFERENCE JANUARY 9, 2018
 JACK IN THE BOX INC. ICR CONFERENCE JANUARY 9, 2018 JACK IN THE BOX INC. SAFE HARBOR STATEMENT This presentation includes plans and estimates for the future, which are subject to various risks and uncertainties
Forward-looking Statement Disclosure
 Third Quarter 2017 Earnings Call Presentation Valmont Industries. Inc. 2017 Investor Day Forward-looking Statement Disclosure These slides contain (and the accompanying oral discussion will contain) forwardlooking
Q Financial Results. May 4, 2017
 Q1 2017 Financial Results May 4, 2017 Safe Harbor The information made available in this presentation contains forward-looking statements which reflect the Company s current view of future events, results
Restaurant Brands International Reports Full Year and Fourth Quarter 2015 Results
 Restaurant Brands International Reports Full Year and Fourth Quarter 2015 Results Oakville, Ontario February 16, 2016 Restaurant Brands International Inc. (TSX/NYSE: QSR, TSX: QSP) today reported financial
Investor Presentation. December 2014
 Investor Presentation December 2014 Forward-Looking Statements and Non-GAAP Financial Measures Denny s Corporation urges caution in considering its current trends and any outlook on earnings disclosed
The Second Cup Ltd. Management s Discussion and Analysis
 The following ( MD&A ) has been prepared as of July 31, 2013 and is intended to assist in understanding the financial performance and financial condition of The Second Cup Ltd. ( Second Cup or the Company