Investor Presentation
|
|
|
- Alexander Garrett
- 5 years ago
- Views:
Transcription

1 Investor Presentation Sidoti& Company Institutional Investor Forum March 18, 2014
2 Forward-Looking Statements and Non-GAAP Financial Measures Denny s Corporation urges caution in considering its current trends and any outlook on earnings disclosed in this presentation. In addition, certain matters discussed may constitute forward-looking statements. These forward-looking statements, which reflect the Company s best judgment based on factors currently known, are intended to speak only as of the date such statements are made and involve risks, uncertainties, and other factors that may cause the actual performance of Denny s Corporation, its subsidiaries and underlying restaurants to be materially different from the performance indicated or implied by such statements. Words such as expects, anticipates, believes, intends, plans, hopes, and variations of such words and similar expressions are intended to identify such forward-looking statements. Except as may be required by law, the Company expressly disclaims any obligation to update these forward-looking statements to reflect events or circumstances after the date of this presentation or to reflect the occurrence of unanticipated events. Factors that could cause actual performance to differ materially from the performance indicated by these forward-looking statements include, among others: the competitive pressures from within the restaurant industry; the level of success of the Company s operating initiatives, advertising and promotional efforts; adverse publicity; changes in business strategy or development plans; terms and availability of capital; regional weather conditions;overall changes in the general economy, particularly at the retail level; political environment (including acts of war and terrorism); and other factors from time to time set forth in the Company s SEC reports, including but not limited to the discussion in Management s Discussion and Analysis and the risks identified in Item 1A. Risk Factors contained in the Company s Annual Report on Form 10-K for the year ended December 25, 2013 (and in the Company s subsequent quarterly reports on Form 10-Q). The presentation includes references to the Company s non-gaap financials measures. The Company believes that, in addition to other financial measures, Adjusted Income Before Taxes, Adjusted EBITDA, Free Cash Flow, Adjusted Net Income and Adjusted Net Income Per Share are appropriate indicators to assist in the evaluation of its operating performance on a period-to-period basis. The Company also uses Adjusted Income, Adjusted EBITDA and Free Cash Flow internally as performance measures for planning purposes, including the preparation of annual operating budgets, and for compensation purposes, including bonuses for certain employees. Adjusted EBITDA is also used to evaluate its ability to service debt because the excluded charges do not have an impact on its prospective debt servicing capability and these adjustments are contemplated in its credit facility for the computation of its debt covenant ratios. Free Cash Flow, defined as Adjusted EBITDA less cash portion of interest expense net of interest income, capital expenditures, and cash taxes, is used to evaluate operating effectiveness and decisions regarding the allocation of resources. However, Adjusted Income, Adjusted EBITDA, Free Cash Flow, Adjusted Net Income and Adjusted Net Income Per Share should be considered as a supplement to, not a substitute for, operating income, net income or other financial performance measures prepared in accordance with U.S. generally accepted accounting principles. See Appendix for non-gaap reconciliations. 2
3 Denny s Investment Highlights Iconic brand with 96% brand awareness in the U.S.* and 1,700 restaurants in all 50 states in the U.S. and 11 countries & U.S. territories Franchised-focused business that is 90% franchised provides lower risk profile with upside from owning meaningful base of high volume restaurants Unlocking long-term growth through brand revitalization and growing number of domestic and international locations in both traditional and non-traditional distribution points Growing Earnings per Share** with significant Free Cash Flow** Strong balance sheet enables brand investments while returning of cash to shareholders * Source: Denny s BrandTracker, Year End ** See Appendix for reconciliation of Net Income to Adjusted EBITDA, Adjusted Income Before Taxes, Adjusted Net Income, Adjusted Net Income per Share (also called Earnings per Share) and Free Cash Flow. 3
4 Driving Shareholder Returns with America s Diner Revitalization Guests & Sales Achieve Consistent, Positive Same-store Sales Performance through Continued Improvements in Food, Service and Atmosphere Portfolio Growth Increasing Growth Domestically and Internationally through Traditional and Non-Traditional Locations Relationships Model Franchisor with Close Partnerships with Franchisees, Community and Vendors Costs & Margins Support Growth of Profitability and Free Cash Flow* with Disciplined Focus on Operating Costs, Corporate G&A and Capital Allocation * See Appendix for reconciliation of Net Income to Adjusted EBITDA, Adjusted Income Before Taxes, Adjusted Net Income, Adjusted Net Income per Share and Free Cash Flow. 4


5 Driving Guest Traffic with America s Diner Strategy 5

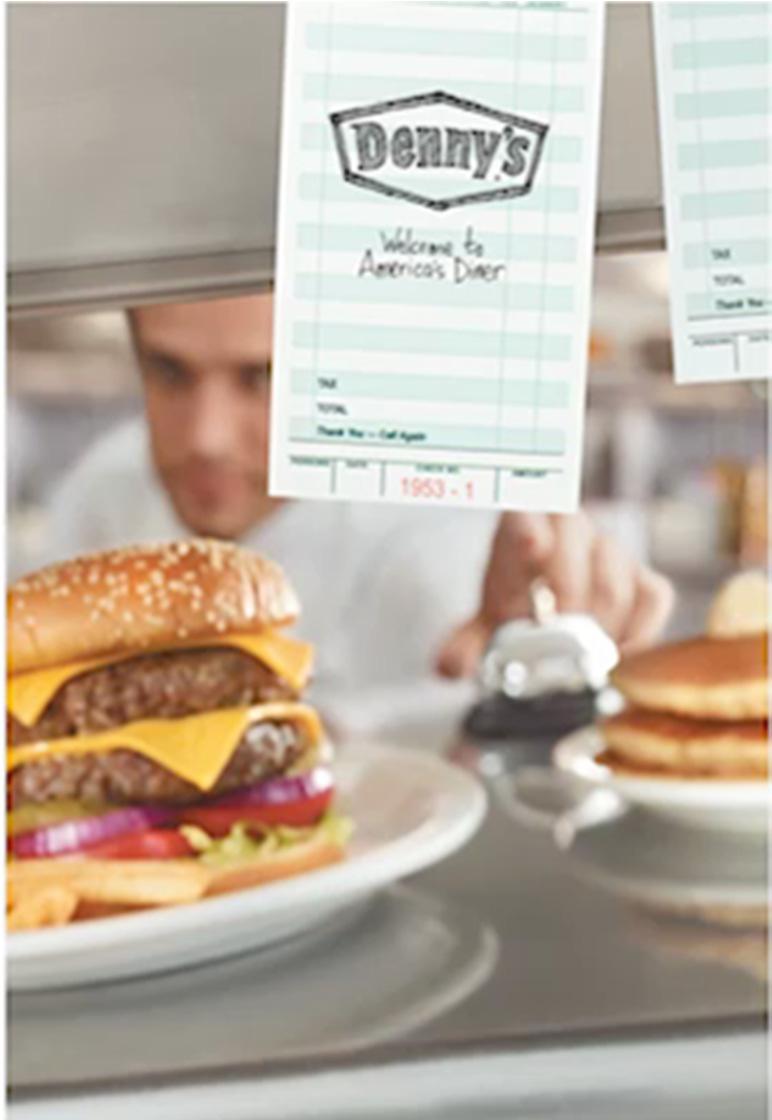
6 America s Diner Positioning Celebration of Diner Heritage Unpretentious, come as you are environment open to all tastes and wallet sizes. Strengthening of the Core Menu for Broader Set of Customers Offering a wide variety of unique and familiar products that you can t make at home. Combination of Everyday Affordability with Limited Time Only Products Promise of Everyday Value with craveable Diner-esqueproducts beyond just breakfast entrées served all day. 6


7 Continuous Improvement of Core Menu with Craveable and Unique Products New Core Menu Rolled Out in 2011, 2012 & 2013 Rolled Out in

8 Leading Everyday Value Platform Provides attractive price points for customers at all dayparts helping drive 1 in 5 visits Achieved over 75% brand awareness with average incidence rate around 19% since national launch Consistently refresh some products and utilize local and national media targeting popular products like $4 Everyday Value Slam 8


9 Strong and Consistent Pipeline of Limited Time Only Products High quality offerings for breakfast, lunch and dinner providing tiered pricing approach combining everyday value and premium offerings 9
10 Improving Guest Service Commitment to deliver consistent, reliable service throughout the brand Driving improvements in guest satisfaction measurements (Speed, Taste, Attentiveness, Restaurant Atmosphere) Guest satisfaction scores improved by almost 10 ppts. over the past three years 80% 75% 70% 65% 60% 55% 50% Overall Satisfaction ( OSAT )* * End of period data (December) from Denny s STAR Guest Satisfaction Program managed by Service Management Group. 10

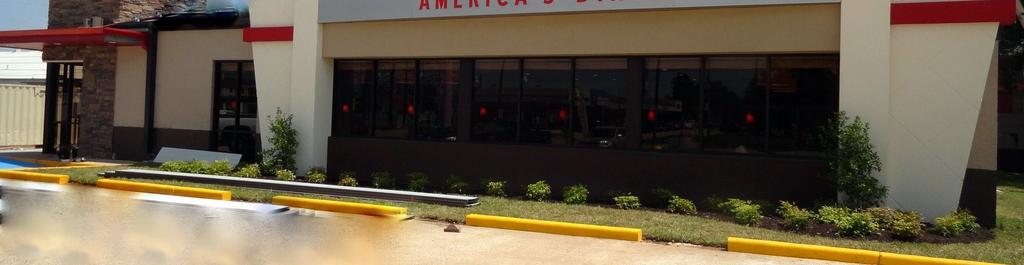
11 New Heritage Remodel Program Common Exterior Look for Older Restaurants 11

12 New Heritage Remodel Program Common Interior Look for Older Restaurants 12

13 New Heritage Remodel Program 13

14 New Heritage Remodel Program 14
15 Enhancing Denny s Atmosphere with New Heritage Remodel Program Creating updated atmosphere with attractive return on investment Initial 49 Heritage remodels completed in 2013 with 26 completed at company restaurants Remodels* Franchise Company Completed 250 Refresh* remodels during 3-year period (2010, 2011, 2012) * Refresh remodel cost approximately $50k vs. $150k to $300k for a full remodel, excluding deferred maintenance. 15

16 New Restaurant with Heritage Image 16


17 Rebuilding Denny s Casino Royale Restaurant in Las Vegas Redevelopment of location by landlord provides opportunity to rebuild Denny s highest volume restaurant 17
18 Continue to Grow and Energize Franchise System Growing group of 274 franchisees with 37 owning more than 10 restaurants, or 53% of system Utilizing Brand Advisory Councils and Denny s Franchisee Association (DFA) to drive improvements Leading full-service franchisor providing support through a number of avenues: In-house purchasing group contracts for the entire system with no product mark-ups Credit card program utilized in more than 90% of the domestic system to collect fees providing lower risk franchise revenue stream Short-term loans to franchisees for new coffee equipment and installation of Denny s POS system Work closely with third-party lenders by providing limited loan guarantees for new development programs (Flying J, New & Emerging Markets, Heritage Remodel Program) 18
19 Improving Same-store Sales Driven by Revitalization Strategy 4.0% 2.0% 0.0% (2.0%) (4.0%) (6.0%) (8.0%) (10.0%) Denny's System-wide Same-Store Sales (Domestic) Denny's 2-year Same-Store Sales (12.0%) Q Q Q Q Q Q Q Q Q Q Q Q Q Q Q Q
20 Franchise-Focused Restaurant Growth Growth initiatives have led to more than 280 new restaurants in last four years with franchisees opening around 90% of new locations New Restaurant Openings & Net System Unit Growth (20) (40) (60) System-wide Openings* 136 Includes total of 123 Flying J Net System Unit Growth Travel Center conversion 107 openings with 100 opened in 2010 and 23 opened in (5) (33) * Excludes acquisitions and relocations. 20
21 Domestic Growth Opportunity Strong market share in many top markets in California, Florida, Arizona and Nevada New & Emerging Markets* development incentive program increasing growth in underpenetrated markets New & Emerging Markets* Denny s Key Markets** DMA Share Units San Diego 32% 39 Las Vegas 31% 28 Miami 28% 41 Los Angeles 27% 192 San Francisco 27% 48 Phoenix 24% 63 Orlando 18% 48 Current Penetration DMA Units New York 8 Boston 6 Charlotte 6 Atlanta 6 Nashville 3 Memphis 3 Cincinnati 1 * New & Emerging Markets defined as DMAs where Denny s does not have #1 or #2 market share in Family Dining spending as definedby Restaurant Trends. ** Source: MidYear 2012 Restaurant Trends FSR MarketSHARE Report with peer group including: IHOP, Mimi s Café, Marie Callendar, Coco s, Carrow s, Waffle House, Shoney s, Perkins, Friendly s, Original Pancake House, First Watch, Panera Bread and other notable brands. 21
22 Growing International Footprint Currently have 101 international restaurants with 15 opened in past three years Announced development agreement for Middle East on January 7, 2014 * United States (1,599) Canada (64) Puerto Rico (12) New Zealand (7) Mexico (6) Costa Rica (3) Honduras (3) Guam(2) Curaçao(1) Dominican Republic (1) El Salvador (1) Chile (1) * Although there are approximately 400 Denny s restaurants in Japan, Denny s sold all of the rights to the country of Japan in

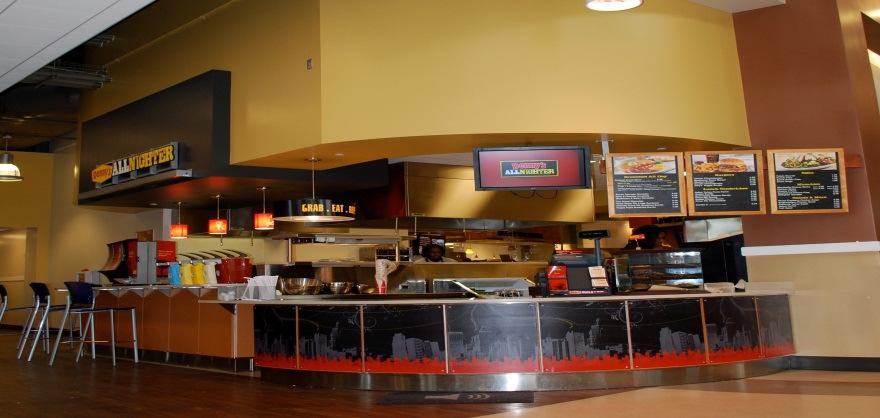
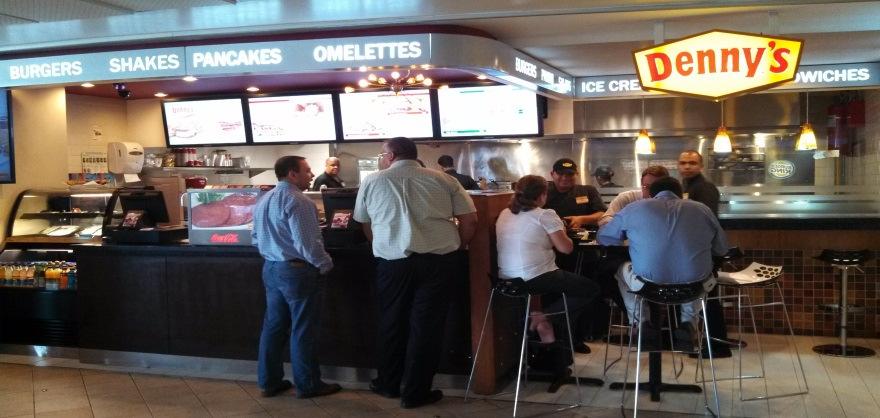

23 Growing through Non-Traditional Locations Travel Centers Universities Airports Military Bases 23
24 Growing Adjusted Earnings per Share* Franchise-focused business model that is 90% franchised provides lower risk with upside from base of 163 high volume restaurants Adjusted Net Income per Share* $0.40 $0.35 $0.30 $0.25 $0.20 $0.15 $0.10 $0.05 $0.00 Adjusted Net Income* Adjusted Net Income per Share* $0.31 $0.26 $ $50 $45 $40 $35 $30 $25 $20 $15 $10 $5 $0 Adjusted Net Income* ($ in Millions) * See Appendix for non-gaap financial reconciliations of Net Income to Adjusted EBITDA, Adjusted Income Before Taxes, Adjusted Net Income, Adjusted Net Income per Share (also called Earnings per Share) and Free Cash Flow. 24
25 Franchised-Focused Business Model with Strong Free Cash Flow* Characteristics Franchise-focused business model generating stronger profitability and free cash flow $ in Millions $140 $120 $100 $80 $60 $40 $20 $108 $11 $120 $34 $93 $19 $88 $28 $85 $37 Total Operating Revenue Adjusted EBITDA* Free Cash Flow* $74 $22 $82 $78 $77 $48 $49 $44 $1,200 $1,000 $800 $600 $400 $200 Total Operating Revenue ($ in Millions) $ ** $0 * See Appendix for non-gaap financial reconciliations of Net Income to Adjusted EBITDA, Adjusted Income Before Taxes, Adjusted Net Income, Adjusted Net Income per Share and Free Cash Flow. ** Includes new construction capital expenditures for 21 Flying J conversion units. 25
26 Strong Balance Sheet with Significant Flexibility Total debt leverage ratio of 2.2x has improved by 57% Enhanced flexibility provides ability to minimize debt repayment enabling brand investments while returning cash to shareholders Total Outstanding Debt*/ Adjusted EBITDA* Ratio 6.0 x 5.0 x 4.0 x 3.0 x 2.0 x 1.0 x 5.1 x $ x $173 $600 $500 $400 $300 $200 $100 Total Outstanding Debt* ($M) 0.0 x $0 * Total Outstanding Debt is Gross Debt including Capital Lease Obligations. See Appendix for non-gaap financial reconciliations of Net Income to Adjusted EBITDA, Adjusted Income Before Taxes, Adjusted Net Income, Adjusted Net Income per Share and Free Cash Flow. 26
27 Returning Value to Shareholders Approximately $72 million of Free Cash Flow allocated to repurchase 15.8 million shares since November 2010* 8.6 million shares available in share repurchase authorization as of Feb. 14, 2014 $ Share Repurchases ($M) $25.0 $20.0 $15.0 $10.0 $5.0 $0.0 $ $21.6 $ $ # of Shares Repurchased (M) Q4 ' * * Data through Dec. 25, 2013 with 9.2M shares available in repurchase authorization as of Dec. 25,
28 Denny s Investment Highlights Iconic brand with 96% brand awareness in the U.S.* and 1,700 restaurants in all 50 states in the U.S. and 11 countries & U.S. territories Franchised-focused business that is 90% franchised provides lower risk profile with upside from owning meaningful base of high volume restaurants Unlocking long-term growth through brand revitalization and growing number of domestic and international locations in both traditional and non-traditional distribution points Growing Earnings per Share** with significant Free Cash Flow** Strong balance sheet enables brand investments while returning of cash to shareholders * Source: Denny s BrandTracker, Year End ** See Appendix for reconciliation of Net Income to Adjusted EBITDA, Adjusted Income Before Taxes, Adjusted Net Income, Adjusted Net Income per Share (also called Earnings per Share) and Free Cash Flow. 28
29 APPENDIX
30 Successful Transition to Franchise Based Business Model through FGI Program Franchise Growth Initiative ( FGI ) Strengthen company portfolio (sale of lower performing restaurants) Tighten company operating geography Gain commitments to future growth FGI Successfully Delivered Results Sold 380 company owned restaurants generating $164 million in total proceeds, excluding real estate Increased franchise mix from 66% to 90% Enhanced performance metrics of company owned restaurant portfolio 66 separate franchisees bought restaurants through FGI (28 new; 38 existing) Franchisees attracted by opportunity to turn around weak performers Goal to maintain a meaningful base of high volume company restaurants going forward # of FGIs % # of Refranchised Restaurants % 80% 85% 86% 88% 90% Company Owned Restaurants Refranchised (By Operating Margin Quintile) Restaurant Operating Margin (1) (1) Excludes area management and other costs. 100% 90% 80% 70% 60% 50% Focus of FGI Program Bottom 20% Top 20% 7.1% 10.9% 14.3% 16.4% 20.6% % Franchised 30
31 Non-GAAP Financial Reconciliations $ in millions * Net income (loss) ($7.3) $28.5 $29.5 $12.7 $41.6 $22.7 $112.3 $22.3 $24.6 Provision for income taxes** (84.0) Operating gains, losses and other charges, net 3.1 (47.9) (31.1) (6.4) (14.5) (4.9) Other nonoperating expense, net (0.6) (3.1) Share-based compensation Adjusted Income before Taxes $4.2 $12.5 $10.5 $23.2 $30.0 $27.3 $37.3 $47.0 $49.2 Interest expense, net Depreciation and amortization Cash pmts for restructuring charges and exit costs (6.7) (5.1) (9.1) (9.1) (7.5) (7.0) (2.7) (3.8) (2.8) Cash pmts for share-based compensation (1.2) (0.9) (0.9) (1.0) (2.4) (1.9) (0.8) (1.0) (1.2) Adjusted EBITDA $107.6 $119.5 $92.9 $88.4 $85.0 $73.8 $81.8 $77.9 $76.9 Adjusted EBITDA Margin % 11.0% 12.0% 9.9% 11.6% 14.0% 13.5% 15.2% 16.0% 16.6% Cash Interest Expense (48.2) (50.9) (38.5) (31.6) (29.3) (23.1) (17.0) (11.6) (9.1) Cash Taxes (1.3) (1.3) (2.3) (1.1) (0.6) (0.9) (1.1) (2.0) (2.8) Capital Expenditures (47.2) (33.1) (33.1) (27.9) (18.4) (27.4) (16.1) (15.6) (20.8) Free Cash Flow $11.0 $34.3 $19.0 $27.9 $36.7 $22.4 $47.6 $48.8 $44.2 Net income (loss) $112.3 $22.3 $24.6 Gains on sales of assets and other, net (3.2) (7.1) (0.1) Impairment charges Early extinguishment of debt Tax effect of adjustments*** (0.8) (1.6) (2.2) Adjusted provision for income taxes**** (94.3) Adjusted Net Income $19.5 $25.2 $29.2 Adjusted Net Income per Share $0.20 $0.26 $0.31 * Includes a 53 rd Week. ** In the fourth quarter of 2011, we recorded an $89 million net deferred tax benefit from the release of a substantial portion ofthe valuation allowance on certain deferred tax assets. This release was primarily based on our improved historical and projected pre-tax income. *** Tax adjustments for the Company's full year 2013 use effective tax rate of 31.9%. Tax adjustments for the Company's full year ended 2011 and 2012 are calculated using the Company's full year 2012 effective tax rate of 36.4%. **** Adjusted provision for income taxes based on full year ended Dec. 27, 2012 effective income tax rate of 36.4% and excludes impact of net deferred tax benefit. 31
Investor Presentation. December 2014
 Investor Presentation December 2014 Forward-Looking Statements and Non-GAAP Financial Measures Denny s Corporation urges caution in considering its current trends and any outlook on earnings disclosed
CL King s Annual Best Ideas Conference
 WELCOME TO AMERICA S DINER CL King s Annual Best Ideas Conference September 10, 2015 Forward Looking Statements and Non-GAAP Financial Measures Denny s Corporation urges caution in considering its current
UNITED STATES SECURITIES AND EXCHANGE COMMISSION Washington, D.C FORM 8-K
 UNITED STATES SECURITIES AND EXCHANGE COMMISSION Washington, D.C. 20549 FORM 8-K CURRENT REPORT PURSUANT TO SECTION 13 OR 15(d) OF THE SECURITIES EXCHANGE ACT OF 1934 Date of Report (Date of earliest event
DENNY S CORPORATION REPORTS RESULTS FOR FOURTH QUARTER AND FULL YEAR 2015
 REPORTS RESULTS FOR FOURTH QUARTER AND FULL YEAR 2015-5.8% Increase in 2015 Full Year Domestic System-Wide Same-Store Sales - - 16.4% Growth in 2015 Full Year Adjusted Net Income per Share* - SPARTANBURG,
Denny's Corporation Reports Results for Second Quarter 2013
 July 29, 2013 Denny's Corporation Reports Results for Second Quarter 2013 Adjusted Net Income Per Share* Increased 20.7% to $0.08 SPARTANBURG, S.C., July 29, 2013 (GLOBE NEWSWIRE) -- Denny's Corporation
DENNY S CORPORATION REPORTS RESULTS FOR FOURTH QUARTER AND FULL YEAR 2016
 REPORTS RESULTS FOR FOURTH QUARTER AND FULL YEAR 2016 SPARTANBURG, S.C., February 15, 2017 - Denny s Corporation (NASDAQ: DENN), franchisor and operator of one of America's largest franchised full-service
DENNY S CORPORATION REPORTS RESULTS FOR FOURTH QUARTER AND FULL YEAR 2017
 REPORTS RESULTS FOR FOURTH QUARTER AND FULL YEAR 2017 SPARTANBURG, S.C., February 13, 2018 - Denny s Corporation (NASDAQ: DENN), franchisor and operator of one of America's largest franchised full-service
UNITED STATES SECURITIES AND EXCHANGE COMMISSION Washington, D.C FORM 8-K
 UNITED STATES SECURITIES AND EXCHANGE COMMISSION Washington, D.C. 20549 FORM 8-K CURRENT REPORT PURSUANT TO SECTION 13 OR 15(d) OF THE SECURITIES EXCHANGE ACT OF 1934 Date of Report (Date of earliest event
DENNY S CORPORATION REPORTS RESULTS FOR THIRD QUARTER 2018
 REPORTS RESULTS FOR THIRD QUARTER 2018 - Announces Refranchising And Development Strategy - SPARTANBURG, S.C., October 30, 2018 - Denny s Corporation (NASDAQ: DENN), franchisor and operator of one of America's
UNITED STATES SECURITIES AND EXCHANGE COMMISSION Washington, D.C FORM 8-K
 UNITED STATES SECURITIES AND EXCHANGE COMMISSION Washington, D.C. 20549 FORM 8-K CURRENT REPORT PURSUANT TO SECTION 13 OR 15(d) OF THE SECURITIES EXCHANGE ACT OF 1934 Date of Report (Date of earliest event
INVESTOR PRESENTATION. August & September 2018
 INVESTOR PRESENTATION August & September 2018 1 FORWARD-LOOKING STATEMENTS AND NON-GAAP FINANCIAL MEASURES Denny s Corporation urges caution in considering its current trends and any outlook on earnings
UNITED STATES SECURITIES AND EXCHANGE COMMISSION Washington, D.C FORM 8-K
 UNITED STATES SECURITIES AND EXCHANGE COMMISSION Washington, D.C. 20549 FORM 8-K CURRENT REPORT PURSUANT TO SECTION 13 OR 15(d) OF THE SECURITIES EXCHANGE ACT OF 1934 Date of Report (Date of earliest event
Dine Brands Global, Inc. Investor Presentation. March 5, 2018
 Dine Brands Global, Inc. Investor Presentation March 5, 2018 2 Disclosures Forward-Looking Information: The content contained in this presentation is as of February 21, 2018. The Company assumes no obligation
UNITED STATES SECURITIES AND EXCHANGE COMMISSION Washington, D.C FORM 8-K
 UNITED STATES SECURITIES AND EXCHANGE COMMISSION Washington, D.C. 20549 FORM 8-K CURRENT REPORT PURSUANT TO SECTION 13 OR 15(d) OF THE SECURITIES EXCHANGE ACT OF 1934 Date of Report (Date of earliest event
DENNY S CORPORATION 2013 ANNUAL REPORT
 DENNY S CORPORATION 2013 ANNUAL REPORT TO OUR VALUED SHAREHOLDERS We are pleased to deliver another year of solid results and continued growth. In 2013, we generated our third consecutive year of positive
ICR XChange Conference. January 16, 2013
 ICR XChange Conference January 16, 2013 0 Safe Harbor Statement Certain statements made in this presentation that reflect management s expectations regarding future events and economic performance are
Dine Brands Global, Inc. Investor Presentation March 2019
 Dine Brands Global, Inc. Investor Presentation March 2019 Disclosures Forward-Looking Information: The content contained in this presentation is as of March 5, 2019. The Company assumes no obligation to
DENNYS CORPORATION 2012 ANNUAL REPORT
 DENNYS CORPORATION 2012 ANNUAL REPORT !"#$%&' () *+*$, *-.*- / *- 0 "12 3 &&' 4' %56 # " *- % %(5& &&' &"*- % % % % " % 0 7 4' 1 # %# ' 2 3 % % 1 # 1 "%& 2 3 # % # %2 38 32 9 % %1 % %1 : ; 8 1% 9 1 % %
Dine Brands Global, Inc. Investor Presentation December 2018
 Dine Brands Global, Inc. Investor Presentation December 2018 Disclosures Forward-Looking Information: The content contained in this presentation is as of December 4, 2018. The Company assumes no obligation
JACK IN THE BOX INC. ICR CONFERENCE JANUARY 9, 2018
 JACK IN THE BOX INC. ICR CONFERENCE JANUARY 9, 2018 JACK IN THE BOX INC. SAFE HARBOR STATEMENT This presentation includes plans and estimates for the future, which are subject to various risks and uncertainties
AFC Enterprises Reports Financial Results for Third Quarter 2010; Raises Fiscal 2010 Earnings Guidance
 November 10, 2010 AFC Enterprises Reports Financial Results for Third Quarter 2010; Raises Fiscal 2010 Earnings Guidance ATLANTA--(BUSINESS WIRE)-- AFC Enterprises, Inc. (NASDAQ: AFCE), the franchisor
Jack in the Box Inc. Reports First Quarter FY 2015 Earnings; Updates Guidance for FY 2015
 Investor Contact: Carol DiRaimo, (858) 571-2407 FOR IMMEDIATE RELEASE Media Contact: Brian Luscomb, (858) 571-2291 Jack in the Box Inc. Reports First Quarter FY 2015 Earnings; Updates Guidance for FY 2015
Investor Presentation. January 2017
 Investor Presentation January 2017 Forward-Looking Statements Forward-Looking Statements This presentation contains forward-looking statements that are subject to risks and uncertainties. All statements
Luby s Reports Fourth Quarter and Fiscal 2015 Results
 For additional information contact: FOR IMMEDIATE RELEASE Dennard-Lascar Associates 713-529-6600 Rick Black / Ken Dennard Investor Relations Luby s Reports Fourth Quarter and Fiscal Results HOUSTON, TX
Dunkin Brands Group, Inc.
 Dunkin Brands Group, Inc. Investor Presentation Fourth Quarter 2013 1 Forward-Looking Statements Certain information contained in this presentation, particularly information regarding future economic performance,
Creating a Global QSR Leader. August 26 th, 2014
 Creating a Global QSR Leader August 26 th, 2014 0 This presentation includes forward-looking statements, which are often identified by the words may, might, believes, thinks, anticipates, expects, intends
El Pollo Loco Holdings, Inc. Announces First Quarter 2015 Financial Results
 May 14, 2015 El Pollo Loco Holdings, Inc. Announces First Quarter 2015 Financial Results COSTA MESA, Calif., May 14, 2015 (GLOBE NEWSWIRE) -- El Pollo Loco Holdings, Inc. (Nasdaq:LOCO) today announced
The ONE Group Announces Fourth Quarter and Fiscal Year 2014 Results Ticker Symbol: U:STKS
 The ONE Group Announces Fourth Quarter and Fiscal Year 2014 Results Ticker Symbol: U:STKS http://finance.yahoo.com/news/one-group-announces-fourth-quarter-202000251.html NEW YORK -- (Business Wire) March
Jack in the Box Inc. Reports Third Quarter FY 2015 Earnings; Updates Guidance for FY 2015; Declares Quarterly Cash Dividend
 Investor Contact: Carol DiRaimo, (858) 571-2407 FOR IMMEDIATE RELEASE Media Contact: Brian Luscomb, (858) 571-2291 Reports Third Quarter FY Earnings; Updates Guidance for FY ; Declares Quarterly Cash Dividend
Famous Dave's Reports Results for Second Quarter Fiscal 2015
 Famous Dave's Reports Results for Second Quarter Fiscal 2015 August 5, 2015 MINNEAPOLIS, Aug. 5, 2015 (GLOBE NEWSWIRE) -- Famous Dave's of America, Inc. (NASDAQ:DAVE) today reported financial results for
Burger King Worldwide, Inc. Fourth Quarter 2012 Earnings Conference Call. February 15, 2013
 Burger King Worldwide, Inc. Fourth Quarter 2012 Earnings Conference Call February 15, 2013 0 Safe Harbor Statement Certain statements made in this presentation that reflect management s expectations regarding
INVESTKentucky Conference Louisville, KY June 6, 2013
 INVESTKentucky Conference Louisville, KY June 6, 2013 Tony Thompson EVP, Chief Operating Officer and President, PJ Food Service Lance Tucker SVP, Chief Financial Officer and Chief Administrative Officer
GOLDEN ENTERTAINMENT REPORTS RECORD 2017 FOURTH QUARTER NET REVENUE OF $184.3 MILLION, NET LOSS OF $13.4 MILLION AND ADJUSTED EBITDA OF $29.
 GOLDEN ENTERTAINMENT REPORTS RECORD 2017 FOURTH QUARTER NET REVENUE OF $184.3 MILLION, NET LOSS OF $13.4 MILLION AND ADJUSTED EBITDA OF $29.0 MILLION LAS VEGAS March 15, 2018 Golden Entertainment, Inc.
FOR IMMEDIATE RELEASE. Investor Contact: Carol DiRaimo, (858) Media Contact: Brian Luscomb, (858)
 Media Contact: Brian Luscomb, (858)") Investor Contact: Carol DiRaimo, (858) 571-2407 FOR IMMEDIATE RELEASE Media Contact: Brian Luscomb, (858) 571-2291 Jack in the Box Inc. Reports Second Quarter FY Earnings; Updates Guidance for FY ; Declares
Investor Contact: Carol DiRaimo, (858) 571-2407 FOR IMMEDIATE RELEASE Media Contact: Brian Luscomb, (858) 571-2291 Jack in the Box Inc. Reports Second Quarter FY Earnings; Updates Guidance for FY ; Declares
Q2 FY 2018 Earnings Conference Call March 27, 2018
 Q2 FY 2018 Earnings Conference Call March 27, 2018 Cautionary Statement Certain information in this presentation may constitute forward-looking statements under the Private Securities Litigation Reform
Cracker Barrel Reports Fourth Quarter And Full Year Fiscal 2018 Results And Provides Guidance For Fiscal 2019
 Cracker Barrel Reports Fourth Quarter And Full Year Fiscal 2018 Results And Provides Guidance For Fiscal 2019 September 18, 2018 Board declares quarterly dividend of $1.25 per share LEBANON, Tenn., Sept.
The Wendy s Company Reports Audited Full-Year 2012 Results
 The Wendy s Company Reports Audited Full-Year 2012 Results Fourth-Quarter Adjusted EBITDA Increased 19% to $95.9 Million; Full-Year Adjusted EBITDA Increased 1% to $333.3 Million Positive Momentum from
Rent-A-Center today is
 INVESTOR PRESENTATION FIRST QUARTER 2014 Safe Harbor This presentation contains forward-looking statements that involve risks and uncertainties. Such forward-looking statements generally can be identified
Jack in the Box Inc. Reports Second Quarter FY 2015 Earnings; Updates Guidance for FY 2015; Raises Quarterly Cash Dividend by 50%
 Investor Contact: Carol DiRaimo, (858) 571-2407 FOR IMMEDIATE RELEASE Media Contact: Brian Luscomb, (858) 571-2291 Reports Second Quarter FY Earnings; Updates Guidance for FY ; Raises Quarterly Cash Dividend
UNITED STATES SECURITIES AND EXCHANGE COMMISSION FORM 10-K. DineEquity, Inc.
 (Mark One) UNITED STATES SECURITIES AND EXCHANGE COMMISSION Washington, D.C. 20549 FORM 10-K ANNUAL REPORT PURSUANT TO SECTION 13 OR 15(d) OF THE SECURITIES EXCHANGE ACT OF 1934 For the fiscal year ended
July 30, Highlights for Q include the following:
 Bloomin' Brands Announces 2018 Q2 Diluted EPS of $0.28 and Adjusted Diluted EPS of $0.38; Q2 Comparable Restaurant Sales Growth of 4.0% at Outback and 2.4% Combined ; Reaffirms Full Year 2018 Guidance
PriceSmart, Inc. February 2018
 PriceSmart, Inc. February 2018 Forward Looking Statements This presentation may contain forward- looking statements concerning the Company's anticipated future revenues and earnings, adequacy of future
The Second Cup Ltd. Management s Discussion and Analysis
 The following ( MD&A ) has been prepared as of May 2, 2013 and is intended to assist in understanding the financial performance and financial condition of The Second Cup Ltd. ( Second Cup or the Company
First Quarter 2016 Earnings
 First Quarter 2016 Earnings Disclaimer Forward-Looking Statements This presentation contains forward-looking statements within the meaning of the Federal Private Securities Litigation Reform Act of 1995.
The Grand Slam America s Real Breakfast
 The Grand Slam America s Real Breakfast Denny s Corporation 2008 Annual Report Denny s is one of America s largest full-service family restaur ant chains, with more than 1,50 0 locations in 49 states and
Bob Evans Express expects to open three new locations during Q2 2015; up to ten new locations expected for fiscal 2015
 BOB EVANS REPORTS FISCAL 2015 FIRST-QUARTER RESULTS Q1 2015 net sales total $326.3 million, a decline of $3.1 million, or 0.9 percent, compared to prior year first-quarter results. GAAP net loss of $0.04
El Pollo Loco Holdings, Inc. Announces Second Quarter 2014 Financial Results
 September 4, 2014 El Pollo Loco Holdings, Inc. Announces Second Quarter 2014 Financial Results COSTA MESA, CA - September 4, 2014 - El Pollo Loco Holdings, Inc. (Nasdaq: LOCO) today announced financial
INVESTOR PRESENTATION. June 2018
 INVESTOR PRESENTATION June 2018 0 Disclaimers Forward-looking statements This presentation contains certain statements, approximations, estimates and projections with respect to our anticipated future
First Quarter Fiscal Calendar Calculation Dates January 1, April 1, 2018 vs. December 26, March 26, 2017
 Bloomin' Brands Announces 2018 Q1 Diluted EPS of $0.68 and Adjusted Diluted EPS of $0.71; Q1 Comparable Restaurant Sales Growth of 4.3% at Outback With Positive Traffic of 2.2%; Q1 Combined Comparable
ARCOS DORADOS 3Q 2016 Conference Call Presentation November 2, 2016
 Agenda ARCOS DORADOS 3Q 2016 Conference Call Presentation November 2, 2016 Disclaimer This presentation contains forward-looking statements that represent our beliefs, projections and predictions about
Popeyes Louisiana Kitchen, Inc. Reports Fiscal 2016 Earnings Results
 February 22, 2017 Reports Fiscal 2016 Earnings Results Completes Credit Facility Expansion ATLANTA--(BUSINESS WIRE)-- (NASDAQ: PLKI), the franchisor and operator of Popeyes restaurants, today reported
COREPOINT LODGING REPORTS FOURTH QUARTER 2018 RESULTS
 FOR IMMEDIATE RELEASE COREPOINT LODGING REPORTS FOURTH QUARTER RESULTS IRVING, Texas March 21, 2019 CorePoint Lodging Inc. (NYSE: CPLG) ( CorePoint or the Company ), a pure play selectservice hotel owner
THE WENDY S COMPANY REPORTS PRELIMINARY 2016 RESULTS; ANNOUNCES 2017 OUTLOOK AND UPDATES 2020 GOALS
 THE WENDY S COMPANY REPORTS PRELIMINARY 2016 RESULTS; ANNOUNCES 2017 OUTLOOK AND UPDATES 2020 GOALS 16th consecutive quarter of positive same-restaurant sales; North America system same-restaurant sales
UNITED STATES SECURITIES AND EXCHANGE COMMISSION
 UNITED STATES SECURITIES AND EXCHANGE COMMISSION Washington, D.C. 20549 FORM 10-K (Mark One) ANNUAL REPORT PURSUANT TO SECTION 13 OR 15(d) OF THE SECURITIES EXCHANGE ACT OF 1934 For the fiscal year ended
BRAND TRANSFORMATION MOMENTUM CONTINUES COMPANY NOW EXPECTS TO COMPLETE SYSTEM OPTIMIZATION INITIATIVE DURING FIRST QUARTER
 THE WENDY S COMPANY REPORTS FINAL 2013 RESULTS; REAFFIRMS 2014 OUTLOOK FULL-YEAR ADJUSTED EBITDA INCREASED 10% TO $367.1 MILLION FULL-YEAR ADJUSTED EARNINGS PER SHARE INCREASED 76% TO $0.30 BRAND TRANSFORMATION
Burger King Holdings, Inc. Non-Deal Roadshow May 2010
 Burger King Holdings, Inc. Non-Deal Roadshow May 2010 Safe harbor statement Certain statements made in this report that reflect management's expectations regarding future events and economic performance
UNITED STATES SECURITIES AND EXCHANGE COMMISSION Washington, D.C Form 10-K
 UNITED STATES SECURITIES AND EXCHANGE COMMISSION Washington, D.C. 20549 Form 10-K ANNUAL REPORT PURSUANT TO SECTION 13 OR 15(d) OF THE SECURITIES EXCHANGE ACT OF 1934 For the Fiscal Year Ended December
FOR IMMEDIATE RELEASE (Analysts) Kevin Kalicak (407) (Media) Rich Jeffers (407)
 Kevin Kalicak (407) (Media) Rich Jeffers (407)") FOR IMMEDIATE RELEASE Contact: (Analysts) Kevin Kalicak (407) 245-5870 (Media) Rich Jeffers (407) 245-4189 DARDEN RESTAURANTS REPORTS FISCAL 2016 SECOND QUARTER RESULTS; REPORTS POSITIVE SAME-RESTAURANT
FOR IMMEDIATE RELEASE Contact: (Analysts) Kevin Kalicak (407) 245-5870 (Media) Rich Jeffers (407) 245-4189 DARDEN RESTAURANTS REPORTS FISCAL 2016 SECOND QUARTER RESULTS; REPORTS POSITIVE SAME-RESTAURANT
(415) (415) LEVI STRAUSS & CO. ANNOUNCES FOURTH QUARTER & FISCAL YEAR 2017 FINANCIAL RESULTS
 (415) LEVI STRAUSS & CO. ANNOUNCES FOURTH QUARTER & FISCAL YEAR 2017 FINANCIAL RESULTS") FOR IMMEDIATE RELEASE Investor Contact: Edelita Tichepco Media Contact: Avery Vaught Levi Strauss & Co. Levi Strauss & Co. (415) 501-1953 (415) 501-2214 Investor-relations@levi.com newsmediarequests@levi.com
FOR IMMEDIATE RELEASE Investor Contact: Edelita Tichepco Media Contact: Avery Vaught Levi Strauss & Co. Levi Strauss & Co. (415) 501-1953 (415) 501-2214 Investor-relations@levi.com newsmediarequests@levi.com
The Second Cup Ltd. Management s Discussion and Analysis
 The following ( MD&A ) has been prepared as of July 31, 2013 and is intended to assist in understanding the financial performance and financial condition of The Second Cup Ltd. ( Second Cup or the Company
GOLDEN ENTERTAINMENT REPORTS 2018 FOURTH QUARTER RESULTS
 GOLDEN ENTERTAINMENT REPORTS 2018 FOURTH QUARTER RESULTS Fourth Quarter and Recent Highlights: The Strat Renovations Remain on Budget Completed Acquisition of Colorado Belle and Edgewater in Laughlin Six
Jefferies Consumer Conference June 2017
 Jefferies Consumer Conference June 2017 Important Information Forward Looking Statements Some of the statements contained in this presentation constitute forward looking statements within the meaning of
Jefferies Winter Consumer Summit Beaver Creek January 26, 2015
 Jefferies Winter Consumer Summit Beaver Creek January 26, 2015 Forward Looking Statements Certain matters discussed in this presentation constitute forward-looking statements within the meaning of the
SeaWorld Entertainment, Inc. Reports Strong First Quarter 2018 Results
 SeaWorld Entertainment, Inc. Reports Strong First Quarter 2018 Results ORLANDO, Fla., May 8, 2018 SeaWorld Entertainment, Inc. (NYSE: SEAS), a leading theme park and entertainment company, today reported
The Second Cup Ltd. Management s Discussion and Analysis
 The following ( MD&A ) has been prepared as of October 31, and is intended to assist in understanding the financial performance and financial condition of The Second Cup Ltd. ( Second Cup or the Company
Dunkin Brands Group, Inc.
 Dunkin Brands Group, Inc. Investor Presentation Jefferies Consumer Conference Nigel Travis Chairman & CEO 1 Forward-Looking Statements Certain information contained in this presentation, particularly information
THE KEG ROYALTIES INCOME FUND FIRST QUARTER REPORT
 THE KEG ROYALTIES INCOME FUND FIRST QUARTER REPORT For the three months ended March 31, 2010 TO OUR UNITHOLDERS On behalf of the Board of Trustees, I am pleased to present the results of The Keg Royalties
Jack in the Box Inc. Reports Third Quarter FY 2017 Earnings; Updates Guidance for FY 2017; Declares Quarterly Cash Dividend
 Investor Contact: Carol DiRaimo, (858) 571-2407 FOR IMMEDIATE RELEASE Media Contact: Brian Luscomb, (858) 571-2291 Jack in the Box Inc. Reports Third Quarter FY Earnings; Updates Guidance for FY ; Declares
F I N A N C E U P D A T E G R O W T H W I T H D I S C I P L I N E
 F I N A N C E U P D A T E G R O W T H W I T H D I S C I P L I N E Jacky Lo, CFO Cautionary Statements Forward-Looking Statements. This presentation contains forward-looking statements within the meaning
CRACKER BARREL REPORTS FOURTH QUARTER AND FULL YEAR FISCAL 2012 RESULTS AND PROVIDES GUIDANCE FOR FISCAL 2013
 Investor Contact: Media Contact: Lawrence E. Hyatt (615) 235-4432 Julie K. Davis (615) 443-9266 CRACKER BARREL REPORTS FOURTH QUARTER AND FULL YEAR FISCAL 2012 RESULTS AND PROVIDES GUIDANCE FOR FISCAL
Cracker Barrel Reports Results For Second Quarter Fiscal 2018 And Updates Earnings Guidance For Fiscal 2018
 Cracker Barrel Reports Results For Second Quarter Fiscal 2018 And Updates Earnings Guidance For Fiscal 2018 February 20, 2018 Company reports positive comparable restaurant and retail sales. Earnings per
The Second Cup Ltd. Management s Discussion and Analysis
 CAUTION REGARDING FORWARD-LOOKING STATEMENTS Certain statements in this ( MD&A ) may constitute forward-looking statements within the meaning of applicable securities legislation. The terms the company,
Investor Presentation March
 1 Investor Presentation March 2016 Presenters 2 Tim Taft President & Chief Executive Officer President & Chief Executive Officer Lynn Schweinfurth Chief Financial Officer Forward-looking Statements 3 This
2016 Fourth-Quarter and Fiscal Year Performance
 206 Fourth-Quarter and Fiscal Year Performance Financial Results and Company Highlights March 4, 207 Disclaimers Forward-Looking Statements and Preliminary Results This presentation includes forward-looking
THE WENDY S COMPANY REPORTS PRELIMINARY 2017 RESULTS; ANNOUNCES 2018 OUTLOOK AND UPDATES 2020 GOALS
 THE WENDY S COMPANY REPORTS PRELIMINARY 2017 RESULTS; ANNOUNCES 2018 OUTLOOK AND UPDATES 2020 GOALS North America same-restaurant sales increase 1.3% in 4Q and 2.0% in 2017; 20th consecutive quarter of
Company reaffirms its 2016 guidance
 JCPENNEY REPORTS A 2.2 PERCENT INCREASE IN COMPARABLE SALES FOR THE SECOND QUARTER Company reaffirms its guidance PLANO, Texas (Aug. 12, ) J. C. Penney Company, Inc. (NYSE: JCP) today announced financial
2017 Jefferies Conference INVESTOR PRESENTATION
 207 Jefferies Conference INVESTOR PRESENTATION June 20, 207 0 Disclaimers Forward-looking statements This presentation contains certain statements, approximations, estimates and projections with respect
MANAGEMENT S DISCUSSION AND ANALYSIS OF FINANCIAL CONDITION AND RESULTS OF OPERATIONS
 MANAGEMENT S DISCUSSION AND ANALYSIS OF FINANCIAL CONDITION AND RESULTS OF OPERATIONS Unless otherwise noted, the section references to (i) us, our, we, the Company and YUM refer to YUM Brands, Inc. and
Luby s Reports Third Quarter Fiscal 2016 Results
 For additional information contact: FOR IMMEDIATE RELEASE Dennard-Lascar Associates Rick Black / Ken Dennard Investor Relations 713-529-6600 Luby s Reports Third Quarter Fiscal Results Luby s Cafeterias
Think it s just pancakes?
 Think it s just pancakes? 2006 annual report $277.5 $52.70 97.1 60.8 38.48 41.89 46.91 84.6 24.00 35.0 0.00 2002 2003 2004 2005 2006 return of cash to shareholders (cumulative amount spent on share repurchases
ARCOS DORADOS REPORTS THIRD QUARTER 2016 FINANCIAL RESULTS
 FOR IMMEDIATE RELEASE ARCOS DORADOS REPORTS THIRD QUARTER 2016 FINANCIAL RESULTS Achieved as reported revenue and mid-teen comparable sales growth and delivered consolidated Adjusted EBITDA margin expansion
Fourth Quarter 2017 Earnings Presentation
 Fourth Quarter 2017 Earnings Presentation Safe Harbor Statement This document may contain certain forward-looking statements within the meaning of the Private Securities Litigation Reform Act of 1995.
ARCOS DORADOS REPORTS THIRD QUARTER 2012 FINANCIAL RESULTS
 FOR IMMEDIATE RELEASE ARCOS DORADOS REPORTS THIRD QUARTER 2012 FINANCIAL RESULTS On track with restaurant opening plan and achieved double-digit organic revenue growth, despite impact of weak Brazilian
The Second Cup Ltd. Management s Discussion and Analysis
 CAUTION REGARDING FORWARD-LOOKING STATEMENTS Certain statements in this ( MD&A ) may constitute forward-looking statements within the meaning of applicable securities legislation. The terms the Company,
Stein Mart, Inc. Reports Fourth Quarter and Fiscal 2018 Results
 Stein Mart, Inc. Reports Fourth Quarter and Fiscal 2018 Results March 13, 2019 Provides 2019 Outlook FY2018 gross profit increased 180 basis points FY2018 SG&A expenses decreased $28.1 million income improved
Same Store Sales Up 4.1 % in Fourth Quarter; 4.5 % for Full Year
 February 25, 2016 JCPENNEY REPORTS FOURTH QUARTER 2015 ADJUSTED EARNINGS PER SHARE OF 39 CENTS; AND A 155 PERCENT INCREASE IN ADJUSTED EBITDA TO $715 MILLION FOR FISCAL 2015 Same Store Sales Up 4.1 % in
INVESTOR PRESENTATION JANUARY 2018
 INVESTOR PRESENTATION JANUARY 2018 0 FORWARD-LOOKING STATEMENTS Forward-Looking Statements This presentation contains forward-looking statements that are subject to risks and uncertainties. All statements
Luby s Reports Fourth Quarter Fiscal 2011 Results
 For additional information contact: FOR IMMEDIATE RELEASE DRG&L / 713-529-6600 Ken Dennard / Sheila Stuewe Investor Relations Luby s Reports Fourth Quarter Fiscal Results HOUSTON, TX November 9, Luby s,
The Second Cup Ltd. Management s Discussion and Analysis
 CAUTION REGARDING FORWARD-LOOKING STATEMENTS Certain statements in this ( MD&A ) may constitute forward-looking statements within the meaning of applicable securities legislation. The terms the Company,
Dave & Buster s Delivers Fourth Consecutive Year of Record Performance
 Dave & Buster s Delivers Fourth Consecutive Year of Record Performance April 3, 2018 Achieves New Revenue, Net Income and EBITDA Highs on Double-Digit Growth in Fiscal 2017 DALLAS, April 03, 2018 (GLOBE
JCPENNEY REPORTS FOURTH QUARTER AND FISCAL 2018 EARNINGS. Inventory Reduced 13.1 % From Prior Year
 JCPENNEY REPORTS FOURTH QUARTER AND FISCAL EARNINGS Inventory Reduced 13.1 % From Prior Year Generated Positive Operating Cash Flow of $359M and Free Cash Flow of $111M in Fiscal PLANO, Texas (Feb. 28,
Investor Presentation S E P T E M B E R
 Investor Presentation S E P T E M B E R 2 0 1 6 Disclosure Regarding Forward-Looking Statements This presentation contains forward-looking statements. These forward-looking statements reflect the views
Hyatt Hotels Corporation. Goldman Sachs Lodging, Gaming, Restaurant and Leisure Conference
 Hyatt Hotels Corporation Goldman Sachs Lodging, Gaming, Restaurant and Leisure Conference June 3, 2014 2 Forward Looking Statements Forward-Looking Statements in this presentation, which are not historical
INVESTKentucky Conference. June 9, 2011
 INVESTKentucky Conference Louisville, KY June 9, 2011 Chris Sternberg SVP, Corporate Communications and General Counsel Keeta Fox Vice President, Finance Forward Looking Statements and Additional Information
Fiesta Restaurant Group, Inc. Reports Fourth Quarter and Full Year 2012 Results
 FOR IMMEDIATE RELEASE Investor Relations Contact: Raphael Gross 203-682-8253 investors@frgi.com Reports Fourth Quarter and Full Year 2012 Results Addison, TX - (Businesswire) - February 28, 2013 - ( Fiesta
Hyatt Hotels Corporation Investor Presentation
 Hyatt Hotels Corporation Investor Presentation August 2016 2 Forward-Looking Statements Forward-Looking Statements in this presentation, which are not historical facts, are forward-looking statements within
Jack in the Box Inc. Reports Second Quarter FY 2014 Earnings; Updates Guidance for FY 2014
 Investor Contact: Carol DiRaimo, (858) 571-2407 FOR IMMEDIATE RELEASE Media Contact: Brian Luscomb, (858) 571-2291 Reports Second Quarter FY Earnings; Updates Guidance for FY SAN DIEGO, May 14, (NASDAQ:
Investor Contact: Aida Orphan Media Contact: Amber McCasland (415) (415)
 (415)") FOR IMMEDIATE RELEASE Investor Contact: Aida Orphan Media Contact: Amber McCasland Levi Strauss & Co. Levi Strauss & Co. (415) 501-6194 (415) 501-7777 Investor-relations@levi.com newsmediarequests@levi.com
FOR IMMEDIATE RELEASE Investor Contact: Aida Orphan Media Contact: Amber McCasland Levi Strauss & Co. Levi Strauss & Co. (415) 501-6194 (415) 501-7777 Investor-relations@levi.com newsmediarequests@levi.com
Buffalo Wild Wings, Inc. Announces Second Quarter Earnings per Share of $0.55 and Adjusted Earnings per Share of $0.66
 July 26, 2017 Buffalo Wild Wings, Inc. Announces Second Quarter Earnings per Share of $0.55 and Adjusted Earnings per Share of $0.66 -FY2017 Guidance Updated to $4.00 to $4.50 GAAP EPS and $4.50 to $5.00
Planet Fitness, Inc. Announces Fourth Quarter and Fiscal Year 2017 Results
 NEWS RELEASE Planet Fitness, Inc. Announces Fourth Quarter and Fiscal Year 2017 Results 2/22/2018 Fourth Quarter System-Wide Same Store Sales Increased 11.6% 210 New Planet Fitness Stores Opened System