Burger King Holdings, Inc. Non-Deal Roadshow May 2010
|
|
|
- Phyllis Green
- 5 years ago
- Views:
Transcription

1 Burger King Holdings, Inc. Non-Deal Roadshow May 2010

2 Safe harbor statement Certain statements made in this report that reflect management's expectations regarding future events and economic performance are forward-looking in nature and, accordingly, are subject to risks and uncertainties. These forward-looking statements include statements regarding our ability to effectively manage our business for the long term to ensure the success and growth of the brand; our expectations regarding our ability to open 250 to 300 net new restaurants during fiscal 2010; our expectations regarding our fiscal 2010 fourth quarter marketing calendar and the success of the featured products and promotions; our expectations regarding our ability to drive higher check with new indulgent products; our expectations regarding our ability to successfully position the brand for when the economy recovers; our expectations regarding our ability to offer a product line-up that includes a balance of value and premium products to take full advantage of our proprietary flexible broiler; our expectations regarding the success of our enhanced breakfast platform, led by the roll-out of Seattle s Best Coffee ; our expectations regarding our ability to remain on track in both our net new restaurant openings and on our restaurant reimaging initiative; our expectations regarding our ability to continue to find new ways to run even more efficient restaurants and control overhead spending; our expectations regarding our global momentum and ability to keep moving the brand forward; our expectations regarding fourth quarter and full fiscal year 2010 worldwide system comparable sales; and other expectations regarding our future financial and operational results. These forward-looking statements are only predictions based on our current expectations and projections about future events. Important factors could cause our actual results, level of activity, performance or achievements to differ materially from those expressed or implied by these forwardlooking statements. These factors include those risk factors set forth in filings with the Securities and Exchange Commission, including our annual and quarterly reports, and the following: global economic or other business conditions that may affect the desire or ability of our customers to purchase our products such as inflationary pressures, higher unemployment rates, increases in gas prices, declines in median income growth, consumer confidence and consumer discretionary spending and changes in consumer preferences, and the impact of negative sales and traffic on our business, including the risk that we will be required to incur non-cash impairment or other charges that reduce our earnings; risks related to adverse weather conditions and other uncontrollable events, and the impact of such events on our operating results; our ability to compete domestically and internationally in an intensely competitive industry; our ability to successfully implement our international growth strategy and risks related to our international operations; risks arising from the significant and rapid fluctuations in the currency exchange markets and the decisions and positions that we take to hedge such volatility; risks related to continued losses in our German business, including the potential for an impairment of our long-lived assets and a valuation allowance on a portion of our deferred tax asset balance, which would have a negative impact on our future effective income tax rate, operating results and financial condition; our ability and the ability of our franchisees to manage increases in operating costs, including future mandated health care costs, if we or our franchisees choose not to pass, or cannot pass, these increased costs on to our guests; our relationship with, and the success of, our franchisees; the effectiveness of our marketing and advertising programs and franchisee support of these programs; risks related to franchisee financial distress due to issues arising with their Burger King restaurants or losses from other businesses, which could result in, among other things, restaurant closures, delayed or reduced payments to us of royalties and rents and increased exposure to third parties, such as landlords; the ability of our franchisees to refinance their business or to obtain new financing for development, restaurant remodels and equipment initiatives on acceptable terms or at all, and the strength of the financial institutions that have historically provided financing to franchisees; risks related to disruptions and catastrophic events, including disruption in the financial markets, war, terrorism and other international conflicts, public health issues such as the H1N1 flu pandemic, and natural disasters, and the impact of such events on our operating results; risks related to food safety, including foodborne illness and food tampering, and the safety of toys and other promotional items available in our restaurants; risks related to the loss of any of our major distributors, particularly in those international markets where we have a single distributor, and interruptions in the supply, or increases in the cost, of necessary products to us due to adverse weather and climate conditions or otherwise; our ability to execute on our reimaging program in the U.S. and Canada to increase sales and profitability and our ability to successfully execute our portfolio management strategy; our ability to implement our growth strategy and strategic initiatives given restrictions imposed by our senior credit facility; risks related to the ability of counterparties to our secured credit facility, interest rate swaps and foreign currency forward contracts to fulfill their commitments and/or obligations; risks related to interruptions or security breaches of our computer systems and risks related to the lack of integration of our worldwide technology systems; our ability to continue to extend our hours of operation, at least in the U.S. and Canada, to capture a larger share of both the breakfast and late night dayparts; changes in consumer perceptions of dietary health and food safety and negative publicity relating to our products; our ability to retain or replace executive officers and key members of management with qualified personnel; risks related to changes in the mix of earnings in countries with different statutory tax rates, changes in the valuation of deferred tax assets and liabilities and continued losses in certain international Company restaurant markets that could trigger a valuation allowance or negatively impact our ability to utilize foreign tax credits to offset our U.S. income taxes; risks related to the reasonableness of our tax estimates, including sales, excise, GST, VAT and other taxes; our ability to realize our expected tax benefits from the realignment of our European and Asian businesses; our ability to manage changing labor conditions in the U.S. and internationally; adverse legal judgments, settlements or pressure tactics; and adverse legislation or regulation. These risks are not exhaustive and may not include factors which could adversely impact our business and financial performance. Moreover, we operate in a very competitive and rapidly changing environment. New risk factors emerge from time to time and it is not possible for our management to predict all risk factors, nor can we assess the impact of all factors on our business or the extent to which any factor, or combination of factors, may cause actual results to differ materially from those contained in any forward-looking statements. Although we believe the expectations reflected in the forward-looking statements are reasonable, we cannot guarantee future results, level of activity, performance or achievements. Moreover, neither we nor any other person assumes responsibility for the accuracy or completeness of any of these forward-looking statements. You should not rely upon forward-looking statements as predictions of future events. We do not undertake any responsibility to update any of these forward-looking statements to conform our prior statements to actual results or revised expectations. This presentation also includes non-gaap financial measures as defined in Regulation G. The reconciliations of these non-gaap financial measures to their most comparable GAAP financial measures and other information required by Regulation G are included in the appendix to this presentation (see slides 41-45) posted on our website at 2


3 John Chidsey Chairman and CEO


4 Strong global presence Worldwide (WW) # of restaurants 12,115 12% Company / 88% franchise U.S. & Canada Latin America EMEA / APAC # of restaurants 7,557 14% Company / 86% franchise # of restaurants 1,109 9% Company / 91% franchise # of restaurants 3,449 10% Company / 90% franchise Note: Restaurant count as of March 31,
5 Where we are today Worldwide net restaurant growth rate is among the highest in the industry Strong operating cash flow generation Significant progress in restaurant level initiatives, equipment and tools, aimed at enhancing profitability Product innovation flexing both ends of barbell menu focus on daypart expansion Consistently delivering on our True North Plan s four pillars: Profitably growing the brand Running great restaurants Investing wisely Focusing on our people 5
6 The future in focus: True North Plan Our Directional Plan for Success Grow the Brand Deliver a consistent Brand image Increase ARS and net restaurant growth in existing and new markets Continue product innovation leadership Leverage barbell menu strategy Drive breakfast, late-nite, snacking dayparts Provide the best value for the money Run Great Restaurants Deliver a consistently excellent experience to guest, every time Leverage flame-broiled cooking platform Equipment innovation to drive efficiencies and cost management Invest Wisely Focus on investments that produce the best returns Upgrade restaurant image with attractive cash-on-cash returns Effectively manage costs and improve controls at the restaurant level Roll-out new equipment Focus on People Aligning our people to our business strategy Strong focus on succession planning Cultivate relations with our #1 customer, our franchisees Continue to engage and develop our people while upholding our Pay for Performance culture We remain committed and focused on the success and growth of our brand by effectively managing our business for the long term 6
7 Current challenges and opportunities Main challenge High levels of unemployment and underemployment Company focus Cost containment Development Improving comparable sales and traffic Opportunities Continued deployment of equipment and tools aimed at improving restaurant level performance Lower real estate and construction costs in the U.S. Combination of affordable and indulgent products 7


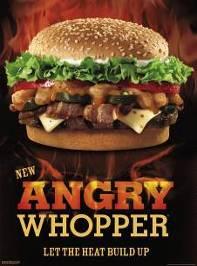

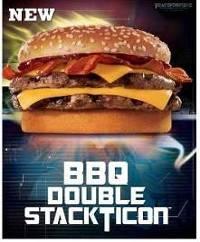
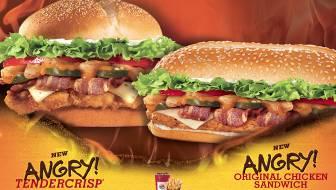


8 Robust product pipeline Past Now and future Affordable Offerings Indulgent Offerings We are tactically flexing both ends of our Barbell Menu Strategy aimed at driving average check and traffic 8


9 Marketing overview Food Brand and Social Brand Movie tie-ins, digital media, concerts, games and much more Whopper Freakout & Whopper Virgins Flame TM body spray 1980 s NIKE 1990 s BUDWEISER 2000 s BURGER KING X-BOX Social Networking We are repositioning our marketing efforts from one of brand stature to one of brand strength 9
10 Operations excellence: Running great restaurants Clean and safe Playgrounds Our focus: Hot and fresh Great burger strategy Friendly and fast Have It Your Way service Teach and coach Global training consistency Cost and controls Profitability walk-thru Progressive improvements: Operations excellence Expansion of our footprint: Worldwide operations excellence scores GuestTrac SM Speed of service Lower employee turnover Competitive hours New broiler rolled out to 70% of the system worldwide New POS rolled out to 59% of the system worldwide Note: Broiler roll out percentage consists of ordered or installed equipment as of March 31,
11 Worldwide development: Growing the brand Net restaurant growth by segment - percentage of total U.S. and Canada Latin America EMEA/APAC Percentage restaurant count distribution At IPO, Now 1 and 5 year projection At IPO U.S. & Canada International % % 68% % Now 1 56% 38% 62% 35% 9% 6% 21% 11% 18% 5 year projection FY2008 FY2009 TTM Q3 FY % 50% Portfolio diversification International segments represented 32% of our total restaurant count at the time of IPO, now they represent 38% 1 Based on restaurant count as of March 31,


12 New restaurants Exterior Note: First row from left to right: Franchise restaurants located in Ridgeland, Mississippi and Anderson, South Carolina, respectively. Second row from left to right: Franchise restaurants located in North Port, Florida and Houston, Texas, respectively. 12


13 New restaurants Interior Note: First row from left to right: Company restaurants located in High Point, North Carolina and Charlotte, North Carolina, respectively. Second row from left to right: Franchise restaurants located in Houston, Texas. 13


14 Investing to drive future growth 20/20 restaurant image Whopper TM Bar Note: First row: Company restaurant located in Singapore. Second row: Company and Franchise restaurants located in Clarke Quay, Singapore and Malaga, Spain, respectively. 14


15 Company restaurant Remodel BEFORE AFTER Remodels continue to generate solid sales lifts Note: Photo of a Company restaurant located in Bricktown, New Jersey. 15


16 Company restaurant Scrape and rebuild BEFORE AFTER Our upgraded image is enhancing the guest experience Note: Photo of a Company restaurant located in Greensboro, North Carolina. 16


17 Reflags and Conversions KFC & Pizza Hut Reflag Starbucks Conversion Taking advantage of current deflationary commercial real estate environment Note: Franchise restaurants located in Chicago, Illinois and La Mirada, California, respectively. 17
18 Benefit of worldwide ARS growth on EBITDA Worldwide franchise restaurant impact 1 Worldwide Company restaurant impact 1 10,657 franchise restaurants X $100,000 increase in ARS = $1,066M increased franchise system sales X Avg. royalty rate of 4.06% 2 = Potential EBITDA 3 upside of $43M 1,458 Company restaurants X $100,000 increase in ARS = $146M increased company system sales X 35% flow through rate = Potential EBITDA 3 upside of $51M Every $100K increase in worldwide ARS could drive an increase of approximately $94M in EBITDA 3 and $0.44 in EPS 1 Worldwide restaurant count as of March 31, The blended worldwide royalty rate for Q3 FY2010 was 4.09% and included approximately $1.2 million of deferred royalty payments in EMEA. Net of the deferred royalty payments, the blended worldwide royalty rate was 4.06%. 3 EBITDA is a non-gaap financial measure; see appendix for why management believes this is a meaningful measure. 18
19 Benefit of net restaurant growth on EBITDA Worldwide franchise restaurant impact 1 Worldwide Company restaurant impact franchise restaurants X $1.3M ARS = $322M increased franchise system sales X Avg. royalty rate of 4.06% 2 = Potential EBITDA 3 upside of $13M 27 Company restaurants X $1.3M ARS = $35M increased company system sales X Company restaurant margin 4 = Potential EBITDA 3 upside of $6M Net restaurant growth target could drive an increase of approximately $19M in EBITDA 3 and $0.09 in EPS 1 Assumes average of net new restaurant growth as per guidance provided during Q3 FY2010 earnings call on April 29, The blended worldwide royalty rate for Q3 FY2010 was 4.09% and included approximately $1.2 million of deferred royalty payments in EMEA. Net of the deferred royalty payments, the blended worldwide royalty rate was 4.06%. 3 EBITDA is a non-gaap financial measure; see appendix for why management believes this is a meaningful measure. 4 Based on company restaurant margins for TTM Q2 FY2010 for restaurants in the $1.3M - $1.5M ARS sales band. 19
20 Worldwide net restaurant growth and SSS Net restaurant growth Same store sales % 5.4% % % 1.9% 1.2% 25 FY2006 FY2007 FY2008 FY2009 TTM Q3 FY % FY2004 FY2005 FY2006 FY2007 FY2008 FY2009 Q1 - Q3 FY2010 Our net restaurant growth rate is among the highest in the industry and we continue to develop innovative products that support both ends of our barbell menu strategy 20
21 Net restaurant growth: Growing the brand Top restaurant count markets - vast development opportunities Restaurants as of 3/31/2010 % of total MCD restaurant 1 count % of total U.S. Germany UK Spain Mexico Australia Canada 7, % 6% 4% 4% 3% 3% 2% 13,954 1,364 1, ,427 43% 4% 4% 1% 1% 3% 4% Subtotal 9,992 82% 19,535 60% Rest of world 2,123 18% 12,953 40% Total 12, % 32, % Since the IPO, we have entered into 11 new countries and have opened more than 1,000 net new restaurants Note: Restaurant count as of March 31, McDonald s restaurant count is as of March 31, 2010 as reported in McDonald s Form 8-K filed on April 21,
22 The results - Our Scorecard OUR PROGRESS CONTINUES: FY2006 FY2007 FY2008 FY2009 Q1 Q3 FY2010 Increased restaurant count 11,129 11,283 11,565 11,925 12,115 Worldwide comp sales (in constant currencies) 1 1.9% 3.4% 5.4% 1.2% (2.9)% TTM worldwide average restaurant sales (ARS) $1.13M $1.19M $1.30M $1.26M $1.24M 2 Company restaurant margin (CRM) 14.5% 15.0% 14.3% 12.6% 12.7% Royalty rate 3.68% 3.79% 3.98% 4.05% 4.04% Solid capital structure (net debt to TTM adjusted EBITDA) 3 2.5x 2.1x 1.8x 1.9x 1.7x We continue to find ways to run even more efficient restaurants and control our overhead spending 1 Comp sales are analyzed on a constant currency basis, which means they are calculated by using the average exchange rate of the prior year period for both periods under comparison to remove the effects of currency fluctuation from this trend analysis. 2 The worldwide ARS shown above includes the unfavorable impact from the movement of currency exchange rates of $6,000 for TTM Q3 FY EBITDA, adjusted EBITDA, TTM adjusted EBITDA, net debt, and net debt to TTM adjusted EBITDA are non-gaap financial measures; see appendix for reconciliations to GAAP measures and why management believes these are meaningful measures. TTM adjusted EBITDA is adjusted EBITDA for the trailing twelve month (TTM) period. 22
23 The results strong worldwide performance Strong revenue growth (in $ millions) Solid profitability adjusted EBITDA 2 (in $ millions) $1,940 $2,048 CAGR 1 = 7% $2,455 $2,234 $2,537 $2,509 $346 CAGR 1 = 10% $387 $450 $441 $443 $302 FY2005 FY2006 FY2007 FY2008 FY2009 TTM Q3 FY2010 Adjusted earnings per share consistent EPS growth 2 $0.85 CAGR 1 = 20% $1.11 $1.38 FY2006 FY2007 FY2008 FY2009 FY2005 FY2006 FY2007 FY2008 FY2009 TTM Q3 FY2010 $1.48 FY2009 EPS results include a negative impact due to the effect of currency translation of $0.10 per share 3 1 Compounded annual growth rate (CAGR) based on full years only. BKC was not a public company in FY2005, therefore EPS was not applicable. 2 Adjusted EBITDA and adjusted EPS are non-gaap financial measures; see appendix for reconciliations to GAAP measures and why management believes these are meaningful measures. 3 Management reviews and analyzes business results excluding the effect of currency translation believing this better represents the company's underlying business trends. Results excluding the effect of currency translation are calculated by translating current year results at prior year average exchange rates. 23
24 Balance sheet and uses of cash In $ millions Capital structure In $ millions Uses of cash: $1,000 $500 $- FY2006 FY2007 FY2008 FY2009 Mar Total cash $258.8 $169.5 $166.0 $121.7 $ Total debt $1,064.5 $942.5 $947.4 $888.9 $ Total net debt $855.7 $823.0 $831.4 $817.2 $734.7 Net debt / TTM adjusted 2.5x 2.1x 1.8x 1.9x 1.7x 3 EBITDA Uses of Cash Q1- Q3 FY2010 Q1-Q3 FY2009 Capex $90.1 $124.6 Term debt and capital lease obligations Dividends Share repurchases Acquisitions Drawing on revolver, net Total $182.4 $251.3 We believe our ability to generate solid cash flow is a fundamental benefit of our highly franchised business model 1 Total debt includes short-term debt and capital leases, long-term debt and long-term capital leases. 2 Total net debt is debt minus cash in excess of $50 million. 3 EBITDA, adjusted EBITDA, net debt, and net debt/ TTM adjusted EBITDA are non-gaap financial measures; see appendix for reconciliations to GAAP measures and why management believes these are meaningful measures. 24
25 Long-term financial targets The company expects to achieve over the long-term: 1 Average annual worldwide comp sales growth of 2 to 3% 2 Average annual net restaurant growth of 3 to 4% Average annual revenue growth of 6 to 7% Average annual EBITDA growth of 10 to 12% 3 Average annual EPS growth of 15% We remain committed to our long-term plan for creating significant value for our stakeholders 1 Long-term targets assume no material impact from currency translation. As reported in our Q4 FY2009 earnings release filed on August 25, Comp sales are analyzed on a constant currency basis, which means they are calculated by using the average exchange rate of the prior year period for both periods under comparison to remove the effects of currency fluctuation from this trend analysis. 3 EBITDA (earnings before interest, taxes, depreciation and amortization) is a non-gaap financial measure; see appendix for why management believes this is a meaningful measure. 25

26 Appendix
 highlights 29 Asia Pacific (APAC) highlights 30 Latin America highlights 31 Key revenue performance measures 32 Comp sales 33 U.S.")
27 Appendix Data Page U.S. and Canada highlights 28 Europe, the Middle East and Africa (EMEA) highlights 29 Asia Pacific (APAC) highlights 30 Latin America highlights 31 Key revenue performance measures 32 Comp sales 33 U.S. competitive hours of operation 34 U.S. and Canada Reimaging Program 35 U.S. and Canada average restaurant sales 36 U.S. company restaurant margin 37 Company restaurant expenses as a percentage of revenues 38 Income statement 39 Share count 40 27


28 U.S. and Canada highlights 22% increase in U.S. and Canada system ARS to $1.22M 1 from $1.0M in FY2004 On target to complete three consecutive years of positive net restaurant growth Reimaging program yielding solid ROI Ongoing portfolio management Continuous improvement across operations metrics Cost saving and revenue driving initiatives: New broiler rolled out to 98% of segment system as of 3/31/ New POS hardware rolled out to 63% of segment system as of 3/31/ ARS as of TTM March 31, Broiler roll out percentage consists of ordered or installed equipment. Note: U.S. and Canada system restaurants include both Company-owned and franchise restaurants. 28


29 Europe, the Middle East and Africa (EMEA) highlights Second largest geographic area behind the U.S. EMEA Entered new markets in Central and Eastern Europe, Middle East and Africa over the past two years including Russia and Czech Republic In FY2009, the region posted record openings for the fifth consecutive year, representing over half of the company s worldwide net restaurant growth Continued net restaurant growth via contiguous expansion Central and Eastern Europe Middle East and Africa Upgrading our restaurant image to match our premium product positioning Highest ARS restaurant worldwide is located in Schiphol airport, Amsterdam, with $13M 1 1 Based on TTM ended March 31,

30 Asia Pacific (APAC) highlights Today leveraging the power of the brand and our flame-broiled cooking platform APAC In FY2009, the region opened more restaurants than during the last four years combined Launched global Operations Excellence Platforms Focus on value Whopper sandwich extensions Investing in restaurant image and décor Significant opportunity to grow the brand in existing and new markets: Re-entered Japan Entered Indonesia Continued development in China Development agreement in Hong Kong Projecting brand presence via gateway airport locations Seeding development in Taiwan and China via joint ventures Opened first company restaurant in Singapore in July

31 Latin America highlights 15 years of positive comp sales growth Latin America Strong net restaurant growth continues Brazil market entry four years later 78 restaurants Those opened for 12 months have a TTM ARS of $1.8M 1 Plans to open approximately 140 restaurants over the next five years Central America and Caribbean market leadership with best-in-class franchisees Puerto Rico total of 175 restaurants with a $1.6M 1 ARS South America vast expansion opportunities 1 Based on TTM ended March 31, Note: FZ refers to franchisee(s). 31
32 Key revenue performance measures Comp sales, sales growth and ARS Comp sales FY2010 FY2009 (In constant currencies) (In constant currencies) United States and Canada -6.1% 1.6% -4.6% 2.2% EMEA / APAC 1.1% -0.6% 1.0% 3.1% Latin America -1.6% 1.3% -3.0% 3.6% Total worldwide -3.7% 1.0% -2.9% 2.5% Sales growth Quarters ended March 31, (In constant currencies) Q1 - Q3 (In constant currencies) United States and Canada -5.5% 2.8% -3.9% 3.0% EMEA / APAC 7.3% 6.3% 8.2% 9.6% Latin America 3.0% 7.2% 0.9% 11.2% Total worldwide -1.5% 4.1% -0.1% 5.5% (In actual currencies) (In actual currencies) Worldwide average restaurant sales (in $ thousands) 1 $ 294 $ 294 $ 935 $ 949 Restaurant count As of March 31, Inc/ (Dec) Number of Company restaurants United States and Canada 1,030 1,054 (24) EMEA / APAC Latin America Total 1,458 1, Number of franchise restaurants United States and Canada 6,527 6, EMEA / APAC 3,116 2, Latin America 1, Total 10,657 10, Total worldwide restaurant count 12,115 11, ARS for Q3 FY2010 and FY2010 year-to-date includes the favorable impact from the movement of currency exchange rates of $12,000 and $14,000, respectively. 32
33 Comp sales Worldwide comp sales growth 1 U.S. and Canada system comp sales growth 1 5.9% 5.8% 5.3% 6.6% 3.2% 4.4% 4.5% 3.6% 2.9% 1.0% 5.4% 5.5% 4.8% 4.2% 2.6% 3.0% 1.9% 1.6% 3Q07 4Q07 1Q08 2Q08 3Q08 4Q08 1Q09 2Q09 3Q09 4Q09 1Q10 2Q10 3Q10 3Q07 4Q07 1Q08 2Q08 3Q08 4Q08 1Q09 2Q09 3Q09 4Q09 1Q10 2Q10 3Q10 (2.0% ) 5.6% 5.4% (2.4% ) (2.9% ) (3.7% ) 6.6% 5.4% (4.5% )(4.6% ) (3.3% ) (6.1% ) 3.4% 3.6% 1.0% 1.9% 1.2% (2.9% ) (0.5% ) 2.5% 0.4% (4.6% ) FY2004 FY2005 FY2006 FY2007 FY2008 FY2009 Q1 - Q3 FY2010 FY2004 FY2005 FY2006 FY2007 FY2008 FY2009 Q1 - Q3 FY Comp sales are analyzed on a constant currency basis, which means they are calculated by using the average exchange rate of the prior year period for both periods under comparison to remove the effects of currency fluctuation from this trend analysis. 33
34 U.S. competitive hours Burger King McDonald s 6 a.m. or earlier Yellow represents opportunity 1 87% 98% Later than 11 p.m. Yellow represents opportunity 1 Burger King McDonald s Wendy s 88% 82% 85% Burger King McDonald s 24 hours of operation Yellow represents opportunity 1 15% 56% Competitive hours of operation opportunity 1 Based on BKC survey completed in December


35 Reimaging program: Where we are today U.S. and Canada reimaging program 147 restaurants completed since program s inception 1 Results validated Improved criteria for selection U.S. and Canada Reimaging program Number of restaurants 1 Company remodels / scrape and rebuilds 92 BKL s remodels / scrape and rebuilds 55 Our reimaging program is delivering solid returns 1 Includes both Company restaurants and properties leased to franchisees (BKL s) Note: As of March 31,
36 Our interim ARS goal of $1.5M U.S. and Canada system restaurants ($ millions) 1 $1.5M CAGR: 5% $1.18M $1.26M $1.27M $1.22M Growing the brand $1.00M $0.96M $1.08M $1.12M Running great restaurants Investing wisely Focusing on our people FY2004 FY2005 FY2006. FY2007 FY2008 FY2009 TTM Q3 FY2010 True North - Our Directional Plan for Success ARS Goal We continue to execute against the fundamentals of our True North plan of profitably growing the brand, running great restaurants, investing wisely and focusing on our people 1 U.S. and Canada system restaurants include both Company-owned and franchise restaurants; only includes restaurants open during the period. 36
37 Top-line and bottom-line growth: ARS and CRM U.S. Company restaurant ARS and CRM 1,2 26.6% 17.7% 20.4% 13.2% 14.3% 4.5% Less than $1.0M $1.0M - $1.29M $1.3M - $1.49M $1.5M - $1.89M $1.9M+ Laser focus on strengthening margins comp sales, product gross profit, restaurant equipment, training, etc ¹ Excludes U.S. Company restaurants operated for less than 12 months. ² Based on TTM ended March 31,
38 Company restaurant expenses as a percentage of revenues Quarters ended March 31, Q1 - Q FY2010 FY2009 U.S. and Canada U.S. and Canada Food, paper, and product costs 32.1% 32.2% 32.3% 33.3% Payroll and employee benefits 31.4% 32.2% 31.1% 31.2% Occupancy and other operating costs 23.6% 22.9% 22.9% 22.9% Total Company restaurant expense 87.1% 87.3% 86.3% 87.4% EMEA/APAC EMEA/APAC Food, paper, and product costs 28.8% 29.6% 28.9% 28.6% Payroll and employee benefits 34.2% 34.0% 33.0% 32.7% Occupancy and other operating costs 30.9% 28.8% 28.8% 26.9% Total Company restaurant expense 93.9% 92.4% 90.7% 88.2% Latin America Latin America Food, paper, and product costs 37.8% 40.0% 39.1% 38.2% Payroll and employee benefits 12.2% 12.3% 12.4% 12.2% Occupancy and other operating costs 31.1% 27.7% 29.1% 28.8% Total Company restaurant expense 81.1% 80.0% 80.6% 79.2% Worldwide Worldwide Food, paper, and product costs 31.4% 31.8% 31.6% 32.2% Payroll and employee benefits 31.5% 32.0% 31.0% 31.0% Occupancy and other operating costs 25.8% 24.5% 24.7% 24.2% Total Company restaurant expense 88.7% 88.3% 87.3% 87.4% 38
39 Income statement In $ millions, except share and per share amounts Quarters ended March 31, Q1 - Q B/(W) % FY2010 FY2009 B/(W) % Revenues: Company restaurant revenues $ $ % $ 1,385.2 $ 1, % Franchise revenues % % Property revenues % % Total revenues % 1, , % Company restaurant expenses % 1, , % Selling expenses % % General and administrative expenses % % Property expenses % % Other operating (income) expense, net (4.5) (1.3) nm nm Total operating costs and expenses % 1, , % Income from operations % % Interest expense, net % % Income before income taxes % % Income tax expense % % Net income % % Earnings per share - diluted $ 0.30 $ % $ 1.00 $ % Weighted average shares - diluted % % Memo: Company restaurant margin (CRM) United States and Canada 12.9% 12.7% 13.7% 12.6% EMEA / APAC 6.1% 7.6% 9.3% 11.8% Latin America 18.9% 20.0% 19.4% 20.8% Total 11.3% 11.7% 12.7% 12.6% 39
 (3,189,340) (2,692,738)")
40 Share count Quarter ended March 31, Q1 - Q FY2010 FY2009 Weighted average shares outstanding - Basic EPS 135,329, ,603, ,635, ,753,071 Shares assumed issued on exercise of stock options and nonvested shares 4,444,756 5,278,901 4,502,672 5,313,787 Shares assumed repurchased with proceeds of stock options and nonvested shares (2,569,875) (3,189,340) (2,692,738) (3,251,642) Dilutive stock options and nonvested shares 1,874,881 2,089,561 1,809,934 2,062,145 Weighted average shares outstanding - Diluted EPS 137,204, ,693, ,445, ,815,216 40
41 Performance indicators and use of non-gaap financial measures This presentation includes non-gaap financial measures as defined by SEC rules. As required by SEC rules, we provide a reconciliation of each non-gaap financial measure to the most comparable GAAP measure and a description of the purposes for which management uses the non-gaap financial measures. Non-GAAP financial measures should be considered in addition to, but not as a substitute for or superior to, other measures of financial performance prepared in accordance with GAAP. Specifically, the following non-gaap financial measures are included in this presentation: Non-GAAP financial measure Comparable GAAP measure Reconciliation and additional information presented on slide titled Page EBITDA and adjusted EBITDA Net income Fiscal year EBITDA and adjusted EBITDA reconciliations 43 EBITDA, adjusted EBITDA, net debt, net debt / Net income and total debt Fiscal year net debt to EBITDA and adjusted EBITDA 44 EBITDA and net debt / adjusted EBITDA ratios reconciliations Adjusted income before taxes, adjusted income tax Income before taxes, income tax Fiscal year net debt to EBITDA and adjusted EBITDA 45 expense, adjusted net income and adjusted expense, net income and reconciliations earnings per share earnings per share 41
42 Performance indicators and use of non-gaap financial measures To supplement the Company s condensed consolidated financial statements presented on a U.S. Generally Accepted Accounting Principles (GAAP) basis, the Company uses three key business measures as indicators of the Company s operational performance: sales growth, comparable sales growth and average restaurant sales. These measures are important indicators of the overall direction, trends of sales and the effectiveness of the Company s advertising, marketing and operating initiatives and the impact of these on the entire Burger King system. System-wide data represent measures for both Company and franchise restaurants. Unless otherwise stated, sales growth, comparable sales growth and average restaurant sales are presented on a system-wide basis. The Company also provides certain non-gaap financial measures, including adjusted income from operations, adjusted segment income from operations, EBITDA, adjusted EBITDA, adjusted net income and adjusted earnings per share, net debt, net debt to EBITDA, and net debt to adjusted EBITDA ratio. The reconciliations of these non-gaap financial measures to their most comparable GAAP measure are set forth on the following pages. Adjusted income from operations and adjusted segment income from operations measure earnings from ongoing operations excluding the impact of unusual items. These measures are used by management to evaluate and forecast earnings from ongoing operations excluding the impact of unusual items. There were no adjustments to these measures for the nine months ended March 31, However, adjusted income from operations and adjusted segment income from operations for the nine months ended March 31, 2009 excludes $1.5 million of expenses associated with the acquisition of franchise restaurants from a large franchisee in the U.S. and $2.0 million of start up expenses associated with acquired restaurants. EBITDA is defined as earnings (net income) before interest, taxes, depreciation and amortization, and is used by management to measure operating performance of the business. The Company also uses EBITDA as a measure to calculate certain incentive based compensation and certain financial covenants related to the Company's credit facility and as a factor in the Company's tangible and intangible asset impairment test. Management believes EBITDA is a useful measure as it reflects certain operating drivers of the Company s business, such as sales growth, operating costs, selling, general and administrative expenses and other operating income and expense. There were no adjustments to EBITDA for the nine months ended March 31, However, adjusted EBITDA for the nine months ended March 31, 2009 excludes $1.5 million of expenses associated with the acquisition of franchise restaurants from a large franchisee in the U.S. and $2.0 million of start up expenses associated with acquired restaurants. There were no adjustments to this measure during fiscal Adjusted EBITDA for fiscal 2007 excludes the costs associated with the termination of the Company s lease for a new headquarters facility, which the Company had proposed to build in Coral Gables, FL ( lease termination costs ). Adjusted EBITDA for fiscal 2006 excludes the effects of: (a) the compensatory make-whole payment made to holders of options and restricted stock unit awards in February 2006; (b) the fee paid to Texas Pacific Group, Bain Capital Partners and the Goldman Sachs Funds to terminate our management agreement with them upon completion of our initial public offering in May 2006; (c) our European and Asian business realignment costs; (d) quarterly management fees paid to the Sponsors under the management agreement; and (e) executive severance. There were no adjustments to net income for the nine months ended March 31, However, adjusted net income for the nine months ended March 31, 2009 excludes $1.5 million of expenses associated with the acquisition of franchise restaurants from a large franchisee in the U.S. and $2.0 million of start up expenses associated with acquired restaurants. There were no adjustments to this measure during fiscal Adjusted net income for fiscal 2007 excludes the costs associated with the termination of the Company s lease for a new headquarters facility, which the Company had proposed to build in Coral Gables, FL ( lease termination costs ). Adjusted EBITDA for fiscal 2006 excludes the effects of: (a) the compensatory make-whole payment made to holders of options and restricted stock unit awards in February 2006; (b) the fee paid to Texas Pacific Group, Bain Capital Partners and the Goldman Sachs Funds to terminate our management agreement with them upon completion of our initial public offering in May 2006; (c) our European and Asian business realignment costs; (d) quarterly management fees paid to the Sponsors under the management agreement; and (e) executive severance. Adjusted earnings per share is calculated using adjusted net income divided by weighted average shares outstanding. Management believes that these non-gaap financial measures are important as they provide investors and management with additional metrics to measure comparable Company performance against prior year periods by excluding non-recurring expenses associated with material acquisitions. Net debt includes short-term debt and capital leases, long-term debt and long-term capital leases minus cash in excess of $50 million. Net debt to EBITDA and net debt to adjusted EBITDA are used by management to evaluate and forecast the Company s business performance. Further, management believes that these non-gaap measures provide both management and investors with a more complete understanding of the underlying operating results, capital structure and trends and an enhanced overall understanding of the Company s financial performance. 42
43 Fiscal year EBITDA and adjusted EBITDA reconciliations In $ millions TTM 3/ TTM 3/ FY2009 FY2008 FY2007 FY2006 Net income $ $ $ $ $ 148 $ 27 Reconciling items: Interest expense, net Loss on early extinguishment of debt Income tax expense Depreciation and amortization EBITDA Adjustments: Restaurant acquisition expenses Start up expenses for acquired restaurants Lease termination costs Compensatory make-whole payment Management agreement termination fee European and Asian business realignment costs Management fees Executive severance Total adjustments Adjusted EBITDA $ $ $ $ $ 387 $ Based on TTM ended March 31, 2010 and TTM ended March 31, 2009, respectively. 43

44 Fiscal year net debt to EBITDA and adjusted EBITDA reconciliations In $ millions Mar. 31, Mar. 31, FY2009 FY2008 FY2007 FY2006 Term debt, net of current portion $ $ 811 $ $ $ 871 $ 997 Capital leases, net of current portion Current portion of long term debt and capital leases Total debt ,065 Cash and cash equivalents $ Net debt excluding cash in excess of $50M $ EBITDA Adjusted EBITDA Net debt excluding cash in excess of $50M / EBITDA 1.7x 1.9x 1.9x 1.8x 2.2x 3.3x Net debt excluding cash in excess of $50M / adjusted EBITDA 1.7x 1.9x 1.9x 1.8x 2.1x 2.5x 1 Based on TTM ended March 31, 2010 and TTM ended March 31, 2009, respectively. 44
45 Adjusted earnings per share In $ millions, except share and per share amounts Fiscal years ended June 30 FY2009 FY2007 FY2006 Net income $ $ 148 $ 27 Income tax expense Income before taxes Adjustments: Restaurant acquisition charges Acquisition start-up charges Lease termination costs Management agreement termination fee European and Asian business realignment costs Executive severance Loss on extinguishment of debt Interest on $350 million loan paid off at IPO Management fees Compensatory make-whole payment Total adjustments Adjusted income before taxes Adjusted income tax expense Adjusted net income $ $ 152 $ 115 Shares outstanding - diluted Shares outstanding and IPO share count - diluted Earnings per share diluted $ 1.46 $ 1.08 $ 0.24 Adjusted earnings per share - diluted $ 1.48 $ 1.11 $ Adjusted income tax expense for FY2009 is calculated by using the Company s actual rate for all items of 29.7% with the exception of the adjustments listed above to which a U.S. federal and state tax rate of 36.0% has been applied. 2 The IPO share count of 135.5M diluted shares applies to FY2006, which represents the total shares outstanding at the time of the Company s initial public offering. 45
ICR XChange Conference. January 16, 2013
 ICR XChange Conference January 16, 2013 0 Safe Harbor Statement Certain statements made in this presentation that reflect management s expectations regarding future events and economic performance are
Burger King Worldwide, Inc. Fourth Quarter 2012 Earnings Conference Call. February 15, 2013
 Burger King Worldwide, Inc. Fourth Quarter 2012 Earnings Conference Call February 15, 2013 0 Safe Harbor Statement Certain statements made in this presentation that reflect management s expectations regarding
INVESTOR INFORMATION Press Releases Burger King Worldwide, Inc. Reports Third Quarter 2012 Results
 INVESTOR INFORMATION Press Releases Burger King Worldwide, Inc. Reports Third Quarter 2012 Results Burger King Worldwide Reports Fifth Consecutive Quarter of System wide Comparable Sales Growth and Initiates
Q2 13 FINANCIAL HIGHLIGHTS
 Q2 13 FINANCIAL HIGHLIGHTS 7.16.2013 1 This presentation contains forward-looking statements concerning Yahoo! s expected financial performance and Yahoo! s strategic and operational plans. Risks and uncertainties
Investor Presentation
 Investor Presentation Sidoti& Company Institutional Investor Forum March 18, 2014 Forward-Looking Statements and Non-GAAP Financial Measures Denny s Corporation urges caution in considering its current
Restaurant Brands International Reports Full Year and Fourth Quarter 2015 Results
 Restaurant Brands International Reports Full Year and Fourth Quarter 2015 Results Oakville, Ontario February 16, 2016 Restaurant Brands International Inc. (TSX/NYSE: QSR, TSX: QSP) today reported financial
Steve Schmitt Vice President, Investor Relations & Corporate Strategy
 NEWS Steve Schmitt Vice President, Investor Relations & Corporate Strategy Yum! Brands Reports Second-Quarter EPS of $0.69, a Decline of 5%, Excluding Special Items; Expects Strong Second Half in China;
THE WENDY S COMPANY REPORTS PRELIMINARY 2016 RESULTS; ANNOUNCES 2017 OUTLOOK AND UPDATES 2020 GOALS
 THE WENDY S COMPANY REPORTS PRELIMINARY 2016 RESULTS; ANNOUNCES 2017 OUTLOOK AND UPDATES 2020 GOALS 16th consecutive quarter of positive same-restaurant sales; North America system same-restaurant sales
Donny Lau Senior Director, Investor Relations & Corporate Strategy
 NEWS Donny Lau Senior Director, Investor Relations & Corporate Strategy Yum! Brands Reports Second-Quarter GAAP Operating Profit Growth of 32%; Delivered Core Operating Profit Growth of 7%; Raises Full-Year
Dunkin' Brands Reports Third Quarter 2013 Results
 October 24, Dunkin' Brands Reports Third Quarter Results CANTON, Mass., Oct. 24, /PRNewswire/ -- Third quarter highlights include: Dunkin' Donuts U.S. comparable store sales growth of 4.2% Added 222 net
Keith Siegner Vice President, Investor Relations, Corporate Strategy and Treasurer. % Change. Same-Store Sales
 Yum! Brands Reports Second-Quarter GAAP Operating Profit Growth of 1%; Delivered Second-Quarter Core Operating Profit Growth of 19%; Maintains Full-Year Core Operating Profit Growth Guidance Louisville,
Restaurant Brands International Reports Third Quarter 2015 Results
 Restaurant Brands International Reports Third Quarter 2015 Results Oakville, Ontario October 27, 2015 Restaurant Brands International Inc. (TSX/NYSE: QSR, TSX: QSP) today reported financial results for
Denny's Corporation Reports Results for Second Quarter 2013
 July 29, 2013 Denny's Corporation Reports Results for Second Quarter 2013 Adjusted Net Income Per Share* Increased 20.7% to $0.08 SPARTANBURG, S.C., July 29, 2013 (GLOBE NEWSWIRE) -- Denny's Corporation
NEWS. Tim Jerzyk Senior Vice President, Investor Relations
 NEWS Tim Jerzyk Senior Vice President, Investor Relations Yum! Brands Inc. Announces First Quarter 2011 EPS Growth of 7%, Or $0.63 Per Share, Excluding Special Items; Driven by Outstanding China and Emerging
CL King s Annual Best Ideas Conference
 WELCOME TO AMERICA S DINER CL King s Annual Best Ideas Conference September 10, 2015 Forward Looking Statements and Non-GAAP Financial Measures Denny s Corporation urges caution in considering its current
Yum China Reports First Quarter 2018 Results. May 1, :30 PM ET
 Yum China Reports First Quarter 2018 Results May 1, 2018 4:30 PM ET SHANGHAI, May 1, 2018 /PRNewswire/ -- Yum China Holdings, Inc. (the "Company" or "Yum China") (NYSE: YUMC) today reported unaudited results
Investor Presentation. Domino s Pizza
 Investor Presentation Domino s Pizza July 2005 Forward-Looking Statements This presentation and our accompanying comments may contain forward-looking statements. These statements relate to future events
 Page 1 of 7 Release Yum! Brands Inc. Announces 2011 EPS Growth of 7%, Or $0.63 Per Share, Excluding Special Items; Driven by Outstanding China and Emerging Market Performance LOUISVILLE, Ky., Apr 20, 2011
Dunkin' Brands Reports Fourth Quarter and Fiscal Year 2016 Results
 February 9, 2017 Dunkin' Brands Reports Fourth Quarter and Fiscal Year Results CANTON, Mass., Feb. 9, 2017 /PRNewswire/ -- Fiscal year highlights include: Dunkin' Donuts U.S. comparable store sales growth
Q1 14 FINANCIAL HIGHLIGHTS. April 15, 2014
 Q1 14 FINANCIAL HIGHLIGHTS April 15, 2014 This presentation contains forward-looking statements concerning the expected financial performance of Yahoo! Inc. and its consolidated subsidiaries ( we, Yahoo
Dine Brands Global, Inc. Investor Presentation March 2019
 Dine Brands Global, Inc. Investor Presentation March 2019 Disclosures Forward-Looking Information: The content contained in this presentation is as of March 5, 2019. The Company assumes no obligation to
Investor Presentation. December 2014
 Investor Presentation December 2014 Forward-Looking Statements and Non-GAAP Financial Measures Denny s Corporation urges caution in considering its current trends and any outlook on earnings disclosed
DENNY S CORPORATION REPORTS RESULTS FOR FOURTH QUARTER AND FULL YEAR 2015
 REPORTS RESULTS FOR FOURTH QUARTER AND FULL YEAR 2015-5.8% Increase in 2015 Full Year Domestic System-Wide Same-Store Sales - - 16.4% Growth in 2015 Full Year Adjusted Net Income per Share* - SPARTANBURG,
Page 1/12. Yum China Reports Fourth Quarter and Full Year 2017 Results. February 7, :30 PM ET
 Yum China Reports Fourth Quarter and Full Year 2017 Results February 7, 2018 4:30 PM ET SHANGHAI, Feb. 7, 2018 /PRNewswire/ -- (the "Company" or "Yum China") (NYSE: YUMC) today reported unaudited results
The Wendy s Company Reports Audited Full-Year 2012 Results
 The Wendy s Company Reports Audited Full-Year 2012 Results Fourth-Quarter Adjusted EBITDA Increased 19% to $95.9 Million; Full-Year Adjusted EBITDA Increased 1% to $333.3 Million Positive Momentum from
INVESTKentucky Conference Louisville, KY June 6, 2013
 INVESTKentucky Conference Louisville, KY June 6, 2013 Tony Thompson EVP, Chief Operating Officer and President, PJ Food Service Lance Tucker SVP, Chief Financial Officer and Chief Administrative Officer
Popeyes Louisiana Kitchen, Inc. Reports Fiscal 2016 Earnings Results
 February 22, 2017 Reports Fiscal 2016 Earnings Results Completes Credit Facility Expansion ATLANTA--(BUSINESS WIRE)-- (NASDAQ: PLKI), the franchisor and operator of Popeyes restaurants, today reported
CDW Reports Third Quarter 2015 Results
 November 4, 2015 CDW Reports Third Quarter 2015 Results Record Third Quarter Net Sales, Adjusted EBITDA and Non-GAAP Net Income Per Share (Dollars in millions, except per share amounts) Three Months Ended
DENNY S CORPORATION REPORTS RESULTS FOR FOURTH QUARTER AND FULL YEAR 2016
 REPORTS RESULTS FOR FOURTH QUARTER AND FULL YEAR 2016 SPARTANBURG, S.C., February 15, 2017 - Denny s Corporation (NASDAQ: DENN), franchisor and operator of one of America's largest franchised full-service
NEWS. Tim Jerzyk Senior Vice President, Investor Relations
 NEWS Tim Jerzyk Senior Vice President, Investor Relations Yum! Brands Reports First-Quarter EPS Growth of 21%, or $0.76 Per Share, Excluding Special Items; Strong Sales and Operating Profit Growth Across
PAPA JOHN S ANNOUNCES FIRST QUARTER 2017 RESULTS
 PAPA JOHN S ANNOUNCES FIRST QUARTER 2017 RESULTS Louisville, Kentucky (May 2, 2017) Papa John s International, Inc. (NASDAQ: PZZA) today announced financial results for the first quarter ended March 26,
INVESTOR PRESENTATION JANUARY 2018
 INVESTOR PRESENTATION JANUARY 2018 0 FORWARD-LOOKING STATEMENTS Forward-Looking Statements This presentation contains forward-looking statements that are subject to risks and uncertainties. All statements
Jack in the Box Inc. Reports First Quarter FY 2015 Earnings; Updates Guidance for FY 2015
 Investor Contact: Carol DiRaimo, (858) 571-2407 FOR IMMEDIATE RELEASE Media Contact: Brian Luscomb, (858) 571-2291 Jack in the Box Inc. Reports First Quarter FY 2015 Earnings; Updates Guidance for FY 2015
Third Quarter 2018 Results November 8, 2018
 Third Quarter 2018 Results November 8, 2018 Safe Harbor Caution Regarding Forward Looking Statements This presentation any other oral or written statements made by us or on our behalf may include forward-looking
CBRE GROUP, INC. REPORTS DOUBLE-DIGIT SECOND-QUARTER 2018 REVENUE AND EARNINGS GROWTH AND INCREASES FULL-YEAR OUTLOOK
 PRESS RELEASE Corporate Headquarters 400 South Hope Street 25 th Floor Los Angeles, CA 90071 www.cbre.com FOR IMMEDIATE RELEASE For further information: Brad Burke Steve Iaco Investor Relations Media Relations
Dunkin' Brands Reports First Quarter 2013 Results
 April 25, 2013 Dunkin' Brands Reports First Quarter 2013 Results CANTON, Mass., April 25, 2013 /PRNewswire/ -- First quarter highlights include: Dunkin' Donuts U.S. comparable store sales growth of 1.7%
Starbucks Reports Q4 and Full Year Fiscal 2017 Results
 Starbucks Reports Q4 and Full Year Fiscal Results Q4 GAAP Earnings Per Share of $0.54; Non-GAAP Earnings Per Share Increases to $0.55 Q4 Global and U.S. Comps Up 2%, Up 3% adjusted for Hurricane Impact;
Dunkin' Brands Reports Third Quarter 2016 Results
 October 20, Dunkin' Brands Reports Third Quarter Results CANTON, Mass., Oct. 20, /PRNewswire/ -- Third quarter highlights include: Dunkin' Donuts U.S. comparable store sales growth of 2.0% Baskin-Robbins
Dine Brands Global, Inc. Investor Presentation. March 5, 2018
 Dine Brands Global, Inc. Investor Presentation March 5, 2018 2 Disclosures Forward-Looking Information: The content contained in this presentation is as of February 21, 2018. The Company assumes no obligation
AEGIS GROUP PLC 2008 ANNUAL RESULTS. 19 March 2009
 AEGIS GROUP PLC 2008 ANNUAL RESULTS 19 March 2009 AGENDA OVERVIEW OF RESULTS John Napier FINANCIAL REVIEW Alicja Lesniak OUTLOOK John Napier Q&A Aegis Group plc Page 2 OVERVIEW OF RESULTS John Napier,
AFC Enterprises Reports Financial Results for Third Quarter 2010; Raises Fiscal 2010 Earnings Guidance
 November 10, 2010 AFC Enterprises Reports Financial Results for Third Quarter 2010; Raises Fiscal 2010 Earnings Guidance ATLANTA--(BUSINESS WIRE)-- AFC Enterprises, Inc. (NASDAQ: AFCE), the franchisor
INVESTOR PRESENTATION
 INVESTOR PRESENTATION April 30, 2015 Safe Harbor Forward-Looking Statements. This presentation contains "forward-looking statements" within the meaning of the Private Securities Litigation Reform Act of
Bloomin' Brands Announces 2015 Third Quarter Adjusted Diluted EPS of $0.15 and Diluted EPS of $0.13;
 November 3, Bloomin' Brands Announces Third Quarter Adjusted Diluted EPS of $0.15 and Diluted EPS of $0.13; Reaffirms Guidance for Adjusted Diluted EPS of At Least $1.27; Repurchases $60 Million of Common
DENNY S CORPORATION REPORTS RESULTS FOR FOURTH QUARTER AND FULL YEAR 2017
 REPORTS RESULTS FOR FOURTH QUARTER AND FULL YEAR 2017 SPARTANBURG, S.C., February 13, 2018 - Denny s Corporation (NASDAQ: DENN), franchisor and operator of one of America's largest franchised full-service
THE WENDY S COMPANY REPORTS PRELIMINARY 2017 RESULTS; ANNOUNCES 2018 OUTLOOK AND UPDATES 2020 GOALS
 THE WENDY S COMPANY REPORTS PRELIMINARY 2017 RESULTS; ANNOUNCES 2018 OUTLOOK AND UPDATES 2020 GOALS North America same-restaurant sales increase 1.3% in 4Q and 2.0% in 2017; 20th consecutive quarter of
INVESTOR PRESENTATION JUNE 2018
 INVESTOR PRESENTATION JUNE 2018 0 FORWARD-LOOKING STATEMENTS Forward-Looking Statements This presentation contains forward-looking statements that are subject to risks and uncertainties. All statements
4Q 2018 Highlights and Operating Results. Products. Technology. Services. Delivered Globally.
 4Q 2018 Highlights and Operating Results Products. Technology. Services. Delivered Globally. Table of Contents Page 3 Safe Harbor Statement and Non-GAAP Financial Measures 4 Sales Overview 9 Overview of
POSITIVE START TO THE YEAR AND STRONG BEYOND AIR REVENUE GROWTH
 Travelport Worldwide Limited Reports First Quarter 2016 Results POSITIVE START TO THE YEAR AND STRONG BEYOND AIR REVENUE GROWTH LANGLEY, U.K., May 5, 2016 Travelport Worldwide Limited (NYSE: TVPT) announces
Jack in the Box Inc. Reports Third Quarter FY 2015 Earnings; Updates Guidance for FY 2015; Declares Quarterly Cash Dividend
 Investor Contact: Carol DiRaimo, (858) 571-2407 FOR IMMEDIATE RELEASE Media Contact: Brian Luscomb, (858) 571-2291 Reports Third Quarter FY Earnings; Updates Guidance for FY ; Declares Quarterly Cash Dividend
THE WENDY S COMPANY REPORTS SECOND QUARTER 2017 RESULTS
 THE WENDY S COMPANY REPORTS SECOND QUARTER 2017 RESULTS North America same-restaurant sales increase 3.2% (+3.6% on a two-year basis); 18th consecutive quarter of positive same-restaurant sales 35 global
GAP INC. REPORTS THIRD QUARTER RESULTS. Delivers Fourth Consecutive Quarter of Positive Comparable Sales Growth, with Positive 3 Percent.
 GAP INC. REPORTS THIRD QUARTER RESULTS Delivers Fourth Consecutive Quarter of Positive Comparable Sales Growth, with Positive 3 Percent. Increases Reported EPS Guidance to a Range of $2.18 to $2.22 for
Dunkin Brands Group, Inc.
 Dunkin Brands Group, Inc. Investor Presentation Jefferies Consumer Conference Nigel Travis Chairman & CEO 1 Forward-Looking Statements Certain information contained in this presentation, particularly information
Jacky Lo Chief Finance Officer, Yum China
 Jacky Lo Chief Finance Officer, Yum China Cautionary Language Regarding Forward-Looking Statements Forward-Looking Statements. Our presentation may contain forward-looking statements within the meaning
DENNY S CORPORATION REPORTS RESULTS FOR THIRD QUARTER 2018
 REPORTS RESULTS FOR THIRD QUARTER 2018 - Announces Refranchising And Development Strategy - SPARTANBURG, S.C., October 30, 2018 - Denny s Corporation (NASDAQ: DENN), franchisor and operator of one of America's
PAPA JOHN S ANNOUNCES SECOND QUARTER 2015 RESULTS
 PAPA JOHN S ANNOUNCES SECOND QUARTER 2015 RESULTS Comparable Sales Increases of 5.5% for North America and 6.8% for International Drive Strong Earnings Growth Louisville, Kentucky (August 4, 2015) Papa
Second Quarter 2012 Earnings Conference Call. August 9, Oldemark LLC JOHN BARKER CHIEF COMMUNICATIONS OFFICER
 Second Quarter 2012 Earnings Conference Call August 9, 2012 1 2012 Oldemark LLC JOHN BARKER CHIEF COMMUNICATIONS OFFICER 2 1 Today s Agenda Opening Comments Financial Update CEO Overview Emil Brolick Steve
FOR IMMEDIATE RELEASE. Investor Contact: Carol DiRaimo, (858) Media Contact: Brian Luscomb, (858)
 Media Contact: Brian Luscomb, (858)") Investor Contact: Carol DiRaimo, (858) 571-2407 FOR IMMEDIATE RELEASE Media Contact: Brian Luscomb, (858) 571-2291 Jack in the Box Inc. Reports Second Quarter FY Earnings; Updates Guidance for FY ; Declares
Investor Contact: Carol DiRaimo, (858) 571-2407 FOR IMMEDIATE RELEASE Media Contact: Brian Luscomb, (858) 571-2291 Jack in the Box Inc. Reports Second Quarter FY Earnings; Updates Guidance for FY ; Declares
THE WENDY S COMPANY REPORTS STRONG 2013 THIRD-QUARTER RESULTS, RAISES EARNINGS OUTLOOK FOR 2013 COMPANY REPORTS 3Q SAME-STORE SALES INCREASE OF 3.
 THE WENDY S COMPANY REPORTS STRONG 2013 THIRD-QUARTER RESULTS, RAISES EARNINGS OUTLOOK FOR 2013 COMPANY REPORTS 3Q SAME-STORE SALES INCREASE OF 3.2% ADJUSTED EBITDA INCREASES 17% ADJUSTED EPS INCREASES
Dunkin Brands Group, Inc.
 Dunkin Brands Group, Inc. Investor Presentation Fourth Quarter 2013 1 Forward-Looking Statements Certain information contained in this presentation, particularly information regarding future economic performance,
Reported EPS from continuing operations for the fourth quarter included tax benefits of $243 million, or approximately $0.07 cents per share.
 For Immediate Release Media Relations Contact Greg Rossiter 800-331-0085 Investor Relations Contact Carol Schumacher 479-277-1498 Pre-recorded conference call 800-778-6902 (U.S. and Canada) 585-219-6420
Walmart reports Q3 EPS of $1.14, updates full year guidance; Aggressive holiday plans to drive sales
 For Immediate Release Media Relations Contact Randy Hargrove 800-33-0085 Investor Relations Contact Carol Schumacher 479-277-498 Pre-recorded management call 877-523-562 (U.S. and Canada) 20-689-8483 (other
THE WENDY S COMPANY REPORTS SECOND QUARTER 2018 RESULTS. North America same-restaurant sales increase 1.9% (+5.1% on a two-year basis)
") THE WENDY S COMPANY REPORTS SECOND QUARTER 2018 RESULTS North America same-restaurant sales increase 1.9% (+5.1% on a two-year basis) 22nd consecutive quarter of positive same-restaurant sales 36 global
THE WENDY S COMPANY REPORTS SECOND QUARTER 2018 RESULTS North America same-restaurant sales increase 1.9% (+5.1% on a two-year basis) 22nd consecutive quarter of positive same-restaurant sales 36 global
Luby s Reports Third Quarter Fiscal 2016 Results
 For additional information contact: FOR IMMEDIATE RELEASE Dennard-Lascar Associates Rick Black / Ken Dennard Investor Relations 713-529-6600 Luby s Reports Third Quarter Fiscal Results Luby s Cafeterias
PTC PREPARED REMARKS THIRD QUARTER FISCAL 2018 JULY 18, 2018
 PTC PREPARED REMARKS THIRD QUARTER FISCAL 2018 JULY 18, 2018 Please refer to the updated Important Disclosures section of these prepared remarks for important information about our operating metrics (including
Rent-A-Center today is
 INVESTOR PRESENTATION FIRST QUARTER 2014 Safe Harbor This presentation contains forward-looking statements that involve risks and uncertainties. Such forward-looking statements generally can be identified
DAVID POPLAR. Second-Quarter 2014 Conference Call August 7, Vice President Investor Relations 8/7/2014 7:11:27 AM.
 Second-Quarter 2014 Conference Call August 7, 2014 2013 Oldemark LLC DAVID POPLAR Vice President Investor Relations 2013 Oldemark LLC 2 1 Today s Agenda CEO Overview Financial Update Q&A Emil Brolick Todd
Albemarle Corporation Fourth Quarter 2017 Earnings and Non-GAAP Reconciliations Conference Call/Webcast Wednesday, February 28 th, :00am ET
 Albemarle Corporation Fourth Quarter 2017 Earnings and Non-GAAP Reconciliations Conference Call/Webcast Wednesday, February 28 th, 2018 9:00am ET Proprietary Information of Albemarle Corporation. Forward-Looking
Jefferies Winter Consumer Summit Beaver Creek January 26, 2015
 Jefferies Winter Consumer Summit Beaver Creek January 26, 2015 Forward Looking Statements Certain matters discussed in this presentation constitute forward-looking statements within the meaning of the
Fourth Quarter 2018 Business Update. February 25, 2019
 Fourth Quarter 2018 Business Update February 25, 2019 Fourth Quarter 2018 Results (GAAP Basis) $ in millions, except EPS Q4 % of Q4 % of 2018 Sales 2017 Sales Increase / (Decrease) Net sales $1,086 $1,028
Second Quarter 2018 Results July 31, 2018
 Second Quarter 2018 Results July 31, 2018 Eddie Edwards President and Chief Executive Officer Alex Pease Executive Vice President and Chief Financial Officer Safe harbor Caution Regarding Forward Looking
Keith Siegner Vice President, Investor Relations, Corporate Strategy and Treasurer
 NEWS Keith Siegner Vice President, Investor Relations, Corporate Strategy and Treasurer Yum! Brands Reports Fourth-Quarter GAAP Operating Profit Growth of 134%; Fourth-Quarter Core Operating Profit Decline
Texas Roadhouse, Inc. Announces Third Quarter 2018 Results
 Texas Roadhouse, Inc. Announces Third Quarter 2018 Results LOUISVILLE, KY. (October 29, 2018) Texas Roadhouse, Inc. (NasdaqGS: TXRH) today announced financial results for the 13 and 39 week periods ended
Hasbro First Quarter 2013 Earnings April 22, 2013
 Hasbro First Quarter 2013 Earnings April 22, 2013 Safe Harbor FORWARD-LOOKING STATEMENTS: This presentation contains forward-looking statements concerning management's expectations, goals, objectives and
Papa John's Announces Third Quarter Results
 November 3, 2010 Papa John's Announces Third Quarter Results EPS Increased 6.7% over Prior Year, Excluding BIBP; 2010 EPS Guidance Updated to a Range of $1.74 to $1.80, Excluding BIBP LOUISVILLE, Ky.--(BUSINESS
MANAGEMENT S DISCUSSION AND ANALYSIS OF FINANCIAL CONDITION AND RESULTS OF OPERATIONS
 MANAGEMENT S DISCUSSION AND ANALYSIS OF FINANCIAL CONDITION AND RESULTS OF OPERATIONS Unless otherwise noted, the section references to (i) us, our, we, the Company and YUM refer to YUM Brands, Inc. and
2016 Fourth Quarter Financial Results
 2016 Fourth Quarter Financial Results February 13, 2017 2016 First Data Corporation. All Rights Reserved. Safe Harbor Statements in this presentation regarding First Data Corporation s business which are
INVESTKentucky Conference. June 9, 2011
 INVESTKentucky Conference Louisville, KY June 9, 2011 Chris Sternberg SVP, Corporate Communications and General Counsel Keeta Fox Vice President, Finance Forward Looking Statements and Additional Information
GAAP and Non-GAAP net revenues of $474 million, up 4% sequentially
 June 8, 2017 10:57 UTC Verifone Reports Financial Results for Second Quarter of Fiscal 2017 SAN JOSE, Calif.--(BUSINESS WIRE)-- Verifone (NYSE: PAY), a world leader in payments and commerce solutions,
Fiscal Year 2016 Fourth Quarter Conference Call
 Fiscal Year 2016 Fourth Quarter Conference Call November 7, 2016 2 Safe Harbor Statement This presentation includes statements related to the expected future results of the company and are therefore forward-looking
STARWOOD REPORTS SECOND QUARTER 2012 RESULTS
 Investor Contact Stephen Pettibone 203-351-3500 Media Contact KC Kavanagh 866-478-2777 One StarPoint Stamford, CT 06902 United States STARWOOD REPORTS SECOND QUARTER 2012 RESULTS STAMFORD, Conn. (July
Zebra Technologies Third-Quarter 2018 Results. November 6, 2018
 Zebra Technologies Third-Quarter 2018 Results November 6, 2018 1 Safe Harbor Statement Statements made in this presentation which are not statements of historical fact are forward-looking statements and
Domino s Pizza Financial Results Demonstrate Global Momentum Delivers 21.9% EPS Growth in the Fourth Quarter; Dividend Increases 25%
 For Immediate Release EXHIBIT 99.1 Contact: Lynn Liddle, Executive Vice President, Communications, Investor Relations and Legislative Affairs (734) 930-3008 Domino s Pizza Financial Results Demonstrate
SAMSONITE INTERNATIONAL S.A.
 Hong Kong Exchanges and Clearing Limited and The Stock Exchange of Hong Kong Limited take no responsibility for the contents of this announcement, make no representation as to its accuracy or completeness
Investor Presentation January 2013
 Investor Presentation January 2013 Texas Roadhouse, Inc Safe Harbor Statement and Reconciliation of Non-GAAP Financial Measures Under the Private Securities Litigation Reform Act of 1995 Certain statements
Micky Pant CEO, Yum China
 Micky Pant CEO, Yum China Cautionary Language Regarding Forward-Looking Statements Forward-Looking Statements. Our presentation may contain forward-looking statements within the meaning of Section 27A
Chanticleer Holdings Reports Asset and Revenue Growth and Improvement in Gross Profit Margins for Q4 and Full Year 2013 Financials
 March 31, 2014 Chanticleer Holdings Reports Asset and Revenue Growth and Improvement in Gross Profit Margins for Q4 and Full Year 2013 Financials CHARLOTTE, NC -- (Marketwired) -- 04/01/14 -- Chanticleer
5/7/2013. First Quarter 2013 Earnings Conference Call. May 8, Oldemark LLC JOHN BARKER. Chief Communications Officer.
 First Quarter 2013 Earnings Conference Call May 8, 2013 2013 Oldemark LLC JOHN BARKER Chief Communications Officer 2013 Oldemark LLC 2 1 Today s Agenda CEO Overview Financial Update Emil Brolick Steve
Q Supplemental Earnings Slides. May 3, 2018
 Q1 2018 Supplemental Earnings Slides May 3, 2018 1 Cautionary Note on Forward-Looking Statements This presentation contains forward-looking statements, within the meaning of the Private Securities Litigation
Luby s Reports Fourth Quarter and Fiscal 2015 Results
 For additional information contact: FOR IMMEDIATE RELEASE Dennard-Lascar Associates 713-529-6600 Rick Black / Ken Dennard Investor Relations Luby s Reports Fourth Quarter and Fiscal Results HOUSTON, TX
Avery Dennison Jefferies Industrials Conference
 Avery Dennison Jefferies Industrials Conference August 9, 2016 Anne Bramman SVP and Chief Financial Officer 1 Avery Dennison Investor Presentation Forward-Looking Statements Certain statements contained
THREE MONTHS ENDED MARCH 31, $ Change Diluted earnings per share $ 0.50 $ 0.47 $ 0.03 Adjustments (1) 0.02 (0.02)
 0.02 (0.02)") April 30, 2013 Bloomin' Brands, Inc. Announces First Quarter Adjusted Diluted Earnings Per Pro Forma Share of $0.50 and GAAP Diluted Earnings Per Share of $0.50; Raises Full-Year 2013 Guidance for Adjusted
April 30, 2013 Bloomin' Brands, Inc. Announces First Quarter Adjusted Diluted Earnings Per Pro Forma Share of $0.50 and GAAP Diluted Earnings Per Share of $0.50; Raises Full-Year 2013 Guidance for Adjusted
Fourth Quarter and Full Year 2018 Financial Review and Analysis
 Fourth Quarter and Full Year 2018 Financial Review and Analysis (preliminary, unaudited) Supplemental Presentation Materials Unless otherwise indicated, comparisons are to the same periods in the prior
UNITED STATES SECURITIES AND EXCHANGE COMMISSION Washington, D.C FORM 8-K
 UNITED STATES SECURITIES AND EXCHANGE COMMISSION Washington, D.C. 20549 FORM 8-K CURRENT REPORT PURSUANT TO SECTION 13 OR 15(d) OF THE SECURITIES EXCHANGE ACT OF 1934 Date of Report (Date of earliest event
INVESTOR PRESENTATION DECEMBER 2018
 INVESTOR PRESENTATION DECEMBER 2018 SAFE HARBOR AND NON-GAAP Safe Harbor Statement This presentation contains certain comments that are forwardlooking statements, including sales, GAAP diluted EPS, and
Safe Harbor Statement
 Safe Harbor Statement Statements made in this presentation which are not statements of historical fact are forward-looking statements and are subject to the safe harbor provisions created by the Private
Jack in the Box Inc. Reports Second Quarter FY 2014 Earnings; Updates Guidance for FY 2014
 Investor Contact: Carol DiRaimo, (858) 571-2407 FOR IMMEDIATE RELEASE Media Contact: Brian Luscomb, (858) 571-2291 Reports Second Quarter FY Earnings; Updates Guidance for FY SAN DIEGO, May 14, (NASDAQ:
INVESTOR PRESENTATION FEBRUARY 2019
 INVESTOR PRESENTATION FEBRUARY 2019 SAFE HARBOR AND NON-GAAP Safe Harbor Statement This presentation contains certain comments that are forwardlooking statements, including sales, GAAP diluted EPS, and
Starbucks Reports Record Q4 and Record FY16 Results
 Starbucks Reports Record Q4 and Record FY16 Results Q4 Comparable Store Sales Up 5 in Americas, 4 in the U.S., 6 in China and 4 Globally Q4 GAAP EPS Up 26 to a Record $0.54; Record Non-GAAP EPS of $0.56
NEWS BULLETIN RE: CLAIRE S STORES, INC.
 NEWS BULLETIN RE: CLAIRE S STORES, INC. 2400 WEST CENTRAL ROAD, HOFFMAN ESTATES, ILLINOIS 60192 CLAIRE S STORES, INC. REPORTS PRELIMINARY UNAUDITED FISCAL 2017 FOURTH QUARTER AND FULL YEAR RESULTS CHICAGO,
THE WENDY S COMPANY REPORTS FIRST-QUARTER 2014 RESULTS COMPANY-OPERATED SAME-RESTAURANT SALES INCREASE 1.3%
 THE WENDY S COMPANY REPORTS FIRST-QUARTER 2014 RESULTS COMPANY-OPERATED SAME-RESTAURANT SALES INCREASE 1.3% ADJUSTED EBITDA INCREASES 13% TO $87.3 MILLION; ADJUSTED EPS INCREASES FROM $0.03 TO $0.07 IMAGE