INVESTKentucky Conference Louisville, KY June 6, 2013
|
|
|
- Isabel Bond
- 5 years ago
- Views:
Transcription

1 INVESTKentucky Conference Louisville, KY June 6, 2013 Tony Thompson EVP, Chief Operating Officer and President, PJ Food Service Lance Tucker SVP, Chief Financial Officer and Chief Administrative Officer
2 Forward Looking Statements and Additional Information Certain matters discussed in this presentation constitute forward-looking statements within the meaning of the federal securities laws. Generally, the use of words such as expect, estimate, believe, anticipate, will, forecast, plan, project, or similar words identify forward-looking statements that we intend to be included within the safe harbor protections provided by the federal securities laws. Such statements may relate to projections concerning business performance, revenue, earnings, contingent liabilities, commodity costs, margins, unit growth, and other financial and operational measures. Such statements are not guarantees of future performance and involve certain risks, uncertainties and assumptions, which are difficult to predict and many of which are beyond our control. Therefore, actual outcomes and results may differ materially from those matters expressed or implied in such forward-looking statements. The risks, uncertainties and assumptions that are involved in our forward-looking statements include, but are not limited to: aggressive changes in pricing or other marketing or promotional strategies by competitors which may adversely affect sales; and new product and concept developments by food industry competitors; changes in consumer preferences and adverse general economic and political conditions, including increasing tax rates, and their resulting impact on consumer buying habits; the impact that product recalls, food quality or safety issues, and general public health concerns could have on our restaurants; failure to maintain our brand strength and quality reputation; the ability of the company and its franchisees to meet planned growth targets and operate new and existing restaurants profitably, which could be impacted by challenges securing financing, finding suitable store locations or securing required domestic or foreign government permits and approvals; increases in or sustained high costs of food ingredients and other commodities; disruption of our supply chain due to sole or limited source of suppliers or weather, drought, disease or other disruption beyond our control; increased risks associated with our international operations, including economic and political conditions in our international markets and difficulty in meeting planned sales targets and new store growth for our international operations; increased employee compensation, benefits, insurance, regulatory compliance and similar costs, including increased costs resulting from federal health care legislation; the credit performance of our franchise loan program; the impact of the resolution of current or future claims and litigation, and current or proposed legislation impacting our business; currency exchange and interest rates; failure to effectively execute succession planning, and our reliance on the services of our Founder and CEO who also serves as our brand spokesperson; and disruption of critical business or information technology systems, and risks associated with security breaches, including theft of company and customer information. For discussion of these and other risks that may cause actual results to differ from expectations, refer to Papa John s Report on Form 10-K for the year ended December 30, 2012, on file with the Securities and Exchange Commission, including the section entitled Risk Factors, and all subsequent filings under Sections 13(a), 13(c), 14 or 15(d) of the Securities Exchange Act of This presentation also includes non-gaap financial measures to describe our performance, which we believe are useful in analyzing results and facilitating comparison with prior periods. Additional disclosures relating to non-gaap measures, including the reconciliations of those measures to corresponding GAAP measures are available in this report and on our website at under the heading Investor Relations.
3 The Papa John s Story Papa John s was founded in 1984 by John Schnatter, who currently serves as its Founder, Chairman and CEO Quality drives all aspects of the brand Better Ingredients. Better Pizza. Commitment to service, image, locations and team Papa John s is the 3 rd largest global pizza chain with 4,197 units as of March 31, 2013 North America 3,221 (80% franchised) International 976 (95% franchised) Growth through taking market share
4 Differentiators and Growth Drivers Brand strength, based on our quality position Commitment to system health Active and engaged Founder Leverageable Infrastructure and Systems Additional 3,000+ international units and 1,000+ domestic units with modest additional investment Leadership position in technology Strong cash flow/conservative balance sheet Excellent unit economics Long-term, stable growth model
5 Recent Recognition Buffalo Chicken Pizza earned 2013 Nations Restaurant News MenuMasters Award as Best Limited Time Offer Named Most Identified NFL Brand Sponsor by Avid NFL Fans in 2013 Unseated Gatorade, who had led this survey for 15 consecutive years Rated #1 in customer satisfaction among limited-service restaurants in the 2012 American Customer Satisfaction Index (ACSI) Achieved the highest score ever by an individual brand For 11 out of the past 13 years Papa John s has achieved the highest score among national pizza chains Voted 2012 Pizza Brand of the Year by Harris Poll EquiTrend Measured and compared brand health for over 1,500 brands in more than 50 categories surveying over 37,000 U.S. Consumers Pizza category included Papa John s, Pizza Hut, Domino s, and Little Caesar s


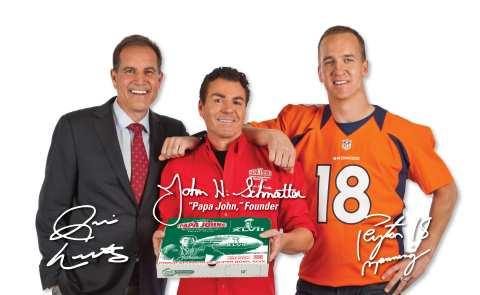

6 An Active Founder


7 An Active Founder
8 Momentum at Papa John s Nine consecutive years of positive or even North America comparable sales growth; 3.6% growth for 2012 International segment achieved profitability in 2012 for the first time; 7.1% comparable sales in 2012 Strong two-year comparable sales growth of 7.0% for North America and 12.2% for international Continue to maintain premium positioning despite competitive environment Ability to leverage infrastructure, both domestically and internationally Significant runway for global unit expansion and marketing spend; 280 net global units opened in 2012 Rapid growth in online and mobile ordering channels
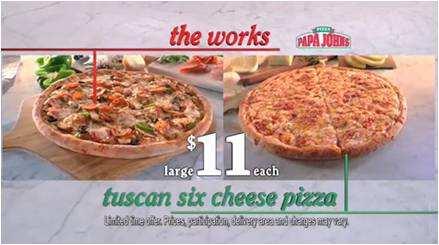
9 Competitive Environment Papa John s national pricing generally in the $11 to $12 range for a large pizza National competitors continue to promote a lower national price point The Big 3 chains continue to consistently take share from regional chains and independents
10 Initiatives Strengthen the Papa John s Brand, using our BIBP Quality Leadership Position Drive Global Unit Development Increase Global Sales Consistently and Sustainably Leverage International Infrastructure to Increase Profitability Grow Digital Ordering Channels Globally


11 Papa John s Quality Campaign Nobody Does What Papa John s Does Enhanced quality/ingredients based stories authentically communicated by founder
12 Development Incentive Plan Zero Franchise Fee Royalty Reduction Set of Two Middleby Ovens Credit toward First Food Order Reduces investment to open a franchise restaurant to approximately $200,000 or a little lower Total value of over $60,000
13 Domestic Development Status Approximately 300 Units in Pipeline The majority are scheduled to open over the next two to three years Primary growth is expected in Northeast, Upper Midwest and West under-penetrated regions and in Canada Additional Total Traditional Restaurant Opportunity of 700 to 800 Units Opportunity to open several hundred additional Nontraditional Restaurants (airports, colleges, etc.)
14 Sales Driving Initiatives Increased National Marketing due to New Unit Growth and Increased Sales Royalty Rebate Opportunities for Franchisees Earned by Driving Sales Authentic Advertising Campaign Founder as Spokesperson Official Pizza of the National Football League NFL football and pizza an outstanding combination
15 International Built to support steady, consistent growth Outstanding momentum Operating income of $3.1 million in 2012; 137 net unit openings in 2012 Approximately 1,100 units in pipeline, most of which are scheduled to open over the next six years Expect to open net units in 2013; Approximately 50% in Asia/Middle East and continued significant growth in UK/Europe and the Americas
16 International Units at March 31, 2013 Middle East South Central Americas Asia Bahrain 20 Cayman Islands 2 China 179 Egypt 14 Chile 19 Guam 1 Jordan 6 Colombia 16 India 25 Kuwait 25 Costa Rica 14 Malaysia 19 Lebanon 3 Dominican Republic 10 Philippines 14 Oman 7 Ecuador 13 South Korea 73 Qatar 11 El Salvador 10 TOTAL 311 Saudi Arabia 6 Mexico 59 United Arab Emerates 23 Nicaragua 2 TOTAL 115 Panama 4 Peru 19 Europe Puerto Rico 14 Azerbaijan 1 Trinidad 6 Cyprus 9 Venezuela 29 Ireland 49 TOTAL 217 Russia 42 Turkey 16 United Kingdom 216 GRAND TOTAL 976 TOTAL 333
17 Drive Online and Emerging Channels Continued growth in online sales mix over 40% and continuing to grow Strong growth in mobile ordering (iphone and Android apps) Online has many benefits Higher average ticket and order frequency Higher customer satisfaction (increase in order accuracy and more relaxed ordering experience) Potential to save labor at store level
18 FINANCIAL HIGHLIGHTS
19 2012 Highlights 18.1% Earnings Growth ($2.55 adjusted vs. $2.16) in 2012, on top of 18% growth in 2011, excluding BIBP in 2010 Global Sales Increase of 10.6% over Prior Year, Including 53 rd Week of Operations Strong System-wide Comparable Sales Increases of 3.6% for North America and 7.1% for International 280 Worldwide Net Unit Openings International Segment Achieved Profitability ($3.1 million)
20 First Quarter 2013 Highlights 6.3% Earnings Growth ($0.84 adjusted vs. $0.79) in Q versus strong Q results Global Sales Increase of 6.1% over Prior Year System-wide Comparable Sales Increases of 1.6% for North America and 8.2% for International 34 Worldwide Net Unit Openings
21 2013 Guidance (as of May 7, 2013) EPS $2.90 to $3.00 North America Comp Sales +1.5% to +2.5% International Comp Sales +5.0% to +7.0% International System Sales +20% to +25% Capital Expenditures $55-$60 million Worldwide Net Unit Growth 230 to 260 North America 110 to 125 International 120 to 135
22 Worldwide Growth North America International Projected worldwide net new unit openings in 2013 of 230 to 260 units (110 to 125 in North America and 120 to 135 International)
23 Commodity Outlook 2012 restaurant cost of sales was 0.9% lower than the prior year due to lower commodity costs, primarily cheese, and supplier incentives Expect 1.0% to 1.5% higher commodities for full year 2013 Current year guidance assumes cheese block price around $1.80; 2012 price was $1.69; 2011 price was $1.80 Began using forward pricing arrangements for cheese in second quarter 2012 for a portion of Companyowned restaurants cheese purchases
24 Domestic Company-owned Unit Economics Mar. 2013(a) Dec. 2012(a) Average Sales $952,000 $949,000 Operating Income (b) $182,000 $187,000 Restaurant Operating Margin 19.1% 19.7% Cash Flow (c) $130,000 $133,000 Average Investment Cost (New Unit) $240,000 $240,000 (a) Represents a trailing 12 month period. Both periods include a 53 rd week of operations (14 week period in the fourth quarter of 2012) (b) Trailing 12 month period operating income (restaurant sales less total domestic company-owned restaurant expenses) (c) Represents "in the box" results, which excludes certain G&A costs and non-operating expenses, but includes food cost with full PJFS margin.
25 Focus on Cash Flow Strong Free Cash Flow (FCF)* $40.7 Million Trailing 12 Month Period Distribution of Free Cash Flow to Shareholders in the form of share repurchases $106.1 million of Stock Repurchases in 2012; $49.9 million Repurchased in 2013 through April 30th Approximately $65.6 Million Remaining for Repurchase under Current Board Authorization 21.8 Million Actual Shares Outstanding as of April 30, x Debt to EBITDA Increased revolving line of credit from $175 million to $300 million in April 2013 *Net cash provided by operating activities less purchase of property and equipment
 $1,126.4 $1,217.9 2010 2011 2012 Net Income (millions) $48.2 $54.7 $1,321.2 $61.")
 $3.00 $2.50 $2.00 $1.50 $1.00 $79.5 $87.0 $98.6 2010 2011 2012 $1.83 EPS $2.")

26 Three-Year Financial Highlights $1,400.0 $1,300.0 $1,200.0 $1,100.0 $1,000.0 $900.0 $60.0 $50.0 $40.0 $30.0 Revenues (millions) $1,126.4 $1, Net Income (millions) $48.2 $54.7 $1,321.2 $ % % % % $100.0 $90.0 $80.0 $70.0 $60.0 Operating Income (millions) $3.00 $2.50 $2.00 $1.50 $1.00 $79.5 $87.0 $ $1.83 EPS $ $ % % % % excludes BIBP; 2012 excludes the benefit of the 53 rd week of operations and the Incentive Contribution. See reconciliation of Non-GAAP Measures at the end of this presentation for additional information.
27 Recap of Investment Proposition Brand Image/Product Quality/Founder Engagement Experienced Management Team Leveragable Infrastructure and Systems - Worldwide Commitment to Continued Domestic Unit Development, with Aggressive Incentives Extraordinary International Opportunities/Robust International Development Pipeline Strong Cash Flow/Conservative Balance Sheet Return of Free Cash Flow to Shareholders Targeted sustainable EPS growth of over 10% (14-18% projected in 2013, compared to adjusted 2012 EPS of $2.55)
28 Reconciliation of Non-GAAP Measures Certain financial measures we present in this presentation exclude the 53 rd week of operations, the impact of a marketing incentive contribution ( Incentive Contribution ) and the consolidation of BIBP, which are not measures that are defined in accordance with accounting principles generally accepted in the United States ( GAAP ). These non-gaap measures should not be construed as a substitute for or a better indicator of the company s performance than the company s GAAP measures. Management believes presenting the financial information without these measures is important for comparability purposes. In addition, management uses these non- GAAP measures to allocate resources, and analyze trends and underlying operating performance. Annual cash bonuses, and certain long-term incentive programs for various levels of management were based on financial measures that exclude the marketing incentive contribution and BIBP. The presentation of the non-gaap measures in this presentation is made alongside the most directly comparable GAAP measures. In this presentation, we refer to global restaurant sales, representing global company-owned and franchised sales. Management believes global sales information is useful in analyzing our results since our franchisees pay royalties that are based on a percentage of franchise sales. Franchise sales generate commissary revenue in the United States and in certain international markets. Global restaurant and comparable sales growth information is also useful in analyzing industry trends and the strength of our brand. Franchise restaurant sales are not included in company revenues. Free cash flow is defined as net cash provided by operating activities, less the purchase of property and equipment. We view free cash flow as an important measure because it is one factor that management uses in determining the amount of cash available for discretionary investment. Free cash flow is not a term defined by GAAP and as a result our measure of free cash flow might not be comparable to similarly titled measures used by other companies. Free cash flow should not be construed as a substitute or a better indicator of our performance than our GAAP measures.
29 Reconciliation of Non-GAAP Measures (continued) Year Ended Quarter Dec. 30, Dec. 26, Mar 30, Mar 25, (In thousands, except per share amounts) Revenues, as reported $ 1,342,653 $ 1,126,397 $ 355,604 $ 331,276 53rd week of operations (21,500) Revenues, excluding 53rd week of operations $ 1,321,153 $ 1,126,397 $ 355,604 $ 331,276 Operating income, as reported $ 99,807 $ 86,744 $ 29,625 $ 27,256 BIBP cheese purchasing entity - (7,224) rd week of operations (4,145) Incentive Contribution 2,971 - (250) 3,721 Operating income, excluding noted items $ 98,633 $ 79,520 $ 29,375 $ 30,977 Net income, as reported $ 61,660 $ 52,578 $ 19,306 $ 16,981 BIBP cheese purchasing entity - (4,339) rd week of operations (2,634) Incentive Contribution 1,955 - (165) 2,439 Net income, excluding noted items $ 60,981 $ 48,239 $ 19,141 $ 19,420 Earnings per diluted share, as reported $ 2.58 $ 1.99 $ 0.85 $ 0.69 BIBP cheese purchasing entity - (0.16) rd week of operations (0.11) Incentive Contribution (0.01) 0.10 Earnings per diluted share, excluding noted items $ 2.55 $ 1.83 $ 0.84 $ 0.79 Free Cash Flow Trailing 12 Months Net cash provided by operating activities $ 90,200 Purchase of property and equipment (49,473) Free cash flow $ 40,727 29
INVESTKentucky Conference. June 9, 2011
 INVESTKentucky Conference Louisville, KY June 9, 2011 Chris Sternberg SVP, Corporate Communications and General Counsel Keeta Fox Vice President, Finance Forward Looking Statements and Additional Information
Jefferies Winter Consumer Summit Beaver Creek January 26, 2015
 Jefferies Winter Consumer Summit Beaver Creek January 26, 2015 Forward Looking Statements Certain matters discussed in this presentation constitute forward-looking statements within the meaning of the
Investor Presentation. March 2018
 Investor Presentation March 2018 Papa John s Representatives Steve Ritchie President and CEO Mike Nettles SVP and Chief Information and Digital Officer Brandon Rhoten SVP and Chief Marketing Officer Steve
PAPA JOHN S ANNOUNCES FIRST QUARTER 2017 RESULTS
 PAPA JOHN S ANNOUNCES FIRST QUARTER 2017 RESULTS Louisville, Kentucky (May 2, 2017) Papa John s International, Inc. (NASDAQ: PZZA) today announced financial results for the first quarter ended March 26,
PAPA JOHN S ANNOUNCES SECOND QUARTER 2015 RESULTS
 PAPA JOHN S ANNOUNCES SECOND QUARTER 2015 RESULTS Comparable Sales Increases of 5.5% for North America and 6.8% for International Drive Strong Earnings Growth Louisville, Kentucky (August 4, 2015) Papa
Papa John's Announces Third Quarter Results
 November 3, 2010 Papa John's Announces Third Quarter Results EPS Increased 6.7% over Prior Year, Excluding BIBP; 2010 EPS Guidance Updated to a Range of $1.74 to $1.80, Excluding BIBP LOUISVILLE, Ky.--(BUSINESS
Papa John's Reports First Quarter Earnings
 May 5, 2009 Papa John's Reports First Quarter Earnings 2009 Earnings Guidance Reaffirmed LOUISVILLE, Ky., May 05, 2009 (BUSINESS WIRE) -- Papa John's International, Inc. (NASDAQ: PZZA): Highlights First
First Quarter 2018 Financial Results
 First Quarter 2018 Financial Results "Safe Harbor" Statement under the Private Securities Litigation Reform Act of 1995: This release and related statements by management contain forward-looking statements
YUM! Brands, Inc. Historical Financial Summary. Second Quarter, 2017
 YUM! Brands, Inc. Historical Financial Summary Second Quarter, 2017 YUM! Brands, Inc. Consolidated Statements of Income (in millions, except per share amounts) 2017 2016 2015 YTD Q3 Q4 FY FY Revenues Company
Papa John's Reports First Quarter Earnings; April Comparable Sales Results Announced; 2005 Earnings Guidance Increased
 May 2, 2005 Papa John's Reports First Quarter Earnings; April Comparable Sales Results Announced; 2005 Earnings Guidance Increased LOUISVILLE, Ky.--(BUSINESS WIRE)--May 2, 2005--Papa John's International,
SAFE HARBOR STATEMENT
 1 SAFE HARBOR STATEMENT Forward Looking Statements This press release, and the above referenced conference call, contains or may contain forward-looking statements made pursuant to the safe harbor provisions
SAFE HARBOR STATEMENT
 1 SAFE HARBOR STATEMENT Forward Looking Statements This press release contains or may contain forward-looking statements made pursuant to the safe harbor provisions of the Private Securities Litigation
November 2012 Investor Presentation
 November 2012 Investor Presentation FORWARD-LOOKING STATEMENTS This presentation and our accompanying comments include forward-looking statements. These statements relate to future events or our future
SAFE HARBOR STATEMENT
 1 SAFE HARBOR STATEMENT Forward Looking Statements This press release contains or may contain forward-looking statements made pursuant to the safe harbor provisions of the Private Securities Litigation
DENNY S CORPORATION REPORTS RESULTS FOR FOURTH QUARTER AND FULL YEAR 2017
 REPORTS RESULTS FOR FOURTH QUARTER AND FULL YEAR 2017 SPARTANBURG, S.C., February 13, 2018 - Denny s Corporation (NASDAQ: DENN), franchisor and operator of one of America's largest franchised full-service
Fourth Quarter 2017 Financial Results
 Fourth Quarter 2017 Financial Results "Safe Harbor" Statement under the Private Securities Litigation Reform Act of 1995: This release and related statements by management contain forward-looking statements
World s Best Investment Bank Awards 2018
 Global Finance will publish its selections for the 19th Annual World s Best Investment Banks in the April 2018 issue. Winners will be honored at an awards ceremony in New York City in March, and all award
DENNY S CORPORATION REPORTS RESULTS FOR FOURTH QUARTER AND FULL YEAR 2016
 REPORTS RESULTS FOR FOURTH QUARTER AND FULL YEAR 2016 SPARTANBURG, S.C., February 15, 2017 - Denny s Corporation (NASDAQ: DENN), franchisor and operator of one of America's largest franchised full-service
Domino s Pizza Announces Second Quarter 2006 Results
 For Immediate Release Contact: Lynn Liddle, Executive Vice President, Communications and Investor Relations (734) 930 3008 Domino s Pizza Announces Second Quarter 2006 Results ANN ARBOR, Michigan, July
NEWS. Tim Jerzyk Senior Vice President, Investor Relations/Treasurer
 NEWS Tim Jerzyk Senior Vice President, Investor Relations/Treasurer Yum! Brands Inc. Reports Second Quarter 2009 EPS of $0.63; $0.50 Per Share or 10% Growth Excluding Special Items; Maintains Guidance
Domino s Pizza Financial Results Demonstrate Global Momentum Delivers 21.9% EPS Growth in the Fourth Quarter; Dividend Increases 25%
 For Immediate Release EXHIBIT 99.1 Contact: Lynn Liddle, Executive Vice President, Communications, Investor Relations and Legislative Affairs (734) 930-3008 Domino s Pizza Financial Results Demonstrate
Dine Brands Global, Inc. Investor Presentation. March 5, 2018
 Dine Brands Global, Inc. Investor Presentation March 5, 2018 2 Disclosures Forward-Looking Information: The content contained in this presentation is as of February 21, 2018. The Company assumes no obligation
Keith Siegner Vice President, Investor Relations, Corporate Strategy and Treasurer. % Change. Same-Store Sales
 Yum! Brands Reports Second-Quarter GAAP Operating Profit Growth of 1%; Delivered Second-Quarter Core Operating Profit Growth of 19%; Maintains Full-Year Core Operating Profit Growth Guidance Louisville,
INVESTOR PRESENTATION JANUARY 2018
 INVESTOR PRESENTATION JANUARY 2018 0 FORWARD-LOOKING STATEMENTS Forward-Looking Statements This presentation contains forward-looking statements that are subject to risks and uncertainties. All statements
DOMINO S INVESTOR PRESENTATION AUGUST 2018
 DOMINO S INVESTOR PRESENTATION AUGUST 2018 LEGAL STUFF This presentation and our accompanying comments include forward-looking statements. These statements may relate to future events or our future financial
Wedbush Morgan California Dreamin Santa Monica, CA December 9, 2008
 Wedbush Morgan California Dreamin 2008 Santa Monica, CA December 9, 2008 GUESS?, Inc. Carlos Alberini President & Chief Operating Officer 2 Safe Harbor Statement Except for historical information contained
DENNY S CORPORATION REPORTS RESULTS FOR FOURTH QUARTER AND FULL YEAR 2015
 REPORTS RESULTS FOR FOURTH QUARTER AND FULL YEAR 2015-5.8% Increase in 2015 Full Year Domestic System-Wide Same-Store Sales - - 16.4% Growth in 2015 Full Year Adjusted Net Income per Share* - SPARTANBURG,
Denny's Corporation Reports Results for Second Quarter 2013
 July 29, 2013 Denny's Corporation Reports Results for Second Quarter 2013 Adjusted Net Income Per Share* Increased 20.7% to $0.08 SPARTANBURG, S.C., July 29, 2013 (GLOBE NEWSWIRE) -- Denny's Corporation
Steve Schmitt Vice President, Investor Relations & Corporate Strategy
 NEWS Steve Schmitt Vice President, Investor Relations & Corporate Strategy Yum! Brands Reports Second-Quarter EPS of $0.69, a Decline of 5%, Excluding Special Items; Expects Strong Second Half in China;
Dunkin Brands Group, Inc.
 Dunkin Brands Group, Inc. Investor Presentation Jefferies Consumer Conference Nigel Travis Chairman & CEO 1 Forward-Looking Statements Certain information contained in this presentation, particularly information
DENNY S CORPORATION REPORTS RESULTS FOR THIRD QUARTER 2018
 REPORTS RESULTS FOR THIRD QUARTER 2018 - Announces Refranchising And Development Strategy - SPARTANBURG, S.C., October 30, 2018 - Denny s Corporation (NASDAQ: DENN), franchisor and operator of one of America's
Donny Lau Senior Director, Investor Relations & Corporate Strategy
 NEWS Donny Lau Senior Director, Investor Relations & Corporate Strategy Yum! Brands Reports Second-Quarter GAAP Operating Profit Growth of 32%; Delivered Core Operating Profit Growth of 7%; Raises Full-Year
Domino s Pizza, Inc. (Exact name of registrant as specified in its charter)
") SECURITIES AND EXCHANGE COMMISSION Washington, D.C. 20549 FORM 8-K Current Report Pursuant to Section 13 or 15(d) of the Securities Exchange Act of 1934 Date of report (Date of earliest event reported):
SECURITIES AND EXCHANGE COMMISSION Washington, D.C. 20549 FORM 8-K Current Report Pursuant to Section 13 or 15(d) of the Securities Exchange Act of 1934 Date of report (Date of earliest event reported):
UNITED STATES SECURITIES AND EXCHANGE COMMISSION Washington, D.C FORM 8-K
 UNITED STATES SECURITIES AND EXCHANGE COMMISSION Washington, D.C. 20549 FORM 8-K CURRENT REPORT PURSUANT TO SECTION 13 OR 15(d) OF THE SECURITIES EXCHANGE ACT OF 1934 Date of Report (Date of earliest event
Jacky Lo Chief Finance Officer, Yum China
 Jacky Lo Chief Finance Officer, Yum China Cautionary Language Regarding Forward-Looking Statements Forward-Looking Statements. Our presentation may contain forward-looking statements within the meaning
Best Treasury & Cash Management Providers 2017
 Page 1 of 5 In March 2017, Global Finance will publish its selections for the Seventeenth Annual World s Best Treasury & Cash Management Providers. Global Finance will select the best overall global cash
Investor Presentation. Domino s Pizza
 Investor Presentation Domino s Pizza July 2005 Forward-Looking Statements This presentation and our accompanying comments may contain forward-looking statements. These statements relate to future events
Luby s Reports Third Quarter Fiscal 2016 Results
 For additional information contact: FOR IMMEDIATE RELEASE Dennard-Lascar Associates Rick Black / Ken Dennard Investor Relations 713-529-6600 Luby s Reports Third Quarter Fiscal Results Luby s Cafeterias
Cautionary Statement Regarding Forward-Looking Statements
 January 2018 Cautionary Statement Regarding Forward-Looking Statements Forward Looking Statements: Certain statements are forward-looking statements made pursuant to the safe harbor provisions of the Private
Total Imports by Volume (Gallons per Country)
") 3/7/2018 Imports by Volume (Gallons per Country) YTD YTD Country 01/2017 01/2018 % Change 2017 2018 % Change MEXICO 54,235,419 58,937,856 8.7 % 54,235,419 58,937,856 8.7 % NETHERLANDS 12,265,935 10,356,183
3/7/2018 Imports by Volume (Gallons per Country) YTD YTD Country 01/2017 01/2018 % Change 2017 2018 % Change MEXICO 54,235,419 58,937,856 8.7 % 54,235,419 58,937,856 8.7 % NETHERLANDS 12,265,935 10,356,183
INVESTOR PRESENTATION JUNE 2018
 INVESTOR PRESENTATION JUNE 2018 0 FORWARD-LOOKING STATEMENTS Forward-Looking Statements This presentation contains forward-looking statements that are subject to risks and uncertainties. All statements
TRICON ANNOUNCES FIRST QUARTER 1999 RESULTS OPERATING EARNINGS PER SHARE UP 116 PERCENT TO $0.54 PER SHARE
 TRICON ANNOUNCES FIRST QUARTER 1999 RESULTS OPERATING EARNINGS PER SHARE UP 116 PERCENT TO $0.54 PER SHARE LOUISVILLE, KY (April 28, 1999) Tricon Global Restaurants, Inc. (NYSE:YUM) reported first quarter
Argentina Bahamas Barbados Bermuda Bolivia Brazil British Virgin Islands Canada Cayman Islands Chile
 Americas Argentina (Banking and finance; Capital markets: Debt; Capital markets: Equity; M&A; Project Bahamas (Financial and corporate) Barbados (Financial and corporate) Bermuda (Financial and corporate)
FY2016 RESULTS. 1 February 2016 to 31 January Inditex continues to roll out its global, fully integrated store and online model.
 FY2016 RESULTS 1 February 2016 to 31 January 2017 Inditex continues to roll out its global, fully integrated store and online model. Strong operating performance: Net sales for FY2016 reached 23.3 billion,
GAP INC. REPORTS SECOND QUARTER RESULTS. Reaffirmed Full-Year Earnings Per Share Guidance Range of $2.55 to $2.70
 GAP INC. REPORTS SECOND QUARTER RESULTS Reaffirmed Full-Year Earnings Per Share Guidance Range of $2.55 to $2.70 Delivered Seventh Consecutive Quarter of Positive Comparable Sales Growth Distributed $388
Domino s Pizza Announces Second Quarter 2009 Financial Results
 For Immediate Release Contact: Lynn Liddle, Executive Vice President, Communications and Investor Relations (734) 930 3008 Domino s Pizza Announces Second Quarter Financial Results ANN ARBOR, Michigan,
SHARE IN OUR FUTURE AN ADVENTURE IN EMPLOYEE STOCK OWNERSHIP DEBBI MARCUS, UNILEVER
 SHARE IN OUR FUTURE AN ADVENTURE IN EMPLOYEE STOCK OWNERSHIP DEBBI MARCUS, UNILEVER DEBBI.MARCUS@UNILEVER.COM RUTGERS SCHOOL OF MANAGEMENT AND LABOR RELATIONS NJ/NY CENTER FOR EMPLOYEE OWNERSHIP AGENDA
Total Imports by Volume (Gallons per Country)
") 4/5/2018 Imports by Volume (Gallons per Country) YTD YTD Country 02/2017 02/2018 % Change 2017 2018 % Change MEXICO 53,961,589 55,268,981 2.4 % 108,197,008 114,206,836 5.6 % NETHERLANDS 12,804,152 11,235,029
4/5/2018 Imports by Volume (Gallons per Country) YTD YTD Country 02/2017 02/2018 % Change 2017 2018 % Change MEXICO 53,961,589 55,268,981 2.4 % 108,197,008 114,206,836 5.6 % NETHERLANDS 12,804,152 11,235,029
SANGAM GLOBAL PHARMACEUTICAL & REGULATORY CONSULTANCY
 SANGAM GLOBAL PHARMACEUTICAL & REGULATORY CONSULTANCY Regulatory Affairs Worldwide An ISO 9001:2015 Certified Company Welcome to Sangam Global Pharmaceutical & Regulatory Consultancy (SGPRC) established
GAP INC. REPORTS THIRD QUARTER RESULTS. Delivers Fourth Consecutive Quarter of Positive Comparable Sales Growth, with Positive 3 Percent.
 GAP INC. REPORTS THIRD QUARTER RESULTS Delivers Fourth Consecutive Quarter of Positive Comparable Sales Growth, with Positive 3 Percent. Increases Reported EPS Guidance to a Range of $2.18 to $2.22 for
Total Imports by Volume (Gallons per Country)
") 6/6/2018 Imports by Volume (Gallons per Country) YTD YTD Country 04/2017 04/2018 % Change 2017 2018 % Change MEXICO 60,968,190 71,994,646 18.1 % 231,460,145 253,500,213 9.5 % NETHERLANDS 13,307,731 10,001,693
6/6/2018 Imports by Volume (Gallons per Country) YTD YTD Country 04/2017 04/2018 % Change 2017 2018 % Change MEXICO 60,968,190 71,994,646 18.1 % 231,460,145 253,500,213 9.5 % NETHERLANDS 13,307,731 10,001,693
 Page 1 of 7 Release Yum! Brands Inc. Announces 2011 EPS Growth of 7%, Or $0.63 Per Share, Excluding Special Items; Driven by Outstanding China and Emerging Market Performance LOUISVILLE, Ky., Apr 20, 2011
NEWS. Tim Jerzyk Senior Vice President, Investor Relations
 NEWS Tim Jerzyk Senior Vice President, Investor Relations Yum! Brands Reports First-Quarter EPS Growth of 21%, or $0.76 Per Share, Excluding Special Items; Strong Sales and Operating Profit Growth Across
AFC Enterprises Reports Financial Results for Third Quarter 2010; Raises Fiscal 2010 Earnings Guidance
 November 10, 2010 AFC Enterprises Reports Financial Results for Third Quarter 2010; Raises Fiscal 2010 Earnings Guidance ATLANTA--(BUSINESS WIRE)-- AFC Enterprises, Inc. (NASDAQ: AFCE), the franchisor
NEWS. Tim Jerzyk Senior Vice President, Investor Relations
 NEWS Tim Jerzyk Senior Vice President, Investor Relations Yum! Brands Inc. Announces First Quarter 2011 EPS Growth of 7%, Or $0.63 Per Share, Excluding Special Items; Driven by Outstanding China and Emerging
Dunkin Brands Group, Inc.
 Dunkin Brands Group, Inc. Investor Presentation Fourth Quarter 2013 1 Forward-Looking Statements Certain information contained in this presentation, particularly information regarding future economic performance,
FY2017 RESULTS. 1 February 2017 to 31 January Inditex continues to roll out its global, fully integrated store and online platform.
 FY2017 RESULTS 1 February 2017 to 31 January 2018 Inditex continues to roll out its global, fully integrated store and online platform. Strong operating performance: Net sales for FY2017 reached 25.3 billion,
Keith Siegner Vice President, Investor Relations, Corporate Strategy and Treasurer
 NEWS Keith Siegner Vice President, Investor Relations, Corporate Strategy and Treasurer Yum! Brands Reports Fourth-Quarter GAAP Operating Profit Growth of 134%; Fourth-Quarter Core Operating Profit Decline
Fiscal Capital Allocation Strategy
 THE HOME DEPOT ANNOUNCES FOURTH QUARTER AND FISCAL RESULTS; ANNOUNCES $17 BILLION SHARE REPURCHASE AUTHORIZATION; INCREASES QUARTERLY DIVIDEND BY 34 PERCENT AND PROVIDES FISCAL YEAR GUIDANCE ATLANTA, February
CL King s Annual Best Ideas Conference
 WELCOME TO AMERICA S DINER CL King s Annual Best Ideas Conference September 10, 2015 Forward Looking Statements and Non-GAAP Financial Measures Denny s Corporation urges caution in considering its current
THE WENDY S COMPANY REPORTS PRELIMINARY 2016 RESULTS; ANNOUNCES 2017 OUTLOOK AND UPDATES 2020 GOALS
 THE WENDY S COMPANY REPORTS PRELIMINARY 2016 RESULTS; ANNOUNCES 2017 OUTLOOK AND UPDATES 2020 GOALS 16th consecutive quarter of positive same-restaurant sales; North America system same-restaurant sales
2. Mining equipment exports
 Raw Materials Scoreboard Mining equipment exports 2. Mining equipment exports Key points: The EU-28, China, Japan and the United States were net exporters of mining equipment over the 2011-2015 period.
Total Imports by Volume (Gallons per Country)
") 7/6/2018 Imports by Volume (Gallons per Country) YTD YTD Country 05/2017 05/2018 % Change 2017 2018 % Change MEXICO 71,166,360 74,896,922 5.2 % 302,626,505 328,397,135 8.5 % NETHERLANDS 12,039,171 13,341,929
7/6/2018 Imports by Volume (Gallons per Country) YTD YTD Country 05/2017 05/2018 % Change 2017 2018 % Change MEXICO 71,166,360 74,896,922 5.2 % 302,626,505 328,397,135 8.5 % NETHERLANDS 12,039,171 13,341,929
Total Imports by Volume (Gallons per Country)
") 5/4/2016 Imports by Volume (Gallons per Country) YTD YTD Country 03/2015 03/2016 % Change 2015 2016 % Change MEXICO 53,821,885 60,813,992 13.0 % 143,313,133 167,568,280 16.9 % NETHERLANDS 11,031,990 12,362,256
5/4/2016 Imports by Volume (Gallons per Country) YTD YTD Country 03/2015 03/2016 % Change 2015 2016 % Change MEXICO 53,821,885 60,813,992 13.0 % 143,313,133 167,568,280 16.9 % NETHERLANDS 11,031,990 12,362,256
Clinical Trials Insurance
 Allianz Global Corporate & Specialty Clinical Trials Insurance Global solutions for clinical trials liability Specialist cover for clinical research The challenges of international clinical research are
a closer look GLOBAL TAX WEEKLY ISSUE 249 AUGUST 17, 2017
 GLOBAL TAX WEEKLY a closer look ISSUE 249 AUGUST 17, 2017 SUBJECTS TRANSFER PRICING INTELLECTUAL PROPERTY VAT, GST AND SALES TAX CORPORATE TAXATION INDIVIDUAL TAXATION REAL ESTATE AND PROPERTY TAXES INTERNATIONAL
Buffalo Wild Wings, Inc. Announces Third Quarter Earnings per Share of $1.17 and Adjusted Earnings per Share of $1.36
 Buffalo Wild Wings Inc. Logo Buffalo Wild Wings, Inc. Announces Third Quarter Earnings per Share of $1.17 and Adjusted Earnings per Share of $1.36 October 25, 2017 Increasing 2017 Forecasted GAAP EPS to
Fourth Quarter 2018 Results Presentation. January 31, 2019
 Fourth Quarter 2018 Results Presentation January 31, 2019 1 Cautionary Statement on Forward-Looking Statements & Non-GAAP Measures This presentation contains forward-looking statements within the meaning
Investor Presentation. December 2014
 Investor Presentation December 2014 Forward-Looking Statements and Non-GAAP Financial Measures Denny s Corporation urges caution in considering its current trends and any outlook on earnings disclosed
Total Imports by Volume (Gallons per Country)
") 12/6/2018 Imports by Volume (Gallons per Country) YTD YTD Country 10/2017 10/2018 % Change 2017 2018 % Change MEXICO 56,462,606 60,951,402 8.0 % 608,891,240 662,631,088 8.8 % NETHERLANDS 11,381,432 10,220,226
12/6/2018 Imports by Volume (Gallons per Country) YTD YTD Country 10/2017 10/2018 % Change 2017 2018 % Change MEXICO 56,462,606 60,951,402 8.0 % 608,891,240 662,631,088 8.8 % NETHERLANDS 11,381,432 10,220,226
THE WENDY S COMPANY REPORTS PRELIMINARY 2017 RESULTS; ANNOUNCES 2018 OUTLOOK AND UPDATES 2020 GOALS
 THE WENDY S COMPANY REPORTS PRELIMINARY 2017 RESULTS; ANNOUNCES 2018 OUTLOOK AND UPDATES 2020 GOALS North America same-restaurant sales increase 1.3% in 4Q and 2.0% in 2017; 20th consecutive quarter of
Agenda. Financial Review. Review of Operations. Future Plans and Strategies. Open Forum
 22 October 2009 1 Disclaimer The information contained in this presentation is intended solely for your personal reference. Such information is subject to change without notice, its accuracy is not guaranteed
Total Imports by Volume (Gallons per Country)
") 2/6/2019 Imports by Volume (Gallons per Country) YTD YTD Country 11/2017 11/2018 % Change 2017 2018 % Change MEXICO 48,959,909 54,285,392 10.9 % 657,851,150 716,916,480 9.0 % NETHERLANDS 11,903,919 10,024,814
2/6/2019 Imports by Volume (Gallons per Country) YTD YTD Country 11/2017 11/2018 % Change 2017 2018 % Change MEXICO 48,959,909 54,285,392 10.9 % 657,851,150 716,916,480 9.0 % NETHERLANDS 11,903,919 10,024,814
Forward-Looking Statements
 Third Quarter 2015 Conference Call October 29, 2015 Forward-Looking Statements Certain information contained in this presentation constitutes forward-looking statements for purposes of the safe harbor
Total Imports by Volume (Gallons per Country)
") 10/5/2018 Imports by Volume (Gallons per Country) YTD YTD Country 08/2017 08/2018 % Change 2017 2018 % Change MEXICO 67,180,788 71,483,563 6.4 % 503,129,061 544,043,847 8.1 % NETHERLANDS 12,954,789 12,582,508
10/5/2018 Imports by Volume (Gallons per Country) YTD YTD Country 08/2017 08/2018 % Change 2017 2018 % Change MEXICO 67,180,788 71,483,563 6.4 % 503,129,061 544,043,847 8.1 % NETHERLANDS 12,954,789 12,582,508
Third Quarter 2017 Business Update. October 26, 2017
 Third Quarter 2017 Business Update October 26, 2017 Third Quarter 2017 Results (GAAP Basis) $ in millions, except EPS Q3 % of Q3 % of Increase/ 2017 Sales 2016 Sales (Decrease) Net sales $948.2 $901.4
Total Imports by Volume (Gallons per Country)
") 11/2/2018 Imports by Volume (Gallons per Country) YTD YTD Country 09/2017 09/2018 % Change 2017 2018 % Change MEXICO 49,299,573 57,635,840 16.9 % 552,428,635 601,679,687 8.9 % NETHERLANDS 11,656,759 13,024,144
11/2/2018 Imports by Volume (Gallons per Country) YTD YTD Country 09/2017 09/2018 % Change 2017 2018 % Change MEXICO 49,299,573 57,635,840 16.9 % 552,428,635 601,679,687 8.9 % NETHERLANDS 11,656,759 13,024,144
EQUITY REPORTING & WITHHOLDING. Updated May 2016
 EQUITY REPORTING & WITHHOLDING Updated May 2016 When you exercise stock options or have RSUs lapse, there may be tax implications in any country in which you worked for P&G during the period from the
Total Imports by Volume (Gallons per Country)
") 3/6/2019 Imports by Volume (Gallons per Country) YTD YTD Country 12/2017 12/2018 % Change 2017 2018 % Change MEXICO 54,169,734 56,505,154 4.3 % 712,020,884 773,421,634 8.6 % NETHERLANDS 11,037,475 8,403,018
3/6/2019 Imports by Volume (Gallons per Country) YTD YTD Country 12/2017 12/2018 % Change 2017 2018 % Change MEXICO 54,169,734 56,505,154 4.3 % 712,020,884 773,421,634 8.6 % NETHERLANDS 11,037,475 8,403,018
Micky Pant CEO, Yum China
 Micky Pant CEO, Yum China Cautionary Language Regarding Forward-Looking Statements Forward-Looking Statements. Our presentation may contain forward-looking statements within the meaning of Section 27A
Fourth Quarter & Full Year 2017 Results Presentation. February 8, 2018
 Fourth Quarter & Full Year 2017 Results Presentation February 8, 2018 1 Cautionary Statement on Forward-Looking Statements & Non-GAAP Measures This presentation contains forward-looking statements within
JPMorgan Funds statistics report: Emerging Markets Debt Fund
 NOT FDIC INSURED NO BANK GUARANTEE MAY LOSE VALUE JPMorgan Funds statistics report: Emerging Markets Debt Fund Data as of November 30, 2016 Must be preceded or accompanied by a prospectus. jpmorganfunds.com
Luby s Reports Fourth Quarter and Fiscal 2015 Results
 For additional information contact: FOR IMMEDIATE RELEASE Dennard-Lascar Associates 713-529-6600 Rick Black / Ken Dennard Investor Relations Luby s Reports Fourth Quarter and Fiscal Results HOUSTON, TX
Fourth Quarter & Fiscal 2015 Business Update. February 25, 2016
 Fourth Quarter & Fiscal 2015 Business Update February 25, 2016 Fourth Quarter 2015 Highlights Net Sales Comparable to LY $ in millions, except EPS Adjusted Operating Income* (Adjusted Operating Margin)
GAP INC. REPORTS FIRST QUARTER RESULTS. Company outlines measures to drive long-term success
 GAP INC. REPORTS FIRST QUARTER RESULTS Company outlines measures to drive long-term success SAN FRANCISCO May 19, 2016 Gap Inc. (NYSE: GPS) today reported first quarter fiscal year 2016 results and provided
ABOUT THE DATA. IntelliRisk Advanced Global Data. Content Overview. Data Feeds and Frequency. Account Setup in IntelliRisk Advanced
 ABOUT THE DATA Advanced Global Data Content Overview Data Feeds and Frequency Account Setup in Advanced Currency and Financial Data Claim Data Processing Help / International Services Team Data Feeds and
Total Imports by Volume (Gallons per Country)
") 10/5/2017 Imports by Volume (Gallons per Country) YTD YTD Country 08/2016 08/2017 % Change 2016 2017 % Change MEXICO 51,349,849 67,180,788 30.8 % 475,806,632 503,129,061 5.7 % NETHERLANDS 12,756,776 12,954,789
10/5/2017 Imports by Volume (Gallons per Country) YTD YTD Country 08/2016 08/2017 % Change 2016 2017 % Change MEXICO 51,349,849 67,180,788 30.8 % 475,806,632 503,129,061 5.7 % NETHERLANDS 12,756,776 12,954,789
Total Imports by Volume (Gallons per Country)
") 1/5/2018 Imports by Volume (Gallons per Country) YTD YTD Country 11/2016 11/2017 % Change 2016 2017 % Change MEXICO 50,994,409 48,959,909 (4.0)% 631,442,105 657,851,150 4.2 % NETHERLANDS 9,378,351 11,903,919
1/5/2018 Imports by Volume (Gallons per Country) YTD YTD Country 11/2016 11/2017 % Change 2016 2017 % Change MEXICO 50,994,409 48,959,909 (4.0)% 631,442,105 657,851,150 4.2 % NETHERLANDS 9,378,351 11,903,919
2018 Global Medical Trends Survey Report
 2018 Global Medical Trends Survey Report Executive summary The cost of medical care continues to rise across the globe. Insurers responding to the 2018 Willis Towers Watson Global Medical Trends Pulse
Mattel, Inc. Earnings Conference Call Fourth Quarter 2017 (Unaudited Results)
") Mattel, Inc. Earnings Conference Call Fourth Quarter 2017 (Unaudited Results) FEBRUARY 1, 2018 MARGARET GEORGIADIS CHIEF EXECUTIVE OFFICER JOE EUTENEUER CHIEF FINANCIAL OFFICER FORWARD-LOOKING STATEMENTS:
Mattel, Inc. Earnings Conference Call Fourth Quarter 2017 (Unaudited Results) FEBRUARY 1, 2018 MARGARET GEORGIADIS CHIEF EXECUTIVE OFFICER JOE EUTENEUER CHIEF FINANCIAL OFFICER FORWARD-LOOKING STATEMENTS:
FOREIGN ACTIVITY REPORT
 FOREIGN ACTIVITY REPORT SECOND QUARTER 2012 TABLE OF CONTENTS Table of Contents... i All Securities Transactions... 2 Highlights... 2 U.S. Transactions in Foreign Securities... 2 Foreign Transactions in
Total Imports by Volume (Gallons per Country)
") 2/6/2018 Imports by Volume (Gallons per Country) YTD YTD Country 12/2016 12/2017 % Change 2016 2017 % Change MEXICO 50,839,282 54,169,734 6.6 % 682,281,387 712,020,884 4.4 % NETHERLANDS 10,630,799 11,037,475
2/6/2018 Imports by Volume (Gallons per Country) YTD YTD Country 12/2016 12/2017 % Change 2016 2017 % Change MEXICO 50,839,282 54,169,734 6.6 % 682,281,387 712,020,884 4.4 % NETHERLANDS 10,630,799 11,037,475
2018 Second Quarter Earnings Call. May 8, 2018
 2018 Second Quarter Earnings Call May 8, 2018 Forward Looking Statements / Non-GAAP Measures This presentation contains information about management's view of the Company's future expectations, plans and
GAP INC. REPORTS FOURTH QUARTER AND FISCAL YEAR 2013 RESULTS
 GAP INC. REPORTS FOURTH QUARTER AND FISCAL YEAR 2013 RESULTS Full Year Earnings Per Share of $2.74, Representing an 18 Percent Increase over Last Year s 49 Percent Growth Fiscal Year 2013 Net Sales Grew
Tupperware Brands Reports First Quarter Results
 Tupperware Brands Corp. 14901 S. Orange Blossom Trail Orlando, FL 32837 Investor Contact: Teresa Burchfield (407) 826-4475 Tupperware Brands Reports First Quarter Results First quarter sales up slightly
News Release Tupperware Brands Corp S. Orange Blossom Trail Orlando, FL 32837
 News Release Tupperware Brands Corp. 14901 S. Orange Blossom Trail Orlando, FL 32837 Investor Contact: Lien Nguyen (407) 826-4475 Tupperware Brands Reports Fourth Quarter 2015 Results Declares Regular
GAP INC. REPORTS THIRD QUARTER EARNINGS
 GAP INC. REPORTS THIRD QUARTER EARNINGS Company Re-affirms Full Year EPS Guidance Range of $1.40 to $1.50 SAN FRANCISCO November 17, 2011 Gap Inc. (NYSE:GPS) today reported that net sales for the third
Fourth Quarter 2017 Business Update. February 27, 2018
 Fourth Quarter 2017 Business Update February 27, 2018 Fourth Quarter 2017 Results (GAAP Basis) $ in millions, except EPS Q4 % of Q4 % of 2017 Sales 2016 Sales Increase / (Decrease) Net sales $1,027 $934
Revenues increased by 24.3% to $99,112,000, as compared to $79,752,000 during the fifty-two weeks ended March 30, 2014.
 Nathan's Famous, Inc. Reports Year-End And Fourth Quarter Results PR Newswire JERICHO, N.Y., June 8, 2015 JERICHO, N.Y., June 8, 2015 /PRNewswire/ -- Nathan's Famous, Inc. (NASDAQ: NATH) today reported
Investor Presentation
 Investor Presentation Sidoti& Company Institutional Investor Forum March 18, 2014 Forward-Looking Statements and Non-GAAP Financial Measures Denny s Corporation urges caution in considering its current