Second Quarter 2012 Earnings Conference Call. August 9, Oldemark LLC JOHN BARKER CHIEF COMMUNICATIONS OFFICER
|
|
|
- Gertrude Melton
- 5 years ago
- Views:
Transcription
1 Second Quarter 2012 Earnings Conference Call August 9, Oldemark LLC JOHN BARKER CHIEF COMMUNICATIONS OFFICER 2 1
2 Today s Agenda Opening Comments Financial Update CEO Overview Emil Brolick Steve Hare Emil Brolick Q&A 3 Forward-Looking Statements and Non-GAAP Financial Measures This presentation, and certain information that management may discuss in connection with this presentation, contains certain statements that are not historical facts, including information concerning possible or assumed future results of our operations. Those statements constitute forward-looking statements within the meaning of the Private Securities Litigation Reform Act of 1995 (The Reform Act ). For all forward-looking statements, we claim the protection of the safe harbor for forward-looking statements contained in the Reform Act. Many important factors could affect our future results and could cause those results to differ materially from those expressed in or implied by our forward-looking statements. Such factors, all of which are difficult or impossible to predict accurately, and many of which are beyond our control, include but are not limited to those identified under the caption Forward-Looking Statements in our news release issued on August 9, 2012 and in the Special Note Regarding Forward-Looking Statements and Projections and Risk Factors sections of our most recent Form 10-K / Form 10-Qs. In addition, this presentation and certain information management may discuss in connection with this presentation reference non- GAAP financial measures, such as adjusted earnings before interest, taxes, depreciation and amortization, or adjusted EBITDA, and adjusted earnings per share. Adjusted EBITDA and adjusted earnings per share exclude certain expenses, net of certain benefits. Reconciliations of non-gaap financial measures to the most directly comparable GAAP financial measures are provided in the Appendix to this presentation, and are included in our news release issued on August 9, 2012 and posted on 4 2


3 EMIL BROLICK PRESIDENT & CHIEF EXECUTIVE OFFICER 5 Quality is our recipe. 6 3
4 WENDY S LONG-TERM STRATEGIC GROWTH DRIVERS Q Highlights Fifth consecutive quarter of positive systemwide SSS +3.2%* Company restaurant margin improved 20 bps to 14.1% Reaffirming 2012 Adjusted EBITDA outlook of $320 to $335 million Image Activation restaurants continue to generate strong sales; expansion accelerating * North America restaurants 7 Global Growth System Optimization Financial Management Restaurant Utilization & Daypart Expansion New Restaurant Development Image / Experience Activation North America Same-Store Sales Growth 8 4

5 RECIPE TO WIN PEOPLE 5-Star Athletes PRICE New QSR Quality at QSR Price PRODUCT Play a different game. Superior perceived quality, competitive price. PROMOTION Strategically driven, tactically brilliant PLACE The complete brand experience PERFORMANCE Reliable & predictable every time 9 STEVE HARE CHIEF FINANCIAL OFFICER 10 5


 bps")
6 Q Financial Highlights April May June North America Same-Store Sales Company-Operated +3.2% Franchise +3.2% Systemwide +3.2% Company Restaurant Margin Q % Q % +20 bps Key Negative Margin Variances Restaurant Labor (115) bps Commodities (70) bps 11 Investing in Restaurant Labor to Build the Brand 12 6


7 Beef: Expect Moderating Costs in Q3 and Q4 Short-Term Impact Demand: ground beef retail demand remains sluggish impact of pink slime on demand Drought: Midwest drought will send cattle to market sooner than normal: helps short-term pricing Expect Q3 and Q4 beef costs to be lower than originally anticipated, but higher than 2011 Long-Term Impact Drought: long-term supply reduced by herd liquidation Herd-size: USDA reports U.S. beef cow herd at all-time low. Herd re-building unlikely until Expect 2013 beef costs to be higher than 2012 Source: Wendy s Quality Supply Chain Co-op 13 Potential Savings Opportunities Identified to Offset Commodity Increases Wendy s Commodities as a % of Total Food and Paper Cost 63% 19% 18% Potential food and paper cost savings identified; working with suppliers and supply chain Co-Op (Wendy s QSCC) Beef Chicken Other 14 7

8 PROFIT Strategic Pricing Model Expected to Benefit Restaurant Margin Pricing Transactions SSS 15 Q Financial Summary ($ in Millions) Q Q Better/ (Worse) Sales $ $ $ 21.9 Franchise revenues Total revenues $ $ $ 23.4 Adjusted EBITDA from continuing operations* $ 89.1 $ 89.4 $ (0.3) *See reconciliation of Adjusted EBITDA from continuing operations, adjusted income from continuing operations and adjusted earnings per share from continuing operations in the appendix. 16 8
9 Income from Continuing Operations and Special Items ($ in Thousands, except per share amounts) Second Quarter After tax Per share After tax Per share Adjusted income and adjusted earnings per share from continuing operations $ 19,221 $ 0.05 $ 19,016 $ 0.05 (Less) plus: Loss on early extinguishment of debt (15,621) (0.04) - - Impairment of long-lived assets (2,018) (0.01) (224) (0.00) Costs associated with closed restaurants in other operating expense, net (a) (911) (0.00) - - Facilities relocation and other transition costs (5,817) (0.01) - - Arby's indirect corporate overhead in general and administrative (G&A) - - (4,243) (0.01) Transaction related costs (347) (0.00) (3,175) (0.01) Total adjustments (24,714) (0.06) (7,642) (0.02) (Loss) income from continuing operations and earnings per share $ (5,493) $ (0.01) $ 11,374 $ 0.03 (a) See reconciliation of Adjusted EBITDA from continuing operations, adjusted income from continuing operations and adjusted earnings per share from continuing operations in the Appendix. 17 Cash Flow 2012 YTD ($ in Millions) 2012 Net income $ 9.2 Adjustments 59.3 Net cash flow from operations 68.5 Capital expenditures (84.1) Restaurant acquisitions (21.8) Proceeds from sale of investment 24.4 Other investing activities (0.6) Net cash decrease after investing activities (13.6) Proceeds from long-term debt Repayments of long-term debt (602.8) Premium payment on Senior Notes redemption (10.1) Deferred financing costs (15.6) Dividends paid (15.6) Other financing / investing activities (1.8) Net decrease in cash after financing activities (40.1) Beginning cash balance Ending cash balance $
10 Restaurant Portfolio Update Q Company Franchise Total Operated Operated System Open at beginning of Q2 1,414 5,167 6,581 Opened Closed (19) (28) (47) Acquisitions within the system Dispositions within the system - (30) (30) Open at end of Q2 1,425 5,122 6,547 Key strategic actions in Q2 Conducted review of Company-operated restaurant portfolio, resulting in closure of 15 underperforming restaurants Company acquired 30 franchised restaurants in the Austin, Texas market 19 Q Consolidated Debt ($ in Millions) July 1, 2012 Senior Debt $ 1,361.8 Capital Leases and Other Debt 32.5 Total Debt 1,394.3 Less: Cash and Cash Equivalents Net Debt $ TTM Adjusted EBITDA* $ Total Debt / TTM Adjusted EBITDA* 4.3x Net Debt / TTM Adjusted EBITDA* 3.0x *See reconciliation of Adjusted EBITDA from continuing operations in the appendix of this presentation
11 Refinancing to Generate Ongoing Interest Savings Wendy s International, Inc. raised $1.125 billion of new secured term loans and established $200 million of a new revolving credit facility New bank debt borrowing rate of 4.75% today Redeemed $565 million of Wendy s Restaurants, LLC 10% Senior Notes due 2016 Annual interest savings of approximately $25 million Improves covenant flexibility, extends maturity and increases liquidity 21 Reaffirming 2012 and Long-Term Outlook Adjusted EBITDA from continuing operations in a range of $320 to $335 million Long-Term, beginning 2013 Average annual Adjusted EBITDA growth rate in high-single-digit to low-double-digit range 22 11
12 EMIL BROLICK PRESIDENT & CHIEF EXECUTIVE OFFICER 23 Confident in Our Strategies A Cut Above brand positioning Growth platforms to build sales and profits Wendy s Recipe to Win 24 12


13 2011 WENDY S LONG-TERM STRATEGIC GROWTH DRIVERS IMAGE ACTIVATION Global Growth System Optimization Financial Management Restaurant Utilization & Daypart Expansion New Restaurant Development Image / Experience Activation North America Same-Store Sales Growth Reimages Continuing to generate strong sales growth Operations ratings higher than system average 26 13

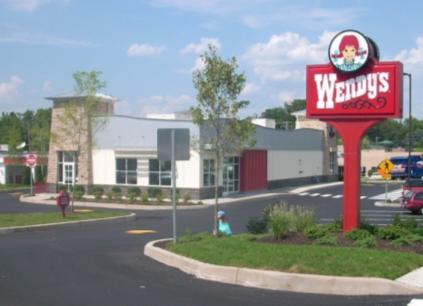
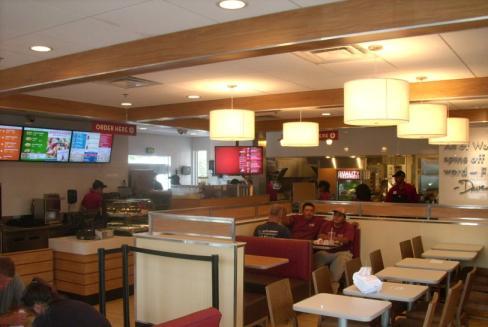

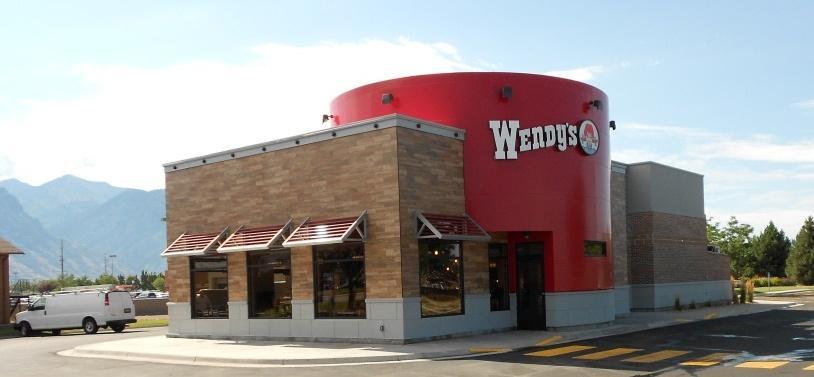
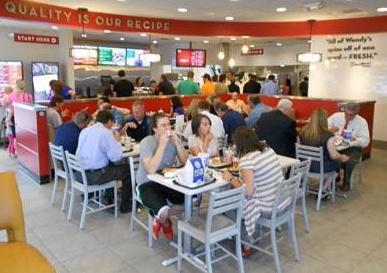
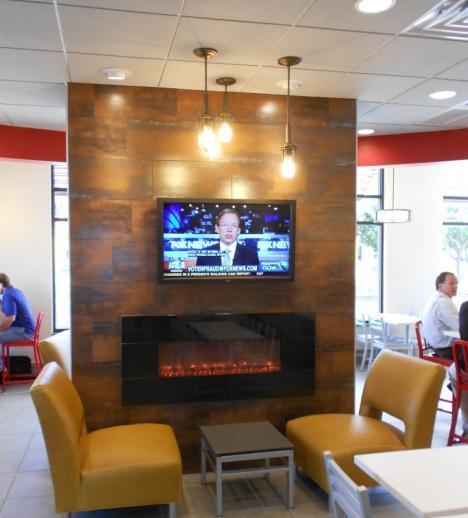
14 IMAGE ACTIVATION IMAGE ACTIVATION Philadelphia, PA July Orem, UT July 16 On track for 50 Company Reimages and 17 New Image Activation Restaurants 28 14


15 2012 IMAGE ACTIVATION First Franchise Image Activation Restaurant Hershey, PA July : Tiered Design Strategy to Optimize Returns TIER I TIER II TIER III Targeted Investment* $650 to $700K $500K $300K Sales Lift +25% +15% +5% *Estimates based on Company s current outlook; excludes maintenance cap ex and other costs 30 15


 32 Estimates based on Company s")
16 FUTURE 2013 IMAGE ACTIVATION IMAGE ACTIVATION Company 100 Reimages 20 New Restaurants Majority Tier I ($650 to $700K) Franchise Expect 100 Reimages Majority Tier I Introduce Tier II and Tier III Designs 31 Estimates based on Company s current outlook Image Activation Expansion Cumulative Image Activation Cap Ex: $440 to 500M (2013 to 2015) 32 Estimates based on Company s current outlook 16
17 WENDY S LONG-TERM STRATEGIC GROWTH DRIVERS Global Growth System Optimization Financial Management Restaurant Utilization & Daypart Expansion New Restaurant Development Image / Experience Activation North America Same-Store Sales Growth New Restaurant Development Company North America Franchised North America International At least 20 new restaurants 50 reimages (Image Activation) 40 new restaurants 50 franchised and JV restaurants 34 17
18 WENDY S LONG-TERM STRATEGIC GROWTH DRIVERS Global Growth System Optimization Financial Management Restaurant Utilization & Daypart Expansion New Restaurant Development Image / Experience Activation North America Same-Store Sales Growth 35 System Optimization to Yield Multiple Benefits; Strengthen Overall System Existing Company- Owned Footprint In-market concentration Restaurant performance High-quality operators Strong, more concentrated franchise platforms Ability to image activate Strong Franchise Base Optimal System Long-Term System Needs Optimal franchise mix to maximize value 36 18


19 WENDY S LONG-TERM STRATEGIC GROWTH DRIVERS Global Growth System Optimization Financial Management Restaurant Utilization & Daypart Expansion New Restaurant Development Image / Experience Activation North America Same-Store Sales Growth 37 A reliable and predictable experience every time! 38 19


20 TM 39 My Wendy s: A Culture of Service 70% 69% Pays off in Customer Loyalty Complaints, Problems and Revisit Intent Scores 64% 58% 48% 49% Not Implemented 40 North America Company-operated restaurants Months implemented 20


21 Customer Service Scores Improving in 2012 North America Company-operated restaurants 41 Heightened Restaurant-Level Execution Drives Sales Complaint, Problem and Revisit Intent Score Improvement Correlates to Sales Growth Every additional 10 points of CPR correlates to $46,000 in additional sales. 42 North America Company-operated restaurants 21


22 PRODUCT HIGH PERCEIVED QUALITY CORE Play a Different Game DESTINATION ONLY AT WENDY S LTO SPECIAL TASTE


23 PROMOTION MESSAGE MEDIA CREATIVE Building Equity and Relevance with a Two-Tiered Advertising Campaign Brand Promise Brand Offering Family values Quality / Fresh Better choices New products 46 23


24 Encouraging Consumer Response to Advertising Campaign Source: Ameritest Overall Best QSR 154 Fresh Ingredients 168 High Quality to 120 average range 47 Mobile App is Increasing Consumer Engagement My Wendy s App 26,000 users since July 16 launch Time spent on app 3x longer than website 48 24


25 Wendy s Recognized for Progress in Digital Ranked #2 in QSR Social Media by Nation s Restaurant News July 10, 2012 More than 100,000 twitter followers 49 Wendy s Share is Underdeveloped in Hispanic Market Non-Hispanic Hispanic Hamburger Category = 21% = 13% Of Traffic Of Traffic Source: NPD Group / CREST Hispanic Study,


26 WENDY S LONG-TERM STRATEGIC GROWTH DRIVERS Global Growth System Optimization Financial Management Restaurant Utilization & Daypart Expansion New Restaurant Development Image / Experience Activation North America Same-Store Sales Growth 51 LATE NIGHT MARKETING SUPPORT 52 26


27 LATE NIGHT BUSINESS IS GROWING +7% NATIONALLY Data based on Late Night launch 5/28/12 through 8/5/12 compared to same weeks in Refining A.M. Access Wendy s remains committed to a long-term solution 54 27


28 Redhead Roasters Campaign Launched in NYC Redhead Roasters launched in 185 NYC restaurants during July Marketing support across non-traditional channels: Free coffee promotion Mobile Sweepstakes Mobile Website POP & Store Wraps NASDAQ Billboards Digital Ads Radio Print Drops Sampling Truck 55 RECIPE TO WIN PEOPLE 5-Star Athletes PRICE New QSR Quality at QSR Price PRODUCT Play a different game. Superior perceived quality, competitive price. PROMOTION Strategically driven, tactically brilliant PLACE The complete brand experience PERFORMANCE Reliable & predictable every time 56 28
29 JOHN BARKER CHIEF COMMUNICATIONS OFFICER 57 Q&A 29


30 A CUT ABOVE 2012 Oldemark LLC 59 Appendix 60 30
31 Reconciliation of Adjusted EBITDA from Continuing Operations to Net (Loss) Income Attributable to (In Thousands) (Unaudited) Second Quarter Six Months Adjusted EBITDA from continuing operations $ 89,073 $ 89,415 $ 152,954 $ 163,140 (Less) plus: Depreciation and amortization (35,947) (29,842) (68,258) (60,156) Impairment of long-lived assets (3,270) (365) (7,781) (8,262) Costs associated with closed restaurants in other operating expense, net (a) (1,477) - (1,477) - Facilities relocation and other transition costs (9,426) - (14,957) - Transaction related costs (562) (5,039) (1,174) (6,923) Arby's indirect corporate overhead in general and administrative (G&A) - (6,735) - (14,623) SSG purchasing cooperative expense reversal in G&A ,275 Operating profit 38,391 47,434 59,307 75,451 Interest expense (28,002) (28,089) (56,237) (57,531) Loss on early extinguishment of debt (25,195) - (25,195) - Gain on sale of investment, net ,407 - Other income, net , (Loss) income from continuing operations before income taxes and noncontrolling interests (14,166) 19,682 7,446 18,510 Benefit from (provision for) income taxes 8,673 (8,308) 1,795 (7,432) (Loss) income from continuing operations (5,493) 11,374 9,241 11,078 Discontinued operations: Income from discontinued operations, net of income taxes - 3,672-2,559 Loss on disposal of discontinued operations, net of income tax benefit - (3,780) - (3,780) Net loss from discontinued operations - (108) - (1,221) Net (loss) income (5,493) 11,266 9,241 9,857 Net income attributable to noncontrolling interests - - (2,384) - Net (loss) income attributable to (a) Excludes non-cash items included in impairment of long-lived assets $ (5,493) $ 11,266 $ 6,857 $ 9, Reconciliation of Reconciliation Adjusted of Income Income and Adjusted and Earnings per Adjusted Share from Continuing Earnings Operations to Net (Loss) per Income Share from and Earnings per Share from Continuing Operations Attributable to Continuing Operations to Net (Loss) Income and Earnings per Share (In Thousands Except per Share Amounts) Attributable to (Unaudited) Second Quarter Six Months After tax Per share (a) After tax Per share After tax Per share After tax Per share Adjusted income and adjusted earnings per share from continuing operations $ 19,221 $ 0.05 $ 19,016 $ 0.05 $ 22,568 $ 0.06 $ 28,292 $ 0.07 (Less) plus: Loss on early extinguishment of debt (15,621) (0.04) - - (15,621) (0.04) - - Gain on sale of investment, net , Impairment of long-lived assets (2,018) (0.01) (224) (0.00) (4,801) (0.02) (5,073) (0.01) Costs associated with closed restaurants in other operating expense, net (b) (911) (0.00) - - (911) (0.00) - - Facilities relocation and other transition costs (5,817) (0.01) - - (9,246) (0.03) - - Arby's indirect corporate overhead in general and administrative (G&A) - - (4,243) (0.01) - - (9,213) (0.02) Transaction related costs (347) (0.00) (3,175) (0.01) (726) (0.00) (4,361) (0.01) SSG purchasing cooperative expenses in G&A , Total adjustments (24,714) (0.06) (7,642) (0.02) (13,327) (0.04) (17,214) (0.04) (Loss) income from continuing operations and earnings per share (5,493) (0.01) 11, , , Discontinued operations: Income from discontinued operations, net of income taxes - - 3, , Loss on disposal of discontinued operations, net of income tax benefit - - (3,780) (0.01) - - (3,780) (0.01) Net loss from discontinued operations - - (108) (0.00) - - (1,221) (0.01) Net (loss) income (5,493) (0.01) 11, , , Net income attributable to noncontrolling interests (2,384) (0.00) - - Net (loss) income and earnings per share attributable to $ (5,493) $ (0.01) $ 11,266 $ 0.03 $ 6,857 $ 0.02 $ 9,857 $ 0.02 Reported number of shares used to calculate diluted (loss) income per share 389, , , ,415 Plus: Dilutive effect of stock options and restricted shares 1, Adjusted number of shares used to calculate adjusted earnings per share 391, , , ,415 (a) Adjusted earnings per share amounts, for the second quarter of 2012, include the dilutive effect of stock options and restricted shares, which were excluded from the reported (a) number Adjusted of shares earnings used per to share calculate amounts, basic for and the diluted second loss quarter per share, of 2012, as include the impact the dilutive would effect have been anti-dilutive. Included in the appendix is a reconciliation of the number of shares used to of calculate stock options adjusted and restricted earnings shares, per share which amounts. were excluded from the reported number of shares (b) Excludes used to non-cash calculate items basic included and diluted in impairment loss per share, of long-lived as the impact assets would have been anti-dilutive. Included above is a reconciliation of the number of shares used to calculate adjusted earnings 62 31
5/7/2013. First Quarter 2013 Earnings Conference Call. May 8, Oldemark LLC JOHN BARKER. Chief Communications Officer.
 First Quarter 2013 Earnings Conference Call May 8, 2013 2013 Oldemark LLC JOHN BARKER Chief Communications Officer 2013 Oldemark LLC 2 1 Today s Agenda CEO Overview Financial Update Emil Brolick Steve
2013 Oldemark LLC. Third-Quarter 2014 Conference Call November 6, 2014
 2013 Oldemark LLC Third-Quarter 2014 Conference Call November 6, 2014 DAVID POPLAR Vice President Investor Relations 2013 Oldemark LLC 2 Today s Agenda CEO Overview Financial Update Q&A Emil Brolick Todd
DAVID POPLAR. Second-Quarter 2014 Conference Call August 7, Vice President Investor Relations 8/7/2014 7:11:27 AM.
 Second-Quarter 2014 Conference Call August 7, 2014 2013 Oldemark LLC DAVID POPLAR Vice President Investor Relations 2013 Oldemark LLC 2 1 Today s Agenda CEO Overview Financial Update Q&A Emil Brolick Todd
The Wendy s Company Reports Audited Full-Year 2012 Results
 The Wendy s Company Reports Audited Full-Year 2012 Results Fourth-Quarter Adjusted EBITDA Increased 19% to $95.9 Million; Full-Year Adjusted EBITDA Increased 1% to $333.3 Million Positive Momentum from
THE WENDY S COMPANY REPORTS STRONG 2013 THIRD-QUARTER RESULTS, RAISES EARNINGS OUTLOOK FOR 2013 COMPANY REPORTS 3Q SAME-STORE SALES INCREASE OF 3.
 THE WENDY S COMPANY REPORTS STRONG 2013 THIRD-QUARTER RESULTS, RAISES EARNINGS OUTLOOK FOR 2013 COMPANY REPORTS 3Q SAME-STORE SALES INCREASE OF 3.2% ADJUSTED EBITDA INCREASES 17% ADJUSTED EPS INCREASES
BRAND TRANSFORMATION MOMENTUM CONTINUES COMPANY NOW EXPECTS TO COMPLETE SYSTEM OPTIMIZATION INITIATIVE DURING FIRST QUARTER
 THE WENDY S COMPANY REPORTS FINAL 2013 RESULTS; REAFFIRMS 2014 OUTLOOK FULL-YEAR ADJUSTED EBITDA INCREASED 10% TO $367.1 MILLION FULL-YEAR ADJUSTED EARNINGS PER SHARE INCREASED 76% TO $0.30 BRAND TRANSFORMATION
First Quarter 2018 Conference Call
 First Quarter 2018 Conference Call May 9, 2018 Quality Is Our Recipe, LLC Greg Lemenchick Director Investor Relations Quality Is Our Recipe, LLC 1 This presentation, and certain information that management
THE WENDY S COMPANY REPORTS FIRST-QUARTER 2014 RESULTS COMPANY-OPERATED SAME-RESTAURANT SALES INCREASE 1.3%
 THE WENDY S COMPANY REPORTS FIRST-QUARTER 2014 RESULTS COMPANY-OPERATED SAME-RESTAURANT SALES INCREASE 1.3% ADJUSTED EBITDA INCREASES 13% TO $87.3 MILLION; ADJUSTED EPS INCREASES FROM $0.03 TO $0.07 IMAGE
THE WENDY S COMPANY REPORTS SECOND QUARTER 2018 RESULTS. North America same-restaurant sales increase 1.9% (+5.1% on a two-year basis)
") THE WENDY S COMPANY REPORTS SECOND QUARTER 2018 RESULTS North America same-restaurant sales increase 1.9% (+5.1% on a two-year basis) 22nd consecutive quarter of positive same-restaurant sales 36 global
THE WENDY S COMPANY REPORTS SECOND QUARTER 2018 RESULTS North America same-restaurant sales increase 1.9% (+5.1% on a two-year basis) 22nd consecutive quarter of positive same-restaurant sales 36 global
Fourth Quarter 2018 Results Presentation. January 31, 2019
 Fourth Quarter 2018 Results Presentation January 31, 2019 1 Cautionary Statement on Forward-Looking Statements & Non-GAAP Measures This presentation contains forward-looking statements within the meaning
THE WENDY S COMPANY REPORTS PRELIMINARY 2016 RESULTS; ANNOUNCES 2017 OUTLOOK AND UPDATES 2020 GOALS
 THE WENDY S COMPANY REPORTS PRELIMINARY 2016 RESULTS; ANNOUNCES 2017 OUTLOOK AND UPDATES 2020 GOALS 16th consecutive quarter of positive same-restaurant sales; North America system same-restaurant sales
THE WENDY S COMPANY REPORTS SECOND QUARTER 2017 RESULTS
 THE WENDY S COMPANY REPORTS SECOND QUARTER 2017 RESULTS North America same-restaurant sales increase 3.2% (+3.6% on a two-year basis); 18th consecutive quarter of positive same-restaurant sales 35 global
Fourth Quarter & Full Year 2017 Results Presentation. February 8, 2018
 Fourth Quarter & Full Year 2017 Results Presentation February 8, 2018 1 Cautionary Statement on Forward-Looking Statements & Non-GAAP Measures This presentation contains forward-looking statements within
BOB EVANS REPORTS FISCAL 2015 FOURTH-QUARTER AND FULL-YEAR RESULTS; PROVIDES FISCAL YEAR 2016 OUTLOOK
 BOB EVANS REPORTS FISCAL FOURTH-QUARTER AND FULL-YEAR RESULTS; PROVIDES FISCAL YEAR 2016 OUTLOOK Q4 net sales total $332.4 million, an increase of $6.0 million, or 1.8 percent. GAAP net income of $0.24
Del Taco Restaurants, Inc. (Exact name of registrant as specified in its charter)
") UNITED STATES SECURITIES AND EXCHANGE COMMISSION WASHINGTON, DC 20549 FORM 8-K CURRENT REPORT Pursuant to Section 13 or 15(d) of the Securities Exchange Act of 1934 Date of Report (Date of earliest event
UNITED STATES SECURITIES AND EXCHANGE COMMISSION WASHINGTON, DC 20549 FORM 8-K CURRENT REPORT Pursuant to Section 13 or 15(d) of the Securities Exchange Act of 1934 Date of Report (Date of earliest event
Second Quarter 2017 Results
 Second Quarter 2017 Results August 9, 2017 Safe Harbor Statement The Private Securities Litigation Reform Act of 1995, as amended, (the Act ) provides protection from liability in private lawsuits for
THE WENDY S COMPANY REPORTS PRELIMINARY 2017 RESULTS; ANNOUNCES 2018 OUTLOOK AND UPDATES 2020 GOALS
 THE WENDY S COMPANY REPORTS PRELIMINARY 2017 RESULTS; ANNOUNCES 2018 OUTLOOK AND UPDATES 2020 GOALS North America same-restaurant sales increase 1.3% in 4Q and 2.0% in 2017; 20th consecutive quarter of
Jack in the Box Inc. Reports Second Quarter FY 2014 Earnings; Updates Guidance for FY 2014
 Investor Contact: Carol DiRaimo, (858) 571-2407 FOR IMMEDIATE RELEASE Media Contact: Brian Luscomb, (858) 571-2291 Reports Second Quarter FY Earnings; Updates Guidance for FY SAN DIEGO, May 14, (NASDAQ:
Jack in the Box Inc. Reports First Quarter FY 2015 Earnings; Updates Guidance for FY 2015
 Investor Contact: Carol DiRaimo, (858) 571-2407 FOR IMMEDIATE RELEASE Media Contact: Brian Luscomb, (858) 571-2291 Jack in the Box Inc. Reports First Quarter FY 2015 Earnings; Updates Guidance for FY 2015
Dine Brands Global, Inc. Investor Presentation March 2019
 Dine Brands Global, Inc. Investor Presentation March 2019 Disclosures Forward-Looking Information: The content contained in this presentation is as of March 5, 2019. The Company assumes no obligation to
First Quarter 2018 Results Presentation. May 2, 2018
 First Quarter 2018 Results Presentation May 2, 2018 1 Cautionary Statement on Forward-Looking Statements & Non-GAAP Measures This presentation contains forward-looking statements within the meaning of
THIRD QUARTER 2018 EARNINGS CALL //// OCTOBER 30, 2018
 ACOUSTICS THIRD QUARTER 2018 EARNINGS CALL //// OCTOBER 30, 2018 Brian Kobylinski, Chief Executive Officer Chad Paris, Chief Financial Officer Rachel Zabkowicz, Vice President, Investor Relations DISCLAIMER
Investor Presentation
 Investor Presentation Cautionary Note Regarding Forward-Looking Statements This presentation contains forward-looking information, including the Company s statements regarding its future outlook. In addition,
Horizon Global Third Quarter 2017 Earnings Presentation
 Horizon Global Third Quarter 2017 Earnings Presentation October 31, 2017 Q1 2016 Earnings 1 Safe Harbor Statement Forward-Looking Statements This presentation may contain "forward-looking statements" as
Del Taco Restaurants, Inc. Reports Fiscal Fourth Quarter and Fiscal Year 2017 Financial Results
 NEWS RELEASE Del Taco Restaurants, Inc. Reports Fiscal Fourth Quarter and Fiscal Year 2017 Financial Results 3/14/2018 System-wide comparable restaurant sales growth of 2.4% in Fiscal Fourth Quarter Announces
Jack in the Box Inc. Reports Third Quarter FY 2015 Earnings; Updates Guidance for FY 2015; Declares Quarterly Cash Dividend
 Investor Contact: Carol DiRaimo, (858) 571-2407 FOR IMMEDIATE RELEASE Media Contact: Brian Luscomb, (858) 571-2291 Reports Third Quarter FY Earnings; Updates Guidance for FY ; Declares Quarterly Cash Dividend
FOR IMMEDIATE RELEASE. Investor Contact: Carol DiRaimo, (858) Media Contact: Brian Luscomb, (858)
 Media Contact: Brian Luscomb, (858)") Investor Contact: Carol DiRaimo, (858) 571-2407 FOR IMMEDIATE RELEASE Media Contact: Brian Luscomb, (858) 571-2291 Jack in the Box Inc. Reports Second Quarter FY Earnings; Updates Guidance for FY ; Declares
Investor Contact: Carol DiRaimo, (858) 571-2407 FOR IMMEDIATE RELEASE Media Contact: Brian Luscomb, (858) 571-2291 Jack in the Box Inc. Reports Second Quarter FY Earnings; Updates Guidance for FY ; Declares
Del Taco Restaurants, Inc. (Exact name of registrant as specified in its charter)
") UNITED STATES SECURITIES AND EXCHANGE COMMISSION WASHINGTON, DC 20549 FORM 8-K CURRENT REPORT Pursuant to Section 13 or 15(d) of the Securities Exchange Act of 1934 Date of Report (Date of earliest event
UNITED STATES SECURITIES AND EXCHANGE COMMISSION WASHINGTON, DC 20549 FORM 8-K CURRENT REPORT Pursuant to Section 13 or 15(d) of the Securities Exchange Act of 1934 Date of Report (Date of earliest event
Jack in the Box Inc. Reports First Quarter FY 2013 Earnings; Updates Guidance for FY 2013
 Investor Contact: Carol DiRaimo, (858) 571-2407 FOR IMMEDIATE RELEASE Media Contact: Brian Luscomb, (858) 571-2291 Reports First Quarter FY 2013 Earnings; Updates Guidance for FY 2013 SAN DIEGO, February
ENTERCOM COMMUNICATIONS CORP. REPORTS FIRST QUARTER RESULTS
 For Immediate Release May 8, 2018 Contacts: Joseph Jaffoni, Jennifer Neuman, Norberto Aja JCIR (212) 835-8500 etm@jcir.com ENTERCOM COMMUNICATIONS CORP. REPORTS FIRST QUARTER RESULTS Philadelphia, PA Entercom
Company raises fiscal year 2016 non-gaap diluted EPS guidance range from $1.85 to $2.00, to $1.90 to $2.00
 BOB EVANS REPORTS FISCAL 2016 THIRD-QUARTER RESULTS Q3 2016 net sales total $346.5 million. GAAP and non-gaap net income (1) of $0.62 per diluted share, represents an increase of 148 percent and 3 percent,
2Q17 EARNINGS PRESENTATION NYSE: DOOR
 2Q17 EARNINGS PRESENTATION NYSE: DOOR Safe Harbor / Non-GAAP Financial Measures SAFE HARBOR / FORWARD LOOKING STATEMENT This investor presentation contains forward-looking information and other forward-looking
Jacky Lo Chief Finance Officer, Yum China
 Jacky Lo Chief Finance Officer, Yum China Cautionary Language Regarding Forward-Looking Statements Forward-Looking Statements. Our presentation may contain forward-looking statements within the meaning
1Q17 EARNINGS PRESENTATION NYSE: DOOR
 1Q17 EARNINGS PRESENTATION NYSE: DOOR Safe Harbor / Non-GAAP Financial Measures SAFE HARBOR / FORWARD LOOKING STATEMENT This investor presentation contains forward-looking information and other forward-looking
4Q18 EARNINGS. February NASDAQ: GRPN /
 4Q18 EARNINGS February 2019 NASDAQ: GRPN / ir@groupon.com Forward-Looking Statements The statements contained in this release that refer to plans and expectations for the next quarter, the full year or
For additional information contact: DRG&L / Ken Dennard / Sheila Stuewe Investor Relations FOR IMMEDIATE RELEASE
 FOR IMMEDIATE RELEASE For additional information contact: DRG&L / 713-529-6600 Ken Dennard / Sheila Stuewe Investor Relations Luby s Reports Fiscal Fourth Quarter and Full Year Results ~ Store Level Profit
Jack in the Box Inc. Reports Third Quarter FY 2017 Earnings; Updates Guidance for FY 2017; Declares Quarterly Cash Dividend
 Investor Contact: Carol DiRaimo, (858) 571-2407 FOR IMMEDIATE RELEASE Media Contact: Brian Luscomb, (858) 571-2291 Jack in the Box Inc. Reports Third Quarter FY Earnings; Updates Guidance for FY ; Declares
Luby s Reports Third Quarter Fiscal 2011 Results
 For additional information contact: FOR IMMEDIATE RELEASE DRG&L / 713-529-6600 Ken Dennard / Sheila Stuewe Investor Relations Luby s Reports Third Quarter Fiscal 2011 Results HOUSTON, TX June 8, 2011 Luby
PAPA JOHN S ANNOUNCES FIRST QUARTER 2017 RESULTS
 PAPA JOHN S ANNOUNCES FIRST QUARTER 2017 RESULTS Louisville, Kentucky (May 2, 2017) Papa John s International, Inc. (NASDAQ: PZZA) today announced financial results for the first quarter ended March 26,
JACK IN THE BOX INC. ICR CONFERENCE JANUARY 9, 2018
 JACK IN THE BOX INC. ICR CONFERENCE JANUARY 9, 2018 JACK IN THE BOX INC. SAFE HARBOR STATEMENT This presentation includes plans and estimates for the future, which are subject to various risks and uncertainties
FORM 8-K EL POLLO LOCO HOLDINGS, INC.
 UNITED STATES SECURITIES AND EXCHANGE COMMISSION Washington, D.C. 20549 FORM 8-K CURRENT REPORT Pursuant to Section 13 OR 15(d) of The Securities Exchange Act of 1934 Date of Report (Date of earliest event
WEEKS ENDED. Adjusted diluted earnings per share* $ 0.46 $ 0.50 $ (0.04)
") May 9, 2014 Bloomin' Brands, Inc. Announces Fiscal 2014 First Quarter Adjusted Diluted Earnings Per Share of $0.46 and GAAP Diluted Earnings Per Share of $0.42; Reaffirms Full-Year 2014 Guidance Including
May 9, 2014 Bloomin' Brands, Inc. Announces Fiscal 2014 First Quarter Adjusted Diluted Earnings Per Share of $0.46 and GAAP Diluted Earnings Per Share of $0.42; Reaffirms Full-Year 2014 Guidance Including
November 20 th, Company: Sonic Corp. (NASDAQ SONC) Action: Long Price Target: $34.00 Students: Peiheng Xu, Devon Pennington, Elise Radolf
 Action: Long Price Target: $34.00 Students: Peiheng Xu, Devon Pennington, Elise Radolf") November 20 th, 2015 Company: Sonic Corp. (NASDAQ SONC) Action: Long Price Target: $34.00 Students: Peiheng Xu, Devon Pennington, Elise Radolf Long: SONC Company Overview Domestic Drive-in Leader Market
November 20 th, 2015 Company: Sonic Corp. (NASDAQ SONC) Action: Long Price Target: $34.00 Students: Peiheng Xu, Devon Pennington, Elise Radolf Long: SONC Company Overview Domestic Drive-in Leader Market
4Q and Full Year 2016 Earnings Presentation. February 8, 2017
 4Q and Full Year 2016 Earnings Presentation February 8, 2017 Cautionary Language Regarding Forward-Looking Statements & Non-GAAP Measures This presentation contains forward-looking statements within the
THREE MONTHS ENDED MARCH 31, $ Change Diluted earnings per share $ 0.50 $ 0.47 $ 0.03 Adjustments (1) 0.02 (0.02)
 0.02 (0.02)") April 30, 2013 Bloomin' Brands, Inc. Announces First Quarter Adjusted Diluted Earnings Per Pro Forma Share of $0.50 and GAAP Diluted Earnings Per Share of $0.50; Raises Full-Year 2013 Guidance for Adjusted
April 30, 2013 Bloomin' Brands, Inc. Announces First Quarter Adjusted Diluted Earnings Per Pro Forma Share of $0.50 and GAAP Diluted Earnings Per Share of $0.50; Raises Full-Year 2013 Guidance for Adjusted
Third Quarter 2017 Business Update. October 26, 2017
 Third Quarter 2017 Business Update October 26, 2017 Third Quarter 2017 Results (GAAP Basis) $ in millions, except EPS Q3 % of Q3 % of Increase/ 2017 Sales 2016 Sales (Decrease) Net sales $948.2 $901.4
MYERS INDUSTRIES, INC. Third Quarter 2018 Earnings Presentation
 MYERS INDUSTRIES, INC. Third Quarter 2018 Earnings Presentation SAFE HARBOR STATEMENT & NON-GAAP MEASURES Statements in this presentation include forward-looking statements within the meaning of the Private
Q and FY 2016 earnings summary. February 28, 2017 Extended Stay America, Inc. ESH Hospitality, Inc.
 Q4 2016 and FY 2016 earnings summary February 28, 2017 Extended Stay America, Inc. ESH Hospitality, Inc. important disclosure information This presentation contains forward-looking statements within the
Investor Presentation March
 1 Investor Presentation March 2016 Presenters 2 Tim Taft President & Chief Executive Officer President & Chief Executive Officer Lynn Schweinfurth Chief Financial Officer Forward-looking Statements 3 This
Bob Evans Express expects to open three new locations during Q2 2015; up to ten new locations expected for fiscal 2015
 BOB EVANS REPORTS FISCAL 2015 FIRST-QUARTER RESULTS Q1 2015 net sales total $326.3 million, a decline of $3.1 million, or 0.9 percent, compared to prior year first-quarter results. GAAP net loss of $0.04
2018 Second Quarter Financial Results
 2018 Second Quarter Financial Results July 30, 2018 2016 First Data Corporation. All Rights Reserved. Safe Harbor Statements in this presentation regarding First Data Corporation s business which are not
1Q 2017 Earnings Call May 9, :30am ET
 2017 Earnings Call May 9, 2017 8:30am ET 1 Safe Harbor Statement Certain statements made within this presentation contain forward-looking statements, within the meaning of the Private Securities Litigation
FORM 10-Q. THE WENDY S COMPANY (Exact name of registrants as specified in its charter)
") UNITED STATES SECURITIES AND EXCHANGE COMMISSION Washington, D.C. 20549 FORM 10-Q (X) QUARTERLY REPORT PURSUANT TO SECTION 13 OR 15(D) OF THE SECURITIES EXCHANGE ACT OF 1934 For the quarterly period ended
UNITED STATES SECURITIES AND EXCHANGE COMMISSION Washington, D.C. 20549 FORM 10-Q (X) QUARTERLY REPORT PURSUANT TO SECTION 13 OR 15(D) OF THE SECURITIES EXCHANGE ACT OF 1934 For the quarterly period ended
ENTERCOM COMMUNICATIONS CORP. REPORTS FOURTH QUARTER RESULTS AND ANNOUNCES FIRST QUARTER DIVIDEND
 For Immediate Release March 8, 2018 Contact: Richard Schmaeling Executive Vice President and CFO, Entercom (610) 660-5686 Richard.Schmaeling@entercom.com ENTERCOM COMMUNICATIONS CORP. REPORTS FOURTH QUARTER
2Q 2017 Earnings Call August 8, :00pm ET
 2017 Earnings Call August 8, 2017 5:00pm ET 1 Safe Harbor Statement Certain statements made within this presentation contain forward-looking statements, within the meaning of the Private Securities Litigation
CUMULUS MEDIA INC. Cumulus Reports Operating Results for Fourth Quarter and Full Year 2017
 CUMULUS MEDIA INC. Cumulus Reports Operating Results for Fourth Quarter and Full Year 2017 ATLANTA, GA March 28, 2018: Cumulus Media Inc. (PINK: CMLSQ) (the Company, we, us, or our ) today announced operating
Luby s Reports Third Quarter Fiscal 2012 Results ~ Store Level Profit Margin Improved to 17.2% ~
 For Immediate Release For additional information contact: DRG&L / 713-529-6600 Ken Dennard / Sheila Stuewe Investor Relations Luby s Reports Third Quarter Fiscal 2012 Results ~ Store Level Profit Margin
Investor Presentation. January 2017
 Investor Presentation January 2017 Forward-Looking Statements Forward-Looking Statements This presentation contains forward-looking statements that are subject to risks and uncertainties. All statements
Jack in the Box Inc. Reports Second Quarter FY 2015 Earnings; Updates Guidance for FY 2015; Raises Quarterly Cash Dividend by 50%
 Investor Contact: Carol DiRaimo, (858) 571-2407 FOR IMMEDIATE RELEASE Media Contact: Brian Luscomb, (858) 571-2291 Reports Second Quarter FY Earnings; Updates Guidance for FY ; Raises Quarterly Cash Dividend
THIRD QUARTER 2015 EARNINGS WEBCAST NOVEMBER 3, 2015
 THIRD QUARTER 2015 EARNINGS WEBCAST NOVEMBER 3, 2015 Q3 2015 Earnings Webcast Agenda Financial Summary Segment Results Rob Gillette Chief Executive Officer Financial Results Summary Q&A Alan Haughie Chief
Horizon Global First Quarter 2016 Earnings Presentation
 Horizon Global First Quarter 2016 Earnings Presentation May 3, 2016 1 Safe Harbor Statement Forward-Looking Statements This presentation may contain "forward-looking statements" as defined in the Private
Investor Overview Presentation. August 2018
 Investor Overview Presentation August 2018 Forward-Looking Statements Statements about future results made in this presentation constitute forward-looking statements within the meaning of the Private Securities
Dunkin' Brands Reports Fourth Quarter and Fiscal Year 2016 Results
 February 9, 2017 Dunkin' Brands Reports Fourth Quarter and Fiscal Year Results CANTON, Mass., Feb. 9, 2017 /PRNewswire/ -- Fiscal year highlights include: Dunkin' Donuts U.S. comparable store sales growth
MYERS INDUSTRIES, INC. Fourth Quarter & Full Year 2018 Earnings Presentation
 MYERS INDUSTRIES, INC. Fourth Quarter & Full Year 2018 Earnings Presentation SAFE HARBOR STATEMENT & NON-GAAP MEASURES Statements in this presentation include forward-looking statements within the meaning
Popeyes Louisiana Kitchen, Inc. Reports Fiscal 2016 Earnings Results
 February 22, 2017 Reports Fiscal 2016 Earnings Results Completes Credit Facility Expansion ATLANTA--(BUSINESS WIRE)-- (NASDAQ: PLKI), the franchisor and operator of Popeyes restaurants, today reported
Micky Pant CEO, Yum China
 Micky Pant CEO, Yum China Cautionary Language Regarding Forward-Looking Statements Forward-Looking Statements. Our presentation may contain forward-looking statements within the meaning of Section 27A
CRACKER BARREL REPORTS FOURTH QUARTER AND FULL YEAR FISCAL 2012 RESULTS AND PROVIDES GUIDANCE FOR FISCAL 2013
 Investor Contact: Media Contact: Lawrence E. Hyatt (615) 235-4432 Julie K. Davis (615) 443-9266 CRACKER BARREL REPORTS FOURTH QUARTER AND FULL YEAR FISCAL 2012 RESULTS AND PROVIDES GUIDANCE FOR FISCAL
SECOND QUARTER 2017 EARNINGS CALL //// AUGUST 3, 2017
 FINISHING COMPONENTS SEATING ACOUSTICS SECOND QUARTER 2017 EARNINGS CALL //// AUGUST 3, 2017 Brian Kobylinski, Chief Executive Officer Sarah Lauber, Senior Vice President & Chief Financial Officer Chad
Dean Foods. May 2015
 Dean Foods May 2015 1 Forward-Looking Statements Some of the statements made in this presentation are forward-looking and are made pursuant to the safe harbor provision of the Private Securities Litigation
GigaMedia Announces Third-Quarter 2018 Financial Results
 Exhibit 99.1 FOR IMMEDIATE RELEASE For further information contact: Investor Relations Department Country/City Code 8862 Tel: 2656-8096 IR@gigamedia.com.tw GigaMedia Announces Third-Quarter 2018 Financial
4Q17 EARNINGS PRESENTATION NYSE: DOOR
 4Q17 EARNINGS PRESENTATION NYSE: DOOR Safe Harbor / Non-GAAP Financial Measures SAFE HARBOR / FORWARD LOOKING STATEMENT This investor presentation contains forward-looking information and other forward-looking
GigaMedia Announces Fourth-Quarter and Full Year 2017 Financial Results
 Exhibit 99.1 FOR IMMEDIATE RELEASE For further information contact: Investor Relations Department Country/City Code 8862 Tel: 2656-8096 IR@gigamedia.com.tw GigaMedia Announces Fourth-Quarter and Full Year
4 TH QUARTER AND FULL YEAR 2012 RESULTS
 4 TH QUARTER AND FULL YEAR 2012 RESULTS CONFERENCE CALL & WEBCAST FEBRUARY 11, 2013 5:00 PM ET NYSE: NLSN SAFE HARBOR FOR FORWARD-LOOKING STATEMENTS The following discussion contains forward-looking statements,
GigaMedia Announces Second-Quarter 2017 Financial Results
 FOR IMMEDIATE RELEASE For further information contact: Annie Sun Investor Relations Department Country/City Code 8862 Tel: 2656-8096 IR@gigamedia.com.tw GigaMedia Announces Second-Quarter 2017 Financial
Q Financial Results. May 8, 2018
 Q1 2018 Financial Results May 8, 2018 Safe Harbor Some of the statements contained in this presentation and the Company s May 9, 2018 earnings conference call may constitute forward-looking statements
Cautionary Statement Regarding Forward-Looking Statements
 January 2018 Cautionary Statement Regarding Forward-Looking Statements Forward Looking Statements: Certain statements are forward-looking statements made pursuant to the safe harbor provisions of the Private
Rent-A-Center today is
 INVESTOR PRESENTATION FIRST QUARTER 2014 Safe Harbor This presentation contains forward-looking statements that involve risks and uncertainties. Such forward-looking statements generally can be identified
Luby s Reports Fourth Quarter Fiscal 2011 Results
 For additional information contact: FOR IMMEDIATE RELEASE DRG&L / 713-529-6600 Ken Dennard / Sheila Stuewe Investor Relations Luby s Reports Fourth Quarter Fiscal Results HOUSTON, TX November 9, Luby s,
Luby s Reports First Quarter Fiscal 2011 Results ~ Same Store Sales Rise 5.5% ~
 For additional information contact: FOR IMMEDIATE RELEASE DRG&L / 713-529-6600 Ken Dennard / Sheila Stuewe Investor Relations Luby s Reports First Quarter Fiscal 2011 Results ~ Same Store Sales Rise 5.5%
Fourth Quarter and Full Year Earnings Call March 1, 2019
 Fourth Quarter and Full Year Earnings Call March 1, 2019 Safe Harbor & Non-GAAP Financial Measures Cautionary Notice Statements in this news release and the schedules hereto that are not purely historical
MDC PARTNERS INC. REPORTS RESULTS FOR THE THREE AND NINE MONTHS ENDED SEPTEMBER 30, 2017
 PRESS RELEASE FOR IMMEDIATE ISSUE FOR: MDC Partners Inc. CONTACT: Matt Chesler, CFA 745 Fifth Avenue, 19 th Floor VP, Investor Relations and Finance New York, NY 10151 646-412-6877 mchesler@mdc-partners.com
THIRD QUARTER 2016 EARNINGS CALL //// NOVEMBER 4, 2016
 SEATING FINISHING ACOUSTICS COMPONENTS THIRD QUARTER 2016 EARNINGS CALL //// NOVEMBER 4, 2016 Jeffry Quinn, Chairman & Chief Executive Officer Sarah Lauber, Senior Vice President & Chief Financial Officer
Luby s Reports Fourth Quarter and Fiscal 2015 Results
 For additional information contact: FOR IMMEDIATE RELEASE Dennard-Lascar Associates 713-529-6600 Rick Black / Ken Dennard Investor Relations Luby s Reports Fourth Quarter and Fiscal Results HOUSTON, TX
FORM 10-Q. THE WENDY S COMPANY (Exact name of registrants as specified in its charter)
") UNITED STATES SECURITIES AND EXCHANGE COMMISSION Washington, D.C. 20549 FORM 10-Q (X) QUARTERLY REPORT PURSUANT TO SECTION 13 OR 15(d) OF THE SECURITIES EXCHANGE ACT OF 1934 For the quarterly period ended
UNITED STATES SECURITIES AND EXCHANGE COMMISSION Washington, D.C. 20549 FORM 10-Q (X) QUARTERLY REPORT PURSUANT TO SECTION 13 OR 15(d) OF THE SECURITIES EXCHANGE ACT OF 1934 For the quarterly period ended
Fourth Quarter 2017 Business Update. February 27, 2018
 Fourth Quarter 2017 Business Update February 27, 2018 Fourth Quarter 2017 Results (GAAP Basis) $ in millions, except EPS Q4 % of Q4 % of 2017 Sales 2016 Sales Increase / (Decrease) Net sales $1,027 $934
GigaMedia Announces Third-Quarter 2017 Financial Results
 Exhibit 99.1 FOR IMMEDIATE RELEASE For further information contact: Annie Sun Investor Relations Department Country/City Code 8862 Tel: 2656-8096 IR@gigamedia.com.tw GigaMedia Announces Third-Quarter 2017
Investor Presentation
 Investor Presentation Cautionary Note Regarding Forward-Looking Statements This presentation contains forward-looking information, including the Company s statements regarding its future outlook. In addition,
Masonite International Corporation Reports 2016 Second Quarter Results
 Masonite International Corporation Reports 2016 Second Quarter Results 8/10/2016 TAMPA, Fla.--(BUSINESS WIRE)-- Masonite International Corporation ("Masonite" or "the Company") (NYSE: DOOR) today announced
Noodles & Company Announces Third Quarter 2018 Financial Results
 Announces Third Quarter Financial Results October 23, BROOMFIELD, Colo., Oct. 23, (GLOBE NEWSWIRE) -- (Nasdaq: NDLS) today announced financial results for its third quarter ended. Key highlights for the
Q Earnings Report. Sabre Corporation August 4, 2015
 Q2 2015 Earnings Report Sabre Corporation August 4, 2015 1 Forward-looking Statements Forward Looking Statements Certain statements herein are forward-looking statements about trends, future events, uncertainties
3 rd Quarter 2018 Earnings Release Conference Call
 3 rd Quarter 2018 Earnings Release Conference Call October 31, 2018 1 2018 Belden Inc. belden.com @beldeninc Safe Harbor Statement Our commentary and responses to your questions may contain forward-looking
ICR XChange Conference. January 16, 2013
 ICR XChange Conference January 16, 2013 0 Safe Harbor Statement Certain statements made in this presentation that reflect management s expectations regarding future events and economic performance are
AFC Enterprises Reports Financial Results for Third Quarter 2010; Raises Fiscal 2010 Earnings Guidance
 November 10, 2010 AFC Enterprises Reports Financial Results for Third Quarter 2010; Raises Fiscal 2010 Earnings Guidance ATLANTA--(BUSINESS WIRE)-- AFC Enterprises, Inc. (NASDAQ: AFCE), the franchisor
CUMULUS MEDIA Reports Operating Results for Fourth Quarter and Full Year 2018
 CUMULUS MEDIA Reports Operating Results for Fourth Quarter and Full Year 2018 Reports Q4 Net Revenue Growth of 5.2% and Adjusted EBITDA Growth of 31.6% Reports Full Year Revenue Growth of 0.4% and Adjusted
Dunkin' Brands Reports Third Quarter 2013 Results
 October 24, Dunkin' Brands Reports Third Quarter Results CANTON, Mass., Oct. 24, /PRNewswire/ -- Third quarter highlights include: Dunkin' Donuts U.S. comparable store sales growth of 4.2% Added 222 net
Investor Deck. March, 2018 NASDAQ: BURG NASDAQ: BURG 1
 Investor Deck March, 2018 NASDAQ: BURG NASDAQ: BURG 1 This Is Our Story Chanticleer Holdings was formed and went public in June 2005 as a BDC (investment company) led by CEO Mike Pruitt and two financial
Luby s Reports Third Quarter Fiscal 2016 Results
 For additional information contact: FOR IMMEDIATE RELEASE Dennard-Lascar Associates Rick Black / Ken Dennard Investor Relations 713-529-6600 Luby s Reports Third Quarter Fiscal Results Luby s Cafeterias
Del Taco Restaurants, Inc. (Exact name of registrant as specified in its charter)
") UNITED STATES SECURITIES AND EXCHANGE COMMISSION WASHINGTON, DC 20549 FORM 8-K CURRENT REPORT Pursuant to Section 13 or 15(d) of the Securities Exchange Act of 1934 Date of Report (Date of earliest event
UNITED STATES SECURITIES AND EXCHANGE COMMISSION WASHINGTON, DC 20549 FORM 8-K CURRENT REPORT Pursuant to Section 13 or 15(d) of the Securities Exchange Act of 1934 Date of Report (Date of earliest event
3 RD QUARTER 2013 RESULTS CONFERENCE CALL & WEBCAST
 3 RD QUARTER 2013 RESULTS CONFERENCE CALL & WEBCAST OCTOBER 23, 2013 8:30AM ET / 2:30PM CET NYSE: NLSN SAFE HARBOR FOR FORWARD-LOOKING STATEMENTS The following discussion contains forward-looking statements,
Dunkin Brands Group, Inc.
 Dunkin Brands Group, Inc. Investor Presentation Jefferies Consumer Conference Nigel Travis Chairman & CEO 1 Forward-Looking Statements Certain information contained in this presentation, particularly information