Investor Presentation March
|
|
|
- Aron Carr
- 5 years ago
- Views:
Transcription
1 1 Investor Presentation March 2016
2 Presenters 2 Tim Taft President & Chief Executive Officer President & Chief Executive Officer Lynn Schweinfurth Chief Financial Officer
3 Forward-looking Statements 3 This document and our presentation contain forward-looking statements within the meaning of Section 27A of the Securities Act of 1933, as amended, and Section 21E of the Securities Exchange Act of 1934, as amended and are intended to be covered by the safe harbor created by those sections. All statements, other than statements of historical facts included herein, including, without limitation, statements regarding our future financial position and results of operations, business strategy, budgets, projected costs and plans and objectives of management for future operations, are forward-looking statements. Forward-looking statements generally can be identified by the use of forward-looking terminology such as may, will, expect, anticipate, intend, plan, believe, seek, estimate or continue or the negative of such words or variations of such words and similar expressions. These statements are not guarantees of future performance and involve certain risks, uncertainties and assumptions, which are difficult to predict. Therefore, actual outcomes and results may differ materially from what is expressed or forecasted in such forward-looking statements and we can give no assurance that such forward-looking statements will prove to be correct. Important factors that could cause actual results to differ materially from those expressed or implied by the forward-looking statements, or cautionary statements, include, but are not limited to: increases in food and other commodity costs; risks associated with the expansion of our business; our ability to manage our growth and successfully implement our business strategy; general economic conditions, particularly in the retail sector; competitive conditions; weather conditions; fuel prices; significant disruptions in service or supply by any of our suppliers or distributors; changes in consumer perception of dietary health and food safety; labor and employment benefit costs; regulatory factors; the outcome of pending or future legal claims or proceedings; environmental conditions and regulations; our borrowing costs; the availability and terms of necessary or desirable financing or refinancing and other related risks and uncertainties; the risk of an act of terrorism or escalation of any insurrection or armed conflict involving the United States or any other national or international calamity; factors that affect the restaurant industry generally, including product recalls, liability if our products cause injury, ingredient disclosure and labeling laws and regulations, reports of cases of food-borne illnesses such as mad cow disease and avian flu, and the possibility that consumers could lose confidence in the safety and quality of certain food products, as well as negative publicity regarding food quality, illness, injury or other health concerns.
4 4 Strategic & Operational Overview
5 Investment Considerations 5 What you want to know Compelling Business Model Two Leading, Differentiated Brands Accelerating Development Given Significant Potential Well Positioned Within the Growing Fast-Casual Segment Proven Financial Results


6 Recent Development 6 Announced Intention to Separate Pollo Tropical and Taco Cabana Businesses Two Standalone Companies with Dedicated Strategy and Execution Eventually Build Two Fully Independent Management Teams Tax-efficient Distribution of 100% of TC s Stock to Fiesta s Shareholder Expected Completion in 2017 or 2018
7 Long-term Business Model 7 8%-10% Company Restaurant Growth Meaningful EPS Growth 2%-3% SSS Growth Margin Expansion 10%-12% Revenue Growth

8 Industry-leading AUVs 8 FY 2015, Average Annual Sales at Company-owned Restaurants $2.6 $2.6 $2.4 $1.9 $1.6 $1.2 $1.1 $1.0 $s in millions. Sources: company filings.


9 Industry-leading AUVs 9 AUV Growth CAGR = 4.7% AUV Growth CAGR = 3.5% $2.3 $2.5 $2.7 $2.7 $2.6 $1.7 $1.8 $1.8 $1.8 $1.9 $2.1 $
10 Compelling Restaurant-level EBITDA % 24.8% FY 2015, % of Restaurant Sales 21.1% 19.4% 19.0% 16.6% 16.3% 16.2% Restaurant-level EBITDA is defined as restaurant sales minus cost of sales, labor, occupancy, other operating and advertising expenses. Pre-opening cost is excluded from the calculation. Sources: company filings

11 Restaurant Growth Potential 11 1,972 1, FY 2015, Number of System-wide Restaurants in U.S Unit 3,200 4,500 2,000 N/A 2,500 N/A N/A N/A N/A 1,600 Potential % of Unit 62% 44% 32% N/A 20% N/A N/A N/A N/A 10% Potential Sources: Domestic system wide unit counts for competitors as of the most recent filings.

12 12
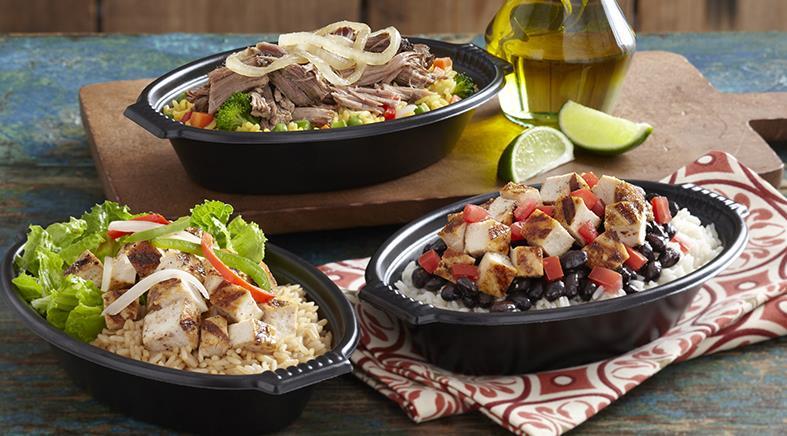
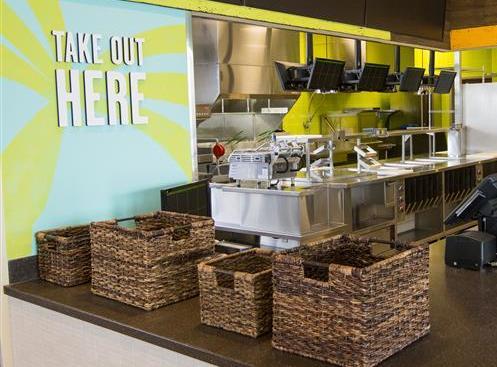
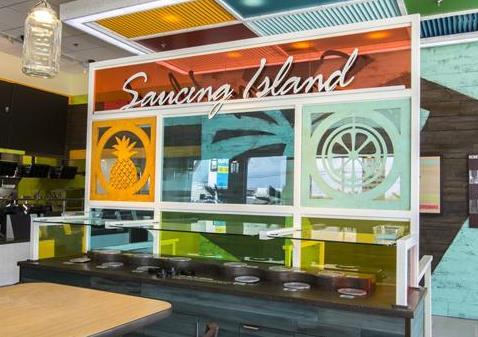
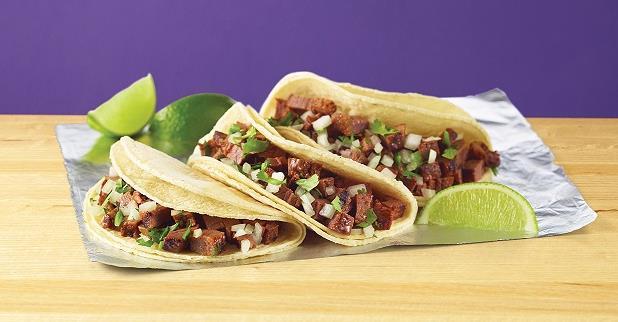
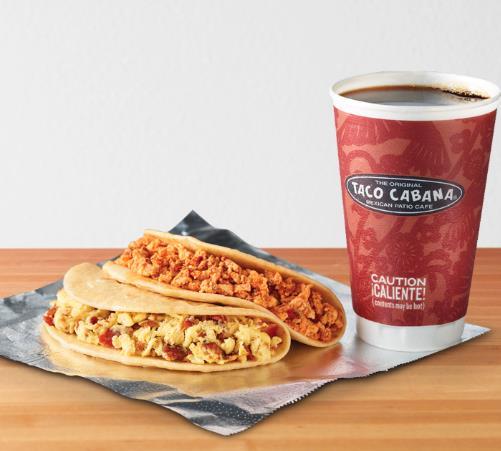
13 A Unique and Extraordinary Brand 13 Freshly prepared Caribbean-inspired food you feel good about eating. A 28 year old brand originating in South Florida Truly differentiated restaurant concept with no direct competitor Signature offerings: fresh, grilled bone-in chicken marinated with tropical fruit juices and spices, rice and beans Additional proteins, side dishes, salads and wraps further broaden target audience Rum punch and Caribbean beer Self service Saucing Island includes made from scratch salsas and sauces Significant restaurant growth potential Best-in-class restaurant economics Attractive value proposition - great quality food with an average check of ~ $10 Convenience with dine-in, take out and drive-thru Catering growth is a meaningful opportunity
14 Restaurant Sales Growth and Margin Trends 14 SSS Growth Restaurant-level EBITDA Margin (% of Restaurant Sales) 8.1% 26.3% 6.6% 5.9% 25.6% 25.9% 24.8% 3.8%


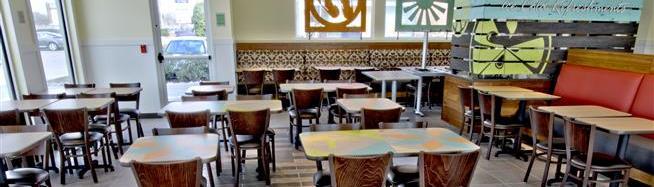
15 Freshly Prepared, Caribbean-inspired Menu 15

16 Our Differentiated Restaurant Growth Vehicle 16 New Prototype Introduced in Texas in March 2014


17 Our Differentiated Restaurant Growth Vehicle 17

18 Accelerating Growth and National Potential Company New Short-term Non-traditional Market Share & 35 Franchise Company Southern Focus; U.S. Licensing Growth with Restaurants Restaurants in Long-term Opportunities Planned 2016, or 23% National Cannibalization Brand Potential Restaurant Growth


19 Accelerating Growth and National Potential 19 Current U.S. Footprint New Company-Owned Restaurants Opened 23/ 0 11 / / E Where two numbers appear on the map, the first represents company-owned restaurants and the second represents franchised and licensed restaurants.
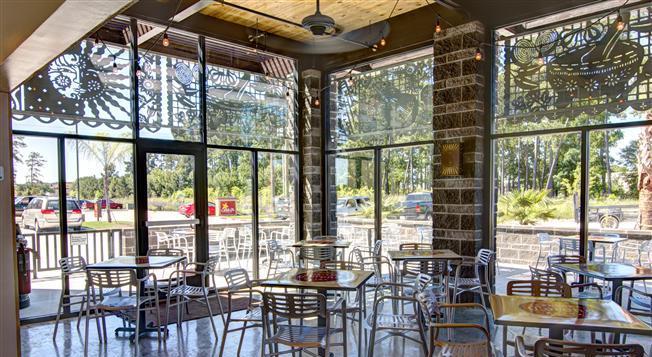
20 Development Strategy 20 CORE SOUTH FLORIDA MARKETS SUPERIOR BRAND AWARENESS Miami-Dade, Broward, & Palm Beach Counties Exceptional financial performance OTHER FLORIDA MARKETS DRIVING TRAFFIC GROWTH WITH MEDIA Orlando, Naples/Fort Myers, Tampa, Jacksonville & Nashville Driving higher brand awareness through new development and media strategies At scale to drive meaningful sales growth with media EMERGING MARKETS LOW BRAND AWARENESS, NOT ON BROADCAST MEDIA Dallas, Houston, San Antonio & Atlanta Robust development pipeline in Texas; build out Atlanta over time as trade areas develop Atlanta to begin broadcast media by 4Q 2016, San Antonio started media in mid- February


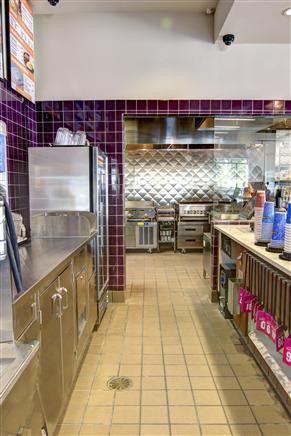
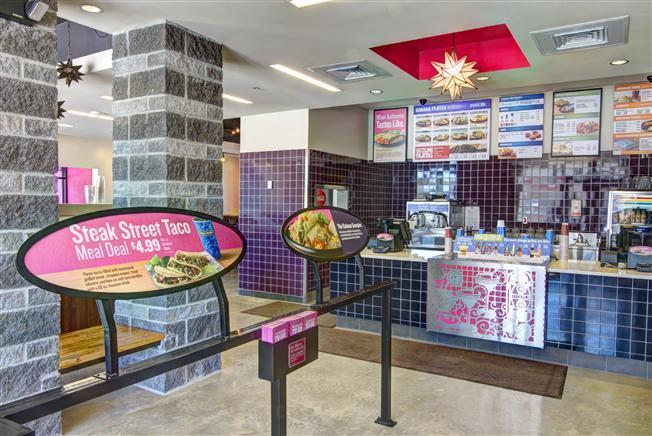
21 Reimaging Program Initiated in Former Reimaged
22 22
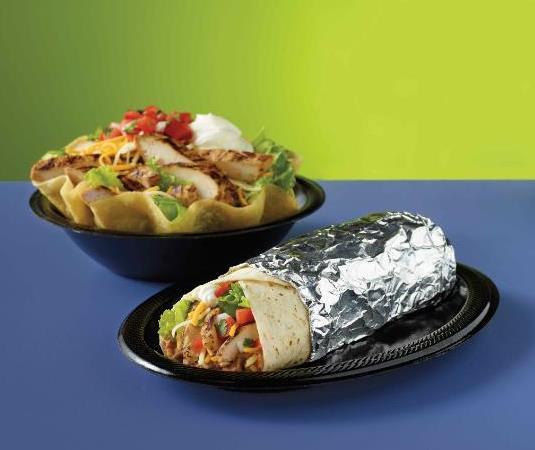
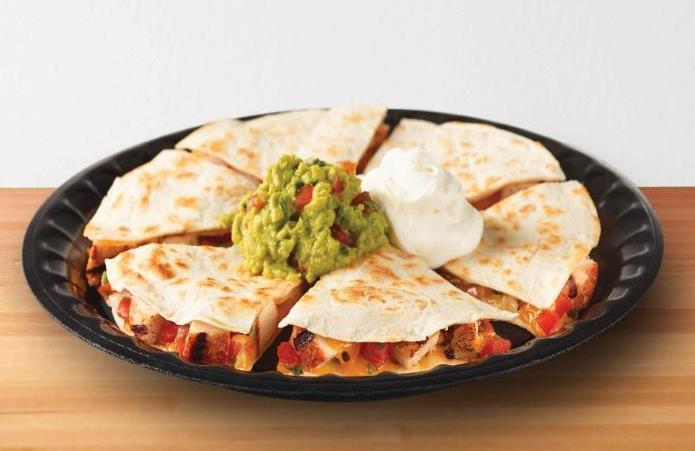
23 Broad Menu Offerings with Mexican Authenticity 23 Fresh, contemporary food prepared with authentic flavors of Mexico A 38 year old brand originating in San Antonio 24-hour format Broad, authentic Mexican product offerings including sizzling fajitas, enchiladas, quesadillas, burritos and salads Margaritas and beer Fresh tortillas made daily Self service salsa bar includes made from scratch salsas and sauces Top five AUV in the fast casual segment, operating performance at peak Expansion in Texas Attractive value proposition - great quality food with an average check of ~ $9 Convenience with dine-in, take out and drive-thru Catering growth is a meaningful opportunity
24 Restaurant Sales Growth and Margin Trends 24 SSS Growth Restaurant-level EBITDA Margin (% of Restaurant Sales) 19.0% 4.7% 4.4% 17.9% 3.3% 16.9% 16.7% 0.5% Restaurant-level EBITDA Margin excludes pre-opening costs.


25 Fresh, Authentic Flavors of Mexico 25


26 Renewed Texas Expansion Leveraging Proven Brand Affinity 26 All stores reimaged between 2012 and Prototype New Prototype

27 Renewed Texas Expansion Leveraging Proven Brand Affinity 27
28 2016 sales and traffic drivers 28 Guidance at least low single digit comparable sales growth at both brands 1% pricing Incremental advertising expense at Pollo ~ 50 bps or $4 million+ Increased media weights in mature markets At least 84% of restaurants will be supported by broadcast media Earlier investment in new markets New Real People advertising campaign at Pollo New product news with limited-time-promotions Continuation of the Pollo remodel program Introduction of new loyalty programs Continuation of new focus on off-premise Ongoing operations focus and execution 1.5% to 2.5% of pricing New product news with limited-time-promotions Completed Taco Cabana remodel program Introduction of new loyalty programs Continuation of new focus on off premise Ongoing operations focus and execution
29 29
30 30 The rest of the story. (what you need to know)
31 Not the typical growth story 31 Atlanta Jacksonville THE BIG 3 Tampa Orlando Miami-Dade, Palm Beach and Broward Represents 65 of the 91 restaurants in 2012 Average Unit Volume of $2.8 in 2012 Other five markets Ft. Myers 26 restaurants 5cities $1.9 Million AUV
32 From 2012 to THE BIG 3 65 to 77 units $2.8 to $3.3 AUV
33 Growth of the other five cities 33 Atlanta Jacksonville 26 to 50 units Tampa Orlando $1.9 to $2.0 AUV Ft. Myers Now Media Efficient Media in Atlanta to begin 4Q 2016

34 In 2016, 84% Restaurants in Markets with Broadcast Media 34

35 Case Study Naples / Ft Myers 35 Ft. Myers
36 Case Study Naples / Ft Myers, Building Market Share $1.6 $2.1 $2.4 $ Company-owned Restaurants Total Transactions Annual Unit Volume (in millions)

37 Growth in Texas 37 Dallas Austin Opened Texas in 2014 Increased units in 2015 from 10 to 23 Houston Project 41 total units by the end of 2016 San Antonio San Antonio media turned on Feb 2016
38 The rest of the story 38 Management teams overhauled Recipes & portion sizes made consistent Achieving all-time best customer feedback scores Positive transactions despite sizable price increases Enhanced culinary team System reimage program completed
39 The rest of the story 39 The Big 3 represent 50% of all restaurants Funded emerging Florida markets Maintain highest AUVs in the industry Reworked process, procedures, I.T. infrastructure, HR, development and supply chain all while plane is flying


40 Still many levers to pull to drive SSS 40 MARKETING CATERING OFF PREMISE CONSUMPTION 53% LOYALTY INNOVATION
41 By end of Doubling in size since 2012
42 42 And now you know the rest of the story.
43 43 Financial Summary
44 Accelerating Growth Since 2012 Spin-off % 22.1% 6.4% 9.0% 8.9% 7.3% 8.2% 10.8% 12.5% 20.8% 21.2% $0.60 $0.83 $1.33 $ % Company-owned Restaurant Growth Revenue Growth Restaurant-level EBITDA Margin % of Restaurant Sales 130 bps Margin Expansion Adjusted Diluted EPS CAGR = 36.3% Note: Restaurant-level EBITDA Margin excludes pre-opening costs.


45 Proven Business Model % 19.3% 20.5% 16.5% 16.5% 14.5% 21.6% 25.0% 13.2% 13.3% 12.5% 11.3% 12.1% 9.5% 8.5% 0.0% Company-owned Restaurant Growth Revenue Growth Adjusted EBITDA Growth Restaurant-level EBITDA Growth Note: Restaurant-level EBITDA Margin excludes pre-opening costs.


46 Performance Trends Improved to Current Record Level % 5.6% 5.6% 20.3% 3.1% 4.0% 4.1% 11.4% 12.2% 1.3% 1.2% 1.7% 5.2% 3.1% -3.0% -4.2% Company-owned Restaurant Growth Revenue Growth Adjusted EBITDA Growth Restaurant-level EBITDA Growth Note: Restaurant-level EBITDA Margin excludes pre-opening costs.
47 FY 2015 Financial Results 47 ($s in millions) FY 2014 FY 2015 % Growth Restaurant Sales $608.5 $684.6 Franchise Revenues $2.6 $2.8 Total Revenues $611.1 $ % Restaurant-level EBITDA $133.2 $ % % Restaurant Sales 21.9% 22.1% Adjusted Net Income $35.7 $ % % Revenues 5.8% 5.9% Adjusted Diluted EPS $1.33 $ %
48 Leverage and Liquidity 48 ($s in millions) FY 2012 FY 2013 FY 2014 FY 2015 Senior Secured Second Lien Notes $ Senior Secured Credit Facility - $71.0 $66.0 $71.0 Capital Leases $1.0 $1.4 $1.3 $1.7 Lease Financing Obligations $3.0 $1.7 $1.7 $1.7 Total Debt $204.0 $74.0 $69.0 $74.3 $150M revolving credit facility (currently, LIBOR bps) through 2018 As of the end of FY 2015, available borrowing capacity of $73.5M Repurchased $200M, 8.875% Notes in Q Refinancing including $135M equity offering net proceeds New Capital Structure Contributed ~ 25% EPS Growth in 2014 Less: Cash and Cash Equivalents $15.5 $11.0 $5.1 $5.3 Total Net Debt $188.5 $63.0 $63.9 $69.1 Total Adjusted EBITDA $64.2 $69.8 $85.7 $99.0 Total Net Debt / Total Adjusted EBITDA 2.9x 0.9x 0.7x 0.7x

49 Focused Capital Allocation 49 New Restaurant Development Focused on Pollo Tropical Continued Reimaging Initiative at Pollo Tropical, ~ 15 in 2016 Ongoing Strategic Investments to Optimize Restaurant Management, Guest Experience and Infrastructure
50 2016 Operating Targets 50 SSS At Least Low Single Digit at Both Brands Cost of Sales Improvement, as a % of Sales, Approximately 100 bps at TC and 180 bps at PT Depreciation and Amortization Expense of Approximately $36 million to $38 million Effective Tax Rate of 36% to 37% Company-owned Restaurant Openings of 40 to 44 Capital Expenditures of $95 million to $110 million
51 51 Appendix


52 Commodity Cost Overview 52 Top 5 Food Purchases 2016F The Company Contracts Commodities With Some Suppliers Top 5 Food Purchases 2016F 2016 Projected Consolidate Commodity Decrease ~ Low Single Digits 2016 Commodities Under Fixed Pricing By Year End ~ 70%-80% COGS

53 Franchising 53 Franchise Locations Current focus is U.S. non-traditional franchising (universities and airports) - Currently, 5 Pollo and 2 Taco locations Bahamas... Guatemala International franchise locations are Pollo Tropical restaurants Honduras... 1 We have one traditional Taco franchisee in Albuquerque, NM with 4 restaurants Panama... 5 Franchise revenues are not meaningful today, <1% of total revenues Franchise expansion anticipated to be a growth platform in the future Puerto Rico Trinidad and Tobago 2 United States.. 11 Venezuela... 1
54 Total Adjusted EBITDA Reconciliation 54 ($s in millions) FY2012 FY2013 FY2014 FY2015 Restaurant-level Adjusted EBITDA Excluding Pre-Opening Costs: Pollo Tropical $ 58.2 $ 67.8 $ 79.0 $ 90.4 Taco Cabana Consolidated $ $ $ $ Less: Pre-Opening Costs Restaurant-level Adjusted EBITDA: Pollo Tropical Taco Cabana Consolidated $ $ $ $ Add: Franchise Royalty Revenues and Fees Less: General and Administrative (Excluding Stock-based Compensation) Adjusted EBITDA Pollo Tropical Taco Cabana Consolidated $ 64.2 $ 69.8 $ 85.7 $ 99.0 Less: Depreciation and Amortization Impairment and Other Lease Charges Interest Expense Loss on Extinguishment of Debt Provision for Income Taxes Stock-Based Compensation Other Expense / (Gain) (0.1) (0.6) (0.6) (0.7) Net Income $ 8.3 $ 9.3 $ 36.2 $ 38.5
55 Adjusted EBITDA Reconciliation 55 ($s in millions) FY2012 FY2013 FY2014 FY2015 Restaurant Sales $ $ $ $ Less: Cost of Sales Restaurant Wages and Related Expenses Restaurant Rent Expense Other Restaurant Operating Expenses Advertising Expense Restaurant-Level Adjusted EBITDA Excluding Pre-Opening Costs $ 58.2 $ 67.8 $ 79.0 $ 90.4 Less: Pre-Opening Costs Restaurant-Level Adjusted EBITDA $ 57.1 $ 65.7 $ 75.6 $ 86.1 Add: Franchise Revenue Less: General and Administrative Expenses Adjusted EBITDA $ 38.6 $ 43.7 $ 52.7 $ 59.3
56 Adjusted EBITDA Reconciliation 56 Restaurant Sales $ $ $ $ Less: Cost of Sales Restaurant Wages and Related Expenses Restaurant Rent Expense Other Restaurant Operating Expenses Advertising Expense Restaurant-Level Adjusted EBITDA Excluding Pre-Opening Costs $ 47.2 $ 48.7 $ 54.2 $ 60.8 Less: Pre-Opening Costs Restaurant-Level Adjusted EBITDA $ 46.6 $ 48.0 $ 53.5 $ 60.6 Add: Franchise Revenue Less: General and Administrative Expenses Adjusted EBITDA $ 25.6 $ 26.1 $ 33.0 $ 39.7
57 Adjusted Net Income Reconciliation 57 ($s in millions, except per share amounts) FY2012 FY2013 FY2014 FY2015 $ EPS $ EPS $ EPS $ EPS Net Income $ 8.3 $ 0.35 $ 9.3 $ 0.39 $ 36.2 $ 1.35 $ 38.5 $ 1.44 Add (each net of tax effect): Impairment and other lease charges (a) Qualification for sale leaseback accounting (b) Secondary offering expenses (c) Loss on extinguishment of debt (d) Gain on condemnation (e) (0.3) (0.01) (0.2) (0.01) Legal settlements and related costs (f) (0.3) (0.01) Gain on sale of property (g) (0.1) - (0.3) (0.01) Adjusted net income & EPS $ 14.1 $ 0.60 $ 19.9 $ 0.83 $ 35.7 $ 1.33 $ 40.8 $ 1.52 * Amounts do not add to adjusted total due to rounding (a) Impairment and other lease charges for the twelve months ended December 30, 2012 are primarily related to the closure of five Pollo Tropical restaurants in New Jersey in the first quarter of Impairment and other lease charges for the twelve months ended January 3, 2016 are primarily related to the suspension of our Cabana Grill concept at the end of fiscal Impairment and other lease charges for each period are presented net of taxes of $0.9 million, $0.1 million, $0.1 million and $2.4 million for the twelve months ended January 3, 2016, December 28, 2014, December 29, 2013 and December 30, 2012, respectively. (b) Prior to the spin-off from Carrols Restaurant Group, Inc. ("Carrols"), certain sale-leaseback transactions were classified as lease financing transactions because Carrols guaranteed the related lease payments. Effective upon the spin-off, the provisions that previously precluded sale-leaseback accounting were cured or eliminated. As a result, the real property leases entered into in connection with these transactions are now recorded as operating leases. Additionally, in the second quarter of 2012, we exercised purchase options associated with the leases for five restaurant properties also previously accounted for as lease financing obligations and purchased those properties from the lessor. The amount reported as "qualification for sale leaseback accounting" represents the net increase in rent expense, decrease in depreciation expense and decrease in interest expense, that would have impacted net income had the leases been accounted for as operating leases for all periods presented, based on the deferred gain on sale-leaseback transactions calculated at the time of the spin-off, and had the five properties been owned for the full year ended December 30, Qualification for sale leaseback accounting is shown net of taxes of $0.6 million in the twelve months ended December 30, This amount is included for comparative purposes only, and may not be indicative of what actual results would have been had the qualification for sale-leaseback accounting treatment of these leases (and the treatment of such leases as operating leases) occurred on the dates described above. (c) Secondary offering expenses for the twelve months ended December 29, 2013 include expenses related to the underwritten secondary public equity offering completed during March 2013 totaling $0.4 million. The Company did not receive any proceeds from the sale of shares in the offering. Secondary offering expenses are presented net of taxes of $0.2 million. (d) The Company recognized a loss on extinguishment of debt of $16.4 million in the fourth quarter of 2013 related to the repurchase and redemption of its Notes. The loss on extinguishment of debt for the twelve months ended December 29, 2013 is presented net of taxes of $5.9 million. (e) Gain on condemnation in 2015 primarily includes a previously deferred gain from a sale-leaseback transaction that was recognized upon termination of the lease. Gain on condemnation in 2014 includes a gain from a condemnation award resulting from an eminent domain proceeding. Gain on condemnation for each period is presented net of taxes of $(0.1) million and $(0.2) million for the twelve months ended January 3, 2016 and December 28, 2014, respectively. (f) Legal settlements and related costs in 2015 include legal fees and other costs, including estimated settlement charges, associated with a class action litigation, and in 2014 include the benefit of a payment received as settlement of a litigation matter. Legal settlements and related costs for each period are presented net of taxes of $0.6 million and $(0.2) million for the twelve months ended January 3, 2016 and December 28, 2014, respectively. (g) Gain on sale of property for each period is presented net of taxes of $(0.2) million and $(0.0) million for the twelve months ended December 29, 2013 and December 30, 2012, respectively.
58 Use of Non-GAAP Financial Measures 58 Adjusted EBITDA, restaurant-level adjusted EBITDA, and restaurant-level adjusted EBITDA excluding pre-opening costs are all non-gaap financial measures. Adjusted EBITDA is defined as earnings attributable to the applicable segment before interest, loss on extinguishment of debt, income taxes, depreciation and amortization, impairment and other lease charges, stock-based compensation expense and other income and expense. It includes an allocation of corporate and brand general and administrative expenses (each excluding stock-based compensation). Restaurant-level adjusted EBITDA (excluding pre-opening costs) is defined as Adjusted EBITDA excluding franchise royalty revenues and fees, pre-opening costs and general and administrative expenses. Management believes that such financial measures, when viewed with our results of operations calculated in accordance with GAAP and our reconciliation of restaurant-level adjusted EBITDA and restaurant-level adjusted EBITDA excluding pre-opening costs and adjusted EBITDA to net income (i) provide useful information about our operating performance and period-over-period growth (including at the restaurant level), (ii) provide additional information that is useful for evaluating the operating performance of our business, and (iii) permit investors to gain an understanding of the factors and trends affecting our ongoing earnings, from which capital investments are made and debt is serviced. However, such measures are not measures of financial performance or liquidity under GAAP and, accordingly, should not be considered as alternatives to net income or cash flow from operating activities as indicators of operating performance or liquidity. Also these measures may not be comparable to similarly titled captions of other companies. Adjusted net income and related adjusted earnings per share are non-gaap financial measures. Adjusted net income is defined as net income before impairment and other lease charges, the impact of the qualification for sale-leaseback accounting (primarily upon the spin-off from Carrols) for certain leases previously accounted for as lease financing obligations, secondary offering expenses, loss on extinguishment of debt, gain on condemnation, legal settlements and related costs and gain on sale of property. Management believes that adjusted net income and related adjusted earnings per diluted share, when viewed with our results of operations calculated in accordance with GAAP (i) provide useful information about our operating performance and period-over-period growth, (ii) provide additional information that is useful for evaluating the operating performance of our business, and (iii) permit investors to gain an understanding of the factors and trends affecting our ongoing earnings, from which capital investments are made and debt is serviced. However, such measures are not measures of financial performance or liquidity under GAAP and, accordingly should not be considered as alternatives to net income or net income per share as indicators of operating performance or liquidity. Also these measures may not be comparable to similarly titled captions of other companies.
INVESTOR PRESENTATION
 INVESTOR PRESENTATION DECEMBER 2014 Forward-Looking Statements This contains forward-looking statements within the meaning of Section 27A of the Securities Act of 1933, as amended, and Section 21E of the
Fiesta Restaurant Group, Inc. Reports Fourth Quarter and Full Year 2012 Results
 FOR IMMEDIATE RELEASE Investor Relations Contact: Raphael Gross 203-682-8253 investors@frgi.com Reports Fourth Quarter and Full Year 2012 Results Addison, TX - (Businesswire) - February 28, 2013 - ( Fiesta
UNITED STATES SECURITIES AND EXCHANGE COMMISSION Washington, D.C FORM 8-K
 UNITED STATES SECURITIES AND EXCHANGE COMMISSION Washington, D.C. 20549 FORM 8-K CURRENT REPORT Pursuant to Section 13 or 15(d) of the Securities Exchange Act of 1934 Date of Report (Date of earliest event
FIESTA RESTAURANT GROUP, INC.
 FIESTA RESTAURANT GROUP, INC. FORM 8-K (Current report filing) Filed 08/05/14 for the Period Ending 08/05/14 Address 14800 LANDMARK BOULEVARD, SUITE 500 ADDISON, TX 75254 Telephone 972-702-9300 CIK 0001534992
30 th Annual Raymond James Institutional Investors Conference March 11, 2009
 30 th Annual Raymond James Institutional Investors Conference March 11, 2009 Safe Harbor Statement Under the Private Securities i Litigation i i Reform Act of 1995 Our presentation includes, and our response
FIESTA RESTAURANT GROUP, INC. (Exact name of Registrant as specified in its charter)
") UNITED STATES SECURITIES AND EXCHANGE COMMISSION WASHINGTON, DC 20549 FORM 10-Q ý QUARTERLY REPORT PURSUANT TO SECTION 13 OR 15 (d) OF THE SECURITIES EXCHANGE ACT OF 1934 For the quarterly period ended
UNITED STATES SECURITIES AND EXCHANGE COMMISSION WASHINGTON, DC 20549 FORM 10-Q ý QUARTERLY REPORT PURSUANT TO SECTION 13 OR 15 (d) OF THE SECURITIES EXCHANGE ACT OF 1934 For the quarterly period ended
Investor Presentation. January 2017
 Investor Presentation January 2017 Forward-Looking Statements Forward-Looking Statements This presentation contains forward-looking statements that are subject to risks and uncertainties. All statements
Del Taco Restaurants, Inc. Reports Fiscal Fourth Quarter and Fiscal Year 2017 Financial Results
 NEWS RELEASE Del Taco Restaurants, Inc. Reports Fiscal Fourth Quarter and Fiscal Year 2017 Financial Results 3/14/2018 System-wide comparable restaurant sales growth of 2.4% in Fiscal Fourth Quarter Announces
Jacky Lo Chief Finance Officer, Yum China
 Jacky Lo Chief Finance Officer, Yum China Cautionary Language Regarding Forward-Looking Statements Forward-Looking Statements. Our presentation may contain forward-looking statements within the meaning
Del Taco Restaurants, Inc. (Exact name of registrant as specified in its charter)
") UNITED STATES SECURITIES AND EXCHANGE COMMISSION WASHINGTON, DC 20549 FORM 8-K CURRENT REPORT Pursuant to Section 13 or 15(d) of the Securities Exchange Act of 1934 Date of Report (Date of earliest event
UNITED STATES SECURITIES AND EXCHANGE COMMISSION WASHINGTON, DC 20549 FORM 8-K CURRENT REPORT Pursuant to Section 13 or 15(d) of the Securities Exchange Act of 1934 Date of Report (Date of earliest event
CL King s Annual Best Ideas Conference
 WELCOME TO AMERICA S DINER CL King s Annual Best Ideas Conference September 10, 2015 Forward Looking Statements and Non-GAAP Financial Measures Denny s Corporation urges caution in considering its current
Baird s 2018 Global Consumer, Technology & Services Conference
 Baird s 2018 Global Consumer, Technology & Services Conference Cautionary Statements Forward Looking Statements This presentation may include forward looking statements. These statements reflect the current
Investor Presentation. July 2018
 Investor Presentation July 2018 Disclaimer/Non-GAAP Information IMPORTANT NOTICE The following slides are part of a presentation by Darden Restaurants, Inc. (the "Company") and are intended to be viewed
Jack in the Box Inc. Reports First Quarter FY 2015 Earnings; Updates Guidance for FY 2015
 Investor Contact: Carol DiRaimo, (858) 571-2407 FOR IMMEDIATE RELEASE Media Contact: Brian Luscomb, (858) 571-2291 Jack in the Box Inc. Reports First Quarter FY 2015 Earnings; Updates Guidance for FY 2015
The Wendy s Company Reports Audited Full-Year 2012 Results
 The Wendy s Company Reports Audited Full-Year 2012 Results Fourth-Quarter Adjusted EBITDA Increased 19% to $95.9 Million; Full-Year Adjusted EBITDA Increased 1% to $333.3 Million Positive Momentum from
Fourth Quarter & Full Year 2017 Results Presentation. February 8, 2018
 Fourth Quarter & Full Year 2017 Results Presentation February 8, 2018 1 Cautionary Statement on Forward-Looking Statements & Non-GAAP Measures This presentation contains forward-looking statements within
Chuy s Investor Presentation 2 nd Quarter 2017
 Chuy s Investor Presentation 2 nd Quarter 2017 Cautionary Statements Forward-Looking Statements This presentation may include forward-looking statements. These statements reflect the current views of the
AFC Enterprises Reports Financial Results for Third Quarter 2010; Raises Fiscal 2010 Earnings Guidance
 November 10, 2010 AFC Enterprises Reports Financial Results for Third Quarter 2010; Raises Fiscal 2010 Earnings Guidance ATLANTA--(BUSINESS WIRE)-- AFC Enterprises, Inc. (NASDAQ: AFCE), the franchisor
Company Presentation January 2013
 Company Presentation January 2013 Cautionary Statements Forward-Looking Statements This presentation may include forward-looking statements. These statements reflect the current views of the Company s
Second Quarter 2012 Earnings Conference Call. August 9, Oldemark LLC JOHN BARKER CHIEF COMMUNICATIONS OFFICER
 Second Quarter 2012 Earnings Conference Call August 9, 2012 1 2012 Oldemark LLC JOHN BARKER CHIEF COMMUNICATIONS OFFICER 2 1 Today s Agenda Opening Comments Financial Update CEO Overview Emil Brolick Steve
Noodles & Company Announces Fourth Quarter and Fiscal Year 2014 Financial Results
 February 19, 2015 Noodles & Company Announces Fourth Quarter and Fiscal Year 2014 Financial Results BROOMFIELD, Colo., Feb. 19, 2015 (GLOBE NEWSWIRE) -- Noodles & Company (Nasdaq:NDLS) today announced
Dine Brands Global, Inc. Investor Presentation. March 5, 2018
 Dine Brands Global, Inc. Investor Presentation March 5, 2018 2 Disclosures Forward-Looking Information: The content contained in this presentation is as of February 21, 2018. The Company assumes no obligation
EARNINGS CALL. FISCAL 2018: Q3 RESULTS March 22, 2018
 EARNINGS CALL FISCAL 2018: Q3 RESULTS March 22, 2018 Disclaimer/Non-GAAP Information IMPORTANT NOTICE The following slides are part of a presentation by Darden Restaurants, Inc. (the "Company") and are
Page 1/12. Yum China Reports Fourth Quarter and Full Year 2017 Results. February 7, :30 PM ET
 Yum China Reports Fourth Quarter and Full Year 2017 Results February 7, 2018 4:30 PM ET SHANGHAI, Feb. 7, 2018 /PRNewswire/ -- (the "Company" or "Yum China") (NYSE: YUMC) today reported unaudited results
Jack in the Box Inc. Reports First Quarter FY 2013 Earnings; Updates Guidance for FY 2013
 Investor Contact: Carol DiRaimo, (858) 571-2407 FOR IMMEDIATE RELEASE Media Contact: Brian Luscomb, (858) 571-2291 Reports First Quarter FY 2013 Earnings; Updates Guidance for FY 2013 SAN DIEGO, February
El Pollo Loco Holdings, Inc. Announces Second Quarter 2014 Financial Results
 September 4, 2014 El Pollo Loco Holdings, Inc. Announces Second Quarter 2014 Financial Results COSTA MESA, CA - September 4, 2014 - El Pollo Loco Holdings, Inc. (Nasdaq: LOCO) today announced financial
EARNINGS CALL. FISCAL 2018: Q4 & ANNUAL RESULTS June 21, 2018
 EARNINGS CALL FISCAL 2018: Q4 & ANNUAL RESULTS June 21, 2018 Disclaimer/Non-GAAP Information IMPORTANT NOTICE The following slides are part of a presentation by Darden Restaurants, Inc. (the "Company")
BRAND TRANSFORMATION MOMENTUM CONTINUES COMPANY NOW EXPECTS TO COMPLETE SYSTEM OPTIMIZATION INITIATIVE DURING FIRST QUARTER
 THE WENDY S COMPANY REPORTS FINAL 2013 RESULTS; REAFFIRMS 2014 OUTLOOK FULL-YEAR ADJUSTED EBITDA INCREASED 10% TO $367.1 MILLION FULL-YEAR ADJUSTED EARNINGS PER SHARE INCREASED 76% TO $0.30 BRAND TRANSFORMATION
DENNY S CORPORATION REPORTS RESULTS FOR FOURTH QUARTER AND FULL YEAR 2016
 REPORTS RESULTS FOR FOURTH QUARTER AND FULL YEAR 2016 SPARTANBURG, S.C., February 15, 2017 - Denny s Corporation (NASDAQ: DENN), franchisor and operator of one of America's largest franchised full-service
Bloomin' Brands Announces 2015 Third Quarter Adjusted Diluted EPS of $0.15 and Diluted EPS of $0.13;
 November 3, Bloomin' Brands Announces Third Quarter Adjusted Diluted EPS of $0.15 and Diluted EPS of $0.13; Reaffirms Guidance for Adjusted Diluted EPS of At Least $1.27; Repurchases $60 Million of Common
Del Taco Restaurants, Inc. (Exact name of registrant as specified in its charter)
") UNITED STATES SECURITIES AND EXCHANGE COMMISSION WASHINGTON, DC 20549 FORM 8-K CURRENT REPORT Pursuant to Section 13 or 15(d) of the Securities Exchange Act of 1934 Date of Report (Date of earliest event
UNITED STATES SECURITIES AND EXCHANGE COMMISSION WASHINGTON, DC 20549 FORM 8-K CURRENT REPORT Pursuant to Section 13 or 15(d) of the Securities Exchange Act of 1934 Date of Report (Date of earliest event
Management s Discussion & Analysis
 Freshii Inc. Management s Discussion & Analysis For the 13 week period ended March 26, 2017 (Expressed in US Dollars) MANAGEMENT S DISCUSSION AND ANALYSIS OF FINANCIAL CONDITION AND RESULTS OF OPERATIONS
Jack in the Box Inc. Reports Second Quarter FY 2014 Earnings; Updates Guidance for FY 2014
 Investor Contact: Carol DiRaimo, (858) 571-2407 FOR IMMEDIATE RELEASE Media Contact: Brian Luscomb, (858) 571-2291 Reports Second Quarter FY Earnings; Updates Guidance for FY SAN DIEGO, May 14, (NASDAQ:
Steve Schmitt Vice President, Investor Relations & Corporate Strategy
 NEWS Steve Schmitt Vice President, Investor Relations & Corporate Strategy Yum! Brands Reports Second-Quarter EPS of $0.69, a Decline of 5%, Excluding Special Items; Expects Strong Second Half in China;
Jack in the Box Inc. Reports Third Quarter FY 2015 Earnings; Updates Guidance for FY 2015; Declares Quarterly Cash Dividend
 Investor Contact: Carol DiRaimo, (858) 571-2407 FOR IMMEDIATE RELEASE Media Contact: Brian Luscomb, (858) 571-2291 Reports Third Quarter FY Earnings; Updates Guidance for FY ; Declares Quarterly Cash Dividend
Luby s Reports Fourth Quarter and Fiscal 2015 Results
 For additional information contact: FOR IMMEDIATE RELEASE Dennard-Lascar Associates 713-529-6600 Rick Black / Ken Dennard Investor Relations Luby s Reports Fourth Quarter and Fiscal Results HOUSTON, TX
Donny Lau Senior Director, Investor Relations & Corporate Strategy
 NEWS Donny Lau Senior Director, Investor Relations & Corporate Strategy Yum! Brands Reports Second-Quarter GAAP Operating Profit Growth of 32%; Delivered Core Operating Profit Growth of 7%; Raises Full-Year
Carrols Restaurant Group, Inc. Reports Financial Results for the Second Quarter 2009
 Reports Financial Results for the Second Quarter 2009 SYRACUSE, N.Y., Aug 03, 2009 (BUSINESS WIRE) -- (Nasdaq:TAST), the parent company of Carrols Corporation, today announced financial results for the
Investor Presentation January 2013
 Investor Presentation January 2013 Texas Roadhouse, Inc Safe Harbor Statement and Reconciliation of Non-GAAP Financial Measures Under the Private Securities Litigation Reform Act of 1995 Certain statements
5/7/2013. First Quarter 2013 Earnings Conference Call. May 8, Oldemark LLC JOHN BARKER. Chief Communications Officer.
 First Quarter 2013 Earnings Conference Call May 8, 2013 2013 Oldemark LLC JOHN BARKER Chief Communications Officer 2013 Oldemark LLC 2 1 Today s Agenda CEO Overview Financial Update Emil Brolick Steve
FOR IMMEDIATE RELEASE. Investor Contact: Carol DiRaimo, (858) Media Contact: Brian Luscomb, (858)
 Media Contact: Brian Luscomb, (858)") Investor Contact: Carol DiRaimo, (858) 571-2407 FOR IMMEDIATE RELEASE Media Contact: Brian Luscomb, (858) 571-2291 Jack in the Box Inc. Reports Second Quarter FY Earnings; Updates Guidance for FY ; Declares
Investor Contact: Carol DiRaimo, (858) 571-2407 FOR IMMEDIATE RELEASE Media Contact: Brian Luscomb, (858) 571-2291 Jack in the Box Inc. Reports Second Quarter FY Earnings; Updates Guidance for FY ; Declares
FOR IMMEDIATE RELEASE (Analysts) Kevin Kalicak (407) (Media) Rich Jeffers (407)
 Kevin Kalicak (407) (Media) Rich Jeffers (407)") FOR IMMEDIATE RELEASE Contact: (Analysts) Kevin Kalicak (407) 245-5870 (Media) Rich Jeffers (407) 245-4189 DARDEN RESTAURANTS REPORTS FISCAL 2016 SECOND QUARTER RESULTS; REPORTS POSITIVE SAME-RESTAURANT
FOR IMMEDIATE RELEASE Contact: (Analysts) Kevin Kalicak (407) 245-5870 (Media) Rich Jeffers (407) 245-4189 DARDEN RESTAURANTS REPORTS FISCAL 2016 SECOND QUARTER RESULTS; REPORTS POSITIVE SAME-RESTAURANT
THE WENDY S COMPANY REPORTS STRONG 2013 THIRD-QUARTER RESULTS, RAISES EARNINGS OUTLOOK FOR 2013 COMPANY REPORTS 3Q SAME-STORE SALES INCREASE OF 3.
 THE WENDY S COMPANY REPORTS STRONG 2013 THIRD-QUARTER RESULTS, RAISES EARNINGS OUTLOOK FOR 2013 COMPANY REPORTS 3Q SAME-STORE SALES INCREASE OF 3.2% ADJUSTED EBITDA INCREASES 17% ADJUSTED EPS INCREASES
DAVID POPLAR. Second-Quarter 2014 Conference Call August 7, Vice President Investor Relations 8/7/2014 7:11:27 AM.
 Second-Quarter 2014 Conference Call August 7, 2014 2013 Oldemark LLC DAVID POPLAR Vice President Investor Relations 2013 Oldemark LLC 2 1 Today s Agenda CEO Overview Financial Update Q&A Emil Brolick Todd
Luby s Reports Third Quarter Fiscal 2016 Results
 For additional information contact: FOR IMMEDIATE RELEASE Dennard-Lascar Associates Rick Black / Ken Dennard Investor Relations 713-529-6600 Luby s Reports Third Quarter Fiscal Results Luby s Cafeterias
Jack in the Box Inc. Reports Third Quarter FY 2017 Earnings; Updates Guidance for FY 2017; Declares Quarterly Cash Dividend
 Investor Contact: Carol DiRaimo, (858) 571-2407 FOR IMMEDIATE RELEASE Media Contact: Brian Luscomb, (858) 571-2291 Jack in the Box Inc. Reports Third Quarter FY Earnings; Updates Guidance for FY ; Declares
INVESTOR PRESENTATION JANUARY 2018
 INVESTOR PRESENTATION JANUARY 2018 0 FORWARD-LOOKING STATEMENTS Forward-Looking Statements This presentation contains forward-looking statements that are subject to risks and uncertainties. All statements
BOB EVANS REPORTS FISCAL 2015 FOURTH-QUARTER AND FULL-YEAR RESULTS; PROVIDES FISCAL YEAR 2016 OUTLOOK
 BOB EVANS REPORTS FISCAL FOURTH-QUARTER AND FULL-YEAR RESULTS; PROVIDES FISCAL YEAR 2016 OUTLOOK Q4 net sales total $332.4 million, an increase of $6.0 million, or 1.8 percent. GAAP net income of $0.24
THE WENDY S COMPANY REPORTS FIRST-QUARTER 2014 RESULTS COMPANY-OPERATED SAME-RESTAURANT SALES INCREASE 1.3%
 THE WENDY S COMPANY REPORTS FIRST-QUARTER 2014 RESULTS COMPANY-OPERATED SAME-RESTAURANT SALES INCREASE 1.3% ADJUSTED EBITDA INCREASES 13% TO $87.3 MILLION; ADJUSTED EPS INCREASES FROM $0.03 TO $0.07 IMAGE
Luby s Reports Second Quarter Fiscal 2011 Results
 For additional information contact: FOR IMMEDIATE RELEASE DRG&L / 713-529-6600 Ken Dennard / Sheila Stuewe Investor Relations Luby s Reports Second Quarter Fiscal 2011 Results HOUSTON, TX March 10, 2011
INVESTKentucky Conference Louisville, KY June 6, 2013
 INVESTKentucky Conference Louisville, KY June 6, 2013 Tony Thompson EVP, Chief Operating Officer and President, PJ Food Service Lance Tucker SVP, Chief Financial Officer and Chief Administrative Officer
July 30, Highlights for Q include the following:
 Bloomin' Brands Announces 2018 Q2 Diluted EPS of $0.28 and Adjusted Diluted EPS of $0.38; Q2 Comparable Restaurant Sales Growth of 4.0% at Outback and 2.4% Combined ; Reaffirms Full Year 2018 Guidance
WEEKS ENDED. Adjusted diluted earnings per share* $ 0.46 $ 0.50 $ (0.04)
") May 9, 2014 Bloomin' Brands, Inc. Announces Fiscal 2014 First Quarter Adjusted Diluted Earnings Per Share of $0.46 and GAAP Diluted Earnings Per Share of $0.42; Reaffirms Full-Year 2014 Guidance Including
May 9, 2014 Bloomin' Brands, Inc. Announces Fiscal 2014 First Quarter Adjusted Diluted Earnings Per Share of $0.46 and GAAP Diluted Earnings Per Share of $0.42; Reaffirms Full-Year 2014 Guidance Including
Jefferies Winter Consumer Summit Beaver Creek January 26, 2015
 Jefferies Winter Consumer Summit Beaver Creek January 26, 2015 Forward Looking Statements Certain matters discussed in this presentation constitute forward-looking statements within the meaning of the
Rent-A-Center today is
 INVESTOR PRESENTATION FIRST QUARTER 2014 Safe Harbor This presentation contains forward-looking statements that involve risks and uncertainties. Such forward-looking statements generally can be identified
THE WENDY S COMPANY REPORTS PRELIMINARY 2016 RESULTS; ANNOUNCES 2017 OUTLOOK AND UPDATES 2020 GOALS
 THE WENDY S COMPANY REPORTS PRELIMINARY 2016 RESULTS; ANNOUNCES 2017 OUTLOOK AND UPDATES 2020 GOALS 16th consecutive quarter of positive same-restaurant sales; North America system same-restaurant sales
Q Financial Results. May 4, 2017
 Q1 2017 Financial Results May 4, 2017 Safe Harbor The information made available in this presentation contains forward-looking statements which reflect the Company s current view of future events, results
INVESTOR PRESENTATION JUNE 2018
 INVESTOR PRESENTATION JUNE 2018 0 FORWARD-LOOKING STATEMENTS Forward-Looking Statements This presentation contains forward-looking statements that are subject to risks and uncertainties. All statements
DARDEN RESTAURANTS REPORTS FISCAL 2017 FOURTH QUARTER AND FULL YEAR RESULTS; FOURTH QUARTER SAME-RESTUARANT SALES GROWTH OF 3
 Contacts: (Analysts) Kevin Kalicak (407) 245-5870 (Media) Rich Jeffers (407) 245-4189 DARDEN RESTAURANTS REPORTS FISCAL 2017 FOURTH QUARTER AND FULL YEAR RESULTS; FOURTH QUARTER SAME-RESTUARANT SALES GROWTH
Texas Roadhouse, Inc. Announces Third Quarter 2018 Results
 Texas Roadhouse, Inc. Announces Third Quarter 2018 Results LOUISVILLE, KY. (October 29, 2018) Texas Roadhouse, Inc. (NasdaqGS: TXRH) today announced financial results for the 13 and 39 week periods ended
Chuy s Holdings, Inc. Announces Fourth Quarter and Fiscal Year 2017 Financial Results
 Chuy s Holdings, Inc. Announces Fourth Quarter and Fiscal Year Financial Results March 8, 2018 AUSTIN, Texas--(BUSINESS WIRE)--Mar. 8, 2018-- Chuy s Holdings, Inc. (NASDAQ:CHUY) today announced financial
Dunkin Brands Group, Inc.
 Dunkin Brands Group, Inc. Investor Presentation Jefferies Consumer Conference Nigel Travis Chairman & CEO 1 Forward-Looking Statements Certain information contained in this presentation, particularly information
THREE MONTHS ENDED MARCH 31, $ Change Diluted earnings per share $ 0.50 $ 0.47 $ 0.03 Adjustments (1) 0.02 (0.02)
 0.02 (0.02)") April 30, 2013 Bloomin' Brands, Inc. Announces First Quarter Adjusted Diluted Earnings Per Pro Forma Share of $0.50 and GAAP Diluted Earnings Per Share of $0.50; Raises Full-Year 2013 Guidance for Adjusted
April 30, 2013 Bloomin' Brands, Inc. Announces First Quarter Adjusted Diluted Earnings Per Pro Forma Share of $0.50 and GAAP Diluted Earnings Per Share of $0.50; Raises Full-Year 2013 Guidance for Adjusted
DENNY S CORPORATION REPORTS RESULTS FOR FOURTH QUARTER AND FULL YEAR 2017
 REPORTS RESULTS FOR FOURTH QUARTER AND FULL YEAR 2017 SPARTANBURG, S.C., February 13, 2018 - Denny s Corporation (NASDAQ: DENN), franchisor and operator of one of America's largest franchised full-service
Jack in the Box Inc. Reports Second Quarter FY 2015 Earnings; Updates Guidance for FY 2015; Raises Quarterly Cash Dividend by 50%
 Investor Contact: Carol DiRaimo, (858) 571-2407 FOR IMMEDIATE RELEASE Media Contact: Brian Luscomb, (858) 571-2291 Reports Second Quarter FY Earnings; Updates Guidance for FY ; Raises Quarterly Cash Dividend
Bravo Brio Restaurant Group, Inc. Reports Fourth Quarter & Full Year 2016 Financial Results; Company Provides Full Year 2017 Outlook
 February 28, 2017 Bravo Brio Restaurant Group, Inc. Reports Fourth Quarter & Full Year 2016 Financial Results; Company Provides Full Year 2017 Outlook COLUMBUS, Ohio, Feb. 28, 2017 (GLOBE NEWSWIRE) --
First Quarter Fiscal Calendar Calculation Dates January 1, April 1, 2018 vs. December 26, March 26, 2017
 Bloomin' Brands Announces 2018 Q1 Diluted EPS of $0.68 and Adjusted Diluted EPS of $0.71; Q1 Comparable Restaurant Sales Growth of 4.3% at Outback With Positive Traffic of 2.2%; Q1 Combined Comparable
Del Taco Restaurants, Inc. (Exact name of registrant as specified in its charter)
") UNITED STATES SECURITIES AND EXCHANGE COMMISSION WASHINGTON, DC 20549 FORM 8-K CURRENT REPORT Pursuant to Section 13 or 15(d) of the Securities Exchange Act of 1934 Date of Report (Date of earliest event
UNITED STATES SECURITIES AND EXCHANGE COMMISSION WASHINGTON, DC 20549 FORM 8-K CURRENT REPORT Pursuant to Section 13 or 15(d) of the Securities Exchange Act of 1934 Date of Report (Date of earliest event
Q Financial Results. May 8, 2018
 Q1 2018 Financial Results May 8, 2018 Safe Harbor Some of the statements contained in this presentation and the Company s May 9, 2018 earnings conference call may constitute forward-looking statements
Yum China Reports First Quarter 2018 Results. May 1, :30 PM ET
 Yum China Reports First Quarter 2018 Results May 1, 2018 4:30 PM ET SHANGHAI, May 1, 2018 /PRNewswire/ -- Yum China Holdings, Inc. (the "Company" or "Yum China") (NYSE: YUMC) today reported unaudited results
Oppenheimer 18 th Annual Consumer Conference June 20, 2018
 Oppenheimer 18 th Annual Consumer Conference June 20, 2018 David Burke, Chief Executive Officer Phyllis Knight, Chief Financial Officer 1 Safe Harbor Some of the statements contained in this presentation
Popeyes Louisiana Kitchen, Inc. Reports Fiscal 2016 Earnings Results
 February 22, 2017 Reports Fiscal 2016 Earnings Results Completes Credit Facility Expansion ATLANTA--(BUSINESS WIRE)-- (NASDAQ: PLKI), the franchisor and operator of Popeyes restaurants, today reported
Dougherty & Company Institutional Investor Conference
 Dougherty & Company Institutional Investor Conference September 19, David Burke, Chief Executive Officer Phyllis Knight, Chief Financial Officer Safe Harbor The information made available in this presentation
Dine Brands Global, Inc. Investor Presentation March 2019
 Dine Brands Global, Inc. Investor Presentation March 2019 Disclosures Forward-Looking Information: The content contained in this presentation is as of March 5, 2019. The Company assumes no obligation to
For additional information contact: DRG&L / Ken Dennard / Sheila Stuewe Investor Relations FOR IMMEDIATE RELEASE
 FOR IMMEDIATE RELEASE For additional information contact: DRG&L / 713-529-6600 Ken Dennard / Sheila Stuewe Investor Relations Luby s Reports Fiscal Fourth Quarter and Full Year Results ~ Store Level Profit
Chuy s Holdings, Inc. Announces Second Quarter 2018 Financial Results
 Announces Second Quarter 2018 Financial Results August 9, 2018 AUSTIN, Texas--(BUSINESS WIRE)--Aug. 9, 2018-- (NASDAQ:CHUY) today announced financial results for the second quarter ended July 1, 2018.
Keith Siegner Vice President, Investor Relations, Corporate Strategy and Treasurer. % Change. Same-Store Sales
 Yum! Brands Reports Second-Quarter GAAP Operating Profit Growth of 1%; Delivered Second-Quarter Core Operating Profit Growth of 19%; Maintains Full-Year Core Operating Profit Growth Guidance Louisville,
EARNINGS CALL. FISCAL 2018: Q2 RESULTS December 19, 2017
 EARNINGS CALL FISCAL 2018: Q2 RESULTS December 19, 2017 Disclaimer/Non-GAAP Information IMPORTANT NOTICE The following slides are part of a presentation by Darden Restaurants, Inc. (the "Company") and
Buffalo Wild Wings, Inc. Announces Second Quarter Earnings per Share of $0.55 and Adjusted Earnings per Share of $0.66
 July 26, 2017 Buffalo Wild Wings, Inc. Announces Second Quarter Earnings per Share of $0.55 and Adjusted Earnings per Share of $0.66 -FY2017 Guidance Updated to $4.00 to $4.50 GAAP EPS and $4.50 to $5.00
THE WENDY S COMPANY REPORTS SECOND QUARTER 2018 RESULTS. North America same-restaurant sales increase 1.9% (+5.1% on a two-year basis)
") THE WENDY S COMPANY REPORTS SECOND QUARTER 2018 RESULTS North America same-restaurant sales increase 1.9% (+5.1% on a two-year basis) 22nd consecutive quarter of positive same-restaurant sales 36 global
THE WENDY S COMPANY REPORTS SECOND QUARTER 2018 RESULTS North America same-restaurant sales increase 1.9% (+5.1% on a two-year basis) 22nd consecutive quarter of positive same-restaurant sales 36 global
UNITED STATES SECURITIES AND EXCHANGE COMMISSION Washington, D.C FORM 8-K
 UNITED STATES SECURITIES AND EXCHANGE COMMISSION Washington, D.C. 20549 FORM 8-K CURRENT REPORT PURSUANT TO SECTION 13 OR 15(d) OF THE SECURITIES EXCHANGE ACT OF 1934 Date of Report (Date of earliest event
EARNINGS CALL. FISCAL 2018: Q1 RESULTS September 26, 2017
 EARNINGS CALL FISCAL 2018: Q1 RESULTS September 26, 2017 Disclaimer/Non-GAAP Information IMPORTANT NOTICE The following slides are part of a presentation by Darden Restaurants, Inc. (the "Company") and
MANAGEMENT S DISCUSSION AND ANALYSIS OF FINANCIAL CONDITION AND RESULTS OF OPERATIONS
 MANAGEMENT S DISCUSSION AND ANALYSIS OF FINANCIAL CONDITION AND RESULTS OF OPERATIONS Unless otherwise noted, the section references to (i) us, our, we, the Company and YUM refer to YUM Brands, Inc. and
Q4 and FY 2017 Financial Results. March 9, 2018
 and Financial Results March 9, 2018 Safe Harbor The information made available in this presentation contains forward looking statements which reflect the Company s current view of future events, results
Second Quarter 2018 Results
 Second Quarter 2018 Results August 21, 2018 CLASSIFIED INTERNAL USE ONLY Forward-Looking Statements Forward-looking statements in this presentation regarding the Company s future performance, restaurant
Cautionary Statement Regarding Forward-Looking Statements
 January 2018 Cautionary Statement Regarding Forward-Looking Statements Forward Looking Statements: Certain statements are forward-looking statements made pursuant to the safe harbor provisions of the Private
DENNY S CORPORATION REPORTS RESULTS FOR FOURTH QUARTER AND FULL YEAR 2015
 REPORTS RESULTS FOR FOURTH QUARTER AND FULL YEAR 2015-5.8% Increase in 2015 Full Year Domestic System-Wide Same-Store Sales - - 16.4% Growth in 2015 Full Year Adjusted Net Income per Share* - SPARTANBURG,
El Pollo Loco Holdings, Inc. Announces First Quarter 2015 Financial Results
 May 14, 2015 El Pollo Loco Holdings, Inc. Announces First Quarter 2015 Financial Results COSTA MESA, Calif., May 14, 2015 (GLOBE NEWSWIRE) -- El Pollo Loco Holdings, Inc. (Nasdaq:LOCO) today announced
Bob Evans Express expects to open three new locations during Q2 2015; up to ten new locations expected for fiscal 2015
 BOB EVANS REPORTS FISCAL 2015 FIRST-QUARTER RESULTS Q1 2015 net sales total $326.3 million, a decline of $3.1 million, or 0.9 percent, compared to prior year first-quarter results. GAAP net loss of $0.04
Investor Presentation
 Investor Presentation Cautionary Note Regarding Forward-Looking Statements This presentation contains forward-looking information, including the Company s statements regarding its future outlook. In addition,
McCormick & Company, Inc. 4th Quarter 2018 Financial Results and 2019 Outlook
 McCormick & Company, Inc. 4th Quarter 2018 Financial Results and 2019 Outlook January 24 th 2019 The following slides accompany a January 24 th 2019, earnings release conference call. This information
THE WENDY S COMPANY REPORTS SECOND QUARTER 2017 RESULTS
 THE WENDY S COMPANY REPORTS SECOND QUARTER 2017 RESULTS North America same-restaurant sales increase 3.2% (+3.6% on a two-year basis); 18th consecutive quarter of positive same-restaurant sales 35 global
(1) Based on unit count (2) Represents FY2016 sales data on a 52 week basis and unit counts as of Q2 FY2017 (3) Represents system-wide sales for
 Based on unit count (2) Represents FY2016 sales data on a 52 week basis and unit counts as of Q2 FY2017 (3) Represents system-wide sales for") (1) Based on unit count (2) Represents FY2016 sales data on a 52 week basis and unit counts as of Q2 FY2017 (3) Represents system-wide sales for fiscal 2016 on a 52 week basis and unit count as of January
(1) Based on unit count (2) Represents FY2016 sales data on a 52 week basis and unit counts as of Q2 FY2017 (3) Represents system-wide sales for fiscal 2016 on a 52 week basis and unit count as of January
Q Financial Results. August 3, 2017
 Q2 2017 Financial Results August 3, 2017 Safe Harbor The information made available in this presentation contains forward-looking statements which reflect the Company s current view of future events, results
UNITED STATES SECURITIES AND EXCHANGE COMMISSION Washington, D.C FORM 10-Q WINGSTOP INC.
 UNITED STATES SECURITIES AND EXCHANGE COMMISSION Washington, D.C. 20549 FORM 10-Q (Mark one) x QUARTERLY REPORT PURSUANT TO SECTION 13 OR 15(d) OF THE SECURITIES EXCHANGE ACT OF 1934 For the quarterly
Luby s Reports Third Quarter Fiscal 2011 Results
 For additional information contact: FOR IMMEDIATE RELEASE DRG&L / 713-529-6600 Ken Dennard / Sheila Stuewe Investor Relations Luby s Reports Third Quarter Fiscal 2011 Results HOUSTON, TX June 8, 2011 Luby
CRACKER BARREL REPORTS FOURTH QUARTER AND FULL YEAR FISCAL 2012 RESULTS AND PROVIDES GUIDANCE FOR FISCAL 2013
 Investor Contact: Media Contact: Lawrence E. Hyatt (615) 235-4432 Julie K. Davis (615) 443-9266 CRACKER BARREL REPORTS FOURTH QUARTER AND FULL YEAR FISCAL 2012 RESULTS AND PROVIDES GUIDANCE FOR FISCAL
THE WENDY S COMPANY REPORTS PRELIMINARY 2017 RESULTS; ANNOUNCES 2018 OUTLOOK AND UPDATES 2020 GOALS
 THE WENDY S COMPANY REPORTS PRELIMINARY 2017 RESULTS; ANNOUNCES 2018 OUTLOOK AND UPDATES 2020 GOALS North America same-restaurant sales increase 1.3% in 4Q and 2.0% in 2017; 20th consecutive quarter of
Denny's Corporation Reports Results for Second Quarter 2013
 July 29, 2013 Denny's Corporation Reports Results for Second Quarter 2013 Adjusted Net Income Per Share* Increased 20.7% to $0.08 SPARTANBURG, S.C., July 29, 2013 (GLOBE NEWSWIRE) -- Denny's Corporation
Third Quarter 2017 Business Update. October 26, 2017
 Third Quarter 2017 Business Update October 26, 2017 Third Quarter 2017 Results (GAAP Basis) $ in millions, except EPS Q3 % of Q3 % of Increase/ 2017 Sales 2016 Sales (Decrease) Net sales $948.2 $901.4