Chuy s Investor Presentation 2 nd Quarter 2017
|
|
|
- Robert Holland
- 5 years ago
- Views:
Transcription


1 Chuy s Investor Presentation 2 nd Quarter 2017


2 Cautionary Statements Forward-Looking Statements This presentation may include forward-looking statements. These statements reflect the current views of the Company s senior management with respect to future events and financial performance. These statements include forward-looking statements with respect to the Company s business and industry in general. Statements that include the words expect, intend, plan, believe, project, forecast, estimate, may, should, anticipate and similar statements of a future or forward-looking nature identify forwardlooking statements for purposes of the federal securities laws or otherwise. Forward-looking statements address matters that involve risks and uncertainties. Accordingly, there are or will be important factors that could cause the Company s actual results to differ materially from those indicated in these statements. The statements made herein speak only as of the date of this presentation. Non-GAAP Financial Measures This presentation contains certain non-gaap financial measures. A non-gaap financial measure is defined as a numerical measure of a company s financial performance that excludes or includes amounts so as to be different than the most directly comparable measure calculated and presented in accordance with GAAP in the statements of income, balance sheets or statements of cash flow of the Company. The Company has provided a reconciliation of non-gaap financial measures to the most directly comparable financial measure in the Appendix to this presentation. The non-gaap financial measures used within this presentation are Adjusted EBITDA and Restaurant-Level Operating Profit. These measures are presented because management uses this information to monitor and evaluate financial results and trends and believes this information to also be useful for investors. For additional information about our non-gaap financial measures, see our earnings releases and filings with the Securities and Exchange Commission. 2


3 Senior Management Presenters Jon Howie Vice President and Chief Financial Officer Michael Hatcher Vice President of Real Estate and Development 3


4 If you ve seen one Chuy s, you ve seen one Chuy s! Chuy s is Tex-Mex Unchained! Leave the cookie cutters to the other guys. Each Chuy s has genuine character: a noisy, sprawling Tex-Mex hacienda full of feel-good drinks and home-cooked foods. 4
5 Chuy s Highlights Fresh, Authentic Mexican and Tex-Mex Inspired Cuisine Considerable Dining Value with Broad Customer Appeal Upbeat Atmosphere Coupled with Irreverent Brand Helps Differentiate Concept Flexible Business Model with Industry Leading Unit Economics Deep Rooted and Inspiring Company Culture Highly Experienced Management Team 5

 $10.0 Full-Service Mexican Concepts Select Best-in-Class Concepts $8.0 $6.0 $4.0 $2.0 $6.7 $4.5 $3.7 $3.2 $2.5 $5.7 $4.8 $4.5 $4.1 $0.")
6 Industry Leading Operating Metrics 7 consecutive years of comparable restaurant sales growth Comparable restaurant base generated LTM average unit volumes of $4.5 million Highest volume restaurant had LTM sales of $9.1 million Serve approximately 306,000 customers per location per year, on average Comparable restaurant base generated LTM restaurant-level operating margins of 21.1% Average Unit Volume ($Millions) $10.0 Full-Service Mexican Concepts Select Best-in-Class Concepts $8.0 $6.0 $4.0 $2.0 $6.7 $4.5 $3.7 $3.2 $2.5 $5.7 $4.8 $4.5 $4.1 $0.0 6 Source: Calculations based on Company Filings and 2017 Technomic Industry Report as of most recent available fiscal year and estimates. Chuy s based on latest filed LTM period.


7 Proven Concept with Over a 30-Year History 75 new restaurants opened and 16 new states entered during the last 111 months Founded in Austin Pre-2008 Restaurants Restaurants Opened Since Acquired by Goode Partners (Nov ) 2007 Steve Hislop joined as President & CEO Onset of growth initiatives Opened first location outside of TX (Nashville) Opened in AL, KY and TN Opened in IN, KY, TN and GA Opened in FL, OK, TN and KY Opened in AR, FL, VA, NC, SC, MO and OH Opened in AR, IN, FL, NC, VA and GA Opened in AL, AR, FL, OH and OK Opened in VA, LA, NC, TN, FL and MD April 2017 Opened in GA & OH 7 Total Restaurants at End of Period


8 Fresh, Authentic Mexican Cuisine Offer authentic Mexican food using only the freshest ingredients Recipes and cooking techniques originated from friends and family of our founders, who are from Mexico, New Mexico and Texas Commitment to made-from-scratch, freshly prepared cooking Generous portions support value priced offering Customizable food offering is core to the Chuy s concept 8


9 We Take One Thing Seriously: Our Food! Tex-Mex Ranchero Hatch Green Chile Green Chile Tomatillo Deluxe Tomatillo Creamy Jalapeno Homemade Sauces Chicka-Chicka Boom-Boom Freshly-roasted, hand-pulled chicken & cheese with Boom- Boom sauce, made with cheese, roasted New Mexican green chiles, tomatillos, green onions, cilantro and lime juice. Served with choice of Mexican or green chile rice & refried or charro beans Price: $10.79 Big As Yo Face Burritos A homemade, 12 flour tortilla stuffed with refried beans, cheese and choice of beef or chicken. Served with choice of sauce & choice of Mexican or green chile rice Price: $ $10.59 Texas Martini Served shaken, not stirred, this south-of-the-border martini features tequila, Patrón Citrónge, fresh lime juice and a jalapeño-stuffed olive Three drinks for the price of one Price: $ Note: Prices above represent menu prices in Texas and Oklahoma as of March 26, 2017 which may vary from prices in other states.
 Average check of $14.51 $30.0 Average Check $25.86 $25.0 $21.40 $20.")


10 Exceptional Dining Value Significant value proposition to customers Only 13 out of 50 menu items priced over $10.00(1) Average check of $14.51 $30.0 Average Check $25.86 $25.0 $21.40 $20.0 $15.0 $14.50 $14.51 $16.68 $17.50 $26.36 $21.40 $17.63 $10.0 $5.0 $0.0 Source: Company filings as of most recent available fiscal year and equity research, and Piper Jaffray Restaurant Benchmark Analysis: 11th Annual Cookbook, Chuy s based on latest filed LTM period. (1) Applies to our tier 1 menu as of March 26, 2017 which is in place at 38 of our 83 restaurants as of that date. 10


 Sample Offerings: Sample")


11 Chipotle vs. Chuy s Fast Casual Dining 2,198 Total Restaurants in 47 U.S. States 11.5% 2016 Unit Growth ~$11.34 Average Check (~1.0% Alcohol Mix) Full Service Dining 83 Total Restaurants in 16 U.S. States 15.9% 2016 Unit Growth $14.51 Average Check (18.3% Alcohol Mix) Sample Offerings: Sample Offerings: Entrée: Chicken Burrito $6.50 Entrée: Big As Yo Face Burrito Oven-Roasted Chicken $9.99 Chips & Salsa: $1.95 Total: $ Includes a side of Rice & Beans Chips & Salsa: Unlimited & Complimentary Total: $ Note: Chipotle and Chuy s sample offerings represent menu items and prices from restaurants in the same geographic region as of December 25, Source: Company data, public filings and equity research as of December 25, Chuy s average check and alcohol mix based on latest filed LTM period.


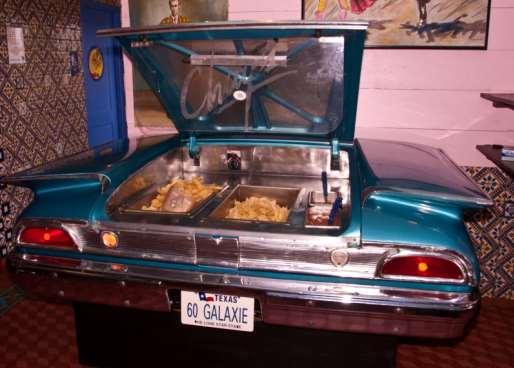


12 Upbeat Atmosphere and Appealing, Irreverent Brand 12
13 Growth Opportunities 13


14 Enhanced Restaurant Development Strategy Identify & pursue development in major markets Backfill smaller existing markets to build brand awareness Flexible real estate strategy Conversions and new prototype construction Enhancements to Real Estate Dept. Plan to double restaurant base in next 3 to 5 years. 12 new units opened in to 14 new units expected in 2017 Pre Hub Locations 2015 Note: Map as of May 2017
 LTM Comparable Restaurants Blended Target Actual (7) Target Actual (7) Target Target Target Actual (7) Average Unit Volume $4,542 $3,750 (1)")
 $2,000 (6) 3,125 $3,100 $2,400 $1,650 $750 $785 $1,800 Customers Served Per Year (3) ~306,000 -- -- -- -- -- -- -- Sales to Investment Ratio 1.9x (4) 1.5x 1.4x 1.")
15 Industry Leading New Unit Economics Targeted cash-on-cash return beginning in the third operating year of ~30.0% and a sales to investment ratio of 1.9x. Casual Dining Fast Casual New Unit Economics ($000s) LTM Comparable Restaurants Blended Target Actual (7) Target Actual (7) Target Target Target Actual (7) Average Unit Volume $4,542 $3,750 (1) $4,802 $4,500 $3,139 $1,800 $1,300 $1,500 $2,400 Restaurant-Level Operating Profit % Margin 21.1% 15.0% % 18.7% 19.0% 17.7% 19.0% 18.0% 15.0% 22.6% Average Cash Investment $2,000 (2) $2,000 (6) 3,125 $3,100 $2,400 $1,650 $750 $785 $1,800 Customers Served Per Year (3) ~306, Sales to Investment Ratio 1.9x (4) 1.5x 1.4x 1.4x 1.1x 1.7x 1.9x 1.3x Cash-on-Cash Return ~30% (5) 28.7% 27.5% 24.0% 20.0%+ 30.0%+ 30.0%+ 30.0%+ Source: Public filings and equity research estimates. Note: Cash-on-Cash Return defined as Restaurant-Level Operating Profit divided by Net Cash Investment excluding Pre-Opening Expense. (1) Represents targeted Normalized Average Unit Volume. (2) Represents Average cash investment based on historical new restaurant openings less land lord allowances and excludes preopening expenses. (3) Estimated as Average Unit Volume divided by LTM Average Check. (4) Represents targeted Year 3 Sales: Investment Ratio. (5) Represents targeted Year 3 Cash-on-Cash Return. (6) Represents targeted cash investment less land lord allowances and excludes preopening expenses. (7) Based on actual data per most recent filing. 15
16 Financial Summary 16
17 Seven Straight Years of Comparable Restaurant Sales Growth 4.0% Comparable Sales Growth 3.0% 2.0% 3.1% 3.3% 3.1% 1.0% 2.2% (1) 2.3% 0.0% 0.7% 0.8% -0.7% -1.0% Q KNAPP-TRACK SSS (0.6%) 1.5% 0.6% (1.4%) (0.2%) 1.0% (1.5%) (1.1%) Number of Comparable Restaurants Note: KNAPP-TRACK is a monthly sales and guest count tracking service for the full service restaurant market in the United States. Source: KNAPP-TRACK and Company data. (1) Adjusted to remove impact of the 53 rd week and extra 1.5 operating days in fiscal 2012.

18 Demonstrated Revenue and Unit Growth Revenue ($Millions) $350 $300 $250 $200 $150 $100 $50 $0 $330.6 $287.1 $245.1 $204.4 $172.6 $130.6 $78.1 $ Q Q Total Restaurants Q Q
 Commodity Basket % s 30.0% 27.5% 28.")


19 Consistent Cost of Sales Management Cost of Sales (% of Revenue) Commodity Basket % s 30.0% 27.5% 28.2% 27.7% 26.9% 27.4% 18.5% 24.4% 25.0% 26.4% 25.9% 25.6% 25.1% 11.0% 13.3% 15.6% 22.5% 17.2% 20.0% YTD Q YTD Q Groceries Produce Beef Dairy Chicken Bar & Other 19
20 Increasing Restaurant-Level Operating Profit and Adjusted EBITDA $60.0 $50.0 $40.0 $30.0 $20.0 $10.0 $0.0 Total Restaurants: $25.0 Restaurant-Level EBITDA % Margin $34.8 Restaurant-Level Operating Profit ($Millions) $39.1 $42.5 $56.5 $63.8 $15.9 $ % 20.2% 19.1% 17.3% 19.7% 19.3% 20.4% 19.1% YTD Q YTD Q % 60.0% 45.0% 30.0% 15.0% 0.0% Adjusted EBITDA ($Millions) $55.0 $45.0 $35.0 $25.0 $15.0 $5.0 $46.3 $40.3 $30.8 $29.1 $25.5 $18.9 $11.4 $ YTD Q YTD Q Note: Restaurant-Level Operating Profit represents income from operators plus the sum of general and administrative expenses, the advisory agreement termination fee, the settlement with our former director, offering costs, restaurant pre-opening costs, loss on asset impairment, closure costs, and depreciation and amortization. Note: Adjusted EBITDA represents net income before interest, taxes, depreciation and amortization plus the sum of restaurant pre-opening costs, loss on asset impairment, closure costs, deferred compensation, the advisory agreement termination fee, the settlement with our former director, offering costs, management fees and expenses and special one-time bonus payment.
21 Balance Sheet December 27, December 25, March 26, Cash $ 8.5 $ 13.7 $ 14.2 Other Current Assets Property & Equipment, Net Other Long-Term Assets Total Assets $ $ $ Current Liabilities $ 25.0 $ 28.1 $ 27.1 Debt Other Long-Term Liabilities Total Liabilities Total Equity Total Liabilities and Equity $ $ $

22 Fiscal Year 2017 Guidance Comparable restaurant sales growth of approx. 0.5% to 1.5% (on a 52-week comparable basis) Restaurant pre-opening expenses of approx. $5.8 million to $6.3 million General and administrative expense of approx. $20.6 million to $21.1 million An effective tax rate of approx. 29% to 31% 12 to 14 new restaurants to open during 2017 Total capital expenditures (net of tenant improvement allowances) of approx. $39.0 million to $44.0 million 22


23 Appendix 23
24 Restaurant-Level Operating Profit Restaurant-Level Operating Profit Reconciliation FY 2011 FY 2012 FY 2013 FY 2014 FY 2015 FY 2016 YTD Q YTD Q Income from operations as reported $ 9.5 $ 13.3 $ 15.4 $ 15.9 $ 18.7 $ 24.3 $ 6.5 $ 6.5 General and administration Advisory agreement termination Offering costs Settlement with former director Loss on asset impairment Closure costs Restaurant pre-opening Depreciation and amortization Restaurant-Level Operating Profit $ 25.0 $ 34.8 $ 39.1 $ 42.5 $ 56.5 $ 63.8 $ 15.9 $
25 Adjusted EBITDA Reconciliation Adjusted EBITDA Reconciliation FY 2011 FY 2012 FY 2013 FY 2014 FY 2015 FY 2016 YTD Q YTD Q Net Income $ 3.5 $ 5.5 $ 11.1 $ 11.5 $ 12.9 $ 17.2 $ 4.5 $ 4.6 Income tax provision Interest expense Depreciation and amortization EBITDA $ 13.9 $ 19.8 $ 24.3 $ 26.2 $ 31.5 $ 39.5 $ 9.9 $ 10.7 Deferred compensation Management fees & expenses Advisory agreement termination Offering costs Settlement with former director Loss on asset impairment Closure costs Restaurant pre-opening Special one-time bonus payment Adjusted EBITDA $ 18.9 $ 25.5 $ 29.1 $ 30.8 $ 40.3 $ 46.3 $ 11.4 $
Baird s 2018 Global Consumer, Technology & Services Conference
 Baird s 2018 Global Consumer, Technology & Services Conference Cautionary Statements Forward Looking Statements This presentation may include forward looking statements. These statements reflect the current
Company Presentation January 2013
 Company Presentation January 2013 Cautionary Statements Forward-Looking Statements This presentation may include forward-looking statements. These statements reflect the current views of the Company s
Chuy s Holdings, Inc. Announces Fourth Quarter and Fiscal Year 2017 Financial Results
 Chuy s Holdings, Inc. Announces Fourth Quarter and Fiscal Year Financial Results March 8, 2018 AUSTIN, Texas--(BUSINESS WIRE)--Mar. 8, 2018-- Chuy s Holdings, Inc. (NASDAQ:CHUY) today announced financial
Chuy s Holdings, Inc. Announces Second Quarter 2018 Financial Results
 Announces Second Quarter 2018 Financial Results August 9, 2018 AUSTIN, Texas--(BUSINESS WIRE)--Aug. 9, 2018-- (NASDAQ:CHUY) today announced financial results for the second quarter ended July 1, 2018.
CHUY'S HOLDINGS, INC.
 CHUY'S HOLDINGS, INC. FORM 10-K (Annual Report) Filed 03/10/16 for the Period Ending 12/27/15 Address 1623 TOOMEY ROAD AUSTIN, TX 78704 Telephone 512-473-2783 CIK 0001524931 Symbol CHUY SIC Code 5812 -
CHUY'S HOLDINGS, INC.
 CHUY'S HOLDINGS, INC. FORM 10-K (Annual Report) Filed 03/11/14 for the Period Ending 12/29/13 Address 1623 TOOMEY ROAD AUSTIN, TX 78704 Telephone 512-473-2783 CIK 0001524931 Symbol CHUY SIC Code 5812 -
Investor Presentation March
 1 Investor Presentation March 2016 Presenters 2 Tim Taft President & Chief Executive Officer President & Chief Executive Officer Lynn Schweinfurth Chief Financial Officer Forward-looking Statements 3 This
Small Talk Chuy s Holdings
 Small Talk Chuy s Holdings Disclaimer The information in this presentation is for educational purposes only and is not intended to be a recommendation to purchase or sell any of the stocks, mutual funds,
Investor Presentation. January 2017
 Investor Presentation January 2017 Forward-Looking Statements Forward-Looking Statements This presentation contains forward-looking statements that are subject to risks and uncertainties. All statements
30 th Annual Raymond James Institutional Investors Conference March 11, 2009
 30 th Annual Raymond James Institutional Investors Conference March 11, 2009 Safe Harbor Statement Under the Private Securities i Litigation i i Reform Act of 1995 Our presentation includes, and our response
INVESTOR PRESENTATION
 INVESTOR PRESENTATION DECEMBER 2014 Forward-Looking Statements This contains forward-looking statements within the meaning of Section 27A of the Securities Act of 1933, as amended, and Section 21E of the
Diversified Restaurant Holdings, Inc. Wedbush Securities 2013 CA Dreamin Consumer Conference December 10, 2013
 Diversified Restaurant Holdings, Inc. Wedbush Securities 2013 CA Dreamin Consumer Conference December 10, 2013 Michael Ansley President, CEO & Board Chairman David G. Burke Chief Financial Officer & Treasurer
Investor Presentation January 29, 2018
 Investor Presentation January 29, 2018 Safe Harbor Statement Statements made in this presentation and on the conference call, including statements made during the question-and-answer session, regarding
Good Times Restaurants Inc.
 (Nasdaq Capital Market: GTIM) Investor Presentation June 2015 Disclaimer The information in this presentation does not contain all of the information that a potential investor should review before investing
Investor Presentation. Russ Bendel Chief Executive Officer. Ira Fils Chief Financial Officer. May 2015 AND
 Investor Presentation May 2015 Russ Bendel Chief Executive Officer AND Ira Fils Chief Financial Officer Forward Looking Statements Forward Looking Statements This presentation contains forward looking
Nasdaq Capital Market: GTIM Investor Presentation June 2018
 Nasdaq Capital Market: GTIM Investor Presentation June 2018 Forward-Looking Statements and Non-GAAP Financial Information Forward-Looking Statements This presentation contains forward-looking statements.
(1) Based on unit count (2) Represents FY2016 sales data on a 52 week basis and unit counts as of Q2 FY2017 (3) Represents system-wide sales for
 Based on unit count (2) Represents FY2016 sales data on a 52 week basis and unit counts as of Q2 FY2017 (3) Represents system-wide sales for") (1) Based on unit count (2) Represents FY2016 sales data on a 52 week basis and unit counts as of Q2 FY2017 (3) Represents system-wide sales for fiscal 2016 on a 52 week basis and unit count as of January
(1) Based on unit count (2) Represents FY2016 sales data on a 52 week basis and unit counts as of Q2 FY2017 (3) Represents system-wide sales for fiscal 2016 on a 52 week basis and unit count as of January
Investor Presentation March 2015
 Investor Presentation March 2015 Disclaimer This Investor Presentation (the Investor Presentation ) is for informational purposes only and does not constitute an offer to sell, a solicitation of an offer
WEEKS ENDED. Adjusted diluted earnings per share* $ 0.46 $ 0.50 $ (0.04)
") May 9, 2014 Bloomin' Brands, Inc. Announces Fiscal 2014 First Quarter Adjusted Diluted Earnings Per Share of $0.46 and GAAP Diluted Earnings Per Share of $0.42; Reaffirms Full-Year 2014 Guidance Including
May 9, 2014 Bloomin' Brands, Inc. Announces Fiscal 2014 First Quarter Adjusted Diluted Earnings Per Share of $0.46 and GAAP Diluted Earnings Per Share of $0.42; Reaffirms Full-Year 2014 Guidance Including
Del Taco Restaurants, Inc. (Exact name of registrant as specified in its charter)
") UNITED STATES SECURITIES AND EXCHANGE COMMISSION WASHINGTON, DC 20549 FORM 8-K CURRENT REPORT Pursuant to Section 13 or 15(d) of the Securities Exchange Act of 1934 Date of Report (Date of earliest event
UNITED STATES SECURITIES AND EXCHANGE COMMISSION WASHINGTON, DC 20549 FORM 8-K CURRENT REPORT Pursuant to Section 13 or 15(d) of the Securities Exchange Act of 1934 Date of Report (Date of earliest event
INVESTOR PRESENTATION SEPTEMBER 2018
 INVESTOR PRESENTATION SEPTEMBER 2018 Forward-Looking Statements Forward looking statements This presentation includes statements that are, or may deemed to be, forward-looking statements. These forward-looking
Investor Presentation. September 2015
 Investor Presentation September 2015 Forward-Looking Statements CAUTIONARY STATEMENT This presentation contains forward looking statements, which include all statements that do not relate solely to historical
For additional information contact: DRG&L / Ken Dennard / Sheila Stuewe Investor Relations FOR IMMEDIATE RELEASE
 FOR IMMEDIATE RELEASE For additional information contact: DRG&L / 713-529-6600 Ken Dennard / Sheila Stuewe Investor Relations Luby s Reports Fiscal Fourth Quarter and Full Year Results ~ Store Level Profit
El Pollo Loco Holdings, Inc. Announces First Quarter 2015 Financial Results
 May 14, 2015 El Pollo Loco Holdings, Inc. Announces First Quarter 2015 Financial Results COSTA MESA, Calif., May 14, 2015 (GLOBE NEWSWIRE) -- El Pollo Loco Holdings, Inc. (Nasdaq:LOCO) today announced
Luby s Reports Third Quarter Fiscal 2016 Results
 For additional information contact: FOR IMMEDIATE RELEASE Dennard-Lascar Associates Rick Black / Ken Dennard Investor Relations 713-529-6600 Luby s Reports Third Quarter Fiscal Results Luby s Cafeterias
Q Financial Results. May 4, 2017
 Q1 2017 Financial Results May 4, 2017 Safe Harbor The information made available in this presentation contains forward-looking statements which reflect the Company s current view of future events, results
Comparative Revenues and Revenue Forecasts Prepared By: Bureau of Legislative Research Fiscal Services Division State of Arkansas
 Comparative Revenues and Revenue Forecasts 2010-2014 Prepared By: Bureau of Legislative Research Fiscal Services Division State of Arkansas Comparative Revenues and Revenue Forecasts This data shows tax
INVESTOR PRESENTATION JANUARY 2018
 INVESTOR PRESENTATION JANUARY 2018 0 FORWARD-LOOKING STATEMENTS Forward-Looking Statements This presentation contains forward-looking statements that are subject to risks and uncertainties. All statements
INVESTOR PRESENTATION JUNE 2018
 INVESTOR PRESENTATION JUNE 2018 0 FORWARD-LOOKING STATEMENTS Forward-Looking Statements This presentation contains forward-looking statements that are subject to risks and uncertainties. All statements
Q Financial Results. August 3, 2017
 Q2 2017 Financial Results August 3, 2017 Safe Harbor The information made available in this presentation contains forward-looking statements which reflect the Company s current view of future events, results
LEVY ACQUISITION CORP
 LEVY ACQUISITION CORP FORM DEFA14A (Additional Proxy Soliciting Materials (definitive)) Filed 05/11/15 Address 444 NORTH MICHIGAN AVENUE SUITE 3500 CHICAGO, IL 60611 Telephone 312-267-4190 CIK 0001585583
Luby s Reports Fourth Quarter Fiscal 2011 Results
 For additional information contact: FOR IMMEDIATE RELEASE DRG&L / 713-529-6600 Ken Dennard / Sheila Stuewe Investor Relations Luby s Reports Fourth Quarter Fiscal Results HOUSTON, TX November 9, Luby s,
Del Taco Restaurants, Inc. Reports Fiscal Fourth Quarter and Fiscal Year 2017 Financial Results
 NEWS RELEASE Del Taco Restaurants, Inc. Reports Fiscal Fourth Quarter and Fiscal Year 2017 Financial Results 3/14/2018 System-wide comparable restaurant sales growth of 2.4% in Fiscal Fourth Quarter Announces
The Acquisition of Regions Insurance Group. April 6, 2018
 The Acquisition of Regions Insurance Group April 6, 2018 Forward-Looking Statements This presentation contains "forward-looking statements" within the meaning of the Private Securities Litigation Reform
Del Taco Restaurants, Inc. (Exact name of registrant as specified in its charter)
") UNITED STATES SECURITIES AND EXCHANGE COMMISSION WASHINGTON, DC 20549 FORM 8-K CURRENT REPORT Pursuant to Section 13 or 15(d) of the Securities Exchange Act of 1934 Date of Report (Date of earliest event
UNITED STATES SECURITIES AND EXCHANGE COMMISSION WASHINGTON, DC 20549 FORM 8-K CURRENT REPORT Pursuant to Section 13 or 15(d) of the Securities Exchange Act of 1934 Date of Report (Date of earliest event
CAUTIONARY STATEMENTS
 INVESTOR PRESENTATION NOVEMBER 2017 2 CAUTIONARY STATEMENTS Forward-Looking Statements This presentation includes statements that express our opinions, expectations, beliefs, plans, objectives, assumptions
Investor Presentation
 Investor Presentation November 2014 Michael Ansley President, CEO & Board Chairman David G. Burke Chief Financial Officer & Treasurer Safe Harbor Statement The information made available in this presentation
Luby s Reports Second Quarter Fiscal 2011 Results
 For additional information contact: FOR IMMEDIATE RELEASE DRG&L / 713-529-6600 Ken Dennard / Sheila Stuewe Investor Relations Luby s Reports Second Quarter Fiscal 2011 Results HOUSTON, TX March 10, 2011
Fiesta Restaurant Group, Inc. Reports Fourth Quarter and Full Year 2012 Results
 FOR IMMEDIATE RELEASE Investor Relations Contact: Raphael Gross 203-682-8253 investors@frgi.com Reports Fourth Quarter and Full Year 2012 Results Addison, TX - (Businesswire) - February 28, 2013 - ( Fiesta
Successful Execution of Business Transformation Driving Sustainable Growth. CL King 15 th Annual Best Ideas Conference 2017 September 14, 2017
 Successful Execution of Business Transformation Driving Sustainable Growth CL King 15 th Annual Best Ideas Conference 2017 September 14, 2017 Preliminary Statements Forward Looking Statements This document
Fogo de Chão, Inc. Reports Third Quarter 2017 Results
 Fogo de Chão, Inc. Reports Third Quarter Results Dallas, Texas, (November 7, ) - Fogo de Chão, Inc. (NASDAQ: FOGO) today reported financial results for its 13-week fiscal third quarter ended October 1,.
UNITED STATES SECURITIES AND EXCHANGE COMMISSION Washington, D.C FORM 8-K
 UNITED STATES SECURITIES AND EXCHANGE COMMISSION Washington, D.C. 20549 FORM 8-K CURRENT REPORT Pursuant to Section 13 or 15(d) of the Securities Exchange Act of 1934 Date of Report (Date of earliest event
Noodles & Company Announces Fourth Quarter and Fiscal Year 2014 Financial Results
 February 19, 2015 Noodles & Company Announces Fourth Quarter and Fiscal Year 2014 Financial Results BROOMFIELD, Colo., Feb. 19, 2015 (GLOBE NEWSWIRE) -- Noodles & Company (Nasdaq:NDLS) today announced
THREE MONTHS ENDED MARCH 31, $ Change Diluted earnings per share $ 0.50 $ 0.47 $ 0.03 Adjustments (1) 0.02 (0.02)
 0.02 (0.02)") April 30, 2013 Bloomin' Brands, Inc. Announces First Quarter Adjusted Diluted Earnings Per Pro Forma Share of $0.50 and GAAP Diluted Earnings Per Share of $0.50; Raises Full-Year 2013 Guidance for Adjusted
April 30, 2013 Bloomin' Brands, Inc. Announces First Quarter Adjusted Diluted Earnings Per Pro Forma Share of $0.50 and GAAP Diluted Earnings Per Share of $0.50; Raises Full-Year 2013 Guidance for Adjusted
Cracker Barrel Reports Results for Third Quarter Fiscal 2014
 May 28, 2014 Cracker Barrel Reports Results for Third Quarter Fiscal 2014 Adjusted EPS increased 20.6% over EPS in prior year quarter LEBANON, Tenn.--(BUSINESS WIRE)-- Cracker Barrel Old Country Store,
Mattress Firm s Pending Acquisition of Sleepy s November 30, 2015
 Mattress Firm s Pending Acquisition of Sleepy s November 0, 2015 Forward Looking Statements and Non-GAAP Information This presentation contains forward-looking statements within the meaning of federal
EARNINGS CALL. FISCAL 2018: Q3 RESULTS March 22, 2018
 EARNINGS CALL FISCAL 2018: Q3 RESULTS March 22, 2018 Disclaimer/Non-GAAP Information IMPORTANT NOTICE The following slides are part of a presentation by Darden Restaurants, Inc. (the "Company") and are
Investor Deck. March, 2018 NASDAQ: BURG NASDAQ: BURG 1
 Investor Deck March, 2018 NASDAQ: BURG NASDAQ: BURG 1 This Is Our Story Chanticleer Holdings was formed and went public in June 2005 as a BDC (investment company) led by CEO Mike Pruitt and two financial
Luby s Reports Third Quarter Fiscal 2011 Results
 For additional information contact: FOR IMMEDIATE RELEASE DRG&L / 713-529-6600 Ken Dennard / Sheila Stuewe Investor Relations Luby s Reports Third Quarter Fiscal 2011 Results HOUSTON, TX June 8, 2011 Luby
Cracker Barrel Reports Results for Second Quarter Fiscal 2015 and Increases Earnings Guidance for Fiscal 2015
 February 24, 2015 Cracker Barrel Reports Results for Second Quarter Fiscal 2015 and Increases Earnings Guidance for Fiscal 2015 Adjusted EPS increased to $1.93 compared to $1.56 in the prior year quarter
CRACKER BARREL REPORTS FOURTH QUARTER AND FULL YEAR FISCAL 2012 RESULTS AND PROVIDES GUIDANCE FOR FISCAL 2013
 Investor Contact: Media Contact: Lawrence E. Hyatt (615) 235-4432 Julie K. Davis (615) 443-9266 CRACKER BARREL REPORTS FOURTH QUARTER AND FULL YEAR FISCAL 2012 RESULTS AND PROVIDES GUIDANCE FOR FISCAL
Investor Presentation January 2013
 Investor Presentation January 2013 Texas Roadhouse, Inc Safe Harbor Statement and Reconciliation of Non-GAAP Financial Measures Under the Private Securities Litigation Reform Act of 1995 Certain statements
Cracker Barrel Reports Fourth Quarter and Full Year Fiscal 2015 Results and Provides Guidance for Fiscal 2016
 September 16, 2015 Cracker Barrel Reports Fourth Quarter and Full Year Fiscal 2015 Results and Provides Guidance for Fiscal 2016 Positive Comparable Store Sales and Traffic in Fourth Quarter and Full Fiscal
Investor Update Business Transformation Delivering Results
 Investor Update Business Transformation Delivering Results September 13, 2016 Preliminary Statements Forward Looking Statements This document contains certain forward-looking statements. These statements
Second Quarter 2018 Results
 Second Quarter 2018 Results August 21, 2018 CLASSIFIED INTERNAL USE ONLY Forward-Looking Statements Forward-looking statements in this presentation regarding the Company s future performance, restaurant
Q4 and FY 2017 Financial Results. March 9, 2018
 and Financial Results March 9, 2018 Safe Harbor The information made available in this presentation contains forward looking statements which reflect the Company s current view of future events, results
El Pollo Loco Holdings, Inc. Common Stock
 PROSPECTUS 7,142,857 Shares El Pollo Loco Holdings, Inc. Common Stock We are offering shares of our common stock. This is our initial public offering and no public market currently exists for our common
American Realty Capital Properties Investor Presentation September 2014
 American Realty Capital Properties Investor Presentation September 2014 www.arcpreit.com :: NASDAQ: ARCP Forward-Looking Statements Information set forth herein (including information included or incorporated
EARNINGS CALL. FISCAL 2018: Q4 & ANNUAL RESULTS June 21, 2018
 EARNINGS CALL FISCAL 2018: Q4 & ANNUAL RESULTS June 21, 2018 Disclaimer/Non-GAAP Information IMPORTANT NOTICE The following slides are part of a presentation by Darden Restaurants, Inc. (the "Company")
McCormick & Company, Inc.
 McCormick & Company, Inc. Bernstein Strategic Decisions Conference May 30, 2018 FORWARD-LOOKING INFORMATION Certain information contained in this release, including statements concerning expected performance
EARNINGS CALL. FISCAL 2018: Q2 RESULTS December 19, 2017
 EARNINGS CALL FISCAL 2018: Q2 RESULTS December 19, 2017 Disclaimer/Non-GAAP Information IMPORTANT NOTICE The following slides are part of a presentation by Darden Restaurants, Inc. (the "Company") and
Investor Presentation September 2012
 Investor Presentation September 2012 T. Michael Ansley President & Chief Executive Officer David G. Burke Chief Financial Officer & Treasurer OTCQB : DFRH www.diversifiedrestaurantholdings.com Safe Harbor
El Pollo Loco Holdings, Inc. Announces Second Quarter 2014 Financial Results
 September 4, 2014 El Pollo Loco Holdings, Inc. Announces Second Quarter 2014 Financial Results COSTA MESA, CA - September 4, 2014 - El Pollo Loco Holdings, Inc. (Nasdaq: LOCO) today announced financial
Second 13, focused onn. to five units in. beginning of the. same storee
 FOR IMMEDIATE RELEASE Luby s Reports Second For additional information contact: Dennard-Lascar Associates 713-529-6600 Ken Dennard / Sheila Stuewe Investor Relations Quarter Fiscal Results HOUSTON, TX
Dougherty & Company Institutional Investor Conference
 Dougherty & Company Institutional Investor Conference September 19, David Burke, Chief Executive Officer Phyllis Knight, Chief Financial Officer Safe Harbor The information made available in this presentation
Cracker Barrel Reports Fourth Quarter And Full Year Fiscal 2017 Results And Provides Guidance For Fiscal 2018
 September 13, 2017 Cracker Barrel Reports Fourth Quarter And Full Year Fiscal 2017 Results And Provides Guidance For Fiscal 2018 Fourth Quarter Comparable Store Traffic and Restaurant Sales Outperformed
Investor Presentation November 2015
 Investor Presentation November 2015 Disclaimer Forward-Looking Information This presentation contains forward-looking statements, as defined in the Private Securities Litigation Reform Act of 1995, which
FIESTA RESTAURANT GROUP, INC. (Exact name of Registrant as specified in its charter)
") UNITED STATES SECURITIES AND EXCHANGE COMMISSION WASHINGTON, DC 20549 FORM 10-Q ý QUARTERLY REPORT PURSUANT TO SECTION 13 OR 15 (d) OF THE SECURITIES EXCHANGE ACT OF 1934 For the quarterly period ended
UNITED STATES SECURITIES AND EXCHANGE COMMISSION WASHINGTON, DC 20549 FORM 10-Q ý QUARTERLY REPORT PURSUANT TO SECTION 13 OR 15 (d) OF THE SECURITIES EXCHANGE ACT OF 1934 For the quarterly period ended
Zoe's Kitchen, Inc. Common Stock
 Filed Pursuant to Rule 424(B)(4) Registration No. 333-197682 PROSPECTUS 4,500,000 SHARES Zoe's Kitchen, Inc. Common Stock Zoe's Kitchen, Inc. is offering 94,100 shares of common stock. The selling stockholders
Cracker Barrel Reports Results for Third Quarter Fiscal 2013
 June 3, 2013 Cracker Barrel Reports Results for Third Quarter Fiscal 2013 Positive Comparable Store Traffic, Restaurant and Retail Sales in Quarter Diluted EPS Increased 19% Compared with Adjusted EPS
Q Investor Presentation. November 2, 2018
 Q3 08 Investor Presentation November, 08 Disclaimer FORWARD-LOOKING STATEMENTS. The financial results in this presentation reflect preliminary unaudited results, which are not final until the Form 0-Q
BOB EVANS REPORTS FISCAL 2015 FOURTH-QUARTER AND FULL-YEAR RESULTS; PROVIDES FISCAL YEAR 2016 OUTLOOK
 BOB EVANS REPORTS FISCAL FOURTH-QUARTER AND FULL-YEAR RESULTS; PROVIDES FISCAL YEAR 2016 OUTLOOK Q4 net sales total $332.4 million, an increase of $6.0 million, or 1.8 percent. GAAP net income of $0.24
EARNINGS CALL. FISCAL 2018: Q1 RESULTS September 26, 2017
 EARNINGS CALL FISCAL 2018: Q1 RESULTS September 26, 2017 Disclaimer/Non-GAAP Information IMPORTANT NOTICE The following slides are part of a presentation by Darden Restaurants, Inc. (the "Company") and
FIESTA RESTAURANT GROUP, INC.
 FIESTA RESTAURANT GROUP, INC. FORM 8-K (Current report filing) Filed 08/05/14 for the Period Ending 08/05/14 Address 14800 LANDMARK BOULEVARD, SUITE 500 ADDISON, TX 75254 Telephone 972-702-9300 CIK 0001534992
Investor Presentation October 2018
 Investor Presentation October 2018 Safe Harbor Statement This presentation contains forward-looking statements about our current and presently expected performance trends, growth plans, business goals
Jefferies Consumer Conference June 2017
 Jefferies Consumer Conference June 2017 Important Information Forward Looking Statements Some of the statements contained in this presentation constitute forward looking statements within the meaning of
GRILLIT, INC. For the Nine Months ended September 30, 2015 TIN:
 For the Nine Months ended September 30, 2015 TIN: 45-1212958 General Disclosure Information 1) Name of the issuer and its predecessors Grillit, Inc. (In the process of changing the name to Healthy & Tasty
Cracker Barrel Reports Results for Second Quarter Fiscal 2017 and Reaffirms Earnings Guidance for Fiscal 2017
 February 21, 2017 Cracker Barrel Reports Results for Second Quarter Fiscal 2017 and Reaffirms Earnings Guidance for Fiscal 2017 Eleventh Consecutive Quarter of Positive Comparable Restaurant Sales Growth
Cautionary Statement Regarding Risks and Uncertainties That May Affect Future Results
 1 Cautionary Statement Regarding Risks and Uncertainties That May Affect Future Results This presentation may contain forward-looking statements within the meaning of the Private Securities Litigation
Texas Economic Outlook: Cruising in Third Gear
 Texas Economic Outlook: Cruising in Third Gear Keith Phillips Assistant Vice President and Senior Economist 1/19/17 The views expressed in this presentation are strictly those of the presenter and do not
February 11, Whole Foods Market, Inc. (NASDAQ: WFM) today reported results for the 16-week first quarter ended January 18, 2015.
 today reported results for the 16-week first quarter ended January 18, 2015.") Whole Foods Market Delivers Record Q1 Sales and EPS Comparable Store Sales Increase 4.5%, Accelerating on a One- and Two-Year Basis due Primarily to Traffic Growth; Sales Increase 10% to Record $4.7 billion;
Whole Foods Market Delivers Record Q1 Sales and EPS Comparable Store Sales Increase 4.5%, Accelerating on a One- and Two-Year Basis due Primarily to Traffic Growth; Sales Increase 10% to Record $4.7 billion;
Investor Presentation. Wells Fargo Conference October 2012
 Investor Presentation Wells Fargo Conference October 2012 Disclaimer This presentation contains forward-looking statements, as defined by federal and state securities laws. Forwardlooking statements include
Q Investor Presentation
 Q3 2017 Investor Presentation FORWARD-LOOKING STATEMENTS This presentation contains forward-looking statements within the meaning of the Private Securities Litigation Reform Act of 1995. These statements
Q4 AND FULL-YEAR 2017 INVESTOR PRESENTATION. February 23, 2018
 Q4 AND FULL-YEAR 207 INVESTOR PRESENTATION February 23, 208 DISCLAIMERS FORWARD-LOOKING STATEMENTS. The financial results in this presentation reflect preliminary unaudited results, which are not final
Oppenheimer 18 th Annual Consumer Conference June 20, 2018
 Oppenheimer 18 th Annual Consumer Conference June 20, 2018 David Burke, Chief Executive Officer Phyllis Knight, Chief Financial Officer 1 Safe Harbor Some of the statements contained in this presentation
November 2012 Investor Presentation
 November 2012 Investor Presentation FORWARD-LOOKING STATEMENTS This presentation and our accompanying comments include forward-looking statements. These statements relate to future events or our future
Noble Roman s Announces 2018 Results; Discusses Continuing Success with New Craft Pizza & Pub and Growth in Non-Traditional Venue
 NEWS BULLETIN FOR ADDITIONAL INFORMATION, CONTACT: For Media Information: Scott Mobley, President& CEO 317/634-3377 For Investor Relations: Paul Mobley, Executive Chairman 317/634-3377 RE:NOBLE ROMAN'S,
Investor Presentation March 2016
 Investor Presentation March 2016 Forward-Looking Statements / Non-GAAP Financial Measures Forward-Looking Statements During the course of this presentation, we may make forward-looking statements or provide
Luby s Reports Fourth Quarter and Fiscal 2015 Results
 For additional information contact: FOR IMMEDIATE RELEASE Dennard-Lascar Associates 713-529-6600 Rick Black / Ken Dennard Investor Relations Luby s Reports Fourth Quarter and Fiscal Results HOUSTON, TX
First Quarter Fiscal Calendar Calculation Dates January 1, April 1, 2018 vs. December 26, March 26, 2017
 Bloomin' Brands Announces 2018 Q1 Diluted EPS of $0.68 and Adjusted Diluted EPS of $0.71; Q1 Comparable Restaurant Sales Growth of 4.3% at Outback With Positive Traffic of 2.2%; Q1 Combined Comparable
Q Supplemental Earnings Slides. November 1, 2018
 Q3 2018 Supplemental Earnings Slides November 1, 2018 1 Cautionary Note on Forward-Looking Statements This presentation contains forward-looking statements, within the meaning of the Private Securities
Dear Shareholders: Sincerely,
 Dear Shareholders: Chipotle s mission is to change the way people think about and eat fast food. At the heart of this lofty goal are two deeply held commitments. Our unique food culture results in our
Service First. Safety Always. Gabelli & Company Waste Symposium March 2018
 Service First. Safety Always. Gabelli & Company Waste Symposium March 2018 Disclaimer The information ("Confidential Information") contained in this presentation is confidential and is provided by Advanced
Investor Presentation. July 2018
 Investor Presentation July 2018 Disclaimer/Non-GAAP Information IMPORTANT NOTICE The following slides are part of a presentation by Darden Restaurants, Inc. (the "Company") and are intended to be viewed
CARS.COM. First Quarter 2018 Earnings May 9, 2018
 CARS.COM First Quarter 2018 Earnings May 9, 2018 Forward Looking Statements This presentation contains forward looking statements within the meaning of the federal securities laws, including those statements
CL King s Annual Best Ideas Conference
 WELCOME TO AMERICA S DINER CL King s Annual Best Ideas Conference September 10, 2015 Forward Looking Statements and Non-GAAP Financial Measures Denny s Corporation urges caution in considering its current
PRESS RELEASE THE CHEESECAKE FACTORY REPORTS RESULTS FOR SECOND QUARTER OF FISCAL Increases Quarterly Dividend by 14%
 PRESS RELEASE FOR IMMEDIATE RELEASE Contact: Stacy Feit (818) 871-3000 investorrelations@thecheesecakefactory.com THE CHEESECAKE FACTORY REPORTS RESULTS FOR SECOND QUARTER OF FISCAL 2018 Increases Quarterly
Bank of America Merrill Lynch Consumer & Retail Technology Conference. March 2019
 Bank of America Merrill Lynch Consumer & Retail Technology Conference March 2019 Forward Looking Statements and Safe Harbor Treatment This Presentation and any commentary provided by the Company s management
Earnings Supplement 2 nd Quarter August 5, 2016
 Earnings Supplement 2 nd Quarter 2016 August 5, 2016 Forward-Looking Statements This presentation contains forward-looking statements that involve a number of assumptions, risks and uncertainties that