Investor Presentation. Wells Fargo Conference October 2012
|
|
|
- Irene Phillips
- 5 years ago
- Views:
Transcription
1 Investor Presentation Wells Fargo Conference October 2012
2 Disclaimer This presentation contains forward-looking statements, as defined by federal and state securities laws. Forwardlooking statements include statements concerning plans, objectives, goals, strategies, expectations, intentions, projections, developments, future events, performance or products, underlying assumptions and other statements which are other than statements of historical facts. In some cases, you can identify forward-looking statements by terminology such as may, will, should, hope, expects, intends, plans, anticipates, contemplates, believes, estimates, predicts, projects, potential, continue, and other similar terminology or the negative of these terms. Forward-looking statements are only predictions that relate to future events or our future performance and are subject to known and unknown risks, uncertainties, assumptions, and other factors, including those described under Risk Factors in our prospectus, many of which are beyond our control, that may cause actual results, outcomes, levels of activity, performance, developments, or achievements expressed, anticipated or implied by these forward-looking statements. As a result, we cannot guarantee future results, outcomes, restaurant activity, performance, developments, or achievements, and there can be no assurance that our expectations, intentions, anticipations, beliefs, or projections will result or be achieved or accomplished. These forward-looking statements are made as of the date hereof and are based on current expectations, estimates, forecasts and projections as well as the beliefs and assumptions of management. Our actual results could differ materially from those stated or implied in forward-looking statements. Further, we encourage you to review the risks that we face and other information about us discussed in the Prospectus, which is available at Throughout this presentation, we reference Adjusted EBITDA and restaurant-level profit margin, which are both non-gaap financial measures. Please refer to the Appendix to this presentation as well as the Registration Statement for a discussion of Adjusted EBITDA and restaurant-level profit margin, as well as a reconciliation of those measures to the most directly comparable financial measure required by, or presented in accordance with, generally accepted accounting principles in the United States, or U.S. GAAP. 2
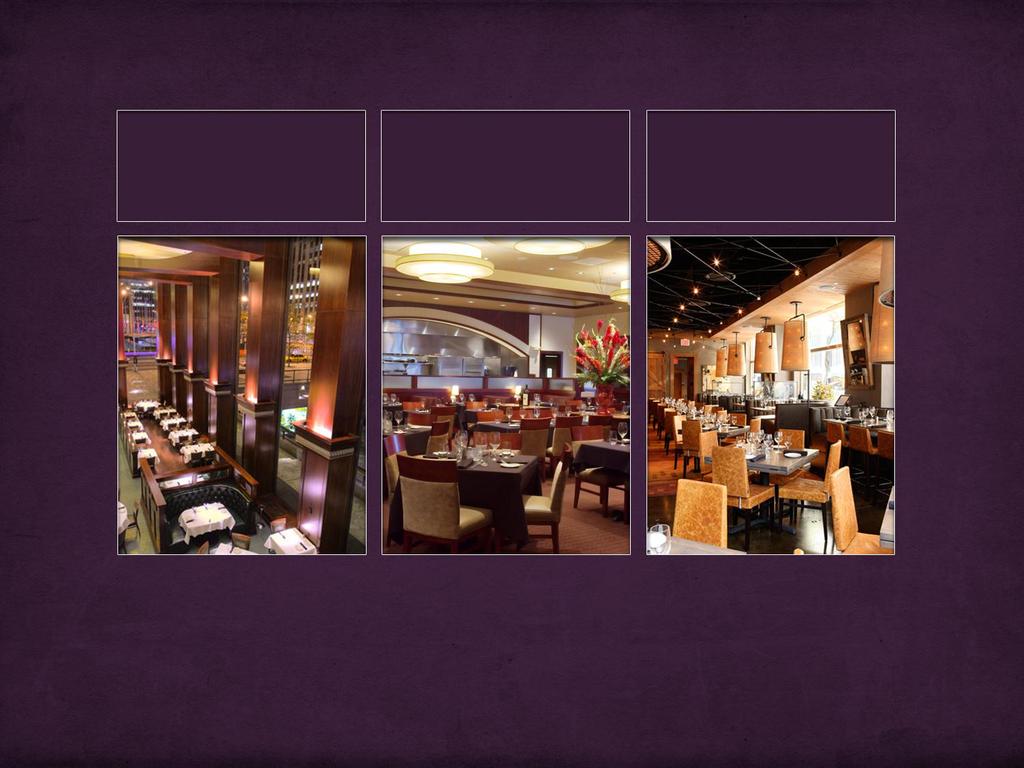
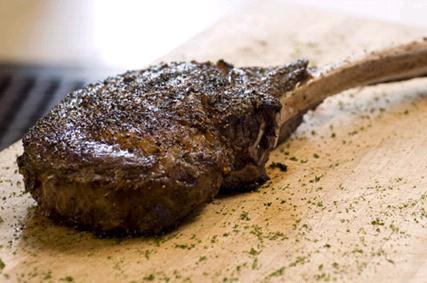
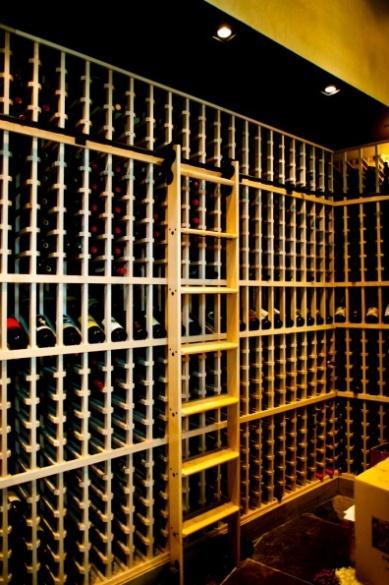
3 Del Frisco s Restaurant Group One of the premier fine dining steakhouse concepts in the U.S. Features prime beef and award-winning wine selection Vibrant energetic steakhouse Features fine handselected, aged steaks and broad offering of seafood Classic American Grille Features same steaks as Del Frisco s along with wide assortment of relatively less expensive entrees 32 restaurants 19 states LTM Revenue of $219.7 million LTM Adj. EBITDA of $42.7 million Del Frisco s Sullivan s Del Frisco s Grille 3
4 Investment Highlights Differentiated, yet highly complementary concepts Demonstrated, unique operating model Highly attractive new unit economics Significant growth opportunity for all concepts Proven management team 4


5 The Next Generation Full-Service Dining Company Food Service Bar Décor Atmosphere Limited menu Predictable flavor profile Slower, low-energy service Food brought to tables on carts Smaller, less focused bar Little emphasis on social bar scene Dark wood Dim lighting Staid Classic Traditional competitors The Del Frisco s difference Diverse menu offering for broad appeal Bolder flavor profile Swarming, upbeat service Teamwork-focused service approach Large, central bar Lively bar with signature cocktails Contemporary designs Appealing to both genders and broader age demographic Music and high energy 5

 15.0% 11.8% 12.")
 Based on stacked 2010 + 2011 comparable restaurant sales growth.")
6 2-Year cumulative comparable restaurant sales growth DFRG has Delivered Impressive Results 2011 comparable restaurant sales growth of over 11% 2011 revenue growth of 22% 2011 Adj. EBITDA growth of 22.5% 20.0% 2-Year cumulative comparable restaurant sales growth (a) 15.0% 11.8% 12.2% 15.5% 10.0% 6.7% 5.0% 0.0% 1.0% Knapp Track 2.9% a) Based on stacked comparable restaurant sales growth. Source: Company information, public filings, and Knapp Track 6
7 Differentiated, Yet Highly Complementary Concepts Average check AUV of $6.7 million across all concepts AUV $12.5m $4.4m $4.5m - $6.0m (target) $120 $100 $100 $80 $60 $40 $20 $0 $59 $53 No. of restaurants Geography Premier locations in major metro areas Mix of urban and affluent suburban locations Mix of urban and affluent suburban locations with strong lunch presence Building size 11k 24k sq. ft. 7k 11k sq. ft. 6.5k 8.5k sq. ft. Target age group


8 Del Frisco s Double Eagle Steakhouse Big and bold One of the premier steakhouse concepts in the U.S. Extensive, award-winning wine list Contemporary and classic designs Nine locations in seven states Food vs. beverage split: 66% / 34% 2011 AUV of $12.5m ($9.1m excl. NYC) 8


9 Sullivan s Steakhouse Designed as a complementary concept to Del Frisco s Fine hand-selected aged steak, fresh seafood & custom cocktails Brand resonates with a broad demographic Comfortable fine dining in a high energy atmosphere 19 locations in 15 states Food vs. beverage split: 64%/ 36% 2011 AUV of $4.4m 9


10 Del Frisco s Grille Leverages premier positioning of the Del Frisco s brand Del Frisco s prime steaks and signature menu items at comparable prices Assortment of upscale, relatively less expensive entrees Broad appeal for everyday dining Food vs. beverage split: 65% / 35% Lunch vs. dinner split: 29% / 71% Opened first 4 locations Target AUV of $4.5m - $6.0m 10


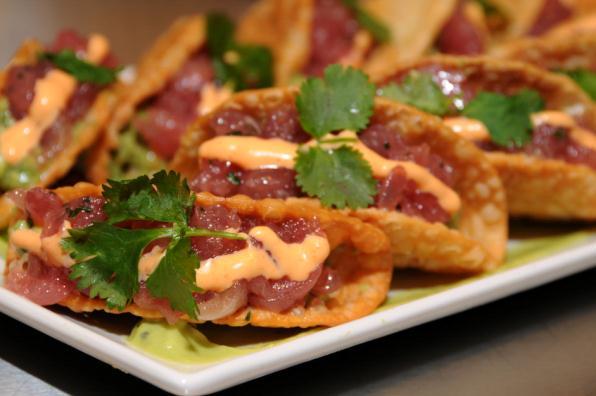


11 Our Food A Bold Flavor Profile 11


12 Our Beverages A Differentiated Approach 12
13 Our Accolades Hot new concept of the year and Fine Dining Hall of Fame Restaurant News Top 1,000 restaurants in America Zagat Ivy Award of Distinction Restaurants & Institutions Best of Award of Excellence Wine Spectator DiRoNA Award Winning Restaurant Distinguished Restaurants of North America 13
14 Demonstrated Operating Model Comparable restaurant sales growth outperformance AUV of $6.7 million across all concepts Industry-leading operating margins Successful new unit openings with multiple concepts 14

 Will open October 2012. d) Will open December 2012.")

15 Growth Strategy 2011 Openings 2012 Openings Chicago, IL (d) Washington, DC (b) Boston, MA Open Date: Apr Size: 13,700 sq. ft. Phoenix, AZ (a) Atlanta, GA (c) a) Opened June b) Opened July c) Will open October d) Will open December New York, NY Open Date: Aug Size: 10,300 sq. ft. Dallas, TX Open Date: Nov Size: 7,800 sq. ft. Complementary concepts Ability to co-exist in the same markets Flexible unit models Large Universe of Opportunities 15
16 Number of units Number of units Significant Growth Opportunity Clear path forward 3 units opened in units planned for 2012 Opening units in both current and new markets Targeting 3-5 new unit openings per year Del Frisco s Sullivan s Del Frisco s Grille 2012 planned openings Fine dining steakhouse concepts Publicly traded restaurants Source: Company information and public filings 16
17 Targeted Unit Economics Target at least 25% cash-on-cash return at each concept Current AUV $12.5m $4.4m n/a Targeted new unit AUV Cash investment cost Targeted sales / cash investment $8.5 $9.5m $4.5 $5.0m $4.5 $6.0m $7.0 $9.0m $3.0 $4.5m $3.0 $4.5m 1.1x 1.2x 1.1x 1.5x 1.2x 1.7x Note: Cash-on-cash returns are calculated including pre-opening costs. 17
18 Comprehensive New Site Strategy Target new and existing markets Prioritize DMAs (a) based on Brand Awareness data Brand-specific customer profiling Site evaluation 50 DMAs ( trade areas) 20 Priority markets ( priority trade areas) Rolling inventory of sites in priority trade areas Financial modeling 3-5 Openings per year a) DMAs refers to Designated Market Areas. 18
19 Organic Growth Drivers Focus on increasing sales and average check through: Increasing guest counts through effective marketing and delivering outstanding experience New focus on private dining Tableside up-selling of food items Continued focus on wine selection and cocktails Selective remodels expected to enhance comparable restaurant sales growth Strong 2-year cumulative comparable restaurant sales growth 25.0% 20.0% 20.3% 23.4% 20.5% 15.0% 10.0% 10.2% 13.6% 11.5% 5.0% 0.0% Comparable y-o-y restaurant sales: FY2011 Q Q % 8.8% 7.9% 5.3% 7.3% 0.3% 19
20 Experienced Management Team Name Position Previous experience Mark Mednansky CEO Tom Pennison CFO Bill Martens VP, Development & Construction Jim Kirkpatrick VP, Real Estate Thomas Dritsas April Scopa VP, Culinary & Executive Chef VP, People & Education 20
21 Comparable restaurant sales growth Proven Unit Growth and Comparable Restaurant Sales Growth is Driving Strong Revenue Growth ($m) Number of units Comparable restaurant sales growth Unit growth 15.0% 10.0% 5.0% 0.0% (5.0%) 5.1% 8.8% 3.0% (1.2%) 0.8% 0.8% 12.1% 12.3% 11.8% 9.5% 6.7% 1.3% 2.1% 1.3% 1.4% 1.9% 4.0% 0.2% Q10 3Q10 4Q10 1Q11 2Q11 3Q11 4Q11 1Q12 2Q12 0 DFRG Knapp Track Q Q 2012 Revenues ($m) $300.0 $250.0 $200.0 $150.0 $100.0 $160.2 $165.6 $201.6 $86.8 $105.0 $50.0 $ H H 2012 Source: Knapp Track 21

22 Cost Structure Food and beverage costs as a % of sales 2011 cost of sales composition Other Food 8.5% Produce/Cheese 9.4% Wine & Other Beverages 33.1% Restaurant operating costs as a % of sales Seafood 16.5% Meat 32.5% 22
23 ($ in millions) Strong Adjusted EBITDA Performance $45.0 $40.0 $36.8 $35.0 $30.0 $30.4 $30.0 $25.0 $20.0 $20.7 $15.0 $14.8 $10.0 $5.0 $ H H 2012 Adj. EBITDA margin 18.9% 18.1% 18.2% 17.1% 19.7% 23
24 Industry Leading Operating Margins 2011 Operating margin % for U.S. based, publicly traded, full service dining concepts 14.0% DFRG adjustments $ Amount % margin 12.0% 10.0% 8.0% 6.0% 4.0% 11.7% 9.3% 9.0% 8.6% 7.8% 7.6% 7.6% 6.8% 6.5% 6.5% 6.4% 6.0% 5.8% 4.8% Operating income $ % Lone Star Fund fees % Est public company expenses (1.7) (0.8%) PF operating income $ % 3.7% 3.3% 3.1% 2.6% 2.5% 2.3% 2.1% 2.0% 1.7% 0.0% (2.0%) (0.8%) Note: Peer Group operating margins represent calendar year 2011 margins. Peers shown include: Buffalo Wild Wings, Darden Restaurants, Texas Roadhouse, Brinker International, Cheesecake Factory, Biglari Holdings, BJ s Restaurants, Cracker Barrel Old Country Store, Ruth s Hospitality Group, Bob Evans Farms, Famous Dave s of America, Bravo Brio Restaurant Group, Ignite Restaurant Group, Ruby Tuesday, P.F. Chang s China Bistro, Red Robin Gourmet Burgers, Frisch s Restaurants, Kona Grill, Luby s, Benihana, J. Alexander s and Granite City Food & Brewery. Source: Company information and public filings 24
25 Industry Benchmarking Best-in-Class Results 2011 Sales growth 2011 Systemwide unit growth 25% 20% 15% 10% 5% 0% (5%) 22% 21% 15% 8% 6% 5% 5% (0%) (3%) 14% 12% 10% 8% 6% 4% 2% 0% (2%) 13% 11% 8% 7% 4% 4% 2% 2% (1%) 2011 Comparable restaurant sales growth (a) 2011 Adj. EBITDA growth (b) 12% 10% 8% 6% 4% 2% 0% 11% 7% 7% 5% 2% 2% 1% 40% 30% 20% 10% 0% (10%) 31% 23% 13% 11% 7% 5% 5% 5% (2%) (4%) (2%) (2%) (20%) (14%) a) PFCB, EAT & RUTH reflect Bistro, Chili s & Ruth s Chris concepts only. b) Adj. EBITDA is calculated before pre-opening, stock based compensation and publicly disclosed non-recurring items; DRI and EAT do not publicly disclose pre-opening. Source: Company information and public filings 25
26 Post-IPO Capital Structure Positioned For Growth Historically funded new restaurant growth from operating cash flow Strong liquidity supported by cash flow from operations and credit facility Limited working capital requirements Company IPO proceeds were used to reduce existing debt, pay a one-time asset advisory termination fee to Lone Star Fund, as well as for working capital needs and general corporate purposes ($m) As of June 12, 2012 Actual Pro-Forma Cash & Cash Equivalents $5.8 $10.9 Total Debt Outstanding $61.5 $0.5 Debt/Adjusted EBITDA 1.4x 0.01x LTM Adjusted EBITDA $42.7 $
27 Outlook Fiscal Year 2012 Guidance Comparable restaurant sales 3% to 4% Restaurant development Cost of sales (as % of consolidated revenue) Restaurant-level EBITDA (as % of consolidated revenue) One Del Frisco s Three Del Frisco s Grilles One Sullivan s closing 30.6% to 31.0% 23.3% to 23.8% Effective tax rate 31% to 32% Gross capital expenditures (before tenant allowances) Annual weighted avg. diluted common shares outstanding $30 to $31 million Approximately 20.6 million 27
28 Long-Term Growth Model 3 5 New units per year 3 % 4% Comparable restaurant sales growth Maintain strong restaurant level margins Modest G&A and interest expense leverage Target long-term EPS growth 18% - 20% 28
29 Investment Highlights Differentiated, yet highly complementary concepts Demonstrated, unique operating model Highly attractive new unit economics Significant growth opportunity for all concepts Proven management team 29
30 EBITDA Adjustments Adjustments Description of adjustments ($ thousands) FY 2009 FY 2010 FY H H 2012 Operating income $21,823 $20,531 $22,092 $9,000 $14,935 Depreciation and amortization 6,422 6,624 7,146 3,096 3,703 Pre-opening costs ,018 1, Management fees and expenses 1,635 2,070 3,129 1,389 1,196 Impairment charge - - 1, Adjusted EBITDA per SEC Filings $30,373 $30,023 $36,785 $14,791 $20,736 Pre-opening costs are costs incurred prior to opening a restaurant Primarily consist of manager salaries, relocation costs, recruiting expenses, employee payroll and related training costs for new employees, including rehearsal of service activities, as well as lease costs incurred prior to opening Also include marketing costs incurred prior to opening as well as meal expenses for entertaining local dignitaries, families and friends Currently target pre-opening costs per restaurant of $800,000 for a Del Frisco s restaurant, $550,000 for a Sullivan s restaurant and $750,000 for a Grille restaurant Management fees and expenses consist of fees and expenses paid to Lone Star Fund and affiliate companies Recognized a non-cash impairment charge of longlived assets of $1.4 million in 2011 Related to the determination that the carrying amount of long-lived assets at one Sullivan s exceeded their estimated fair market value 30
31 Investor Presentation Wells Fargo Conference October 2012
An Investment Analysis Case Study
 An Investment Analysis Case Study This case is a group project that is due on April 2, before class at 10.30. Stating the obvious: Each group will turn in one report (sounds obvious, but might as well
Investor Presentation. September 2015
 Investor Presentation September 2015 Forward-Looking Statements CAUTIONARY STATEMENT This presentation contains forward looking statements, which include all statements that do not relate solely to historical
Dave & Buster's Entertainment, Inc. Announces Second Quarter 2015 Financial Results
 September 8, 2015 Dave & Buster's Entertainment, Inc. Announces Second Quarter 2015 Financial Results Reports 11.0% Increase in Comparable Store Sales Generates Record-Setting Adjusted EBITDA and Margins
Jefferies Consumer Conference June 2017
 Jefferies Consumer Conference June 2017 Important Information Forward Looking Statements Some of the statements contained in this presentation constitute forward looking statements within the meaning of
Dine Brands Global, Inc. Investor Presentation December 2018
 Dine Brands Global, Inc. Investor Presentation December 2018 Disclosures Forward-Looking Information: The content contained in this presentation is as of December 4, 2018. The Company assumes no obligation
Quarterly Concept Dashboard 2Q:14 Benchmarking for $1B+ Chains and Other Select Concepts System Stats, Unit Sales & Margins, Build Costs, Valuations
 Quarterly Concept Dashboard 2Q:14 Benchmarking for $1B+ Chains and Other Select Concepts System Stats, Unit Sales & Margins, Build Costs, Valuations Casual Buffalo Wild Wings Cheesecake Factory Chili's
Second Quarter 2018 Results
 Second Quarter 2018 Results August 21, 2018 CLASSIFIED INTERNAL USE ONLY Forward-Looking Statements Forward-looking statements in this presentation regarding the Company s future performance, restaurant
Dine Brands Global, Inc. Investor Presentation March 2019
 Dine Brands Global, Inc. Investor Presentation March 2019 Disclosures Forward-Looking Information: The content contained in this presentation is as of March 5, 2019. The Company assumes no obligation to
Comprehensive Plan to Enhance Shareholder Value. December 19, 2013
 Comprehensive Plan to Enhance Shareholder Value December 19, 2013 Forward-Looking Statements During the course of this presentation, Darden Restaurants officers and employees may make forward-looking statements
October 22, Dear Mr. Craigie:
 October 22, 2018 The Independent Members of the Board of Directors Bloomin Brands, Inc. 2202 North West Shore Boulevard Tampa, Florida 33607 Attention: Mr. James R. Craigie Lead Independent Director Dear
Fogo de Chão, Inc. Reports Third Quarter 2017 Results
 Fogo de Chão, Inc. Reports Third Quarter Results Dallas, Texas, (November 7, ) - Fogo de Chão, Inc. (NASDAQ: FOGO) today reported financial results for its 13-week fiscal third quarter ended October 1,.
Dine Brands Global, Inc. Investor Presentation. March 5, 2018
 Dine Brands Global, Inc. Investor Presentation March 5, 2018 2 Disclosures Forward-Looking Information: The content contained in this presentation is as of February 21, 2018. The Company assumes no obligation
FNFV Investor Presentation Fall 2017
 FNFV Investor Presentation Fall 2017 1 Legal Disclosure This presentation may contain forward-looking statements that involve a number of risks and uncertainties. Statements that are not historical facts,
Good Times Restaurants Inc.
 (Nasdaq Capital Market: GTIM) Investor Presentation June 2015 Disclaimer The information in this presentation does not contain all of the information that a potential investor should review before investing
Investor Presentation October 2018
 Investor Presentation October 2018 Safe Harbor Statement This presentation contains forward-looking statements about our current and presently expected performance trends, growth plans, business goals
EARNINGS CALL. FISCAL 2018: Q3 RESULTS March 22, 2018
 EARNINGS CALL FISCAL 2018: Q3 RESULTS March 22, 2018 Disclaimer/Non-GAAP Information IMPORTANT NOTICE The following slides are part of a presentation by Darden Restaurants, Inc. (the "Company") and are
Investor Presentation. Russ Bendel Chief Executive Officer. Ira Fils Chief Financial Officer. May 2015 AND
 Investor Presentation May 2015 Russ Bendel Chief Executive Officer AND Ira Fils Chief Financial Officer Forward Looking Statements Forward Looking Statements This presentation contains forward looking
Company Presentation January 2013
 Company Presentation January 2013 Cautionary Statements Forward-Looking Statements This presentation may include forward-looking statements. These statements reflect the current views of the Company s
Performance Food Group Company Reports Third-Quarter Fiscal 2016 Results: Provides Full-Year Fiscal 2016 Adjusted EBITDA Growth Outlook of 10% to 12%
 NEWS RELEASE For Immediate Release May 4, 2016 Investors: Michael D. Neese VP, Investor Relations (804) 287-8126 michael.neese@pfgc.com Media: Joe Vagi Manager, Corporate Communications (804) 484-7737
CAUTIONARY STATEMENTS
 INVESTOR PRESENTATION NOVEMBER 2017 2 CAUTIONARY STATEMENTS Forward-Looking Statements This presentation includes statements that express our opinions, expectations, beliefs, plans, objectives, assumptions
Founded on food, focused on service.
 Founded on food, focused on service. Q1 Earnings Call November 4, 2015 Forward Looking Statements This presentation includes, and our response to various questions may include, certain forward looking
UNITED STATES SECURITIES AND EXCHANGE COMMISSION WASHINGTON, DC FORM 8-K
 UNITED STATES SECURITIES AND EXCHANGE COMMISSION WASHINGTON, DC 20549 FORM 8-K CURRENT REPORT Pursuant to Section 13 or 15(d) of the Securities Exchange Act of 1934 Date of report (Date of earliest event
Bravo Brio Restaurant Group, Inc. Reports Fourth Quarter & Full Year 2016 Financial Results; Company Provides Full Year 2017 Outlook
 February 28, 2017 Bravo Brio Restaurant Group, Inc. Reports Fourth Quarter & Full Year 2016 Financial Results; Company Provides Full Year 2017 Outlook COLUMBUS, Ohio, Feb. 28, 2017 (GLOBE NEWSWIRE) --
Investor Presentation
 Investor Presentation June 2018 Safe Harbor Statement This presentation contains forward-looking statements. You can generally identify forward-looking statements by our use of forward-looking terminology
Investor Presentation. July 2018
 Investor Presentation July 2018 Disclaimer/Non-GAAP Information IMPORTANT NOTICE The following slides are part of a presentation by Darden Restaurants, Inc. (the "Company") and are intended to be viewed
Investor Presentation
 Investor Presentation November 2014 Michael Ansley President, CEO & Board Chairman David G. Burke Chief Financial Officer & Treasurer Safe Harbor Statement The information made available in this presentation
Q Supplemental Earnings Slides. November 1, 2018
 Q3 2018 Supplemental Earnings Slides November 1, 2018 1 Cautionary Note on Forward-Looking Statements This presentation contains forward-looking statements, within the meaning of the Private Securities
Investor Presentation November 2015
 Investor Presentation November 2015 Disclaimer Forward-Looking Information This presentation contains forward-looking statements, as defined in the Private Securities Litigation Reform Act of 1995, which
Investor Presentation
 Investor Presentation September 2018 Disclaimer This presentation contains forward-looking statements. You can generally identify forward-looking statements by our use of forward-looking terminology such
Fidelity National Financial Ventures Investor Presentation. Spring 2014
 Fidelity National Financial Ventures Investor Presentation Spring 2014 1 Forward Looking Statements This presentation may contain forward-looking statements that involve a number of risks and uncertainties.
Management Presentation June, 2005
 Management Presentation June, 2005 Safe Harbor Provisions Statements contained in this presentation that are forwardlooking statements, such as statements containing projections and terms such as can,
Investor Presentation. January 2017
 Investor Presentation January 2017 Forward-Looking Statements Forward-Looking Statements This presentation contains forward-looking statements that are subject to risks and uncertainties. All statements
Bloomin Brands, Inc. Overview
 Bloomin Brands, Inc. Overview Forward Looking Statements Certain information contained in this presentation, particularly information regarding future economic performance, finances, and expectations and
2017 Supplemental Earnings Slides. February 15, 2018
 2017 Supplemental Earnings Slides February 15, 2018 1 Cautionary Note on Forward-Looking Statements This presentation contains forward-looking statements, within the meaning of the Private Securities Litigation
2018 FOURTH QUARTER EARNINGS CALL
 NORTH AMERICA S LEADING BUILDING MATERIALS DISTRIBUTOR RESIDENTIAL COMMERCIAL INTERIOR SOLAR 2018 FOURTH QUARTER EARNINGS CALL Forward Looking Statements / Non-GAAP Measures This presentation contains
INVESTOR PRESENTATION SEPTEMBER 2018
 INVESTOR PRESENTATION SEPTEMBER 2018 Forward-Looking Statements Forward looking statements This presentation includes statements that are, or may deemed to be, forward-looking statements. These forward-looking
Nasdaq Capital Market: GTIM Investor Presentation June 2018
 Nasdaq Capital Market: GTIM Investor Presentation June 2018 Forward-Looking Statements and Non-GAAP Financial Information Forward-Looking Statements This presentation contains forward-looking statements.
INVESTOR PRESENTATION JUNE 2018
 INVESTOR PRESENTATION JUNE 2018 0 FORWARD-LOOKING STATEMENTS Forward-Looking Statements This presentation contains forward-looking statements that are subject to risks and uncertainties. All statements
AVERAGE LISTING CAP RATE BY REGION & TERM REMAINING
 AVERAGE LISTING CAP RATE BY REGION & TERM REMAINING 7.50% 7.00% 6.50% 5.50% 5.00% 4.50% 4.00% 0-10 11-20 0-10 11-20 0-10 11-20 0-10 11-20 0-10 11-20 0-10 11-20 0-10 11-20 0-10 11-20 0-10 11-20 Applebee's
INVESTOR PRESENTATION JANUARY 2018
 INVESTOR PRESENTATION JANUARY 2018 0 FORWARD-LOOKING STATEMENTS Forward-Looking Statements This presentation contains forward-looking statements that are subject to risks and uncertainties. All statements
Dougherty & Company Institutional Investor Conference
 Dougherty & Company Institutional Investor Conference September 19, David Burke, Chief Executive Officer Phyllis Knight, Chief Financial Officer Safe Harbor The information made available in this presentation
2018 Jefferies Consumer Conference June 19, Trevor Lang EVP and Chief Financial Officer
 2018 Jefferies Consumer Conference June 19, 2018 Trevor Lang EVP and Chief Financial Officer Forward-Looking Statements This presentation and the associated webcast contain forward-looking statements,
CL King s Annual Best Ideas Conference
 WELCOME TO AMERICA S DINER CL King s Annual Best Ideas Conference September 10, 2015 Forward Looking Statements and Non-GAAP Financial Measures Denny s Corporation urges caution in considering its current
THE KEG ROYALTIES INCOME FUND FIRST QUARTER REPORT
 THE KEG ROYALTIES INCOME FUND FIRST QUARTER REPORT For the three months ended March 31, 2010 TO OUR UNITHOLDERS On behalf of the Board of Trustees, I am pleased to present the results of The Keg Royalties
Restaurant Industry Overview and Valuation
 A Specialized Investment Bank Restaurant Industry Overview and Valuation Pacific Financial Plaza 860 Newport Center Drive Newport Beach CA 92660 949.219.5296 July 2007 949.720.9194 fax WWW.CBCAPITAL.COM
Bob Evans Express expects to open three new locations during Q2 2015; up to ten new locations expected for fiscal 2015
 BOB EVANS REPORTS FISCAL 2015 FIRST-QUARTER RESULTS Q1 2015 net sales total $326.3 million, a decline of $3.1 million, or 0.9 percent, compared to prior year first-quarter results. GAAP net loss of $0.04
Q %; 7.1% Q3 106%; 61% Q3 EPS
 At Home Group Inc. Announces Third Quarter Fiscal 2018 Financial Results Q3 net sales grew 25%; comparable store sales increased 7.1% Q3 operating income rose 106%; adjusted operating income 1 increased
The Innovator in Bar-Restaurant-Entertainment Themed Hospitality
 The Innovator in Bar-Restaurant-Entertainment Themed Hospitality NASDAQ: RICK 3Q17 Conference Call Presentation August 9, 2017 www.rcihospitality.com Forward-Looking Statements Certain statements contained
2017 Jefferies Consumer Conference
 207 Jefferies Consumer Conference June 20, 207 Tom Taylor Chief Executive Officer Forward-Looking Statements This presentation and the associated webcast contain forward-looking statements, including with
Investor Presentation January 2016
 Investor Presentation January 2016 Disclaimer Forward-Looking Information This presentation contains forward-looking statements, as defined in the Private Securities Litigation Reform Act of 1995, which
EARNINGS CALL. FISCAL 2018: Q4 & ANNUAL RESULTS June 21, 2018
 EARNINGS CALL FISCAL 2018: Q4 & ANNUAL RESULTS June 21, 2018 Disclaimer/Non-GAAP Information IMPORTANT NOTICE The following slides are part of a presentation by Darden Restaurants, Inc. (the "Company")
Diversified Restaurant Holdings, Inc. Wedbush Securities 2013 CA Dreamin Consumer Conference December 10, 2013
 Diversified Restaurant Holdings, Inc. Wedbush Securities 2013 CA Dreamin Consumer Conference December 10, 2013 Michael Ansley President, CEO & Board Chairman David G. Burke Chief Financial Officer & Treasurer
Luby s Reports Third Quarter Fiscal 2016 Results
 For additional information contact: FOR IMMEDIATE RELEASE Dennard-Lascar Associates Rick Black / Ken Dennard Investor Relations 713-529-6600 Luby s Reports Third Quarter Fiscal Results Luby s Cafeterias
Founded on food, focused on service.
 Founded on food, focused on service. Q3 FY2016 Earnings Call May 4, 2016 Forward Looking Statements This presentation includes, and our response to various questions may include, certain forward looking
Q4 & FY 2017 EARNINGS PRESENTATION MARCH 13, 2018
 Q4 & FY 2017 EARNINGS PRESENTATION MARCH 13, 2018 FORWARD-LOOKING STATEMENTS & NON-GAAP FINANCIAL INFORMATION 2 FORWARD-LOOKING STATEMENTS This presentation contains, and management may make on our call
Investor Presentation January 29, 2018
 Investor Presentation January 29, 2018 Safe Harbor Statement Statements made in this presentation and on the conference call, including statements made during the question-and-answer session, regarding
Luby s Reports Second Quarter Fiscal 2011 Results
 For additional information contact: FOR IMMEDIATE RELEASE DRG&L / 713-529-6600 Ken Dennard / Sheila Stuewe Investor Relations Luby s Reports Second Quarter Fiscal 2011 Results HOUSTON, TX March 10, 2011
Citigroup Restaurant Seminar April 5, 2016
 Citigroup Restaurant Seminar April 5, 2016 Michael Ansley, Chairman & CEO David Burke, CFO Treasurer Michael Ansley, Chairman & CEO David Burke, CFO 2016 by Diversified Restaurant Holdings, Inc. Safe Harbor
Investor Deck. March, 2018 NASDAQ: BURG NASDAQ: BURG 1
 Investor Deck March, 2018 NASDAQ: BURG NASDAQ: BURG 1 This Is Our Story Chanticleer Holdings was formed and went public in June 2005 as a BDC (investment company) led by CEO Mike Pruitt and two financial
Famous Dave's Reports Results for Second Quarter Fiscal 2015
 Famous Dave's Reports Results for Second Quarter Fiscal 2015 August 5, 2015 MINNEAPOLIS, Aug. 5, 2015 (GLOBE NEWSWIRE) -- Famous Dave's of America, Inc. (NASDAQ:DAVE) today reported financial results for
30 th Annual Raymond James Institutional Investors Conference March 11, 2009
 30 th Annual Raymond James Institutional Investors Conference March 11, 2009 Safe Harbor Statement Under the Private Securities i Litigation i i Reform Act of 1995 Our presentation includes, and our response
Investor Deck. May 2018 NASDAQ: BURG NASDAQ: BURG 1
 Investor Deck May 2018 NASDAQ: BURG NASDAQ: BURG 1 Safe Harbor Statement Forward-Looking Statements Statements in this presentation that are not descriptions of historical facts are forward-looking statements
Q %; 7.8% Q2 50%; 35% Q2 EPS
 At Home Group Inc. Announces Second Quarter Fiscal 2018 Financial Results Q2 net sales increased 23%; comparable store sales increased 7.8% Q2 net income increased 50%; pro forma adjusted net income 1
FOR IMMEDIATE RELEASE (Analysts) Kevin Kalicak (407) (Media) Rich Jeffers (407)
 Kevin Kalicak (407) (Media) Rich Jeffers (407)") FOR IMMEDIATE RELEASE Contact: (Analysts) Kevin Kalicak (407) 245-5870 (Media) Rich Jeffers (407) 245-4189 DARDEN RESTAURANTS REPORTS FISCAL 2016 SECOND QUARTER RESULTS; REPORTS POSITIVE SAME-RESTAURANT
FOR IMMEDIATE RELEASE Contact: (Analysts) Kevin Kalicak (407) 245-5870 (Media) Rich Jeffers (407) 245-4189 DARDEN RESTAURANTS REPORTS FISCAL 2016 SECOND QUARTER RESULTS; REPORTS POSITIVE SAME-RESTAURANT
UNITED STATES SECURITIES AND EXCHANGE COMMISSION Washington, D.C FORM 10-Q WINGSTOP INC.
 UNITED STATES SECURITIES AND EXCHANGE COMMISSION Washington, D.C. 20549 FORM 10-Q (Mark one) x QUARTERLY REPORT PURSUANT TO SECTION 13 OR 15(d) OF THE SECURITIES EXCHANGE ACT OF 1934 For the quarterly
El Pollo Loco Holdings, Inc. Announces First Quarter 2015 Financial Results
 May 14, 2015 El Pollo Loco Holdings, Inc. Announces First Quarter 2015 Financial Results COSTA MESA, Calif., May 14, 2015 (GLOBE NEWSWIRE) -- El Pollo Loco Holdings, Inc. (Nasdaq:LOCO) today announced
Q Financial Results. May 4, 2017
 Q1 2017 Financial Results May 4, 2017 Safe Harbor The information made available in this presentation contains forward-looking statements which reflect the Company s current view of future events, results
Boston Pizza Royalties Income Fund TSX : BPF.UN Investor Presentation February 8, 2018
 Boston Pizza Royalties Income Fund TSX : BPF.UN Investor Presentation February 8, 2018 Forward Looking Information Certain information in this presentation may constitute forward looking information" that
Bank of America Merrill Lynch Consumer & Retail Technology Conference. March 2019
 Bank of America Merrill Lynch Consumer & Retail Technology Conference March 2019 Forward Looking Statements and Safe Harbor Treatment This Presentation and any commentary provided by the Company s management
ACQUISITION OF HOJEIJ BRANDED FOODS. August 2018
 ACQUISITION OF HOJEIJ BRANDED FOODS August 2018 DISCLAIMER Certain statements contained in this document are forward-looking statements (including objectives and trends), which address our vision of the
Q Financial Results. May 8, 2018
 Q1 2018 Financial Results May 8, 2018 Safe Harbor Some of the statements contained in this presentation and the Company s May 9, 2018 earnings conference call may constitute forward-looking statements
The innovator in bar-restaurant-entertainment hospitality. NASDAQ: RICK Investor Presentation March-April 2016
 The innovator in bar-restaurant-entertainment hospitality NASDAQ: RICK Investor Presentation March-April 2016 www.rcihospitality.com Forward Looking Statements Certain statements contained in this presentation
Q4 and FY 2017 Financial Results. March 9, 2018
 and Financial Results March 9, 2018 Safe Harbor The information made available in this presentation contains forward looking statements which reflect the Company s current view of future events, results
Investor PRESENTATION. November Conrad Bora Bora Nui, French Polynesia
 Investor PRESENTATION November 2017 Conrad Bora Bora Nui, French Polynesia HLT VALUE PROPOSITION Hilton's scale, global presence and leading brands at multiple price points drive a network effect delivering
Oppenheimer 18 th Annual Consumer Conference June 20, 2018
 Oppenheimer 18 th Annual Consumer Conference June 20, 2018 David Burke, Chief Executive Officer Phyllis Knight, Chief Financial Officer 1 Safe Harbor Some of the statements contained in this presentation
OMAM. Investor Presentation. Fourth Quarter 2014
 OMAM Investor Presentation Fourth Quarter 2014 DISCLAIMER Forward Looking Statements This presentation may contain forward looking statements for the purposes of the safe harbor provision under the Private
Dave & Buster s Delivers Fourth Consecutive Year of Record Performance
 Dave & Buster s Delivers Fourth Consecutive Year of Record Performance April 3, 2018 Achieves New Revenue, Net Income and EBITDA Highs on Double-Digit Growth in Fiscal 2017 DALLAS, April 03, 2018 (GLOBE
Cautionary Statements
 Cautionary Statements Forward-Looking Statements In addition to historical information, this presentation contains statements relating to the Company s future business and financial performance and future
THREE MONTHS ENDED MARCH 31, $ Change Diluted earnings per share $ 0.50 $ 0.47 $ 0.03 Adjustments (1) 0.02 (0.02)
 0.02 (0.02)") April 30, 2013 Bloomin' Brands, Inc. Announces First Quarter Adjusted Diluted Earnings Per Pro Forma Share of $0.50 and GAAP Diluted Earnings Per Share of $0.50; Raises Full-Year 2013 Guidance for Adjusted
April 30, 2013 Bloomin' Brands, Inc. Announces First Quarter Adjusted Diluted Earnings Per Pro Forma Share of $0.50 and GAAP Diluted Earnings Per Share of $0.50; Raises Full-Year 2013 Guidance for Adjusted
Red Lobster Seafood Co.
 As filed with the Securities and Exchange Commission on March 10, 2014 File No. UNITED STATES SECURITIES AND EXCHANGE COMMISSION WASHINGTON, D.C. 20549 FORM 10 GENERAL FORM FOR REGISTRATION OF SECURITIES
Jefferies Consumer Conference June 2016
 Jefferies Consumer Conference SAFE HARBOR STATEMENT Safe Harbor Statement under the Private Securities Litigation Reform Act of 1995: Statements in this presentation regarding the business of The Chefs
Colliers International Group Inc.
 Colliers International Group Inc. Fourth Quarter 2017 Financial Results February 14, 2018 Forward-Looking Statements This presentation includes or may include forward-looking statements. Forward-looking
Management s Discussion & Analysis
 Freshii Inc. Management s Discussion & Analysis For the 13 week period ended March 26, 2017 (Expressed in US Dollars) MANAGEMENT S DISCUSSION AND ANALYSIS OF FINANCIAL CONDITION AND RESULTS OF OPERATIONS
EARNINGS CALL. FISCAL 2019: Q1RESULTS September 20, 2018
 EARNINGS CALL FISCAL 2019: Q1RESULTS September 20, 2018 Disclaimer/Non-GAAP Information IMPORTANT NOTICE The following slides are part of a presentation by Darden Restaurants, Inc. (the "Company") and
Cara Operations to Merge with Keg Restaurants Ltd. January 23, 2018
 Cara Operations to Merge with Keg Restaurants Ltd. January 23, 2018 Disclaimers This presentation contains forward-looking information within the meaning of applicable securities laws. In some cases, forward-looking
CFA Investment Research Challenge
 CFA Investment Research Challenge October 27 th, 2016 Forward-Looking Statements This document has been prepared by Performance Food Group Company (the Company, we, us and our ) solely for informational
EARNINGS CALL. FISCAL 2018: Q1 RESULTS September 26, 2017
 EARNINGS CALL FISCAL 2018: Q1 RESULTS September 26, 2017 Disclaimer/Non-GAAP Information IMPORTANT NOTICE The following slides are part of a presentation by Darden Restaurants, Inc. (the "Company") and
INVESTOR PRESENTATION
 INVESTOR PRESENTATION December 2013 MGAM SAFE HARBOR STATEMENT In addition to historical facts or statements of current conditions, this presentation contains forward-looking statements that are intended
Q Supplemental Earnings Slides. May 3, 2018
 Q1 2018 Supplemental Earnings Slides May 3, 2018 1 Cautionary Note on Forward-Looking Statements This presentation contains forward-looking statements, within the meaning of the Private Securities Litigation
5/7/2013. First Quarter 2013 Earnings Conference Call. May 8, Oldemark LLC JOHN BARKER. Chief Communications Officer.
 First Quarter 2013 Earnings Conference Call May 8, 2013 2013 Oldemark LLC JOHN BARKER Chief Communications Officer 2013 Oldemark LLC 2 1 Today s Agenda CEO Overview Financial Update Emil Brolick Steve
Buffalo Wild Wings, Inc. Announces Third Quarter Earnings per Share of $1.17 and Adjusted Earnings per Share of $1.36
 Buffalo Wild Wings Inc. Logo Buffalo Wild Wings, Inc. Announces Third Quarter Earnings per Share of $1.17 and Adjusted Earnings per Share of $1.36 October 25, 2017 Increasing 2017 Forecasted GAAP EPS to
El Pollo Loco Holdings, Inc. Announces Second Quarter 2014 Financial Results
 September 4, 2014 El Pollo Loco Holdings, Inc. Announces Second Quarter 2014 Financial Results COSTA MESA, CA - September 4, 2014 - El Pollo Loco Holdings, Inc. (Nasdaq: LOCO) today announced financial
Investor Presentation September 2015
 Investor Presentation September 2015 Disclaimer The information in this presentation does not contain all of the information that a potential investor should review before investing in our Class A common
WEEKS ENDED. Adjusted diluted earnings per share* $ 0.46 $ 0.50 $ (0.04)
") May 9, 2014 Bloomin' Brands, Inc. Announces Fiscal 2014 First Quarter Adjusted Diluted Earnings Per Share of $0.46 and GAAP Diluted Earnings Per Share of $0.42; Reaffirms Full-Year 2014 Guidance Including
May 9, 2014 Bloomin' Brands, Inc. Announces Fiscal 2014 First Quarter Adjusted Diluted Earnings Per Share of $0.46 and GAAP Diluted Earnings Per Share of $0.42; Reaffirms Full-Year 2014 Guidance Including
At Home Group Inc. Announces Third Quarter Fiscal 2019 Financial Results
 At Home Group Inc. Announces Third Quarter Fiscal 2019 Financial Results Q3 net sales increased 25.5%; comparable store sales increased 5.2% Delivers 19 th consecutive quarter of comparable store sales
Annual Shareholders Meeting. November 13, 2014
 Annual Shareholders Meeting November 13, 2014 Sandy Cochran President and Chief Executive Officer FY2014 Business Review Safe-Harbor Statement Cracker Barrel Old Country Store, Inc. ( the Company ) urges
Second 13, focused onn. to five units in. beginning of the. same storee
 FOR IMMEDIATE RELEASE Luby s Reports Second For additional information contact: Dennard-Lascar Associates 713-529-6600 Ken Dennard / Sheila Stuewe Investor Relations Quarter Fiscal Results HOUSTON, TX
Natural Grocers by Vitamin Cottage, Inc. Investor Presentation August 2016
 Natural Grocers by Vitamin Cottage, Inc. 1 Investor Presentation August 2016 Disclosures Forward-Looking Statements This presentation includes forward-looking statements within the meaning of the Private
Investor Presentation JANUARY 2016
 Investor Presentation JANUARY 2016 FORWARD-LOOKING STATEMENTS Forward-Looking Statements This presentation contains forward-looking statements that are subject to risks and uncertainties. All statements
DARDEN RESTAURANTS REPORTS FISCAL 2017 FOURTH QUARTER AND FULL YEAR RESULTS; FOURTH QUARTER SAME-RESTUARANT SALES GROWTH OF 3
 Contacts: (Analysts) Kevin Kalicak (407) 245-5870 (Media) Rich Jeffers (407) 245-4189 DARDEN RESTAURANTS REPORTS FISCAL 2017 FOURTH QUARTER AND FULL YEAR RESULTS; FOURTH QUARTER SAME-RESTUARANT SALES GROWTH