Management Presentation June, 2005
|
|
|
- George McDaniel
- 5 years ago
- Views:
Transcription
1 Management Presentation June, 2005
2 Safe Harbor Provisions Statements contained in this presentation that are forwardlooking statements, such as statements containing projections and terms such as can, may, will, expect, plan and similar terms, are subject to various risks and uncertainties. Such forward-looking statements are made pursuant to the safe-harbor provisions of the private Securities Litigation Reform Act of 1995 and are made based on management s current expectations or beliefs, as well as assumptions made by, and information currently available to, management. A variety of factors could cause actual results to differ materially from those anticipated in Main Street s forward-looking statements, including, but not limited to, the discussion in Management s Discussion and Analysis and the risks identified in the Company s Annual Report on Form 10- K for the year ended December 27, 2004 (and in the Company s subsequent quarterly reports on Form 10-Q). Investors and analysts should not place undue reliance on forward-looking statements.
3 Regulation FD At this time we can not discuss the financial performance of the current quarter or any other non public information. We respectfully request your understanding if we are unable to answer some of your questions.

4 Main Street Restaurant Group is: A 69-unit restaurant operating company in the casual dining sector with three key brands: World s largest Friday s franchisee, with 53 restaurants mainly in the Southwest ( Our exclusive territory includes So. California, Arizona, Nevada and New Mexico) Owned concept of 11 Pacific Rim, Asian Bistros throughout the United States (primarily Arizona and Florida) Owned concept of 4 Seafood Bar and Grills
5 Investment Highlights Exclusive TGI Friday s franchise rights in attractive, highgrowth geographic markets Bamboo club turnaround largely complete with the closure in May of the Newport location Significant insider ownership of 45% Attractive valuation multiple at 4.7 times 2005 estimated EBITDA NOLs and Tax credits of $12 million to minimize future cash taxes Strong recent same store sales increases De-levering the balance sheet, allowing for additional future unit growth
6 Management & Executive Leadership Bill Shrader President & Chief Executive Officer Joined MSRG in 1999 as COO, promoted to CEO April 2004 Prior experience: Sr. V.P. Marketing - Tosco President Petroleum Products Div., Circle K Michael Garnreiter Exec. V.P./Chief Financial Officer/Treasurer Joined MSRG in April 2002 as CFO-Prior experience-audit partner w ith Arthur Andersen for 27 years Stuart Gee Executive Vice President, Operations Joined MSRG in July, 2003 w ith over 20 years experience in restaurant operations, including Macaroni Grill Michael J. Herron Vice President-General Counsel/Secretary Judy Schumacher Vice President, Marketing and Communications Stephanie Barbini Vice President, Human Resources Chris Eubanks Vice President, Friday s Operations Cindy Ward Vice President, Accounting and Corporate Controller
7 Current Shareholders John Antioco, Chairman of the Board Shares (Millions) 4.9 % 29% Sergio Zyman, Board Member CIC Limited Partners (Dallas based Equity Fund) Sub-Total Brad Honigfeld (individual investor) Sub-Total Public Markets Total Outstanding Shares % 13.5% 45.3% 12.4% 57.7% 42.4% 100.0%
8 Company History 1999: Bill Shrader Joined MSRG as COO 2000: Acquired Bamboo Club concept 2002: Michael Garnreiter Joined MSRG as CFO 2004: Bill Shrader appointed CEO New Friday s Development Agreement Major reduction in G & A staff Closed 2 Unprofitable Bamboo Clubs 2005: $5 million of new equity
9 Key Milestones 2004/2005 May 2005 Jan 2004


10 Historical Overview of MSRG Number of Restaurants


11 Historical Overview of MSRG millions millions Net Inc (Loss)


12 Our TGI Friday s Brand

13 Friday s Brand Key Statistics Number of Restaurants


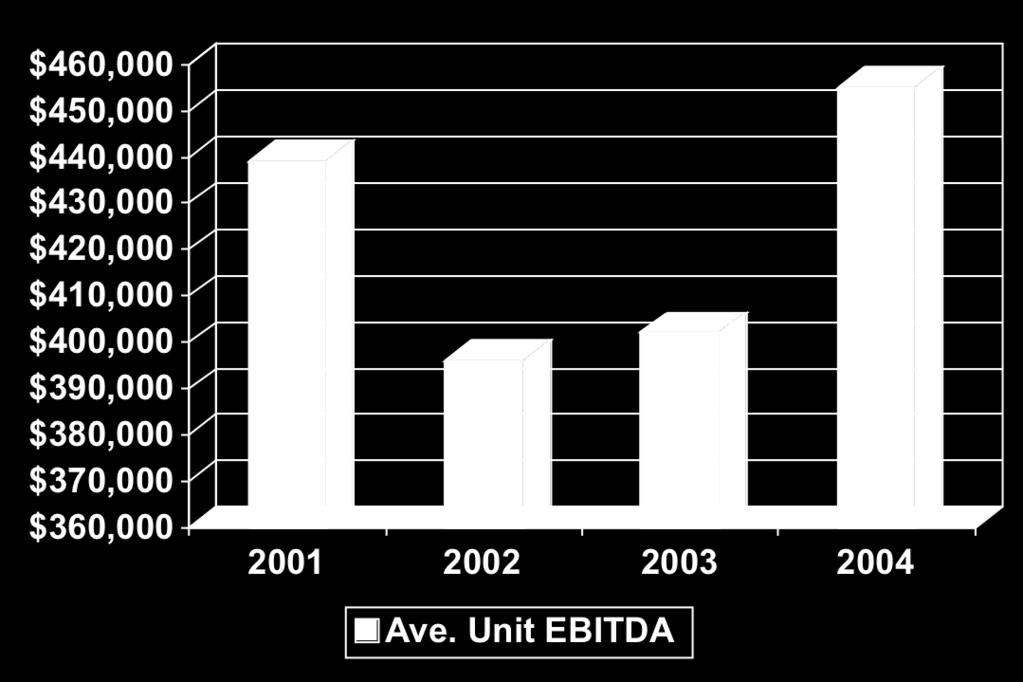


14 Friday s Unit Averages

15 Our Friday s locations and exclusive territory
16 Fastest Growing Cities Ten of the top 20 population growth cities are in our key markets

17 Attractive Friday s Unit Economics Targeted Revenues $3,500,000 Expected EBITDA $500,000 Construction costs $2.5 to $2.7 mill Annual Cash Return 18-20%
18 Our Friday s development plans 2005 new restaurant openings: Surprise, Az opening July 05 (new style) Orleans Hotel, Las Vegas-Our first casino location-opening late 2005 Happy Valley, Az-late 2005 Rancho Cucamonga, Cal late 2005 Looking for the right small box locationtentatively in Flagstaff, Az for early to mid 2006


19 Friday s Remodel Program
20 Our Friday s Cap Ex Plan (2005 to 2007) Build 10 New Friday s $25-$27 million Remodel 20 Friday s $6-$10 million Total Uses $30-$37 million Annual Free EBITDA ($10-$12 million per year) $30-36 million Cash on Hand $10 million Total Sources $40-$46 million


21 Our Bamboo Brand
22 Bamboo Club-Asian Bistro Maturity is 24 months, longer than we expected Currently 11 units down from 13 in Q Closed two underperforming locations in early 2005 Refocusing on crave able food & operational execution No new development currently scheduled Current portfolio should be at least break-even cash flow
23 Strategic Outlook Build 10 new TGI Friday s restaurants thru 2007 Remodel half of our existing Friday s locations Pay down total bank debt to $40 Million (another 13% reduction) by end of 2005 Refinance our debt and create more capacity and flexibility sometime in 2005 Execute the operational & marketing improvements in the Bamboo Brand Execute operational improvements in the Friday s brand
24 Summary Balance Sheet Pro Forma* March 2005 March 2004 $16,300,00 0 Cash Other current assets Property & Equip, net Goodwill & Other $ 11,307,000 5,291,000 64,650,000 26,360,000 $ 5,073,000 5,007,000 67,719,000 28,200,000 Total Assets $107,608,000 $105,999,000 Total debt Other current liabilities $ 45,024,000 31,288,000 $ 50,734,000 25,291,000 $36,300,00 0 Stockholder Equity Total Liabilities 31,296,000 $107,608,000 29,974,000 $105,999,000 After CIC capital infusion April, 2005
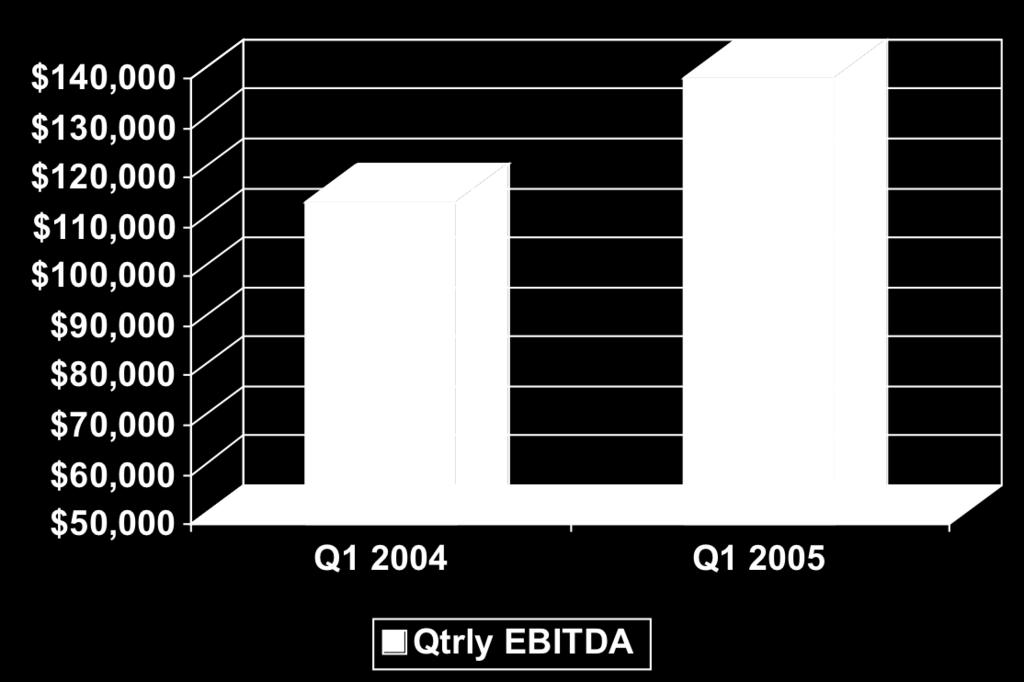
25 Summary Operating Statement at March 31, 2005 Revenues Net Income EPS Q Q $59,079,000 1,178,000 $61,432,000 1,461,000 $0.08 $0.10
26 (6.0) (4.0) (2.0) Q Q Q Q Q Q Q Q Q Q Q Q Q Q Q Q Q Q Q Q Q1 2005
27 Friday s Only (entire United States) 9.0% 5.0% 1.0% -3.0% -7.0% Jan-01 Jan-02 Jan-03 Jan-04 May- Sep- May- Sep- May- Sep- May- Sep- Jan-05 TGI Friday's (472 stores) Knapp-Track MSRG Fridays only


28 Quarterly Same Store Sales


29 Cost of Goods


30 Payroll & Benefits


31 Earnings per Share & Seasonality
32 Earnings per Share without Impairment charges
33 Short Term Review & Outlook We remain cautiously optimistic about the second quarter Same store sales remain ahead of our expectations Our 2005 guidance currently remains at $.16 to $.18 per share & $16-18 million in EBITDA We will refine guidance as management gains further clarity after the second quarter is complete
34 2005 EBITDA Guidance Actual EBITDA $15,481 $13,444 Adjustment to 2004 EBITDA: Underperforming Bamboo clubs, net 600 Adjusted 2004 EBITDA $16, Marginal higher profitability in 2005 on same store sales 900 Projected EBITDA $17,000
35 Our Long term Goals Projected Annual EBITDA growth rate 5 to 15% per year How we will do it- Sales- *Annual same store sales increase +2 to 3% *Sales from new locations $3.5 million annualized *Incremental sales from remodeled locations of 3-7% Cost of Sales- Use of our technology investment to focus supply chain efforts to further reduce costs by 50 bpts Labor- Use of technology investment to improve labor scheduling & labor management to reduce labor 50 bpts G & A- Use of technology investment to improve overall support to the restaurants and to hold G&A tight
36 Valuation Multiple Shares outstanding Price per share early June, 2005 Equity Value Total 3/05 Less-Cash on hand (pro forma after new equity) Enterprise Value Projected 05 EBITDA Market Multiple 16,900,000 $3.00 $50,700,000 $45,100,000 $(16,000,000) $79,800,000 $17,000, Times
37 Summary Since April 2004, we focused on performance. We changed our name, we changed our culture, we changed our G&A level (right sized) and adopted a new general manager incentive bonus program. We ve begun de-levering our long term debt and have closed underperforming locations We ve strengthened our balance sheet with profitability in 2004 and new equity in And we re committed to the Friday s remodel program and to building at least 10 new TGI Friday s restaurants by the end of 2007 Focus
38 Main Street Restaurant Group 5050 N. 40 th Street Suite 200 Phoenix, Arizona NASDAQ symbol: MAIN Website:
39 Slides after this one are not part of the final presentation.
40 Main Street Restaurant Group 5050 N. 40 th Street Suite 200 Phoenix, Arizona NASDAQ symbol: MAIN Website: $ $5.50 $4.50 $ $2.50 Q Q Q Q Q Q Q $1.50 $0.50 Q Q Q Q Q Q Q Q Average Qtrly Stock Price Q Q Q Q Q Q
41 Knapp-Track list : All Restaurants Acapulco American Café Applebee's Benihana Bennigan's Bertucci's Big Bowl Bucca di Beppo California Pizza Kitchen Carrabba's Italian Grill Catina Laredo Charleston's Restaurant Chevys Chili's El Chico El Torito Good Eats Johnny Carino's Country Italian The Keg Logan's Roadhouse Lone Star Steakhouse and Saloon Longhorn Steakhouse Macaroni Grill Maggiano's Ninety-Nine Restaurants O'Charley's Old Chicago Olive Garden On The Border Outback Steakhouse P.F. Chang's China Bistro Pizzeria Uno Reb Robin Gourmet Burgers Red Lobster Rock Bottom Brewery Ruby Tuesday Silver Diner Spaghetti Warehouse Steak & Ale Stuart Anderson's Black Angus Texas Land & Cattle Steak House TGI Friday's Tony Roma's Vinny T's
42 Friday s Brand Key Statistics Number of Restaurants
43 Cash Property & Equip, net Goodwill & Other Total Assets Long Term Debt Other current liabilities Stockholder Equity Total Liabilities Summary Operating Statement at March 31, 2005 Q Revenues Net Income EPS $61,432,000 1,461,000 $0.10 Summary Balance Sheet at March 31, 2005 Other current assets $ 11,307,000 5,291,000 64,650,000 26,360,000 $107,608,000 $ 45,024,000 31,288,000 31,296,000 $107,608,000
44 Jan 2004 Key Milestones 2004/2005 May 2005
45 How we plan to do it Pay down debt to $40 Million by end of 2005 Expand by adding 10 new TGI Friday s restaurants by end of 2007 Refinance our debt and expand capacity Focused operational & marketing improvements in the Bamboo Brand Opine and advise on marketing initiatives Remodel half of Friday s existing locations Message-tell our story to the street


46 Historical Stock Price


47 Stock Price related to EBITDA
48 Stock Options & Warrants Bart Brown John Antioco Options 1,200, ,500 Strike Price $ CIC Limited Warrants 562,600 Strike Price $3.01 Bill Shrader 600, Mike Garnreiter 225, Sergio Zyman 50, All other insiders & directors All other employees Totals 224, ,000 3,310, $2.87
Comprehensive Plan to Enhance Shareholder Value. December 19, 2013
 Comprehensive Plan to Enhance Shareholder Value December 19, 2013 Forward-Looking Statements During the course of this presentation, Darden Restaurants officers and employees may make forward-looking statements
AVERAGE LISTING CAP RATE BY REGION & TERM REMAINING
 AVERAGE LISTING CAP RATE BY REGION & TERM REMAINING 7.50% 7.00% 6.50% 5.50% 5.00% 4.50% 4.00% 0-10 11-20 0-10 11-20 0-10 11-20 0-10 11-20 0-10 11-20 0-10 11-20 0-10 11-20 0-10 11-20 0-10 11-20 Applebee's
Investor Presentation. Wells Fargo Conference October 2012
 Investor Presentation Wells Fargo Conference October 2012 Disclaimer This presentation contains forward-looking statements, as defined by federal and state securities laws. Forwardlooking statements include
Dine Brands Global, Inc. Investor Presentation December 2018
 Dine Brands Global, Inc. Investor Presentation December 2018 Disclosures Forward-Looking Information: The content contained in this presentation is as of December 4, 2018. The Company assumes no obligation
DARDEN RESTAURANTS REPORTS THIRD QUARTER DILUTED NET EARNINGS PER SHARE OF $1.02; DECLARES A QUARTERLY DIVIDEND OF 50 CENTS PER SHARE
 S M Red Lobster Olive Garden LongHorn Steakhouse The Capital Grille Bahama Breeze Seasons 52 Eddie V s Yard House www.darden.com NEWS/INFORMATION Corporate Relations P.O. Box 695011 Orlando, FL 32869-5011
Dine Brands Global, Inc. Investor Presentation March 2019
 Dine Brands Global, Inc. Investor Presentation March 2019 Disclosures Forward-Looking Information: The content contained in this presentation is as of March 5, 2019. The Company assumes no obligation to
FOR IMMEDIATE RELEASE (Analysts) Kevin Kalicak (407) (Media) Rich Jeffers (407)
 Kevin Kalicak (407) (Media) Rich Jeffers (407)") FOR IMMEDIATE RELEASE Contact: (Analysts) Kevin Kalicak (407) 245-5870 (Media) Rich Jeffers (407) 245-4189 DARDEN RESTAURANTS REPORTS FISCAL 2016 SECOND QUARTER RESULTS; REPORTS POSITIVE SAME-RESTAURANT
FOR IMMEDIATE RELEASE Contact: (Analysts) Kevin Kalicak (407) 245-5870 (Media) Rich Jeffers (407) 245-4189 DARDEN RESTAURANTS REPORTS FISCAL 2016 SECOND QUARTER RESULTS; REPORTS POSITIVE SAME-RESTAURANT
Quarterly Concept Dashboard 2Q:14 Benchmarking for $1B+ Chains and Other Select Concepts System Stats, Unit Sales & Margins, Build Costs, Valuations
 Quarterly Concept Dashboard 2Q:14 Benchmarking for $1B+ Chains and Other Select Concepts System Stats, Unit Sales & Margins, Build Costs, Valuations Casual Buffalo Wild Wings Cheesecake Factory Chili's
DARDEN RESTAURANTS REPORTS FISCAL 2017 FOURTH QUARTER AND FULL YEAR RESULTS; FOURTH QUARTER SAME-RESTUARANT SALES GROWTH OF 3
 Contacts: (Analysts) Kevin Kalicak (407) 245-5870 (Media) Rich Jeffers (407) 245-4189 DARDEN RESTAURANTS REPORTS FISCAL 2017 FOURTH QUARTER AND FULL YEAR RESULTS; FOURTH QUARTER SAME-RESTUARANT SALES GROWTH
Segment Performance Segment profit represents sales, less costs for food and beverage, restaurant labor, restaurant expenses and marketing expenses.
 Darden Restaurants Reports Fiscal 2018 Fourth Quarter and Full Year Results; Fourth Quarter Same-Restaurant Sales Growth of 2.2%; Increases Quarterly Dividend 19% to $0.75; And Provides Fiscal 2019 Outlook
Segment Performance Segment profit represents sales, less costs for food and beverage, restaurant labor, restaurant expenses and marketing expenses.
 EXHIBIT 99.1 Darden Restaurants Reports Fiscal 2019 Third Quarter Results; Increases Financial Outlook For The Full Fiscal Year; And Declares Regular Quarterly Dividend ORLANDO, Fla., March 21, 2019 /PRNewswire/
Darden Restaurants Reports Fiscal 2019 First Quarter Results and Increases Financial Outlook For The Full Fiscal Year
 Darden Restaurants Reports Fiscal 2019 First Quarter Results and Increases Financial Outlook For The Full Fiscal Year ORLANDO, Fla., September 20, 2018 /PRNewswire/ -- Darden Restaurants, Inc., (NYSE:DRI)
Investor Presentation October 2018
 Investor Presentation October 2018 Safe Harbor Statement This presentation contains forward-looking statements about our current and presently expected performance trends, growth plans, business goals
Bloomin' Brands Announces 2015 Third Quarter Adjusted Diluted EPS of $0.15 and Diluted EPS of $0.13;
 November 3, Bloomin' Brands Announces Third Quarter Adjusted Diluted EPS of $0.15 and Diluted EPS of $0.13; Reaffirms Guidance for Adjusted Diluted EPS of At Least $1.27; Repurchases $60 Million of Common
Investor Presentation. July 2018
 Investor Presentation July 2018 Disclaimer/Non-GAAP Information IMPORTANT NOTICE The following slides are part of a presentation by Darden Restaurants, Inc. (the "Company") and are intended to be viewed
DARDEN RESTAURANTS REPORTS FISCAL 2018 FIRST QUARTER RESULTS AND REAFFIRMS FINANCIAL OUTLOOK FOR THE FULL FISCAL YEAR
 Contact: (Analysts) Kevin Kalicak (407) 245-5870 (Media) Rich Jeffers (407) 245-4189 DARDEN RESTAURANTS REPORTS FISCAL 2018 FIRST QUARTER RESULTS AND REAFFIRMS FINANCIAL OUTLOOK FOR THE FULL FISCAL YEAR
THE CLASSIFIED BALANCE SHEET
 ACTIVITY 11 Purpose: THE CLASSIFIED BALANCE SHEET Identify account classifications typically used on the balance sheet STARBUCKS (SBUX) 9/28/2008 BALANCE SHEET ($ in millions) ASSETS LIABILITIES Cash and
Darden Restaurants Reports Fiscal 2018 Third Quarter Results And Increases Financial Outlook For The Full Fiscal Year
 Darden Restaurants Reports Fiscal 2018 Third Quarter Results And Increases Financial Outlook For The Full Fiscal Year ORLANDO, Fla., March 22, 2018 /PRNewswire/ -- Darden Restaurants, Inc., (NYSE:DRI)
Pending Acquisition of Sleep Train. September 4, 2014
 Pending Acquisition of Sleep Train September 4, 2014 Forward Looking Statements and Non-GAAP Information This presentation contains forward-looking statements within the meaning of federal securities laws,
Total third quarter sales from continuing operations of $1.87 billion represent a 4.2% increase over the prior year.
 Darden Restaurants Reports 22% Increase in Third Quarter Diluted Net Earnings Per Share; Increases Annual Diluted Net Earnings Per Share Outlook; Announces Quarterly Dividend of 25 Cents Per Share ORLANDO,
Yum China Reports First Quarter 2018 Results. May 1, :30 PM ET
 Yum China Reports First Quarter 2018 Results May 1, 2018 4:30 PM ET SHANGHAI, May 1, 2018 /PRNewswire/ -- Yum China Holdings, Inc. (the "Company" or "Yum China") (NYSE: YUMC) today reported unaudited results
Restaurant Industry Overview and Valuation
 A Specialized Investment Bank Restaurant Industry Overview and Valuation Pacific Financial Plaza 860 Newport Center Drive Newport Beach CA 92660 949.219.5296 July 2007 949.720.9194 fax WWW.CBCAPITAL.COM
WEEKS ENDED. Adjusted diluted earnings per share* $ 0.46 $ 0.50 $ (0.04)
") May 9, 2014 Bloomin' Brands, Inc. Announces Fiscal 2014 First Quarter Adjusted Diluted Earnings Per Share of $0.46 and GAAP Diluted Earnings Per Share of $0.42; Reaffirms Full-Year 2014 Guidance Including
May 9, 2014 Bloomin' Brands, Inc. Announces Fiscal 2014 First Quarter Adjusted Diluted Earnings Per Share of $0.46 and GAAP Diluted Earnings Per Share of $0.42; Reaffirms Full-Year 2014 Guidance Including
DARDEN RESTAURANTS, INC.
 (Mark One) UNITED STATES SECURITIES AND EXCHANGE COMMISSION Washington, D.C. 20549 FORM 10-Q x QUARTERLY REPORT PURSUANT TO SECTION 13 OR 15(d) OF THE SECURITIES EXCHANGE ACT OF 1934 For the quarterly
Performance Food Group Company Reports Third-Quarter Fiscal 2016 Results: Provides Full-Year Fiscal 2016 Adjusted EBITDA Growth Outlook of 10% to 12%
 NEWS RELEASE For Immediate Release May 4, 2016 Investors: Michael D. Neese VP, Investor Relations (804) 287-8126 michael.neese@pfgc.com Media: Joe Vagi Manager, Corporate Communications (804) 484-7737
Jacky Lo Chief Finance Officer, Yum China
 Jacky Lo Chief Finance Officer, Yum China Cautionary Language Regarding Forward-Looking Statements Forward-Looking Statements. Our presentation may contain forward-looking statements within the meaning
UNITED STATES SECURITIES AND EXCHANGE COMMISSION WASHINGTON, DC FORM 8-K
 UNITED STATES SECURITIES AND EXCHANGE COMMISSION WASHINGTON, DC 20549 FORM 8-K CURRENT REPORT Pursuant to Section 13 or 15(d) of the Securities Exchange Act of 1934 Date of report (Date of earliest event
 Page 1 of 7 Release Yum! Brands Inc. Announces 2011 EPS Growth of 7%, Or $0.63 Per Share, Excluding Special Items; Driven by Outstanding China and Emerging Market Performance LOUISVILLE, Ky., Apr 20, 2011
THE KEG ROYALTIES INCOME FUND FIRST QUARTER REPORT
 THE KEG ROYALTIES INCOME FUND FIRST QUARTER REPORT For the three months ended March 31, 2010 TO OUR UNITHOLDERS On behalf of the Board of Trustees, I am pleased to present the results of The Keg Royalties
NEWS. Tim Jerzyk Senior Vice President, Investor Relations
 NEWS Tim Jerzyk Senior Vice President, Investor Relations Yum! Brands Inc. Announces First Quarter 2011 EPS Growth of 7%, Or $0.63 Per Share, Excluding Special Items; Driven by Outstanding China and Emerging
Investor Presentation January 2013
 Investor Presentation January 2013 Texas Roadhouse, Inc Safe Harbor Statement and Reconciliation of Non-GAAP Financial Measures Under the Private Securities Litigation Reform Act of 1995 Certain statements
ACTIVITY 12 CROSSWORD PUZZLE FOR CHAPTER 2
 ACTIVITY 12 CROSSWORD PUZZLE FOR CHAPTER 2 Across 5. Lends money 6. Extra value recorded when buying another company 8. Reports assets, liabilities, and stockholders equity (2 words) 9. Investments available
CL King s Annual Best Ideas Conference
 WELCOME TO AMERICA S DINER CL King s Annual Best Ideas Conference September 10, 2015 Forward Looking Statements and Non-GAAP Financial Measures Denny s Corporation urges caution in considering its current
EARNINGS CALL. FISCAL 2018: Q3 RESULTS March 22, 2018
 EARNINGS CALL FISCAL 2018: Q3 RESULTS March 22, 2018 Disclaimer/Non-GAAP Information IMPORTANT NOTICE The following slides are part of a presentation by Darden Restaurants, Inc. (the "Company") and are
Investor Deck. March, 2018 NASDAQ: BURG NASDAQ: BURG 1
 Investor Deck March, 2018 NASDAQ: BURG NASDAQ: BURG 1 This Is Our Story Chanticleer Holdings was formed and went public in June 2005 as a BDC (investment company) led by CEO Mike Pruitt and two financial
Page 1/12. Yum China Reports Fourth Quarter and Full Year 2017 Results. February 7, :30 PM ET
 Yum China Reports Fourth Quarter and Full Year 2017 Results February 7, 2018 4:30 PM ET SHANGHAI, Feb. 7, 2018 /PRNewswire/ -- (the "Company" or "Yum China") (NYSE: YUMC) today reported unaudited results
Investor Presentation. Domino s Pizza
 Investor Presentation Domino s Pizza July 2005 Forward-Looking Statements This presentation and our accompanying comments may contain forward-looking statements. These statements relate to future events
FORM 8-K EL POLLO LOCO HOLDINGS, INC.
 UNITED STATES SECURITIES AND EXCHANGE COMMISSION Washington, D.C. 20549 FORM 8-K CURRENT REPORT Pursuant to Section 13 OR 15(d) of The Securities Exchange Act of 1934 Date of Report (Date of earliest event
Cara Operations to Merge with Keg Restaurants Ltd. January 23, 2018
 Cara Operations to Merge with Keg Restaurants Ltd. January 23, 2018 Disclaimers This presentation contains forward-looking information within the meaning of applicable securities laws. In some cases, forward-looking
POTBELLY CORPORATION REPORTS RESULTS FOR FOURTH FISCAL QUARTER AND FULL FISCAL YEAR 2017
 POTBELLY CORPORATION REPORTS RESULTS FOR FOURTH FISCAL QUARTER AND FULL FISCAL YEAR 2017 Chicago, IL, February 23, 2018 Potbelly Corporation (NASDAQ: PBPB) today reported financial results for the fourth
July 30, Highlights for Q include the following:
 Bloomin' Brands Announces 2018 Q2 Diluted EPS of $0.28 and Adjusted Diluted EPS of $0.38; Q2 Comparable Restaurant Sales Growth of 4.0% at Outback and 2.4% Combined ; Reaffirms Full Year 2018 Guidance
The Wendy s Company Reports Audited Full-Year 2012 Results
 The Wendy s Company Reports Audited Full-Year 2012 Results Fourth-Quarter Adjusted EBITDA Increased 19% to $95.9 Million; Full-Year Adjusted EBITDA Increased 1% to $333.3 Million Positive Momentum from
CEC Entertainment, Inc. Reports Financial Results for the 2018 Third Quarter
 News Release CEC Entertainment, Inc. Reports Financial Results for the Third Quarter IRVING, Texas - November 8, - CEC Entertainment, Inc. (the Company ) today announced financial results for its third
First Quarter Fiscal Calendar Calculation Dates January 1, April 1, 2018 vs. December 26, March 26, 2017
 Bloomin' Brands Announces 2018 Q1 Diluted EPS of $0.68 and Adjusted Diluted EPS of $0.71; Q1 Comparable Restaurant Sales Growth of 4.3% at Outback With Positive Traffic of 2.2%; Q1 Combined Comparable
POTBELLY CORPORATION REPORTS RESULTS FOR SECOND FISCAL QUARTER 2017
 POTBELLY CORPORATION REPORTS RESULTS FOR SECOND FISCAL QUARTER 2017 Chicago, IL, August 4, 2017 Potbelly Corporation (NASDAQ: PBPB) today reported financial results for the second fiscal quarter ended
DINEEQUITY OVERVIEW JUNE 2016
 JULIA STEWART CHAIRMAN AND CEO AND PRESIDENT OF APPLEBEE S DINEEQUITY OVERVIEW JUNE 2016 Forward-Looking Information: Statements contained in this presentation may constitute forward-looking statements
The Innovator in Bar-Restaurant-Entertainment Themed Hospitality
 The Innovator in Bar-Restaurant-Entertainment Themed Hospitality NASDAQ: RICK 4Q16 Conference Call Presentation December 13, 2016 www.rcihospitality.com Forward-Looking Statements Certain statements contained
THREE MONTHS ENDED MARCH 31, $ Change Diluted earnings per share $ 0.50 $ 0.47 $ 0.03 Adjustments (1) 0.02 (0.02)
 0.02 (0.02)") April 30, 2013 Bloomin' Brands, Inc. Announces First Quarter Adjusted Diluted Earnings Per Pro Forma Share of $0.50 and GAAP Diluted Earnings Per Share of $0.50; Raises Full-Year 2013 Guidance for Adjusted
April 30, 2013 Bloomin' Brands, Inc. Announces First Quarter Adjusted Diluted Earnings Per Pro Forma Share of $0.50 and GAAP Diluted Earnings Per Share of $0.50; Raises Full-Year 2013 Guidance for Adjusted
Industry Data Report New Unit Investment
 Data, Analysis & Insight for a Stronger Industry Building Bridges between Franchisees, Franchisors & Financiers Industry Data Report New Unit Investment 2018-2019 RR s New Unit Investment Industry Data
EARNINGS CALL. FISCAL 2018: Q1 RESULTS September 26, 2017
 EARNINGS CALL FISCAL 2018: Q1 RESULTS September 26, 2017 Disclaimer/Non-GAAP Information IMPORTANT NOTICE The following slides are part of a presentation by Darden Restaurants, Inc. (the "Company") and
Bloomin Brands, Inc. Overview
 Bloomin Brands, Inc. Overview Forward Looking Statements Certain information contained in this presentation, particularly information regarding future economic performance, finances, and expectations and
INVESTOR PRESENTATION SEPTEMBER 2018
 INVESTOR PRESENTATION SEPTEMBER 2018 Forward-Looking Statements Forward looking statements This presentation includes statements that are, or may deemed to be, forward-looking statements. These forward-looking
Chanticleer Holdings Reports Asset and Revenue Growth and Improvement in Gross Profit Margins for Q4 and Full Year 2013 Financials
 March 31, 2014 Chanticleer Holdings Reports Asset and Revenue Growth and Improvement in Gross Profit Margins for Q4 and Full Year 2013 Financials CHARLOTTE, NC -- (Marketwired) -- 04/01/14 -- Chanticleer
NEWS. Tim Jerzyk Senior Vice President, Investor Relations
 NEWS Tim Jerzyk Senior Vice President, Investor Relations Yum! Brands Reports First-Quarter EPS Growth of 21%, or $0.76 Per Share, Excluding Special Items; Strong Sales and Operating Profit Growth Across
Jefferies Global Industrials Conference
 Jefferies Global Industrials Conference August 14, 2014 Lee D. Rudow President and CEO John J. Zimmer Sr. Vice President of Finance and CFO Safe Harbor Statement This presentation contains forward-looking
Investors: Michael D. Neese VP, Investor Relations (804)
") NEWS RELEASE For Immediate Release August 17, 2016 Investors: Michael D. Neese VP, Investor Relations (804) 287-8126 michael.neese@pfgc.com Media: Joe Vagi Manager, Corporate Communications (804) 484-7737
NEWS RELEASE For Immediate Release August 17, 2016 Investors: Michael D. Neese VP, Investor Relations (804) 287-8126 michael.neese@pfgc.com Media: Joe Vagi Manager, Corporate Communications (804) 484-7737
CBRL GROUP, INC. ANNOUNCES 25% INCREASE IN FOURTH-QUARTER AND 27% INCREASE IN FULL-YEAR DILUTED NET INCOME PER SHARE FOR FISCAL 2003
 Contact: Lawrence E. White Senior Vice President/ Finance and Chief Financial Officer CBRL GROUP, INC. ANNOUNCES 25% INCREASE IN FOURTH-QUARTER AND 27% INCREASE IN FULL-YEAR DILUTED NET INCOME PER SHARE
UNITED STATES SECURITIES AND EXCHANGE COMMISSION WASHINGTON, DC FORM 8-K
 UNITED STATES SECURITIES AND EXCHANGE COMMISSION WASHINGTON, DC 20549 FORM 8-K CURRENT REPORT Pursuant to Section 13 or 15(d) of the Securities Exchange Act of 1934 Date of report (Date of earliest event
Dine Brands Global, Inc. Investor Presentation. March 5, 2018
 Dine Brands Global, Inc. Investor Presentation March 5, 2018 2 Disclosures Forward-Looking Information: The content contained in this presentation is as of February 21, 2018. The Company assumes no obligation
Third Quarter Presentation
 Third Quarter Presentation November 6, 2018 Presented by: Jerry Volas, CEO Robert Buck, President & COO John Peterson, CFO SAFE HARBOR Statements contained in this presentation that are not historical
Investor Presentation JANUARY 2016
 Investor Presentation JANUARY 2016 FORWARD-LOOKING STATEMENTS Forward-Looking Statements This presentation contains forward-looking statements that are subject to risks and uncertainties. All statements
2012 INVESTOR PRESENTATION
 2012 INVESTOR PRESENTATION OCTOBER 2012 P: 702-341-2400 W: AffinityGamingLLC.com 1 SAFE HARBOR This presentation contains forward-looking statements within the meaning of the Private Securities Litigation
Earnings Conference Call Third Quarter November 20, 2007
 Earnings Conference Call Third Quarter 2007 November 20, 2007 Safe Harbor Statement The Private Securities Litigation Reform Act of 1995 (the Act ) provides protection from liability in private lawsuits
PANERA BREAD COMPANY
 UVA-F-1575 Rev. Sept. 3, 2009 As the end of 2007 drew near, Panera Bread Company was facing a brand-new challenge. Until recently, strong margins had allowed Panera to finance its rapid growth largely
Buffalo Wild Wings, Inc. Announces Fourth Quarter Earnings per Share of $0.89 and Annual Net Earnings Growth of Over 13% for 2012
 FOR IMMEDIATE RELEASE Investor Relations Contact: Mary Twinem 952.253.0731 Mary Twinem CFO Buffalo Wild Wings, Inc. Announces Fourth Quarter Earnings per Share of $0.89 and Annual Net Earnings Growth of
UNITED STATES SECURITIES AND EXCHANGE COMMISSION Washington, D.C FORM 8-K
 UNITED STATES SECURITIES AND EXCHANGE COMMISSION Washington, D.C. 20549 FORM 8-K CURRENT REPORT Pursuant to Section 13 or 15(d) of the Securities Exchange Act of 1934 Date of Report (Date of earliest event
DARDEN RESTAURANTS, INC.
 (Mark One) x UNITED STATES SECURITIES AND EXCHANGE COMMISSION Washington, D.C. 20549 FORM 10-Q QUARTERLY REPORT PURSUANT TO SECTION 13 OR 15(d) OF THE SECURITIES EXCHANGE ACT OF 1934 For the quarterly
(Logo: )
") Darden Restaurants Reports 13% Increase in Annual Diluted Net EPS From Continuing Operations; Announces Quarterly Dividend of 18 Cents Per Share; Discusses Fiscal 2008 Financial Outlook ORLANDO, Fla.,
Darden Restaurants Reports 13% Increase in Annual Diluted Net EPS From Continuing Operations; Announces Quarterly Dividend of 18 Cents Per Share; Discusses Fiscal 2008 Financial Outlook ORLANDO, Fla.,
EARNINGS CALL. FISCAL 2018: Q4 & ANNUAL RESULTS June 21, 2018
 EARNINGS CALL FISCAL 2018: Q4 & ANNUAL RESULTS June 21, 2018 Disclaimer/Non-GAAP Information IMPORTANT NOTICE The following slides are part of a presentation by Darden Restaurants, Inc. (the "Company")
Texas Roadhouse, Inc. Announces First Quarter 2008 Results
 Texas Roadhouse, Inc. Announces First Quarter 2008 Results LOUISVILLE, Ky.--(BUSINESS WIRE)--April 28, 2008--Texas Roadhouse, Inc. (NasdaqGS: TXRH), today announced financial results for the 13 week period
US Ecology, Inc. Q Earnings Conference Call
 US Ecology, Inc. Q4 2017 Earnings Conference Call February 16, 2018 1 Today s Hosts Jeff Feeler Chairman & Chief Executive Officer Eric Gerratt Executive Vice President & Chief Financial Officer Steve
Yum! China. Mark Chu. Yum! China President & COO
 Yum! China Mark Chu Yum! China President & COO 2010: Good Performance Across Virtually Every Front Same store sales growth on track to be 5%+ Margins up 1 point, to reach 22% Development on track Business
Darden Restaurants Reports Annual and Fourth Quarter Diluted Net Earnings Per Share
 Darden Restaurants Reports Annual and Fourth Quarter Diluted Net Earnings Per Share ORLANDO, Fla., June 20, 2005 /PRNewswire-FirstCall via COMTEX/ -- Darden Restaurants, Inc. (NYSE: DRI) today reported
GOLDEN ENTERTAINMENT REPORTS RECORD 2017 FOURTH QUARTER NET REVENUE OF $184.3 MILLION, NET LOSS OF $13.4 MILLION AND ADJUSTED EBITDA OF $29.
 GOLDEN ENTERTAINMENT REPORTS RECORD 2017 FOURTH QUARTER NET REVENUE OF $184.3 MILLION, NET LOSS OF $13.4 MILLION AND ADJUSTED EBITDA OF $29.0 MILLION LAS VEGAS March 15, 2018 Golden Entertainment, Inc.
Fogo de Chão, Inc. Reports Third Quarter 2017 Results
 Fogo de Chão, Inc. Reports Third Quarter Results Dallas, Texas, (November 7, ) - Fogo de Chão, Inc. (NASDAQ: FOGO) today reported financial results for its 13-week fiscal third quarter ended October 1,.
EARNINGS CALL. FISCAL 2018: Q2 RESULTS December 19, 2017
 EARNINGS CALL FISCAL 2018: Q2 RESULTS December 19, 2017 Disclaimer/Non-GAAP Information IMPORTANT NOTICE The following slides are part of a presentation by Darden Restaurants, Inc. (the "Company") and
2014 Annual Report Dar den Restaurants, Inc Annual Report 1000 Darden Center Drive Orlando, FL
 2014 Annual Report Our Business As one of the world s largest restaurant companies, is focused on performance from the dining room to the boardroom. Our goal is to nourish and delight every guest we serve,
LANCASTER COLONY REPORTS SECOND QUARTER SALES AND EARNINGS
 FOR IMMEDIATE RELEASE January 26, 2017 SYMBOL: LANC TRADED: Nasdaq LANCASTER COLONY REPORTS SECOND QUARTER SALES AND EARNINGS COLUMBUS, Ohio, January 26 - Lancaster Colony Corporation (Nasdaq: LANC) today
The innovator in bar-restaurant-entertainment hospitality. NASDAQ: RICK Investor Presentation March-April 2016
 The innovator in bar-restaurant-entertainment hospitality NASDAQ: RICK Investor Presentation March-April 2016 www.rcihospitality.com Forward Looking Statements Certain statements contained in this presentation
Jack in the Box Inc. Reports First Quarter FY 2013 Earnings; Updates Guidance for FY 2013
 Investor Contact: Carol DiRaimo, (858) 571-2407 FOR IMMEDIATE RELEASE Media Contact: Brian Luscomb, (858) 571-2291 Reports First Quarter FY 2013 Earnings; Updates Guidance for FY 2013 SAN DIEGO, February
Steve Schmitt Vice President, Investor Relations & Corporate Strategy
 NEWS Steve Schmitt Vice President, Investor Relations & Corporate Strategy Yum! Brands Reports Second-Quarter EPS of $0.69, a Decline of 5%, Excluding Special Items; Expects Strong Second Half in China;
February 11, Whole Foods Market, Inc. (NASDAQ: WFM) today reported results for the 16-week first quarter ended January 18, 2015.
 today reported results for the 16-week first quarter ended January 18, 2015.") Whole Foods Market Delivers Record Q1 Sales and EPS Comparable Store Sales Increase 4.5%, Accelerating on a One- and Two-Year Basis due Primarily to Traffic Growth; Sales Increase 10% to Record $4.7 billion;
Whole Foods Market Delivers Record Q1 Sales and EPS Comparable Store Sales Increase 4.5%, Accelerating on a One- and Two-Year Basis due Primarily to Traffic Growth; Sales Increase 10% to Record $4.7 billion;
Bassett Announces Fiscal First Quarter Results
 Bassett Announces Fiscal First Quarter Results March 28, 2018 BASSETT, Va., March 28, 2018 (GLOBE NEWSWIRE) -- Bassett Furniture Industries, Inc. (Nasdaq:BSET) announced today its results of operations
Second Quarter 2018 Results
 Second Quarter 2018 Results August 21, 2018 CLASSIFIED INTERNAL USE ONLY Forward-Looking Statements Forward-looking statements in this presentation regarding the Company s future performance, restaurant
The Innovator in Bar-Restaurant-Entertainment Themed Hospitality
 The Innovator in Bar-Restaurant-Entertainment Themed Hospitality NASDAQ: RICK 1Q17 Conference Call Presentation February 9, 2017 www.rcihospitality.com Forward-Looking Statements Certain statements contained
Del Taco Restaurants, Inc. (Exact name of registrant as specified in its charter)
") UNITED STATES SECURITIES AND EXCHANGE COMMISSION WASHINGTON, DC 20549 FORM 8-K CURRENT REPORT Pursuant to Section 13 or 15(d) of the Securities Exchange Act of 1934 Date of Report (Date of earliest event
UNITED STATES SECURITIES AND EXCHANGE COMMISSION WASHINGTON, DC 20549 FORM 8-K CURRENT REPORT Pursuant to Section 13 or 15(d) of the Securities Exchange Act of 1934 Date of Report (Date of earliest event
OTCQX Virtual Investor Conference October 5, 2017
 OTCQX Virtual Investor Conference October 5, 2017 SAFE HARBOR STATEMENT Certain information in this presentation, particularly information regarding future economic performance and finances, and plans,
Las Vegas Sands Corp. Reports Third Quarter 2009 Results
 Press Release Las Vegas Sands Corp. Reports Third Quarter 2009 Results Consolidated Adjusted Property EBITDAR Increases 11.7 percent to $272.3 Million on Net Revenue Increase of 3.2 percent Venetian Macao
The Innovator in Bar-Restaurant-Entertainment Themed Hospitality. Nasdaq: RICK Investor Presentation May
 The Innovator in Bar-Restaurant-Entertainment Themed Hospitality Nasdaq: RICK Investor Presentation May 2018 www.rcihospitality.com Forward-Looking Statements Certain statements contained in this presentation
HollyFrontier Corporation Reports Quarterly Results
 HollyFrontier Corporation Reports Quarterly Results October 31, 2018 DALLAS--(BUSINESS WIRE)--Oct. 31, 2018-- HollyFrontier Corporation (NYSE:HFC) ( HollyFrontier or the Company ) today reported third
3, Brands 79% Corporate 21% Franchises. units 72, ,257. Our presence. employees. millions clients served. Mexico. Spain.
 2Q17 Our presence 14 Brands 79% Corporate 21% Franchises 3,291 units 72,000 employees +423 millions clients served 2,257 Mexico 519 Spain 222 Argentina 139 Colombia 150 Chile 4 Brazil 2Q17 Alsea 2 Alsea
POTBELLY CORPORATION REPORTS RESULTS FOR FOURTH FISCAL QUARTER AND FULL FISCAL YEAR 2016
 POTBELLY CORPORATION REPORTS RESULTS FOR FOURTH FISCAL QUARTER AND FULL FISCAL YEAR 2016 Chicago, IL, February 14, 2017 Potbelly Corporation (NASDAQ: PBPB) today reported financial results for the fourth
UNITED STATES SECURITIES AND EXCHANGE COMMISSION Washington, D.C FORM 8-K
 UNITED STATES SECURITIES AND EXCHANGE COMMISSION Washington, D.C. 20549 FORM 8-K CURRENT REPORT PURSUANT TO SECTION 13 OR 15(d) OF THE SECURITIES EXCHANGE ACT OF 1934 Date of Report (Date of earliest event
Adjusted EPS Reported EPS Number of shares (millions)
") ORIENT-EXPRESS HOTELS ANNOUNCES THIRD QUARTER RESULTS. EBITDA $59.2 MILLION, UP 20% OVER PRIOR YEAR. PRE-TAX EARNINGS $34.8 MILLION, UP 36% OVER 2006. NET EARNINGS OF $22.6 MILLION. ADJUSTED NET EARNINGS
ORIENT-EXPRESS HOTELS ANNOUNCES THIRD QUARTER RESULTS. EBITDA $59.2 MILLION, UP 20% OVER PRIOR YEAR. PRE-TAX EARNINGS $34.8 MILLION, UP 36% OVER 2006. NET EARNINGS OF $22.6 MILLION. ADJUSTED NET EARNINGS
Darden Restaurants, Inc.
 Darden Restaurants, Inc. DRI: Reports Solid Performance; Expectations Were Pretty High Despite Evidence Segment Is Slowing Our View: We reiterate our OW rating following shares coming under pressure because
Whole Foods Market Reports First Quarter Results
 Whole Foods Market Reports First Quarter Results Company Produces Record Sales of $4.9 Billion; Delivers GAAP EPS of $0.30 and Adjusted EPS of $0.39; Resets Growth Strategy and Accelerates Timeline for
Regular Meeting of Shareholders. June 25, 2008
 Regular Meeting of Shareholders June 25, 2008 RICHARD M. SCHULZE Founder and Chairman Director since 1966 2 Agenda Election of Directors Ratification of Appointment of Deloitte & Touche LLP Approve 2008
SIR Royalty Income Fund. Investor Presentation (TSX: SRV.UN) April 2018
 April 2018") SIR Royalty Income Fund Investor Presentation (TSX: SRV.UN) April 2018 0 Caution Concerning Forward-Looking Statements Statements in this presentation, including the information set forth as to the future
SIR Royalty Income Fund Investor Presentation (TSX: SRV.UN) April 2018 0 Caution Concerning Forward-Looking Statements Statements in this presentation, including the information set forth as to the future
The Innovator in Bar-Restaurant-Entertainment Themed Hospitality
 The Innovator in Bar-Restaurant-Entertainment Themed Hospitality NASDAQ: RICK 4Q16 Update Conference Call Presentation October 13, 2016 www.rcihospitality.com Forward Looking Statements Certain statements
SONIC'S SECOND QUARTER EARNINGS PER SHARE INCREASE 22%
 Contact: Stephen C. Vaughan Vice President and Chief Financial Officer (405) 225-4800 SONIC'S SECOND QUARTER EARNINGS PER SHARE INCREASE 22% Sales Initiatives Continue to Generate Strong Momentum as System-Wide