Dine Brands Global, Inc. Investor Presentation December 2018
|
|
|
- Kory Goodman
- 5 years ago
- Views:
Transcription


1 Dine Brands Global, Inc. Investor Presentation December 2018
2 Disclosures Forward-Looking Information: The content contained in this presentation is as of December 4, The Company assumes no obligation to update or supplement the information. Statements contained in this presentation may constitute forward-looking statements within the meaning of Section 27A of the Securities Act of 1933, as amended, and Section 21E of the Securities Exchange Act of 1934, as amended. You can identify these forward-looking statements by words such as "may," "will," would, "should," could, "expect," "anticipate," "believe," "estimate," "intend," "plan," goal and other similar expressions. These statements involve known and unknown risks, uncertainties and other factors, which may cause actual results to be materially different from those expressed or implied in such statements. These factors include, but are not limited to: general economic conditions; our level of indebtedness; compliance with the terms of our securitized debt; our ability to refinance our current indebtedness or obtain additional financing; our dependence on information technology; potential cyber incidents; the implementation of restaurant development plans; our dependence on our franchisees; the concentration of our Applebee s franchised restaurants in a limited number of franchisees; the financial health our franchisees; our franchisees and other licensees compliance with our quality standards and trademark usage; general risks associated with the restaurant industry; potential harm to our brands reputation; possible future impairment charges; the effects of tax reform; trading volatility and fluctuations in the price of our stock; our ability to achieve the financial guidance we provide to investors; successful implementation of our business strategy; the availability of suitable locations for new restaurants; shortages or interruptions in the supply or delivery of products from third parties or availability of utilities; the management and forecasting of appropriate inventory levels; development and implementation of innovative marketing and use of social media; changing health or dietary preference of consumers; risks associated with doing business in international markets; the results of litigation and other legal proceedings; third-party claims with respect to intellectual property assets; our ability to attract and retain management and other key employees; compliance with federal, state and local governmental regulations; risks associated with our self-insurance; natural disasters or other series incidents; our success with development initiatives outside of our core business; the adequacy of our internal controls over financial reporting and future changes in accounting standards; and other factors discussed from time to time in the Company's Annual and Quarterly Reports on Forms 10-K and 10-Q and in the Company's other filings with the Securities and Exchange Commission. The forward-looking statements contained in this release are made as of the date hereof and the Company does not intend to, nor does it assume any obligation to, update or supplement any forward-looking statements after the date hereof to reflect actual results or future events or circumstances. Non-GAAP Financial Measures: This content includes references to the Company's non-gaap financial measure Adjusted free cash flow. Adjusted free cash flow for a given period is defined as cash provided by operating activities, plus receipts from notes and equipment contracts receivable, less capital expenditures. Management uses adjusted free cash flow in its periodic assessments of, among other things, the amount of cash dividends per share of common stock and repurchases of common stock and we believe it is important for investors to have the same measure used by management for that purpose. Adjusted free cash flow does not represent residual cash flow available for discretionary purposes. Additionally, Adjusted EPS is one of the metrics used in determining payouts under the Company s annual cash incentive plan. Adjusted EPS is computed for a given period by deducting from net income or loss available to common stockholders for such period the effect of any closure and impairment charges, any gain or loss related to debt extinguishment, any intangible asset amortization, any non-cash interest expense, any gain or loss related to the disposition of assets, and other items deemed not reflective of current operations. This is presented on an aggregate basis and a per share (diluted) basis. This content refers to the Company's non-gaap financial measure EBITDA. The Company defines "EBITDA" for a given period as income before income taxes less interest expense, loss on extinguishment of debt, depreciation and amortization, closure and impairment charges, non-cash stock-based compensation, gain or loss on disposition of assets and other charge backs that may be permitted under its securitization loan agreement. Management may use certain of these non-gaap financial measures along with the corresponding U.S. GAAP measures to evaluate the performance of the business and to make certain business decisions. Management believes that these non-gaap financial measures provide additional meaningful information that should be considered when assessing the business and the Company s performance compared to prior periods and the marketplace. Adjusted free cash flow, adjusted EPS and EBITDA are supplemental non-gaap financial measures and should not be considered in isolation or as a substitute for measures of performance prepared in accordance with U.S. GAAP. The Company does not provide a GAAP equivalent or non-gaap reconciliation for 2022 guidance due to the uncertainty associated with the metrics used to calculate such reconciliations, including the fluctuation and uncertainty in Company revenues and sales performance at our IHOP and Applebee s restaurants 2018 Dine Brands Global, Inc. All Rights Reserved. 1
3 Business Overview Two iconic brands IHOP and Applebee s 3,650+ restaurants 2017 system sales of $7.4 billion (1) #1 in U.S. Family and Casual dining (2) 100% franchised model (3) 2017 revenue of $738mm (4) and EBITDA of $224mm (5) Industry-leading margins and significant cash generation (6) Expanding international presence (1) Company s Form 10-K for fiscal 2017 (2) Annual ranking Nation s Restaurant News, Top 200, June 18, 2018 (3) On October 19, 2018, the Company signed an asset purchase agreement to acquire 69 Applebee s restaurants from a franchisee with the intent to refranchise them at the appropriate time. (4) Includes IHOP and Applebee s advertising revenue to reflect the impact of ASC 606 (5) See Appendix for reconciliation of the Company s income before taxes to EBITDA 2 (6) Data from FactSet Dine Brands Overview
4 Commitment to Success We are implementing a plan to return to growth at both brands We continue to pursue cost optimization opportunities We are committed to making the necessary investments to further strengthen the business for the long-term We expect to generate substantial adjusted free cash flow and earnings going forward We are excited about the future OUR GOAL IS TO CREATE SIGNIFICANT FUTURE VALUE FOR SHAREHOLDERS 3 Summary
5 Investment Highlights Significant Scale in the U.S. Robust EBITDA Margins Substantial Adjusted Cash Flow Generation 100% Franchised Model (1) with Strong and Improving Franchisee Base Leader in U.S. Family and Casual Dining (2) History of Significant Capital Return New Strategy, Culture and Philosophy Favorable Guest Dynamics (1) On October 19, 2018, the Company signed an asset purchase agreement to acquire 69 Applebee s restaurants from a franchisee with the intent to refranchise them at the appropriate time (2) Annual ranking Nation s Restaurant News, Top 200, June 18, Dine Brands Overview
6 Favorable Guest Dynamics IHOP GUEST AGE DEMOGRAPHICS APPLEBEE S GUEST AGE DEMOGRAPHICS 41% 25% 35% 27% 26% 19% 14% 26% 29% 20% 49% of guests are age 34 and below 28% 28% 30% 21% 15% 15% 45% of guests are age 34 and below (1) (2) Family Dining. Casual Dining Under Under Source: NPD Consumer Reports on Eating Share Trends (CREST) (1) Includes Denny s, Cracker Barrel, Bob Evans and Panera (2) Includes Chili s, Ruby Tuesday, TGI Fridays, Outback and Olive Garden 5 Dine Brands Overview
7 100% Franchised Model % FRANCHISED TODAY VS. AT 2007 MERGER (1) % FRANCHISED VS. FAMILY/CASUAL DINING PEERS (2) 100% 99% (2) 100% 100% (2) 74% Today 2007 Merger Company-operated 2007 Merger Today Dine Brands is the highest % franchised of Family / Casual Dining peers (1) On October 19, 2018, the Company signed an asset purchase agreement to acquire 69 Applebee s restaurants from a franchisee with the intent to refranchise them at the appropriate time. (2) Includes restaurants operated by area licensees (3) Public company 10-K filings Source: Company s Form 10-K filings, earnings press releases and internal Company data 6 Dine Brands Overview

8 Overview
9 Leader in Family Dining for the Last 11 Years 2017 SYSTEM-WIDE SALES VS. PEERS #1 in U.S. System Sales (1) $3.1 (1) Annual ranking by Nation s Restaurant News, Top 200, June 18, 2018 issue (IHOP rank based on latest fiscal year U.S. system-wide sales in the family dining category). 8


10 Consistent Restaurant Development Growth Continued net domestic development growth ~1,900 Non-traditional and small formats 1,671 Significant growth opportunities in urban/rural areas Source: Company s fiscal 2017 Form 10-K filing and Company projections. 9
11 Historical Performance vs. Peer Average SYSTEM SALES GROWTH CAGR (September) (1) NET UNIT GROWTH CAGR (Spring 2018) (2) 2.8% 1.8% 1.2% -0.6% Peer Average Peer Average (1) NPD (2) NPD Recount Peer average comprised of Bob Evans, Cracker Barrel and Denny s Document classification: Source: NPD Crest Internal through Only the five-year period ended September 30,

12 Growing Our Off-Premise Business TO-GO AND DELIVERY BUSINESSES TO DRIVE SIGNIFICANT FUTURE GROWTH 40% 35% 30% 25% OFF-PREMISE COMP SALES OFF-PREMISE AVERAGE CHECK $15.92 $20.49 AVERAGE CHECK FOR ONLINE ORDERS 29% HIGHER THAN CALL-IN 20% 15% 10% 5% 0% Q Q Q Q Call-in Orders Online Orders Source: Internal Company data 11


13 Overview
14 Leader in Casual Dining for the Last 11 Years 2017 SYSTEM-WIDE SALES VS. PEERS $4.1 #1 in U.S. System Sales (1) (1) Annual ranking by Nation s Restaurant News, Top 200, June 18, 2018 issue (Applebee s rank based on latest fiscal year U.S. system-wide sales in the casual dining category). 13
15 Applebee s Quarterly Comp Sales Improvement Comp sales improvement due to traffic-driving initiatives +1.3% +3.3% +5.7% +7.7% -6.2% -7.2% -7.9% -7.7% Q Q Q Q Q Q Q Q Source: Company s Form 10-Q filing for the fiscal third quarter ended September 30,
16 What s Changed at Applebee s? Menu improvements, which provide our guests with abundant value and variety Enhancing our guest demographic Enhanced relevance, appeal and health of the brand Dramatically improved overall guest satisfaction scores All-time high overall guest satisfaction score achieved in Q Scores improved sequentially each month year-to-date through Q Strong growth in our highly incremental off-premise business (1) (1) SMG 15
17 Off-Premise Relevance TO-GO COMP SALES Sustainable off-premise growth driven by traffic 37% Growth engine, highly incremental Ongoing optimization (technology, packaging, service) Best-positioned brand in CDR Actively implementing delivery 0.2% Q Q Source: Internal Company data and projections 16
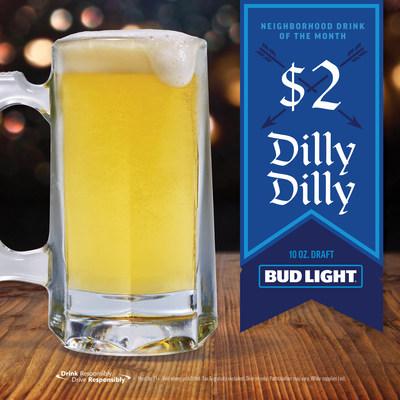
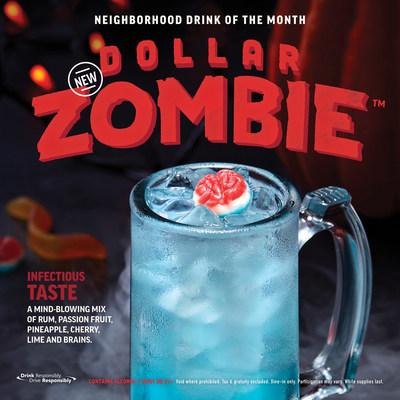
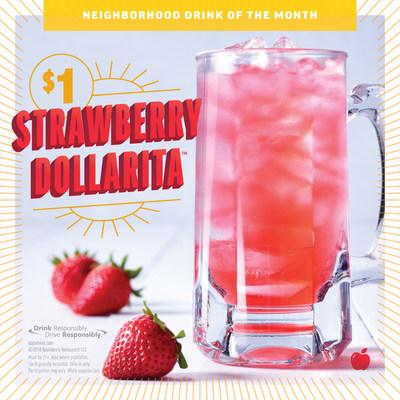
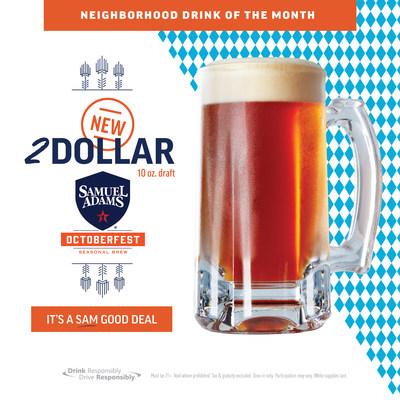
18 Buzzworthy Social Media-Driven Drink Promotions 17

19 Strong Asset Base RESTAURANT COUNT 1,782 ~1,750 92% of restaurants remodeled between Closing under-performing, non-viable restaurants Expect to begin traditional and non-traditional development again in 2019 Our growth plans have resulted in a stronger asset base 2017A 2018E 2019E 2020E 2021E 2022E Source: Internal Company data and projections 18
20 Financial Overview
21 Adjusted EBITDA Margin Improvement 45% 50% 100% franchised (1) business model generates significant profit on new revenue and industry-leading margins Q Q (2) Highly Franchised Peer Median Family / Casual Dining Peer (3) Median Source: FactSet, Company s Form 10-Q filings for the three months ended September 30, 2017 and September 30, 2018, respectively. Note: Excludes advertising revenue. See Appendix for reconciliation of non-gaap financial measures (1) On October 19, 2018, the Company signed an asset purchase agreement to acquire 69 Applebee s restaurants from a franchisee with the intent to refranchise them at the appropriate time. (2) Highly Franchised peers include Denny s, Dominos, Dunkin, Restaurant Brands International, Wendy s, Sonic, Jack in the Box and Papa John s. (3) Family / Casual Dining peers include Darden, Cracker Barrel, Brinker, Texas Roadhouse, Bloomin, Cheesecake Factory, Buffalo Wild Wings, BJ s, and Red Robin. 20 Financial Overview
22 Substantial Cash Flow Generation Investment to drive growth at both brands Attractive capital return to shareholders Minimal capex requirements ADJUSTED FREE CASH FLOW (2) ($mm) $123 $63 Includes $30M in corporate Ad fund contributions for Applebee s $106 - $121 Guidance FULLY-FRANCHISED (1) AND ASSET-LITE MODEL GENERATES SUBSTANTIAL ADJUSTED FREE CASH FLOW 2016A 2017A 2018E (1) On October 19, 2018, the Company signed an asset purchase agreement to acquire 69 Applebee s restaurants from a franchisee with the intent to refranchise them at the appropriate time. (2) See appendix for reconciliation of the Company's cash provided by operating activities to adjusted free cash flow Source: Company s Form 10-K filings for fiscal years 2016 and 2017, and Company projections 21 Financial Overview
23 History of Significant Capital Return Shareholder-friendly capital return policy via dividends and share repurchases Quarterly cash dividend of $0.63 per share in Q (implied yield of ~2.8% (1), attractive vs. industry peers) Returned an average of nearly $100 million to shareholders each year since 2013 through Q SINCE LAUNCHING ITS CURRENT CAPITAL RETURN STRATEGY IN 2013, DINE HAS RETURNED ~$568 MILLION TO SHAREHOLDERS THROUGH CASH DIVIDENDS AND SHARE REPURCHASES COMBINED Source: Company s Form 10-K filings for fiscal years and Form 10-Q filing for the fiscal third quarter ended September 30, 2018 (1) Based on the closing price of the Company s common stock on the New York Stock Exchange on November 29, Financial Overview
24 Projected Annual Shareholder Growth Algorithm WE ARE COMMITTED TO CREATING SIGNIFICANT FUTURE VALUE FOR SHAREHOLDERS ADJUSTED EPS GROWTH (1) High teens DIVIDEND YIELD EXPECTED TOTAL SHAREHOLDER RETURN ~2.8% (2) 20%+ (1) Company s internal data and projections for compound annual growth rate between fiscal 2017 and fiscal (2) Based on the closing price of the Company s common stock on the New York Stock Exchange on November 29, Financial Overview
25 Commitment to Success We are implementing a plan to return to growth at both brands We continue to pursue cost optimization opportunities We expect to generate substantial cash flow and earnings going forward We are committed to making the necessary investments to further strengthen the business for the long-term We are excited about the future OUR GOAL IS TO CREATE SIGNIFICANT FUTURE VALUE FOR SHAREHOLDERS 24 Summary
26 Dine Brands Global, Inc.


27 Appendix
28 Appendix: Adjusted Free Cash Flow Adjusted free cash flow is a non-gaap financial measure. Reconciliation of the cash provided by operating activities to adjusted free cash flow is as follows: ($ in 000s) Cash flows provided by operating activities $118,110 $65,733 Receipts from notes and equipment contracts receivable $10,036 $10,614 Additions to property and equipment ($5,637) ($13,370) Adjusted free cash flow $122,509 $62, Adjusted Free Cash Flow (Non-GAAP) Guidance Table (In millions) Cash flows from operations $105 $120 Approximate net receipts from notes and equipment contracts receivable 15 Approximate capital expenditures (14) Adjusted free cash flow (Non-GAAP) $106 $121 Source: Company Form 10-K filings and earnings press releases See non-gaap financial measures disclosure 27
29 Appendix: Adjusted Earnings per Share Adjusted earnings per share is a non-gaap financial measure. Reconciliation of net income available to common stockholders to the diluted net income available to common stockholders, as adjusted, is as follows: 2017 Net Income Available to Common Stockholders Net income (loss) available to common stockholders, as reported ($18.28) Impairment of goodwill and intagible assets $26.25 Executive seperation costs $0.31 Kansas City Support Center consolidation costs - Amortization of intangible assets $0.35 Closure and other impairment charges $0.14 Non-cash interest expense $0.12 Loss (gain) on disposition of assets ($0.22) Income tax adjustments ($4.07) Net income alllocated to unvested participating restricted stock ($0.46) Rounding $0.01 Diluted net income available to common stockholders per share as adjusted $ Adjusted earnings per diluted share (Non-GAAP) Guidance Table GAAP earnings per diluted share $4.08 $4.23 Closure and impairment charges 0.11 Amortization of intangible assets 0.56 Non-cash interest expense 0.22 Gain on disposition of assets (0.09) Debt refinancing costs 0.14 Income tax provision for above adjustments at 26% (0.24) Income tax adjustments 0.32 Adjusted earnings per diluted share (Non-GAAP) $5.10 $5.25 Source: Company s fiscal 2017 earnings press releases dated February 20, 2018 and October 31, 2018 See non-gaap financial measures disclosure 28
30 Appendix: EBITDA Reconciliation of U.S. GAAP income before taxes to EBITDA ($ in thousands) Q3 2017* Q Total revenue $174,903 $194,099 Excluding advertising revenue (56,218) (71,017) Adjusted revenue $118,685 $123,082 Adjusted EBITDA: Income (loss) before taxes ($506,291) $31,247 Interest expense 17,999 17,837 Other taxes Depreciation & amortization 7,631 7,888 Loss on debt extinguishment Debt refinancing costs 1,644 Closure & impairment charges 532, (Gain)/loss on disposal of assets (34) (59) Stock-based compensation 1,260 2,375 Adjusted EBITDA $53,186 $62,143 EBITDA margin as of % of adjusted revenue 45% 50% * Restated for ASC 606 Definitions of all components used in calculating the above ratios are found in the Base Indenture and the related Series Supplement to the Base Indenture, dated September 30, 2014, filed as Exhibits 4.1 and 4.2, respectively, to our Current Report on Form 8-K filed on October 3,
Dine Brands Global, Inc. Investor Presentation March 2019
 Dine Brands Global, Inc. Investor Presentation March 2019 Disclosures Forward-Looking Information: The content contained in this presentation is as of March 5, 2019. The Company assumes no obligation to
Dine Brands Global, Inc. Investor Presentation. March 5, 2018
 Dine Brands Global, Inc. Investor Presentation March 5, 2018 2 Disclosures Forward-Looking Information: The content contained in this presentation is as of February 21, 2018. The Company assumes no obligation
DINEEQUITY OVERVIEW JUNE 2016
 JULIA STEWART CHAIRMAN AND CEO AND PRESIDENT OF APPLEBEE S DINEEQUITY OVERVIEW JUNE 2016 Forward-Looking Information: Statements contained in this presentation may constitute forward-looking statements
Quarterly Concept Dashboard 2Q:14 Benchmarking for $1B+ Chains and Other Select Concepts System Stats, Unit Sales & Margins, Build Costs, Valuations
 Quarterly Concept Dashboard 2Q:14 Benchmarking for $1B+ Chains and Other Select Concepts System Stats, Unit Sales & Margins, Build Costs, Valuations Casual Buffalo Wild Wings Cheesecake Factory Chili's
EARNINGS CALL. FISCAL 2018: Q3 RESULTS March 22, 2018
 EARNINGS CALL FISCAL 2018: Q3 RESULTS March 22, 2018 Disclaimer/Non-GAAP Information IMPORTANT NOTICE The following slides are part of a presentation by Darden Restaurants, Inc. (the "Company") and are
FOR IMMEDIATE RELEASE. Investor Contact: Carol DiRaimo, (858) Media Contact: Brian Luscomb, (858)
 Media Contact: Brian Luscomb, (858)") Investor Contact: Carol DiRaimo, (858) 571-2407 FOR IMMEDIATE RELEASE Media Contact: Brian Luscomb, (858) 571-2291 Jack in the Box Inc. Reports Second Quarter FY Earnings; Updates Guidance for FY ; Declares
Investor Contact: Carol DiRaimo, (858) 571-2407 FOR IMMEDIATE RELEASE Media Contact: Brian Luscomb, (858) 571-2291 Jack in the Box Inc. Reports Second Quarter FY Earnings; Updates Guidance for FY ; Declares
Popeyes Louisiana Kitchen, Inc. Reports Fiscal 2016 Earnings Results
 February 22, 2017 Reports Fiscal 2016 Earnings Results Completes Credit Facility Expansion ATLANTA--(BUSINESS WIRE)-- (NASDAQ: PLKI), the franchisor and operator of Popeyes restaurants, today reported
EARNINGS CALL. FISCAL 2018: Q4 & ANNUAL RESULTS June 21, 2018
 EARNINGS CALL FISCAL 2018: Q4 & ANNUAL RESULTS June 21, 2018 Disclaimer/Non-GAAP Information IMPORTANT NOTICE The following slides are part of a presentation by Darden Restaurants, Inc. (the "Company")
Dunkin Brands Group, Inc. Supplemental Information (Unaudited) Adoption of New Revenue Recognition Guidance
 Adoption of New Revenue Recognition Guidance") Dunkin Brands Group, Inc. Supplemental Information Adoption of New Revenue Recognition Guidance Exhibit 99.2 SUPPLEMENTAL INFORMATION The purpose of this exhibit is to provide additional information related
Dunkin Brands Group, Inc. Supplemental Information Adoption of New Revenue Recognition Guidance Exhibit 99.2 SUPPLEMENTAL INFORMATION The purpose of this exhibit is to provide additional information related
FOR IMMEDIATE RELEASE (Analysts) Kevin Kalicak (407) (Media) Rich Jeffers (407)
 Kevin Kalicak (407) (Media) Rich Jeffers (407)") FOR IMMEDIATE RELEASE Contact: (Analysts) Kevin Kalicak (407) 245-5870 (Media) Rich Jeffers (407) 245-4189 DARDEN RESTAURANTS REPORTS FISCAL 2016 SECOND QUARTER RESULTS; REPORTS POSITIVE SAME-RESTAURANT
FOR IMMEDIATE RELEASE Contact: (Analysts) Kevin Kalicak (407) 245-5870 (Media) Rich Jeffers (407) 245-4189 DARDEN RESTAURANTS REPORTS FISCAL 2016 SECOND QUARTER RESULTS; REPORTS POSITIVE SAME-RESTAURANT
Darden Restaurants Reports Fiscal 2018 Third Quarter Results And Increases Financial Outlook For The Full Fiscal Year
 Darden Restaurants Reports Fiscal 2018 Third Quarter Results And Increases Financial Outlook For The Full Fiscal Year ORLANDO, Fla., March 22, 2018 /PRNewswire/ -- Darden Restaurants, Inc., (NYSE:DRI)
Segment Performance Segment profit represents sales, less costs for food and beverage, restaurant labor, restaurant expenses and marketing expenses.
 EXHIBIT 99.1 Darden Restaurants Reports Fiscal 2019 Third Quarter Results; Increases Financial Outlook For The Full Fiscal Year; And Declares Regular Quarterly Dividend ORLANDO, Fla., March 21, 2019 /PRNewswire/
Jack in the Box Inc. Reports Third Quarter FY 2017 Earnings; Updates Guidance for FY 2017; Declares Quarterly Cash Dividend
 Investor Contact: Carol DiRaimo, (858) 571-2407 FOR IMMEDIATE RELEASE Media Contact: Brian Luscomb, (858) 571-2291 Jack in the Box Inc. Reports Third Quarter FY Earnings; Updates Guidance for FY ; Declares
DARDEN RESTAURANTS REPORTS FISCAL 2017 FOURTH QUARTER AND FULL YEAR RESULTS; FOURTH QUARTER SAME-RESTUARANT SALES GROWTH OF 3
 Contacts: (Analysts) Kevin Kalicak (407) 245-5870 (Media) Rich Jeffers (407) 245-4189 DARDEN RESTAURANTS REPORTS FISCAL 2017 FOURTH QUARTER AND FULL YEAR RESULTS; FOURTH QUARTER SAME-RESTUARANT SALES GROWTH
Jack in the Box Inc. Reports First Quarter FY 2015 Earnings; Updates Guidance for FY 2015
 Investor Contact: Carol DiRaimo, (858) 571-2407 FOR IMMEDIATE RELEASE Media Contact: Brian Luscomb, (858) 571-2291 Jack in the Box Inc. Reports First Quarter FY 2015 Earnings; Updates Guidance for FY 2015
Segment Performance Segment profit represents sales, less costs for food and beverage, restaurant labor, restaurant expenses and marketing expenses.
 Darden Restaurants Reports Fiscal 2018 Fourth Quarter and Full Year Results; Fourth Quarter Same-Restaurant Sales Growth of 2.2%; Increases Quarterly Dividend 19% to $0.75; And Provides Fiscal 2019 Outlook
Darden Restaurants Reports Fiscal 2019 First Quarter Results and Increases Financial Outlook For The Full Fiscal Year
 Darden Restaurants Reports Fiscal 2019 First Quarter Results and Increases Financial Outlook For The Full Fiscal Year ORLANDO, Fla., September 20, 2018 /PRNewswire/ -- Darden Restaurants, Inc., (NYSE:DRI)
DARDEN RESTAURANTS REPORTS FISCAL 2018 FIRST QUARTER RESULTS AND REAFFIRMS FINANCIAL OUTLOOK FOR THE FULL FISCAL YEAR
 Contact: (Analysts) Kevin Kalicak (407) 245-5870 (Media) Rich Jeffers (407) 245-4189 DARDEN RESTAURANTS REPORTS FISCAL 2018 FIRST QUARTER RESULTS AND REAFFIRMS FINANCIAL OUTLOOK FOR THE FULL FISCAL YEAR
July 30, Highlights for Q include the following:
 Bloomin' Brands Announces 2018 Q2 Diluted EPS of $0.28 and Adjusted Diluted EPS of $0.38; Q2 Comparable Restaurant Sales Growth of 4.0% at Outback and 2.4% Combined ; Reaffirms Full Year 2018 Guidance
Bloomin' Brands Announces 2015 Third Quarter Adjusted Diluted EPS of $0.15 and Diluted EPS of $0.13;
 November 3, Bloomin' Brands Announces Third Quarter Adjusted Diluted EPS of $0.15 and Diluted EPS of $0.13; Reaffirms Guidance for Adjusted Diluted EPS of At Least $1.27; Repurchases $60 Million of Common
Comprehensive Plan to Enhance Shareholder Value. December 19, 2013
 Comprehensive Plan to Enhance Shareholder Value December 19, 2013 Forward-Looking Statements During the course of this presentation, Darden Restaurants officers and employees may make forward-looking statements
DARDEN RESTAURANTS REPORTS THIRD QUARTER DILUTED NET EARNINGS PER SHARE OF $1.02; DECLARES A QUARTERLY DIVIDEND OF 50 CENTS PER SHARE
 S M Red Lobster Olive Garden LongHorn Steakhouse The Capital Grille Bahama Breeze Seasons 52 Eddie V s Yard House www.darden.com NEWS/INFORMATION Corporate Relations P.O. Box 695011 Orlando, FL 32869-5011
AVERAGE LISTING CAP RATE BY REGION & TERM REMAINING
 AVERAGE LISTING CAP RATE BY REGION & TERM REMAINING 7.50% 7.00% 6.50% 5.50% 5.00% 4.50% 4.00% 0-10 11-20 0-10 11-20 0-10 11-20 0-10 11-20 0-10 11-20 0-10 11-20 0-10 11-20 0-10 11-20 0-10 11-20 Applebee's
EARNINGS CALL. FISCAL 2018: Q2 RESULTS December 19, 2017
 EARNINGS CALL FISCAL 2018: Q2 RESULTS December 19, 2017 Disclaimer/Non-GAAP Information IMPORTANT NOTICE The following slides are part of a presentation by Darden Restaurants, Inc. (the "Company") and
EARNINGS CALL. FISCAL 2018: Q1 RESULTS September 26, 2017
 EARNINGS CALL FISCAL 2018: Q1 RESULTS September 26, 2017 Disclaimer/Non-GAAP Information IMPORTANT NOTICE The following slides are part of a presentation by Darden Restaurants, Inc. (the "Company") and
CEC Entertainment, Inc. Reports Financial Results for the 2018 Third Quarter
 News Release CEC Entertainment, Inc. Reports Financial Results for the Third Quarter IRVING, Texas - November 8, - CEC Entertainment, Inc. (the Company ) today announced financial results for its third
Dunkin' Brands Reports Fourth Quarter and Full Year 2011 Results
 Dunkin' Brands Reports Fourth Quarter and Full Year 2011 Results Strong finish to 2011 with fourth quarter adjusted net income* up 36.6% driven by 7.4% Dunkin' Donuts U.S. comp store sales increase CANTON,
First Quarter Fiscal Calendar Calculation Dates January 1, April 1, 2018 vs. December 26, March 26, 2017
 Bloomin' Brands Announces 2018 Q1 Diluted EPS of $0.68 and Adjusted Diluted EPS of $0.71; Q1 Comparable Restaurant Sales Growth of 4.3% at Outback With Positive Traffic of 2.2%; Q1 Combined Comparable
Investor Presentation. July 2018
 Investor Presentation July 2018 Disclaimer/Non-GAAP Information IMPORTANT NOTICE The following slides are part of a presentation by Darden Restaurants, Inc. (the "Company") and are intended to be viewed
EARNINGS CALL. FISCAL 2019: Q1RESULTS September 20, 2018
 EARNINGS CALL FISCAL 2019: Q1RESULTS September 20, 2018 Disclaimer/Non-GAAP Information IMPORTANT NOTICE The following slides are part of a presentation by Darden Restaurants, Inc. (the "Company") and
Dunkin' Brands Reports First Quarter 2013 Results
 April 25, 2013 Dunkin' Brands Reports First Quarter 2013 Results CANTON, Mass., April 25, 2013 /PRNewswire/ -- First quarter highlights include: Dunkin' Donuts U.S. comparable store sales growth of 1.7%
Papa John's Announces Third Quarter Results
 November 3, 2010 Papa John's Announces Third Quarter Results EPS Increased 6.7% over Prior Year, Excluding BIBP; 2010 EPS Guidance Updated to a Range of $1.74 to $1.80, Excluding BIBP LOUISVILLE, Ky.--(BUSINESS
Sonic Reports Improved Sales Performance for the Fourth Fiscal Quarter of 2018
 Sonic Corp. Logo Sonic Reports Improved Sales Performance for the Fourth Fiscal Quarter of 2018 October 16, 2018 OKLAHOMA CITY--(BUSINESS WIRE)--Oct. 16, 2018-- Sonic Corp. (NASDAQ: SONC), the nation s
CRACKER BARREL REPORTS FOURTH QUARTER AND FULL YEAR FISCAL 2012 RESULTS AND PROVIDES GUIDANCE FOR FISCAL 2013
 Investor Contact: Media Contact: Lawrence E. Hyatt (615) 235-4432 Julie K. Davis (615) 443-9266 CRACKER BARREL REPORTS FOURTH QUARTER AND FULL YEAR FISCAL 2012 RESULTS AND PROVIDES GUIDANCE FOR FISCAL
Jack in the Box Inc. Reports Third Quarter FY 2015 Earnings; Updates Guidance for FY 2015; Declares Quarterly Cash Dividend
 Investor Contact: Carol DiRaimo, (858) 571-2407 FOR IMMEDIATE RELEASE Media Contact: Brian Luscomb, (858) 571-2291 Reports Third Quarter FY Earnings; Updates Guidance for FY ; Declares Quarterly Cash Dividend
Industry Data Report New Unit Investment
 Data, Analysis & Insight for a Stronger Industry Building Bridges between Franchisees, Franchisors & Financiers Industry Data Report New Unit Investment 2018-2019 RR s New Unit Investment Industry Data
Dunkin' Brands Reports Fourth Quarter and Fiscal Year 2016 Results
 February 9, 2017 Dunkin' Brands Reports Fourth Quarter and Fiscal Year Results CANTON, Mass., Feb. 9, 2017 /PRNewswire/ -- Fiscal year highlights include: Dunkin' Donuts U.S. comparable store sales growth
Restaurant Brands International Reports Full Year and Fourth Quarter 2015 Results
 Restaurant Brands International Reports Full Year and Fourth Quarter 2015 Results Oakville, Ontario February 16, 2016 Restaurant Brands International Inc. (TSX/NYSE: QSR, TSX: QSP) today reported financial
MANAGEMENT S DISCUSSION AND ANALYSIS OF FINANCIAL CONDITION AND RESULTS OF OPERATIONS
 MANAGEMENT S DISCUSSION AND ANALYSIS OF FINANCIAL CONDITION AND RESULTS OF OPERATIONS Unless otherwise noted, the section references to (i) us, our, we, the Company and YUM refer to YUM Brands, Inc. and
Domino s Pizza Financial Results Demonstrate Global Momentum Delivers 21.9% EPS Growth in the Fourth Quarter; Dividend Increases 25%
 For Immediate Release EXHIBIT 99.1 Contact: Lynn Liddle, Executive Vice President, Communications, Investor Relations and Legislative Affairs (734) 930-3008 Domino s Pizza Financial Results Demonstrate
Jack in the Box Inc. Reports Second Quarter FY 2014 Earnings; Updates Guidance for FY 2014
 Investor Contact: Carol DiRaimo, (858) 571-2407 FOR IMMEDIATE RELEASE Media Contact: Brian Luscomb, (858) 571-2291 Reports Second Quarter FY Earnings; Updates Guidance for FY SAN DIEGO, May 14, (NASDAQ:
News Release H&R Block Announces Fiscal 2014 Results CEO Perspective
 News Release For Immediate Release: June 11, 2014 H&R Block Announces Fiscal 2014 Results Total revenues increased $118 million, or 4%, to $3.024 billion 1 EBITDA increased 8% to $940 million, or 31% of
WEEKS ENDED. Adjusted diluted earnings per share* $ 0.46 $ 0.50 $ (0.04)
") May 9, 2014 Bloomin' Brands, Inc. Announces Fiscal 2014 First Quarter Adjusted Diluted Earnings Per Share of $0.46 and GAAP Diluted Earnings Per Share of $0.42; Reaffirms Full-Year 2014 Guidance Including
May 9, 2014 Bloomin' Brands, Inc. Announces Fiscal 2014 First Quarter Adjusted Diluted Earnings Per Share of $0.46 and GAAP Diluted Earnings Per Share of $0.42; Reaffirms Full-Year 2014 Guidance Including
Cracker Barrel Reports Fourth Quarter And Full Year Fiscal 2018 Results And Provides Guidance For Fiscal 2019
 Cracker Barrel Reports Fourth Quarter And Full Year Fiscal 2018 Results And Provides Guidance For Fiscal 2019 September 18, 2018 Board declares quarterly dividend of $1.25 per share LEBANON, Tenn., Sept.
Jack in the Box Inc. Reports Second Quarter FY 2015 Earnings; Updates Guidance for FY 2015; Raises Quarterly Cash Dividend by 50%
 Investor Contact: Carol DiRaimo, (858) 571-2407 FOR IMMEDIATE RELEASE Media Contact: Brian Luscomb, (858) 571-2291 Reports Second Quarter FY Earnings; Updates Guidance for FY ; Raises Quarterly Cash Dividend
Cracker Barrel Reports Results for Third Quarter Fiscal 2014
 May 28, 2014 Cracker Barrel Reports Results for Third Quarter Fiscal 2014 Adjusted EPS increased 20.6% over EPS in prior year quarter LEBANON, Tenn.--(BUSINESS WIRE)-- Cracker Barrel Old Country Store,
Jack in the Box Inc. Reports First Quarter FY 2013 Earnings; Updates Guidance for FY 2013
 Investor Contact: Carol DiRaimo, (858) 571-2407 FOR IMMEDIATE RELEASE Media Contact: Brian Luscomb, (858) 571-2291 Reports First Quarter FY 2013 Earnings; Updates Guidance for FY 2013 SAN DIEGO, February
Second Quarter 2018 Results
 Second Quarter 2018 Results August 21, 2018 CLASSIFIED INTERNAL USE ONLY Forward-Looking Statements Forward-looking statements in this presentation regarding the Company s future performance, restaurant
Yum China Reports First Quarter 2018 Results. May 1, :30 PM ET
 Yum China Reports First Quarter 2018 Results May 1, 2018 4:30 PM ET SHANGHAI, May 1, 2018 /PRNewswire/ -- Yum China Holdings, Inc. (the "Company" or "Yum China") (NYSE: YUMC) today reported unaudited results
FAIR ISAAC CORPORATION CONDENSED CONSOLIDATED BALANCE SHEETS (In thousands) (Unaudited)
 (Unaudited)") CONDENSED CONSOLIDATED BALANCE SHEETS (In thousands) March 31, September 30, 2016 2015 ASSETS: Current assets: Cash and cash equivalents $ 85,374 $ 86,120 Accounts receivable, net 155,207 158,773 Prepaid
CONDENSED CONSOLIDATED BALANCE SHEETS (In thousands) March 31, September 30, 2016 2015 ASSETS: Current assets: Cash and cash equivalents $ 85,374 $ 86,120 Accounts receivable, net 155,207 158,773 Prepaid
Cracker Barrel Reports Fourth Quarter And Full Year Fiscal 2017 Results And Provides Guidance For Fiscal 2018
 September 13, 2017 Cracker Barrel Reports Fourth Quarter And Full Year Fiscal 2017 Results And Provides Guidance For Fiscal 2018 Fourth Quarter Comparable Store Traffic and Restaurant Sales Outperformed
FAIR ISAAC CORPORATION CONDENSED CONSOLIDATED BALANCE SHEETS (In thousands) (Unaudited)
 (Unaudited)") CONDENSED CONSOLIDATED BALANCE SHEETS (In thousands) June 30, September 30, 2016 2015 ASSETS: Current assets: Cash and cash equivalents $ 118,155 $ 86,120 Accounts receivable, net 155,196 158,773 Prepaid
CONDENSED CONSOLIDATED BALANCE SHEETS (In thousands) June 30, September 30, 2016 2015 ASSETS: Current assets: Cash and cash equivalents $ 118,155 $ 86,120 Accounts receivable, net 155,196 158,773 Prepaid
THE WENDY S COMPANY REPORTS PRELIMINARY 2016 RESULTS; ANNOUNCES 2017 OUTLOOK AND UPDATES 2020 GOALS
 THE WENDY S COMPANY REPORTS PRELIMINARY 2016 RESULTS; ANNOUNCES 2017 OUTLOOK AND UPDATES 2020 GOALS 16th consecutive quarter of positive same-restaurant sales; North America system same-restaurant sales
Dunkin' Brands Reports Third Quarter 2016 Results
 October 20, Dunkin' Brands Reports Third Quarter Results CANTON, Mass., Oct. 20, /PRNewswire/ -- Third quarter highlights include: Dunkin' Donuts U.S. comparable store sales growth of 2.0% Baskin-Robbins
Cracker Barrel Reports Results for Second Quarter Fiscal 2015 and Increases Earnings Guidance for Fiscal 2015
 February 24, 2015 Cracker Barrel Reports Results for Second Quarter Fiscal 2015 and Increases Earnings Guidance for Fiscal 2015 Adjusted EPS increased to $1.93 compared to $1.56 in the prior year quarter
Cracker Barrel Reports Results For Second Quarter Fiscal 2018 And Updates Earnings Guidance For Fiscal 2018
 Cracker Barrel Reports Results For Second Quarter Fiscal 2018 And Updates Earnings Guidance For Fiscal 2018 February 20, 2018 Company reports positive comparable restaurant and retail sales. Earnings per
Restaurant Brands International Inc. Reports First Quarter 2017 Results
 Restaurant Brands International Inc. Reports First Quarter 2017 Results Oakville, Ontario April 26, 2017 Restaurant Brands International Inc. (TSX/NYSE: QSR, TSX: QSP) today reported financial results
Cracker Barrel Reports Results For Third Quarter Fiscal 2018, Increases Quarterly Dividend And Declares Special Dividend
 Cracker Barrel Reports Results For Third Quarter Fiscal 2018, Increases Quarterly Dividend And Declares Special Dividend May 22, 2018 Company reports positive comparable restaurant and retail sales, Board
Operating income margin was 10.0% of revenue, compared with prior year operating income margin of 10.7% of revenue.
 Cracker Barrel Reports Results For First Quarter Fiscal 2018, Comparable Store Sales Outperformed The Casual Dining Industry, Earnings Exceeded Expectations November 21, 2017 Company reports first quarter
Investor Presentation October 2018
 Investor Presentation October 2018 Safe Harbor Statement This presentation contains forward-looking statements about our current and presently expected performance trends, growth plans, business goals
FAIR ISAAC CORPORATION CONDENSED CONSOLIDATED BALANCE SHEETS (In thousands) (Unaudited)
 (Unaudited)") CONDENSED CONSOLIDATED BALANCE SHEETS (In thousands) June 30, September 30, 2018 2017 ASSETS: Current assets: Cash and cash equivalents $ 119,929 $ 105,618 Accounts receivable, net 182,419 168,586 Prepaid
CONDENSED CONSOLIDATED BALANCE SHEETS (In thousands) June 30, September 30, 2018 2017 ASSETS: Current assets: Cash and cash equivalents $ 119,929 $ 105,618 Accounts receivable, net 182,419 168,586 Prepaid
FAIR ISAAC CORPORATION CONDENSED CONSOLIDATED BALANCE SHEETS (In thousands) (Unaudited)
 (Unaudited)") CONDENSED CONSOLIDATED BALANCE SHEETS (In thousands) 2018 2017 ASSETS: Current assets: Cash and cash equivalents $ 90,023 $ 105,618 Accounts receivable, net 208,865 168,586 Prepaid expenses and other current
CONDENSED CONSOLIDATED BALANCE SHEETS (In thousands) 2018 2017 ASSETS: Current assets: Cash and cash equivalents $ 90,023 $ 105,618 Accounts receivable, net 208,865 168,586 Prepaid expenses and other current
THE WENDY S COMPANY REPORTS SECOND QUARTER 2018 RESULTS. North America same-restaurant sales increase 1.9% (+5.1% on a two-year basis)
") THE WENDY S COMPANY REPORTS SECOND QUARTER 2018 RESULTS North America same-restaurant sales increase 1.9% (+5.1% on a two-year basis) 22nd consecutive quarter of positive same-restaurant sales 36 global
THE WENDY S COMPANY REPORTS SECOND QUARTER 2018 RESULTS North America same-restaurant sales increase 1.9% (+5.1% on a two-year basis) 22nd consecutive quarter of positive same-restaurant sales 36 global
THE WENDY S COMPANY REPORTS PRELIMINARY 2017 RESULTS; ANNOUNCES 2018 OUTLOOK AND UPDATES 2020 GOALS
 THE WENDY S COMPANY REPORTS PRELIMINARY 2017 RESULTS; ANNOUNCES 2018 OUTLOOK AND UPDATES 2020 GOALS North America same-restaurant sales increase 1.3% in 4Q and 2.0% in 2017; 20th consecutive quarter of
Cracker Barrel Reports Results for Third Quarter Fiscal 2013
 June 3, 2013 Cracker Barrel Reports Results for Third Quarter Fiscal 2013 Positive Comparable Store Traffic, Restaurant and Retail Sales in Quarter Diluted EPS Increased 19% Compared with Adjusted EPS
CPI Card Group Inc. Reports Fourth Quarter and Full Year 2016 Results
 NEWS RELEASE CPI Card Group Inc. Reports Fourth Quarter and Full Year 2016 Results 3/1/2017 Q4 Net Sales of $67.4 million, Full Year 2016 Net Sales of $308.7 million Full Year Net Income from Continuing
THE WENDY S COMPANY REPORTS SECOND QUARTER 2017 RESULTS
 THE WENDY S COMPANY REPORTS SECOND QUARTER 2017 RESULTS North America same-restaurant sales increase 3.2% (+3.6% on a two-year basis); 18th consecutive quarter of positive same-restaurant sales 35 global
Texas Roadhouse, Inc. Announces Third Quarter 2018 Results
 Texas Roadhouse, Inc. Announces Third Quarter 2018 Results LOUISVILLE, KY. (October 29, 2018) Texas Roadhouse, Inc. (NasdaqGS: TXRH) today announced financial results for the 13 and 39 week periods ended
BOB EVANS REPORTS FISCAL 2015 FOURTH-QUARTER AND FULL-YEAR RESULTS; PROVIDES FISCAL YEAR 2016 OUTLOOK
 BOB EVANS REPORTS FISCAL FOURTH-QUARTER AND FULL-YEAR RESULTS; PROVIDES FISCAL YEAR 2016 OUTLOOK Q4 net sales total $332.4 million, an increase of $6.0 million, or 1.8 percent. GAAP net income of $0.24
ACI WORLDWIDE QUARTERLY AND FULL-YEAR EARNINGS PRESENTATION
 ACI WORLDWIDE QUARTERLY AND FULL-YEAR EARNINGS PRESENTATION Private Securities Litigation Reform Act of 1995 Safe Harbor For Forward-Looking Statements This presentation contains forward-looking statements
UNITED STATES SECURITIES AND EXCHANGE COMMISSION. Washington, D.C FORM 8-K CURRENT REPORT
 UNITED STATES SECURITIES AND EXCHANGE COMMISSION Washington, D.C. 20549 FORM 8-K CURRENT REPORT Pursuant to Section 13 or 15(d) of the Securities Exchange Act of 1934 Date of Report (Date of earliest event
Cracker Barrel Reports Fourth Quarter and Full Year Fiscal 2015 Results and Provides Guidance for Fiscal 2016
 September 16, 2015 Cracker Barrel Reports Fourth Quarter and Full Year Fiscal 2015 Results and Provides Guidance for Fiscal 2016 Positive Comparable Store Sales and Traffic in Fourth Quarter and Full Fiscal
October 22, Dear Mr. Craigie:
 October 22, 2018 The Independent Members of the Board of Directors Bloomin Brands, Inc. 2202 North West Shore Boulevard Tampa, Florida 33607 Attention: Mr. James R. Craigie Lead Independent Director Dear
ITRON, INC. CONSOLIDATED STATEMENTS OF OPERATIONS
 , INC. CONSOLIDATED STATEMENTS OF OPERATIONS (Unaudited, in thousands, except per share data) Revenues $ 489,353 $ 482,175 $ 964,148 $ 929,711 Cost of revenues 326,312 322,587 646,572 630,000 Gross profit
Page 1/12. Yum China Reports Fourth Quarter and Full Year 2017 Results. February 7, :30 PM ET
 Yum China Reports Fourth Quarter and Full Year 2017 Results February 7, 2018 4:30 PM ET SHANGHAI, Feb. 7, 2018 /PRNewswire/ -- (the "Company" or "Yum China") (NYSE: YUMC) today reported unaudited results
ITRON, INC. CONSOLIDATED STATEMENTS OF OPERATIONS
 , INC. CONSOLIDATED STATEMENTS OF OPERATIONS (Unaudited, in thousands, except per share data) Revenues $ 474,795 $ 447,536 Cost of revenues 320,260 307,413 Gross profit 154,535 140,123 Operating expenses
ITRON, INC. CONSOLIDATED STATEMENTS OF OPERATIONS
 , INC. CONSOLIDATED STATEMENTS OF OPERATIONS (Unaudited, in thousands, except per share data) Revenues $ 571,640 $ 563,691 Cost of revenues 388,535 378,713 Gross profit 183,105 184,978 Operating expenses
The Wendy s Company Reports Audited Full-Year 2012 Results
 The Wendy s Company Reports Audited Full-Year 2012 Results Fourth-Quarter Adjusted EBITDA Increased 19% to $95.9 Million; Full-Year Adjusted EBITDA Increased 1% to $333.3 Million Positive Momentum from
US Ecology, Inc. Q Earnings Conference Call
 US Ecology, Inc. Q4 2017 Earnings Conference Call February 16, 2018 1 Today s Hosts Jeff Feeler Chairman & Chief Executive Officer Eric Gerratt Executive Vice President & Chief Financial Officer Steve
ITRON, INC. CONSOLIDATED STATEMENTS OF OPERATIONS
 , INC. CONSOLIDATED STATEMENTS OF OPERATIONS (Unaudited, in thousands, except per share data) Revenues $ 447,536 $ 571,640 Cost of revenues 307,413 388,535 Gross profit 140,123 183,105 Operating expenses
UNITED STATES SECURITIES AND EXCHANGE COMMISSION. Washington, D.C FORM 8-K CURRENT REPORT
 UNITED STATES SECURITIES AND EXCHANGE COMMISSION Washington, D.C. 20549 FORM 8-K CURRENT REPORT Pursuant to Section 13 or 15(d) of the Securities Exchange Act of 1934 Date of Report (Date of earliest event
An Investment Analysis Case Study
 An Investment Analysis Case Study This case is a group project that is due on April 2, before class at 10.30. Stating the obvious: Each group will turn in one report (sounds obvious, but might as well
Dunkin' Brands Reports Third Quarter 2013 Results
 October 24, Dunkin' Brands Reports Third Quarter Results CANTON, Mass., Oct. 24, /PRNewswire/ -- Third quarter highlights include: Dunkin' Donuts U.S. comparable store sales growth of 4.2% Added 222 net
Reynolds Group Holdings Limited
 Reynolds Group Holdings Limited 2017 Results February 14, 2018 Disclaimer This presentation may contain forward-looking statements as that term is defined in the Private Securities Litigation Reform Act
THE WENDY S COMPANY REPORTS STRONG 2013 THIRD-QUARTER RESULTS, RAISES EARNINGS OUTLOOK FOR 2013 COMPANY REPORTS 3Q SAME-STORE SALES INCREASE OF 3.
 THE WENDY S COMPANY REPORTS STRONG 2013 THIRD-QUARTER RESULTS, RAISES EARNINGS OUTLOOK FOR 2013 COMPANY REPORTS 3Q SAME-STORE SALES INCREASE OF 3.2% ADJUSTED EBITDA INCREASES 17% ADJUSTED EPS INCREASES
Dunkin Brands Group, Inc.
 Dunkin Brands Group, Inc. Investor Presentation Fourth Quarter 2013 1 Forward-Looking Statements Certain information contained in this presentation, particularly information regarding future economic performance,
ITRON, INC. CONSOLIDATED STATEMENTS OF OPERATIONS
 , INC. CONSOLIDATED STATEMENTS OF OPERATIONS (Unaudited, in thousands, except per share data) Revenues $ 504,063 $ 615,555 $ 1,654,843 $ 1,791,647 Cost of revenues 332,266 438,559 1,103,196 1,237,722 Gross
ITRON, INC. CONSOLIDATED STATEMENTS OF OPERATIONS
 , INC. CONSOLIDATED STATEMENTS OF OPERATIONS (Unaudited, in thousands, except per share data) Revenues $ 523,335 $ 642,477 $ 2,178,178 $ 2,434,124 Cost of revenues 359,835 449,944 1,463,031 1,687,666 Gross
Dunkin Brands Group, Inc.
 Dunkin Brands Group, Inc. Investor Presentation Jefferies Consumer Conference Nigel Travis Chairman & CEO 1 Forward-Looking Statements Certain information contained in this presentation, particularly information
Papa John's Reports First Quarter Earnings; April Comparable Sales Results Announced; 2005 Earnings Guidance Increased
 May 2, 2005 Papa John's Reports First Quarter Earnings; April Comparable Sales Results Announced; 2005 Earnings Guidance Increased LOUISVILLE, Ky.--(BUSINESS WIRE)--May 2, 2005--Papa John's International,
BOB EVANS REPORTS FISCAL 2017 FIRST-QUARTER RESULTS AND RAISES FISCAL 2017 EPS GUIDANCE
 BOB EVANS REPORTS FISCAL 2017 FIRST-QUARTER RESULTS AND RAISES FISCAL 2017 EPS GUIDANCE Q1 2017 net sales total $306.3 million; GAAP net income of $0.46 per diluted share, non-gaap net income (1) of $0.48
ITRON, INC. CONSOLIDATED STATEMENTS OF OPERATIONS
 , INC. CONSOLIDATED STATEMENTS OF OPERATIONS (Unaudited, in thousands, except per share data) Revenues $ 470,103 $ 489,353 $ 918,350 $ 964,148 Cost of revenues 351,532 326,312 661,580 646,572 Gross profit
Buffalo Wild Wings, Inc. Announces Second Quarter Earnings per Share of $0.55 and Adjusted Earnings per Share of $0.66
 July 26, 2017 Buffalo Wild Wings, Inc. Announces Second Quarter Earnings per Share of $0.55 and Adjusted Earnings per Share of $0.66 -FY2017 Guidance Updated to $4.00 to $4.50 GAAP EPS and $4.50 to $5.00
Restaurant Brands International Reports Third Quarter 2015 Results
 Restaurant Brands International Reports Third Quarter 2015 Results Oakville, Ontario October 27, 2015 Restaurant Brands International Inc. (TSX/NYSE: QSR, TSX: QSP) today reported financial results for
Alphabet Announces First Quarter 2016 Results
 Exhibit 99.1 Alphabet Announces First Quarter 2016 Results MOUNTAIN VIEW, Calif. April 21, 2016 Alphabet Inc. (NASDAQ: GOOG, GOOGL) today announced financial results for the quarter ended. "Our Q1 results
NEW REVENUE ACCOUNTING STANDARD (ASC 606) February 7, 2018
 February 7, 2018") NEW REVENUE ACCOUNTING STANDARD February 7, 2018 DISCLAIMERS Forward-Looking Statements Statements in this document that are not statements of historical fact are forward-looking statements within the
NEW REVENUE ACCOUNTING STANDARD February 7, 2018 DISCLAIMERS Forward-Looking Statements Statements in this document that are not statements of historical fact are forward-looking statements within the
Investor Presentation
 Investor Presentation Sidoti& Company Institutional Investor Forum March 18, 2014 Forward-Looking Statements and Non-GAAP Financial Measures Denny s Corporation urges caution in considering its current
2013 Oldemark LLC. Third-Quarter 2014 Conference Call November 6, 2014
 2013 Oldemark LLC Third-Quarter 2014 Conference Call November 6, 2014 DAVID POPLAR Vice President Investor Relations 2013 Oldemark LLC 2 Today s Agenda CEO Overview Financial Update Q&A Emil Brolick Todd
Darden Restaurants Reports Annual and Fourth Quarter Diluted Net Earnings Per Share
 Darden Restaurants Reports Annual and Fourth Quarter Diluted Net Earnings Per Share ORLANDO, Fla., June 20, 2005 /PRNewswire-FirstCall via COMTEX/ -- Darden Restaurants, Inc. (NYSE: DRI) today reported
Masonite International Corporation Reports 2016 Second Quarter Results
 Masonite International Corporation Reports 2016 Second Quarter Results 8/10/2016 TAMPA, Fla.--(BUSINESS WIRE)-- Masonite International Corporation ("Masonite" or "the Company") (NYSE: DOOR) today announced