Analyst Presentation Q May 7, 2015 Dr Matthias Zieschang, CFO
|
|
|
- Geraldine Benson
- 5 years ago
- Views:
Transcription


1 Analyst Presentation Q May 7, 2015 Dr Matthias Zieschang, CFO
2 Slide 2 Disclaimer This document has been prepared by Fraport solely for use in this presentation. The information contained in this document has not been independently verified. No representation or warranty whether express or implied is made as to, and no reliance should be placed on, the fairness, accuracy, completeness or correctness of the information or opinions contained therein. Neither the company nor any of its affiliates, advisors or representatives shall have any liability whatsoever (in negligence or otherwise) for any loss arising from any use of this document or its content or otherwise arising in connection with this document. This document does not constitute an offer or invitation to purchase or subscribe for any shares and neither this document nor any part of it shall form the basis of, or be relied upon in connection with, any contract or commitment whatsoever. This document contains forwardlooking statements that are based on current estimates and assumptions made by the management of Fraport to the best of its knowledge. Such forwardlooking statements are subject to risks and uncertainties, the nonoccurrence or occurrence of which could cause the actual results including the financial condition and profitability of Fraport to differ materially from or be more negative than those expressed or implied by such forwardlooking statements. This also applies to the forward looking estimates and forecasts derived from thirdparty studies. Consequently, neither the company nor its management can give any assurance regarding the future accuracy of the opinions set forth in this document or the actual occurrence of the predicted developments. By accepting this document, you agree with the foregoing.
3 Slide 3 Agenda News on T3 Traffic Insight Q1 Financials Outlook 2015
4 Slide 4 News on T3 Decision to construct taken by Supervisory Board Floor space ca. 90,000 sqm Equivalent to 19 Football fields Height of Terminal inside 20m, outside 33m above ground level Length Pier H: 400m Length Pier J: 600m 24 gate positions at the building 4 CheckinAreas with 100 counters 18 Security control lanes for O&D 11 Security control lanes for transfer 10 luggage conveyor belts


5 Slide 5 News on T3 Apron Infrastructure already under Construction Market Place Security CheckIn Train Parking T3 apron area: Constructed: 780,000 sqm To be built: 555,000 sqm

6 Slide 6 News on T3 Road and Train Access

7 Slide 7 News on T3 Main Hall

8 Slide 8 News on T3 Timeframe Excavation work Start of structural work Technical & operational tests Inauguration
9 Slide 9 Agenda News on T3 Traffic Insight Q1 Financials Outlook 2015
10 Slide 10 Traffic Insight Frankfurt Airport March 2015 % Q % FY 2014 Passengers* in `000 4, , ,566 Movements 37, , ,026 MTOW in `000 tons 2, , ,958 Cargo** in `000 tons ,132 90% 85% 80% Seat load factor Q Q Passenger per movement +6.6 Pax 75% 70% 65% 60% Jan Feb Mar Apr May Jun Jul Aug Sep Oct Nov Dec Passenger guidance FY2015: 23% upside * Source ACI, commercial traffic only ** Freight & Mail


11 Slide 11 Traffic Insight Traffic Shares at FRA March 2015 Western Europe Domestic Eastern Europe 40% 12% 8% +2% +2% +1% North America 12% Frankfurt Airport Far East 13% +1% +5% Middle East 6% +7% Latin America 5% +3% Africa 4% +4% Traffic Share Delta absolute vs. previous year in % Continental 60% +2% Intercontinental 40% +4%
12 Slide 12 Traffic Insight Group Traffic Figures (above 10% stake) IATA Code Airport Share March 2015 previous year YTD 2015 previous year FY 2014 CAGR FRA Frankfurt, Germany 100% 4, % 12, % 59, % LJU Ljubljana, Slovenia 100% % % 1, % LIM Lima, Peru 70% 1, % 4, % 15, % BOJ Burgas, Bulgaria 60% % % 2, % VAR Varna, Bulgaria 60% % % 1, % AYT Antalya, Turkey 51% 1, % 2, % 27, % LED St. Petersburg, Russia 35.5% % 2, % 14, % HAJ Hanover, Germany 30% % % 5, % XIY Xi an, China 24.5% 2, % 7, % 29, %
13 Slide 13 Agenda News on T3 Traffic Insight Q1 Financials Outlook 2015
14 Slide 14 Group P&L Q Topline Growth translates into Bottomline mil. Q1 15 Q1 14 % Revenue excl. IFRIC EBITDA EBIT EBT Group result EPS in % 25% EBITDA margin +0.7PP 26.6% 25.9% EBIT margin +0.7PP 12.5% 11.8% Comments Traffic, prices, and retail drove revenue in Frankfurt Positive effects from new Group companies Airmall and Ljubljana Lima with positive US$ effect EBITDA and EBIT sharply up, despite additional opex Negative financial result impact from market valuation of CHF loan Good performance of Group result EPS at % Q Q Q Q Percent change based on unrounded figures
15 Slide 15 Group P&L Q External Activities key Driver for lift in Group EBITDA + 19 mil. mil EBITDA Q Likeforlike revenue ex. IFRIC 12 Revenue Airmall & Ljubljana IFRIC 12 revenue Other revenue Cost of materials ex. IFRIC 12 IFRIC 12 cost of materials Staff cost Other opex EBITDA Q Segment share in Group EBITDA Q Segment share in Group EBITDA Q Ground Handling: negative External Activities & Services 17.9% Aviation 22.1% 60.0% Retail & Real Estate External Activities & Services 21.8% Ground Handling: negative 20.0% 58.2% Aviation Retail & Real Estate Due to commercial rounding slight discrepancies may occur when summing up.
16 Slide 16 Group P&L Q Positive EBITDA led to increase in Group result mil. + 5 mil Group result Q EBITDA D&A Financial result Taxes Group result Q EPS Q EPS Q mil Q1 15 Q1 14 % Interest income Interest expenses Split of financial result At equity result Other result 9 3 Financial result Comments Lower interest rate led to lower income and expenses Split of at equity result: Antalya due to seasonal business at 13m No Pulkovo effect despite positive interim result due to cumulated losses Xi an result flat Negative other financial result due to market valuation of CHF loan Due to commercial rounding slight discrepancies may occur when summing up.
17 Slide 17 Group Asset & Financial Situation Q1 FCF improves Asset & Financial Situation FCF 1 2 Liquidity Gross debt Net debt Equity Gearing mil. 4,238 4,192 2,987 3,013 3,341 3,286 95% 97% ,251 1,180 March 31, 2015 Dec. 31, 2014 Increase in FCF from operating cash flow Capex at previous year level Q1 DVD inflow as planned below 2014 level Liquidity in line with FCF up Growing gross debt also due to accrued interest expenses FCF led to decline in net debt Net debt below 3 bn. Equity exceeded 3.3 bn. Gearing ratio at ~95% Outlook 2015: FRA capex: slightly above 2014 level Ongoing strong positive FCF 1) FCF predividend payout; figures correspond to Q1 figures 2) Net debt divided by equity less noncontrolling interests and profit earmarked for distribution
18 Slide 18 Group Cash Flow Statement Capex Split & DVD inflows mil. Operating cash flow Intangible assets PPE Airport operating projects Investment property DVDs from investments Free cash flow Cash Flow Q Cash Flow Q Sound OCF improvement from operational performance and change in working capital Stable q1 capex despite T3 preparations Less DVDs from AYT received Strong FCF improvement driven by OCF Due to commercial rounding slight discrepancies may occur when summing up.
19 Slide 19 Segment Aviation Revenue Increase offset by Cost Inflation mil. Q1 15 Q1 14 % Revenue Airport charges Security serv. Other EBITDA EBIT Employees 5,976 6, Comments Revenue increase due to FRA traffic & price increase as of Jan. 1, 2015 Slight increase in security revenue from price & volume More staff costs and cost of materials led to flat Q1 result 20% EBITDA margin 0.7PP 15.3% 16.0% EBIT margin 0.7PP Revenue split Q Other 4.9% Security services 13.3% 10% 0% 0.1% 0.8% Q Q Q Q Security charges 4.4% Parking charges 5.9% Landing charges 7.3% Noise charges 11.0% 53.2% Passenger charges Percent change based on unrounded figures
20 Slide 20 Segment Retail & Real Estate Strong Increase from Retail Business mil. Q1 15 Q1 14 % Revenue Retail Real Estate Parking Other EBITDA EBIT Employees Comments All revenue streams with positive Q1 performance Key driver for Q1 result: Retail Revenue growth directly transferred into EBITDA and EBIT, which showed a sharp increase 90% 60% 30% 0% EBITDA margin +1.2PP 78.6% 77.4% EBIT margin +2.1PP 60.2% 58.1% Q Q Q Q Revenue split Q Other 1.1% Parking 16.8% Real Estate 41.2% 40.9% Retail Percent change based on unrounded figures
21 Slide 21 Segment Retail & Real Estate Spend per Pax at Alltime Q1 High Retail revenue per Passenger Q1 12: 3.40 Q1 13: 3.74 Q1 14: 3.69 Q1 15: mil. Shopping Services Advertis. Q1 Q2 Q3 Q4 Q1 Q2 Q3 Q4 Q1 Q2 Q3 Q4 Q
22 Slide 22 % Segment Retail & Real Estate Strong Rebounce in Retail Destination Development Passengers in Q Volume change in % China Japan Russia Korea Brazil vs. Q1 14 USA Germany Turkey Canada India Destination Development Retail Revenue/Passenger in Q12015 % Revenue/ passenger change in % China Japan Russia Korea Brazil vs. Q1 14 USA Germany Turkey Canada India
23 Slide 23 Segment Ground Handling Slight improved Financials, Bottomline still in the Red mil. Q1 15 Q1 14 % Revenue Ground Handl. Infrastructure EBITDA 0 3 EBIT Employees 9,505 9, Comments Price & volume led to growth in infrastructure revenue Ground Handling revenue showed slight increase from MTOW Despite higher staff cost EBITDA with slight gain over PY EBIT still negative 10% EBITDA margin PP EBIT margin PP Revenue split Q % 0% % % % % Q Q Q Q Central Infrastructure 42.9% Ground Handling 57.1% Percent change based on unrounded figures
24 Slide 24 Segment External Activities & Services Growth from Lima and new Operations mil. Q1 15 Q1 14 % Revenue excl. IFRIC EBITDA EBIT Employees 4,550 4, Comments Ongoing growth in Lima supported by US$ effect Firsttime Q1 consolidation of Airmall and Ljubljana (figures displayed on next slide) Off season in Varna & Burgas Solid increase in EBITDA and EBIT EBITDA margin 1.7PP EBIT margin 0.7PP Revenue split Q % 20% 31.1% 32.8% 12.1% 12.8% Others Twin Star 1.8% 20.3% Ljubljana 6.3% 59.1% Lima 0% Q Q Q Q Airmall 12.5% Percent change based on unrounded figures
25 Slide 25 External Activities Fully consolidated Investments 1 Airmall 2 Ljubljana 2 Lima Twin Star mil. Q1 15 Q1 14 % Q1 15 Q1 14 % Q1 15 Q1 14 % Q1 15 Q1 14 % Revenue ex IFRIC EBITDA margin adjusted % % % 38.2% % 38.4% EBIT margin adjusted 1 4.5% % 30.8% % 30.9% Result Passengers in mil ) Figures refer to IFRS accounting, not local GAAP, percent changes based on unrounded figures. 2) Airmall and Ljubljana since inclusion in Fraport Group.
26 Slide 26 External Activities At Equity consolidated Investments Antalya Pulkovo Hanover Xi An mil. Q1 15 Q1 14 % Q1 15 Q1 14 % Q1 15 Q1 14 % Q1 15 Q1 14 % Revenue ex IFRIC EBITDA margin adjusted % % % 44.0% % 19.1% > % 3 8.7% % % 40.1 EBIT margin adjusted % 21.1% % % 68.1 Result Passengers in mil Except for Xi an all figures refer to IFRS accounting, percent changes based on unrounded figures.
27 Slide 27 Agenda News on T3 Traffic Insight Q1 Financials Outlook 2015
28 Slide 28 Outlook 2015 Unchanged Outlook! Strike risk could impact traffic and financial outlook Outlook 2014 Result Outlook 2015 Passengers FRA growth between 2% and 3% +2.6% growth between 2% and 3% Revenue revenue growth up to ~ 2.45 bn. 2.4 bn. revenue between ~ 2.55 and ~ 2.6 bn. EBITDA between ~ 780 and ~ 800 mil. 790 mil. between ~ 820 and ~ 840 mil. EBIT growth up to ~ 500 mil. 483 mil. between ~ 500 and ~ 520 mil. Group Result* slightly above mil. between ~ 265 and ~ 285 mil. Dividend proposal at least stable 1.35 stable *Group Result before minorities

29 Thank you for your Attention!

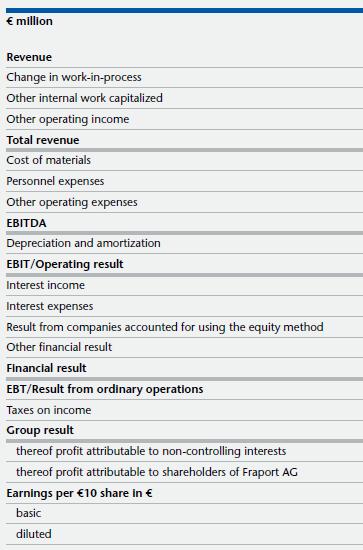
30 Slide 30 Group P&L Q1 2015


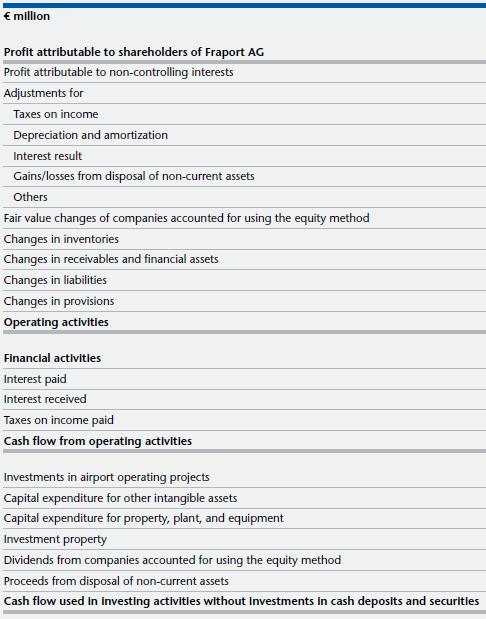
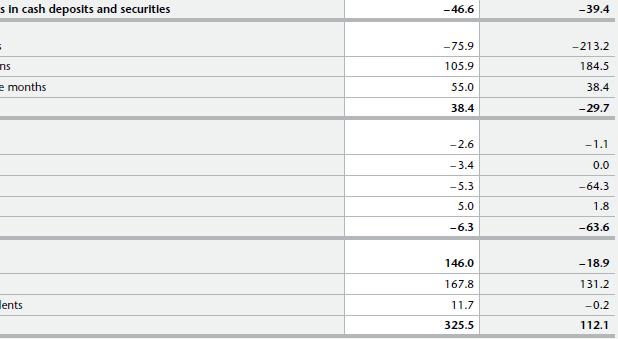
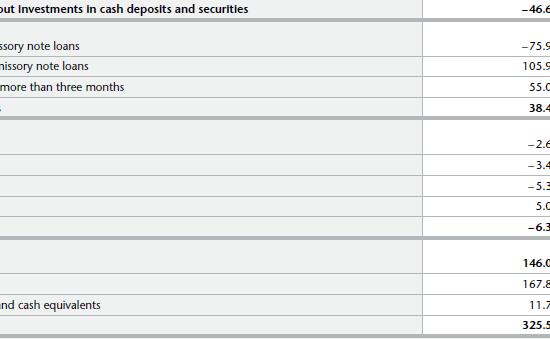
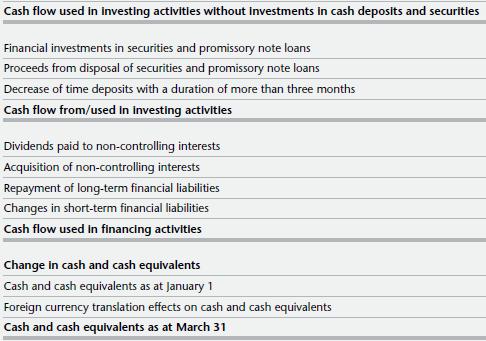
31 Slide 31 Group Cash Flow Statement Q1 2015


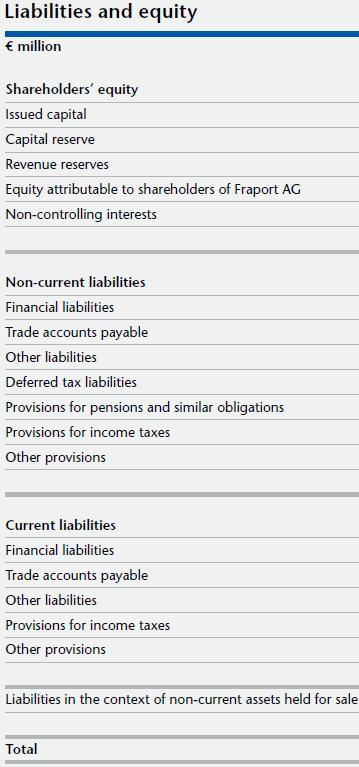
32 Slide 32 Group Financial Position as at March 31, 2015
33 Slide 33 Special & Extraordinary Effects Q mil. Q1 15 Q1 14 Group financial result Market valuation of derivatives & F/X fluctuations Segment External Activities IFRIC 12 revenue Airmall revenue 13.4 Airmall EBITDA 2.7 Airmall EBIT 0.6 Ljubljana revenue 6.8 Ljubljana EBITDA 1.7 Ljubljana EBIT 0.8
34 Slide 34 Financial Position Maturity Profile & Cash Position as of March 31, 2015 mil. Fraport debt conditions on average ~ 3.6 % interest rate ~ 5.0 years maturity


35 Investor Relations Team Contact Details Fraport AG Frankfurt Airport Services Worldwide Frankfurt am Main Stefan J. Rüter Head of Finance & Investor Relations Svenja Ebeling Investor Relations Assistant Marc Poeschmann Manager Investor Relations Florian Fuchs Manager Investor Relations & Financial Reporting Tanja Nagel Manager Investor Relations & Financial Reporting
UBS Global Transport, Travel & Leisure Conference 2015
 UBS Stefan J. Rueter Head of Finance & IR Marc Poeschmann Investor Relations 2 Disclaimer This document has been prepared by Fraport solely for use in this presentation. The information contained in this
Analyst Presentation Q May 8, 2014 Dr Matthias Zieschang, CFO
 Analyst Presentation Q1 2014 May 8, 2014 Dr Matthias Zieschang, CFO Slide 2 Disclaimer This document has been prepared by Fraport solely for use in this presentation. The information contained in this
Kepler Cheuvreux European Infrastructure Tour September, Stefan J. Rüter Head of Finance & IR
 September, 2016 Stefan J. Rüter Head of Finance & IR 2 Disclaimer This document has been prepared by Fraport solely for use in this presentation. The information contained in this document has not been
Roadshow FRANKFURT. May Dr Stefan Schulte, CEO Marc Poeschmann, Investor Relations
 Roadshow FRANKFURT May 2015 Dr Stefan Schulte, CEO Marc Poeschmann, Investor Relations Slide 2 Disclaimer This document has been prepared by Fraport solely for use in this presentation. The information
Roadshow Switzerland. July Dr Matthias Zieschang CFO. Marc Poeschmann Investor Relations
 Roadshow Switzerland July 2015 Dr Matthias Zieschang CFO Marc Poeschmann Investor Relations Slide 2 Disclaimer This document has been prepared by Fraport solely for use in this presentation. The information
dbaccess German, Swiss & Austrian Conference
 dbaccess German, Swiss & Austrian Conference Berlin June 2015 Dr Matthias Zieschang CFO Stefan J. Rüter Head of Finance & Investor Relations Slide 2 Disclaimer This document has been prepared by Fraport
Business Services, Leisure & Transport Conference London May, 2016
 Business Services, Leisure & Transport Conference London May, 2016 Stefan J. Rüter Head of Finance & IR Florian Fuchs IR 2 Disclaimer This document has been prepared by Fraport solely for use in this presentation.
Analyst Presentation 6M August 7, 2014 Dr Matthias Zieschang, CFO
 Analyst Presentation 6M 2014 August 7, 2014 Dr Matthias Zieschang, CFO Slide 2 Disclaimer This document has been prepared by Fraport solely for use in this presentation. The information contained in this
Road Show North America September 2016
 Road Show North America September 2016 Stefan J. Rüter Head of Finance & IR Florian Fuchs IR 2 Disclaimer This document has been prepared by Fraport solely for use in this presentation. The information
FY2014. Frankfurt March 19, Dr Stefan Schulte CEO. Dr Matthias Zieschang CFO
 FY2014 Frankfurt March 19, 2015 Dr Stefan Schulte CEO Dr Matthias Zieschang CFO Slide 2 Disclaimer This document has been prepared by Fraport solely for use in this presentation. The information contained
Analyst Presentation 9M2015 Frankfurt November 5, 2015
 Analyst Presentation 9M2015 Frankfurt November 5, 2015 Dr Stefan Schulte CEO Dr Matthias Zieschang CFO 2 Disclaimer This document has been prepared by Fraport solely for use in this presentation. The information
Santander EuroLatam Infrastructure & Utilities Conference, New York Sept 2016
 Santander EuroLatam Infrastructure & Utilities Conference, New York 2728 Sept 2016 Stefan J. Rüter Head of Finance & IR Florian Fuchs IR 2 Santander EuroLatam Infrastructure & Utilities Conference, New
Road Show Luxembourg May 2016
 Road Show Luxembourg May 2016 Florian Fuchs Investor Relations Maximilian Schultheis Investor Relations 2 Disclaimer This document has been prepared by Fraport solely for use in this presentation. The
EuroLatam Conference
 New York September 2015 Stefan J. Rüter Head of Finance & Investor Relations Marc Poeschmann Investor Relations 2 Disclaimer This document has been prepared by Fraport solely for use in this presentation.
Analyst Presentation 6M 2017
 August 3, 2017 / Frankfurt Main Dr. Matthias Zieschang / CFO Disclaimer This document has been prepared by Fraport solely for use in this presentation. The information contained in this document has not
dbaccess Berlin Conference
 June 2017 dbaccess Berlin Conference Dr. Matthias Zieschang / CFO Disclaimer This document has been prepared by Fraport solely for use in this presentation. The information contained in this document has
Roadshow USA. April 2015
 Roadshow USA April 2015 Slide 2 Disclaimer This document has been prepared by Fraport solely for use in this presentation. The information contained in this document has not been independently verified.
July Roadshow Munich. Stefan J. Rüter, Head of Finance & IR Philipp Cölsch, IR. Fraport AG
 July 2017 Roadshow Munich Stefan J. Rüter, Head of Finance & IR Philipp Cölsch, IR isclaimer This document has been prepared by Fraport solely for use in this presentation. The information contained in
Bankhaus Lampe German Equity Forum London February Stefan Rueter SVP, Head of Finance and Investor Relations
 Bankhaus Lampe German Equity Forum London February 2016 Stefan Rueter SVP, Head of Finance and Investor Relations 2 Disclaimer This document has been prepared by Fraport solely for use in this presentation.
ODDO Forum Lyon January 2016
 ODDO Forum Lyon January 2016 Florian Fuchs Investor Relations Maximilian Schultheis Investor Relations 2 Disclaimer This document has been prepared by Fraport solely for use in this presentation. The information
November Roadshow London. Dr. Matthias Zieschang / CFO Tanja Nagel / IR. Fraport AG
 November 2017 Roadshow London Dr. Matthias Zieschang / CFO Tanja Nagel / IR Disclaimer This document has been prepared by Fraport solely for use in this presentation. The information contained in this
Road Show London April 2016
 Road Show London April 2016 Dr. Matthias Zieschang CFO Florian Fuchs Investor Relations 2 Disclaimer This document has been prepared by Fraport solely for use in this presentation. The information contained
April 6, Roadshow Luxembourg. Tanja Nagel / IR Florian Fuchs / IR
 April 6, 2018 Roadshow Luxembourg Tanja Nagel / IR Florian Fuchs / IR Disclaimer This document has been prepared by Fraport solely for use in this presentation. The information contained in this document
Analyst Presentation FY2013 Preliminary Figures. Dr. Stefan Schulte, CEO & Dr. Matthias Zieschang, CFO
 Analyst Presentation FY inary Figures Fraport Headquarters in Frankfurt March 7, 2014 Dr. Stefan Schulte, CEO & Dr. Matthias Zieschang, CFO 2 Analyst Presentation FY preliminary Disclaimer This document
New York Presentation
 September 2017 New York Presentation Tanja Nagel / IR Florian Fuchs / IR Disclaimer This document has been prepared by Fraport solely for use in this presentation. The information contained in this document
November Roadshow Brussles. Florian Fuchs / IR Maximilian Schultheis / IR. Fraport AG
 November 2017 Roadshow Brussles Florian Fuchs / IR Maximilian Schultheis / IR Disclaimer This document has been prepared by Fraport solely for use in this presentation. The information contained in this
Road Show Zurich. Dr. Matthias Zieschang / CFO Florian Fuchs / IR. May 16, 2018 / Frankfurt Main
 Road Show Zurich r. Matthias Zieschang / CFO Florian Fuchs / IR May 16, 2018 / Frankfurt Main isclaimer This document has been prepared by Fraport solely for use in this presentation. The information contained
German Investment Seminar 2015 New York
 German Investment Seminar 2015 New York January 2015 Dr Matthias Zieschang CFO Slide 2 Disclaimer This document has been prepared by Fraport solely for use in this presentation. The information contained
ODDO CONFERENCE 2015 LYON
 ODDO CONFERENCE 2015 LYON January 2015 Florian Fuchs Marc Poeschmann Investor Relations Slide 2 Disclaimer This document has been prepared by Fraport solely for use in this presentation. The information
January Roadshow London. Dr. Stefan Schulte / CEO Stefan J. Rüter / Head of Finance & IR. Fraport AG
 January 2017 Roadshow London Dr. Stefan Schulte / CEO Stefan J. Rüter / Head of Finance & IR Disclaimer This document has been prepared by Fraport solely for use in this presentation. The information contained
Analyst Presentation FY 2016
 March 17, 2017 / Frankfurt Main Dr. Stefan Schulte / CEO Dr. Matthias Zieschang / CFO Disclaimer This document has been prepared by Fraport solely for use in this presentation. The information contained
April 2017 / Dublin. Roadshow Dublin. Florian Fuchs / IR Maximilian Schultheis / IR. Fraport AG
 April 2017 / Dublin Roadshow Dublin Florian Fuchs / IR Maximilian Schultheis / IR Disclaimer This document has been prepared by Fraport solely for use in this presentation. The information contained in
IR Presentation. October 2018 Traffic Figures 9M 2018 Financial Results
 IR Presentation October 2018 Traffic Figures 9M 2018 Financial Results Disclaimer This document has been prepared by Fraport solely for use in this presentation. The information contained in this document
Analyst Presentation FY 2018
 March 19, 2019 I Frankfurt Main r. Stefan Schulte I CEO r. Matthias Zieschang I CFO isclaimer This document has been prepared by Fraport solely for use in this presentation. The information contained in
UBS Transport Conference
 UBS Transport Conference Christoph Nanke / Head of Finance & IR Tanja Nagel / IR September 10, 2018 / Frankfurt Disclaimer This document has been prepared by Fraport solely for use in this presentation.
Baader Investment Conference
 Baader Investment Conference Tanja Nagel / IR Florian Fuchs / IR September 2018 / Munich Disclaimer This document has been prepared by Fraport solely for use in this presentation. The information contained
dbaccess Berlin Conference
 dbaccess Berlin Conference Dr. Matthias Zieschang / CFO Christoph Nanke / Head of Finance & IR June 6, 2018 / Berlin Disclaimer This document has been prepared by Fraport solely for use in this presentation.
9M Group Interim Report. January 1 to September 30, 2015
 9M Group Interim Report January 1 to September 30, 2015 Contents Group Interim Management Report 1 Group Interim Financial Statements 22 Overview of Business Development 2 Situation of the Group 3 Changes
Preliminary Full Year Results 2013
 Preliminary Full Year Results 2013 2 Preliminary Full Year Results 2013 Consolidated Income Statement million 2013 2012 adjusted Revenue 2,561.4 2,442.0 Change in work-in-process 0.6 0.5 Other internal
2016 FULL YEAR FINANCIAL RESULTS PRESENTATION TO INVESTORS & ANALYSTS
 2016 FULL YEAR FINANCIAL RESULTS PRESENTATION TO INVESTORS & ANALYSTS Stephan Widrig Chief Executive Officer Lukas Brosi Chief Financial Officer SCHEDULE 1. Business Update 2. Financial performance FY2016
2015 half year financial results Presentation to investors & analysts
 2015 half year financial results Presentation to investors & analysts Stephan Widrig Chief Executive Officer Daniel Schmucki Chief Financial Officer Zurich Airport 03/09/2015 Schedule 1. Major events HY2015
Kuehne + Nagel International AG
 Kuehne + Nagel International AG Analyst Conference Call 1 st Half-Year 2011 Results July 18, 2011 (CET 14.00) Schindellegi, Switzerland Agenda Welcome & Highlights 1st Half Year 2011 Gerard van Kesteren
KION GROUP AG Q Update Call. Gordon Riske (CEO), Anke Groth (CFO) Frankfurt, 26 July 2018
, Anke Groth (CFO) Frankfurt, 26 July 2018") KION GROUP AG Q2 Update Call Gordon Riske (CEO), Anke Groth (CFO) Frankfurt, 26 July Agenda 1. Highlights 2. Market Update 3. Financial Update 4. Outlook 2 KION GROUP AG Q2 Update Call 26 July Q2 Strategic
KION GROUP AG Q2 Update Call Gordon Riske (CEO), Anke Groth (CFO) Frankfurt, 26 July Agenda 1. Highlights 2. Market Update 3. Financial Update 4. Outlook 2 KION GROUP AG Q2 Update Call 26 July Q2 Strategic
KION UPDATE CALL Q Gordon Riske, CEO Thomas Toepfer, CFO Wiesbaden, 7 May 2015
 KION UPDATE CALL 2015 Gordon Riske, CEO Thomas Toepfer, CFO Wiesbaden, 7 May 2015 AGENDA 1 Highlights Gordon Riske 2 Market update Gordon Riske 3 Financial update Thomas Toepfer 4 Outlook Gordon Riske
SMART STEEL. Q Results. Detlef Borghardt, CEO Dr. Matthias Heiden, CFO. August 14, 2018
 SMART STEEL Q2 218 Results Detlef Borghardt, CEO Dr. Matthias Heiden, CFO August 14, 218 Agenda Business Summary Guidance adjustment FY 218 Market update Regional trends: Status and profitability trend
Agenda. 1. Highlights FY 2012 Results. 2. Operational Performance Priorities for Financials. 5. Conclusion
 1MARCH 2013 Legal Disclaimer Information in this presentation may involve guidance, expectations, beliefs, plans, intentions or strategies regarding the future. These forward-looking statements involve
A G ood Good Y ear for lughafen Flughafen W i Wien: en: Results 2012
 A Good Year for Flughafen Wien: Results 2012 All major corporate targets met in 2012 investors confidence returns Increase in share price: 81% over lowest level in 2012 investors confidence returnsrns
Results 2Q18. August 2, 2018
 Results August 2, 2018 Highlights Indicators Var. x 2Q17 Operating Income (R$ MM) 42.8 +92.7% Operating Margin 1.8% +0.8 p.p. Net operating revenues: R$2.4 billion (+9.0% vs. 2Q17) ASK (BN) 10.7 +2.2%
Q Results. Strong start in May 3, 2016
 Q1 2016 Results Strong start in 2016 May 3, 2016 Legal Disclaimer Information in this presentation may involve guidance, expectations, beliefs, plans, intentions or strategies regarding the future. These
Group Interim Report. January 1 to March 31, 2013
 Group Interim Report January 1 to March 31, 2013 Group Interim Report January 1 to March 31, 2013 1 Business Development from January 1 to March 31, 2013 Adjustment of the previous year s figures Fraport
Board of Directors Zurich, 24 March, 2009 Dufry Presentation - Full Year 2009 Results
 Dufry Presentation - Full Year 2009 Results March 2010 1 Legal Disclaimer Information in this presentation may involve guidance, expectations, beliefs, plans, intentions or strategies regarding the future.
Analyst and Investor Conference Call Q2 2018
 Analyst and Investor Conference Call Q2 2018 Ulrik Svensson CFO and Member of the Executive Board Frankfurt, 31 July 2018 Disclaimer The information herein is based on publicly available information. It
Fraport AG Frankfurt Airport Services Worldwide Consolidated Income Statement * million
 Consolidated Income Statement * 2007 2008 Change in % Revenue 2.329,0 2.101,6-9,8 Change in work-in-process 0,5 0,4-20,0 Other internal work capitalized 24,6 33,8 37,4 Other operating income 71,7 66,1-7,8
Results 4Q18. Feb. 28, GRU (SP) SDU (RJ) Fare: US$62
 SDU (RJ) Fare: US$62") Results 4Q18 Feb. 28, 2019 GRU (SP) SDU (RJ) Fare: US$62 4Q18 Highlights Indicators 4Q18 Var. x 4Q17 ASK (BN) 12.5 +2.4% Traffic (000) 8,944 +3.4% Net operating revenues: R$3.2 billion (+10.1% vs. 4Q17)
Results 4Q18 Feb. 28, 2019 GRU (SP) SDU (RJ) Fare: US$62 4Q18 Highlights Indicators 4Q18 Var. x 4Q17 ASK (BN) 12.5 +2.4% Traffic (000) 8,944 +3.4% Net operating revenues: R$3.2 billion (+10.1% vs. 4Q17)
TURKEY: RECENT DEVELOPMENTS January March 2018
 TURKEY: RECENT DEVELOPMENTS January March 218 3 81 4 698 961 7 34 7 96 9 66 8 98 1 931 1 6 11 2 11 88 11 19 1 883 1 97 12 48 12 112 Per capita GDP tripled while nominal GDP quadrupled in last 1 years 237
TURKEY: RECENT DEVELOPMENTS January June 2018
 TURKEY: RECENT DEVELOPMENTS January June 218 3 81 4 698 961 7 34 7 96 9 66 8 98 1 931 1 6 11 2 11 88 11 19 1 883 1 97 12 48 12 112 Per capita GDP tripled while nominal GDP quadrupled in last 1 years 237
2015 BUSINESS RESULTS: GROWTH DESPITE HEADWINDS. Positive Outlook for 2016
 2015 BUSINESS RESULTS: GROWTH DESPITE HEADWINDS Positive Outlook for 2016 2015: Successful year in spite of headwinds from crisis areas Good business development of the company in 2015: Revenue increase
SMART STEEL. Q Results. Detlef Borghardt, CEO Dr. Matthias Heiden, CFO. November 8, 2018
 SMART STEEL Q3 218 Results Detlef Borghardt, CEO Dr. Matthias Heiden, CFO November 8, 218 Agenda Business Summary Preliminaries confirmed Market update Segments: Status and profitability trend in the regions
Kuehne + Nagel International AG
 Kuehne + Nagel International AG Analyst Conference Call 1 st Quarter 2011 Results April 18, 2011 (CET 14.00) Schindellegi, Switzerland Agenda Welcome & Highlights Q1 2011 Gerard van Kesteren Operating
THIRD QUARTER RESULTS Investor presentation 25/10/2018
 THIRD QUARTER RESULTS 2018 Investor presentation 25/10/2018 Summary Achievements and Key Figures Operating and Financial Review Outlook and Priorities 2018 Appendix Q3 Results 2018 Panalpina 2 Achievements
Q1 FY14 Management Presentation
 www.osram-licht.ag FY14 Management Presentation (preliminary figures) Solid start into FY14 OSRAM Licht AG January 29, 2014 Safe Harbor Statement This presentation may contain forward-looking statements
Q1 2017/18 RESULTS PRESENTATION. 13 February 2018
 Q1 2017/18 RESULTS PRESENTATION 13 February 2018 DISCLAIMER AND NOTES To the extent that statements in this presentation do not relate to historical or current facts, they constitute forward-looking statements.
Business Update. USPP Conference Miami. Luis Damasceno Group CFO Michael Williams Group Finance Director & Treasurer January 2019
 Business Update USPP Conference Miami Luis Damasceno Group CFO Michael Williams Group Finance Director & Treasurer 23-25 January 2019 www.alsglobal.com IMPORTANT NOTICE AND DISCLAIMER This presentation
TURKEY: RECENT DEVELOPMENTS January September 2018
 TURKEY: RECENT DEVELOPMENTS January September 218 3 81 4 698 961 7 34 7 96 9 66 8 98 1 931 1 6 11 11 88 11 19 1 883 1 97 12 48 12 112 Per capita GDP tripled while nominal GDP quadrupled in last 1 years
Amadeus FY 2014 Results
 Amadeus FY 2014 Results February 27, 2015 Disclaimer This presentation may contain certain statements which are not purely historical facts, including statements about anticipated or expected future revenue
Kuehne + Nagel International AG Analyst Conference Full-year 2016 results. March 1, 2017 (CET 14.00) Zurich, Switzerland
 Zurich, Switzerland") Kuehne + Nagel International AG Analyst Conference Full-year 2016 results March 1, 2017 (CET 14.00) Zurich, Switzerland Forward-looking statements This presentation contains forward-looking statements.
Kuehne + Nagel International AG Analyst Conference Full-year 2016 results March 1, 2017 (CET 14.00) Zurich, Switzerland Forward-looking statements This presentation contains forward-looking statements.
HALF-YEAR RESULTS 2017
 HALF-YEAR RESULTS 2017 INVESTOR PRESENTATION RESULTS FROM JANUARY TO JUNE 2017 BASEL 20 JULY 2017 Achievements and key figures Operating and financial review Outlook and priorities 2017 Appendix 2 ACHIEVEMENTS
Results 3Q18. November 1, 2018
 Results 3Q18 November 1, 2018 3Q18 Highlights Indicators 3Q18 Var. x 3Q17 ASK (BN) 12.5 +3.7% Traffic (000) 8.677 +4.5% Net operating revenues: R$2.9 billion (+8.3% vs. 3Q17) RPK (BN) 9.9 +2.2% Load Factor
Guidance for Financial Analysts to model the impact of aircraft noise on Flughafen Zürich AG s financial statements
 Guidance for Financial Analysts to model the impact of aircraft noise on Flughafen Zürich AG s financial statements Zurich Airport, March 2018 Flughafen Zürich AG refinances all costs related to aircraft
ANNUAL GENERAL MEETING METRO AG. 15 February 2019
 ANNUAL GENERAL MEETING METRO AG 15 February 2019 DISCLAIMER AND NOTES To the extent that statements in this presentation do not relate to historical or current facts, they constitute forward-looking statements.
163,28,22 230,203,96 191,191,191 0,51,153 26,173, ,219, ,64, ,160,98
 1 Legal Disclaimer Information in this presentation may involve guidance, expectations, beliefs, plans, intentions or strategies regarding the future. These forward-looking statements involve risks and
Kuehne + Nagel International AG
 Kuehne + Nagel International AG Analyst Conference Call 9-months Results October 15, (CET 14.00) Schindellegi, Switzerland Forward-looking statements This presentation contains forward-looking statements.
2012 Third Quarter Review
 November 2, 2012 1 Panalpina Group Basel, November 2, 2012 November 2, 2012 2 Highlights and key figures Operating and financial review Outlook November 2, 2012 3 Further business growth in Ocean Freight
FULL-YEAR RESULTS 2017
 FULL-YEAR RESULTS 2017 INVESTOR PRESENTATION RESULTS FROM JANUARY TO DECEMBER 2017 BASEL 07 MARCH 2018 Achievements and key figures Operating and financial review IFRS changes 2018 Financial guidance 2018
RESULTS PRESENTATION. For the 3 months to 30 June 2017
 RESULTS PRESENTATION For the 3 months to 30 June 2017 NOTICE The information contained in this document has not been independently verified. No representation or warranty, express or implied, is made as
Agenda. 1. Highlights 9M 2013 Results. 2. Financials. 3. Conclusion
 1November 2013 Legal Disclaimer Information in this presentation may involve guidance, expectations, beliefs, plans, intentions or strategies regarding the future. These forward-looking statements involve
FULL-YEAR RESULTS 2016
 FULL-YEAR RESULTS 2016 INVESTOR PRESENTATION RESULTS FROM JANUARY TO DECEMBER 2016 ZURICH 02 MARCH 2017 Achievements and key figures Operating and financial review Outlook and priorities 2017 Appendix
Air Berlin PLC 13 th August Analyst Call 2nd Quarter 2015
 Air Berlin PLC 13 th August 2015 Analyst Call 2nd Quarter 2015 DISCLAIMER This presentation has been prepared by Air Berlin PLC. No representation, warranty or undertaking, express or implied, is made
FLUGHAFEN WIEN AG. Q1-3/2014 Results
 FLUGHAFEN WIEN AG Q1-3/2014 Results PAX growth and cost discipline lead to increased earnings Positive trend in passenger development (17.2 million PAX, + 2.9%) slowed by political crises (Ukraine, Middle
Text. improvement in earnings. Textdemand drove continued
 Good Textdemand drove continued improvement in earnings Text Presentation of the Q2/2018 results Martin Lindqvist, President & CEO Håkan Folin, CFO July 20, 2018 Agenda Market and demand trends Performance
NKT Holding. Interim Report Q Audiocast presentation 8 November 2012 at 10:00 am CET
 NKT Holding Interim Report Q3 2012 Audiocast presentation 8 November 2012 at 10:00 am CET Agenda Page Page 2 2 NKT Group Highlights Q3 2012 Financial results Q3 2012 Companies NKT Cables Nilfisk-Advance
ICELANDAIR GROUP HF PRESENTATION OF Q RESULTS 31 JULY 2014
 ICELANDAIR GROUP HF PRESENTATION OF Q2 2014 RESULTS 31 JULY 2014 FINANCIAL RESULTS BOGI NILS BOGASON ǀ CFO INCOME STATEMENT Q2 USD thousand Q2 2014 Q2 2013 % Chg. Operating Income 297.8 265.6 12% Salaries
Positive trend in earnings and strong cash flow
 Positive trend in earnings and strong cash flow Presentation of the Q3/2017 result Martin Lindqvist, President & CEO Håkan Folin, CFO October 25, 2017 Agenda Q3/2017 and performance by division Financials
Quality assets. Selective and profitable growth. Self-funding business model
 This presentation has been prepared by EDP Renováveis, S.A. (the "Company") solely for use at the presentation to be made on May 6 th, 2015. By attending the meeting where this presentation is made, or
Kuehne + Nagel International AG. Analyst Conference Result 2009 March 1, 2010 Zurich, Switzerland
 Kuehne + Nagel International AG Analyst Conference Result 2009 March 1, 2010 Zurich, Switzerland Agenda Welcome and Highlights 2009 Operating Review 2009 Financial Review 2009 Outlook 2010 Gerard van Kesteren
Kuehne + Nagel International AG
 Kuehne + Nagel International AG Analyst Conference Call Q1 2012 Results April 16, 2012 (CET 14.00) Schindellegi, Switzerland Agenda Highlights Q1 2012 Operating Review Q1 2012 Financial Review Outlook
Air Berlin PLC 11 th November 2015 Analyst Conference 3rd Quarter 2015
 Air Berlin PLC 11 th November 2015 Analyst Conference 3rd Quarter 2015 DISCLAIMER This presentation has been prepared by Air Berlin PLC. No representation, warranty or undertaking, express or implied,
KION Q3 UPDATE CALL Gordon Riske, CEO Thomas Toepfer, CFO Wiesbaden, 14 November 2013
 KION Q3 UPDATE CALL 2013 Gordon Riske, CEO Thomas Toepfer, CFO Wiesbaden, 14 November 2013 AGENDA 1 Highlights 2013 Gordon Riske 2 Financial Update Thomas Toepfer 3 Outlook Gordon Riske 14 November 2013
NINE MONTHS RESULTS 2017
 NINE MONTHS RESULTS 2017 INVESTOR PRESENTATION RESULTS FROM JANUARY TO SEPTEMBER 2017 BASEL 19 OCTOBER 2017 Achievements and key figures Operating and financial review Outlook and priorities 2017 Appendix
Conference Call Results Q November 5, 2014
 Conference Call Results Q3 2014 November 5, 2014 Q3 2014: Key developments Despite a more difficult environment, ongoing start-up losses in battery technology, and a slump in Brazilian market, EK delivered
ADMIE (IPTO) Holding S.A. 1H 17 earnings presentation September 2017
 Holding S.A. 1H 17 earnings presentation September 2017") ADMIE (IPTO) Holding S.A. 1H 17 earnings presentation September 2017 Disclaimer This document contains forward-looking statements that involve risks and uncertainties. These statements may generally, but
ADMIE (IPTO) Holding S.A. 1H 17 earnings presentation September 2017 Disclaimer This document contains forward-looking statements that involve risks and uncertainties. These statements may generally, but
Nine Months Results January to September 2014
 Panalpina Group 21 October 2014 Nine Months Results January to September 2014 21 October 2014 2 Highlights and key figures Operating and financial review Outlook Appendix 21 October 2014 3 Highlights and
Making it happen. 6 March 2018
 Making it happen 6 March 2018 LEGAL NOTICE This presentation has been prepared to inform investors and prospective investors in the secondary markets about the Group and does not constitute an offer of
Q1 I Hapag-Lloyd AG. Investor Report. 1 January to 31 March 2018
 Q1 I 2018 1 Hapag-Lloyd AG Investor Report 1 January to 31 March 2018 SUMMARY OF HAPAG-LLOYD KEY FIGURES Q1 2018 Q1 2017 Change Key operating figures Total vessels, of which 221 172 28% Own vessels 98
FLUGHAFEN WIEN AG. Results for Q1-3/2013
 FLUGHAFEN WIEN AG Results for Q1-3/2013 Highlights in Q1-3/2013 Passenger traffic -1.1% in Q1-3/2013 but +0.2% in local PAX Reasons: severe winter, capacity reductions by the airlines and strikes in Germany,
FY 2016 Results March 2nd, 2017
 FY 2016 Results March 2nd, 2017 Definitions & assumptions In this presentation: ForEx stands for Foreign Exchange Rates; Organic stands for effect net of ForEx and hedging derivatives; Q4 stands for fourth
HOLD. Deleveraging story playing out RAMCO CEMENTS. Target Price: Rs 503. Q4 performance
 RAMCO S HOLD Target Price: Rs 503 Deleveraging story playing out Ramco Cements total debt reduced by a massive Rs 5 bn to Rs 22 bn in FY16. The company generated total EBITDA of Rs 11.5 bn in FY16 and
Unipro PJSC 2016 Full year results
 Unipro PJSC 2016 Full year results 16 March 2017 2016 results stable operating earnings hit by a one off effect EBITDA 1,2 EBIT 1,2 Highlights 24.9bn 17.7bn 12M 2015 12M 2016 17.4bn 12M 2015 11.0bn 12M
HELLA Investor Update FY 2016/17
 HELLA Investor Update FY 2016/17 Conference Call on August 10th, 2017 Dr. Rolf Breidenbach, CEO Bernard Schäferbarthold, CFO HF-7761DE_C (2012-12) Disclaimer This document was prepared with reasonable
HAMBURGER HAFEN UND LOGISTIK AG
 HAMBURGER HAFEN UND LOGISTIK AG Analyst Conference Call on the Interim Results January to March 2017 Hamburg, 12 May 2017 Disclaimer The facts and information contained herein are as up to date as is reasonably