Analyst Presentation 9M2015 Frankfurt November 5, 2015
|
|
|
- Matthew James
- 5 years ago
- Views:
Transcription


1 Analyst Presentation 9M2015 Frankfurt November 5, 2015 Dr Stefan Schulte CEO Dr Matthias Zieschang CFO
2 2 Disclaimer This document has been prepared by Fraport solely for use in this presentation. The information contained in this document has not been independently verified. No representation or warranty whether express or implied is made as to, and no reliance should be placed on, the fairness, accuracy, completeness or correctness of the information or opinions contained therein. Neither the company nor any of its affiliates, advisors or representatives shall have any liability whatsoever (in negligence or otherwise) for any loss arising from any use of this document or its content or otherwise arising in connection with this document. This document does not constitute an offer or invitation to purchase or subscribe for any shares and neither this document nor any part of it shall form the basis of, or be relied upon in connection with, any contract or commitment whatsoever. This document contains forwardlooking statements that are based on current estimates and assumptions made by the management of Fraport to the best of its knowledge. Such forwardlooking statements are subject to risks and uncertainties, the nonoccurrence or occurrence of which could cause the actual results including the financial condition and profitability of Fraport to differ materially from or be more negative than those expressed or implied by such forwardlooking statements. This also applies to the forward looking estimates and forecasts derived from thirdparty studies. Consequently, neither the company nor its management can give any assurance regarding the future accuracy of the opinions set forth in this document or the actual occurrence of the predicted developments. By accepting this document, you agree with the foregoing.
3 3 Agenda Financial Highlights Traffic Insight News from FRA Airport Charges at FRA T3 Ground Breaking Retail Multichannel Greek Airports Outlook 2015 Financials 9M2015 in Detail
4 4 Financial Highlights Fraport Group Figures 9M 2015 (P&L) in mil. 9M2015 9M2014 yoy Revenue 1,967 1, % EBITDA % EBIT % Group Result* % Traffic Figures up, FRA with 3.6% upside in passenger traffic Revenue increased by 9.5% (IFRIC12 adjusted +9.4%) GroupEBITDA rose to 689 million, an upside of 11% All segments contributing, mostly Retail and External performance Group Result increased by 19% mostly due to operating performance * Before minorities
5 5 Financial Highlights Fraport Group Figures 9M2015 (Cash Flow, Debt, Capex) in mil. 9M2015 9M2014 yoy Operating Cash Flow % Capex* % Dividend from Investments % Free Cash Flow % Gearing in %** 82% 97% 15PP Net Debt** 2,762 3,013 8 % Operating Cash Flow significantly up due to good operating performance Combined with downward trend in Capex and slightly lower dividends from at equity investments, Free Cash Flow moved substantially up Gearing & Net Debt down despite dividend payment * as used in PPE, airport operating projects, investment property, and other intangible assets ** yearend figures for 2014
6 6 Agenda Financial Highlights Traffic Insight News from FRA T3 Ground Breaking Airport Charges at FRA Retail Multichannel Greek Airports Outlook 2015 Financials 9M2015 in Detail
7 7 Traffic Insight Group Passenger Development (stakes above 10%) IATA Code Airport Share Sep 2015 D previous year YTD 2015 D previous year FY 2014 CAGR FRA Frankfurt, Germany 100% 5, % 47, % 59, % LJU Ljubljana, Slovenia 100% % 1, % 1, % LIM Lima, Peru 70% 1, % 12, % 15, % BOJ Burgas, Bulgaria 60% % 2, % 2, % VAR Varna, Bulgaria 60% % 1, % 1, % AYT Antalya, Turkey 51% 3,660 +0% 22, % 27, % LED St. Petersburg, Russia 35.5% 1, % 10, % 14, % HAJ Hanover, Germany 30% % 4, % 5, % XIY Xi an, China 24.5% 2, % 24, % 29, %
8 8 Traffic Insight Frankfurt Airport Sep 2015 D % YTD 9M 2015 D % FY 2014 Passengers in `000 5, , ,566 Movements , ,026 MTOW in `000 tons 2, , ,958 Cargo in `000 tons , ,132 90% 85% 80% Seat load factor YTD 2015 YTD 2014 Passenger per movement +4.8 Pax 75% 70% 65% Jan Feb Mar Apr May Jun Jul Aug Sep Oct Nov Dec New passenger guidance FY2015: Between +~3% and +~4% Passenger figures according to ACI, commercial traffic only; cargo includes air freight and air mail
9 9 Traffic Insight Frankfurt Airport Passenger Flows YTD 09/2015 Western Europe Domestic Eastern Europe North America D 43% +3% D 11% +5% D 9% +4% D 14% +1% Latin America D 4% +1% Frankfurt Airport Africa D 4% +3% Middle East D 5% +6% Far East D 11% +6% Continental Intercontinental D Traffic Share YTD vs. previous year D 62% +4% D 38% +4%

10 10 Traffic Insight Winter Schedule FRA 2015/ No significant changes in airline portfolio 2 Winter schedule with a moderate seat upside close to 2% 3 Passenger flight movements stable 4 Lufthansa JUMP program positive but minimal impact Winter schedule from end of October 2015 to end of March 2016
11 11 Agenda Financial Highlights Traffic Insight News from FRA Airport Charges at FRA T3 Ground Breaking Retail Multichannel Greek Airports Outlook 2015 Financials 9M2015 in Detail
12 12 News from FRA Airport Charges at FRA Application for Airport Charge increase filed in at Hesse Ministry of Economics, Energy, Transportation and State Development (HMWEVL) in July 2015 Intended increase of 1.9% on airport charges for 2016 Reflecting both: airline needs for cost control and the airport s need for adequate return on capital Fraport AG retracted its application on October 29, 2015 Currently, the HMWEVL and Fraport AG have differing views regarding the calculation of essential cost elements including capital costs Until a new airport charge schedule comes into force the current charge schedule will remain valid also beyond January 1, 2016 Fraport AG will reexamine the issue and submit a new application in 2016

13 13 News from FRA Terminal 3: Ground Breaking in October 2015 Capex budget bn. in total Additional passenger capacity 14 million Floor space ca. 90,000 sqm Large stateoftheart Retail facilities 24 gate positions at the building 4 CheckinAreas with 100 counters Opening 2022 Focus 2016 on excavation works

14 14 News from FRA Retail Multichannel starts Q2/2016 ff. 12/2015 Q1/2016 Online Payment & Home Delivery Q2/2016 Rollout Interactive Airport Desk I AID Additional delivery options Online Platform 09/2015 Test phase Interactive Airport Desk I AID Loyalty programm Relaunch Travel Homepage & App
15 15 Agenda Financial Highlights Traffic Insight News from FRA Airport Charges at FRA T3 Ground Breaking Retail Multichannel Greek Airports Outlook 2015 Financials 9M2015 in Detail


16 16 Greek Airports Status Quo The preferred investor Fraport AG Copelouzos group (Slentel Ltd) extended the validity of their offer in Oct 2015 Also the reserve candidates extended the validity of their offers The concession agreement is expected to be signed with the Fraport AG Copelouzos group by the end of 2015 Takeover of the airports (Closing) is expected to take place in autumn 2016 Target of Fraport Consortium remains to finance the project partly via debt on the level of the concession companies Growth rates remain good in Greece: September 2015 yoy traffic growth of around 6.9 %
17 17 Agenda Financial Highlights Traffic Insight News from FRA Airport Charges at FRA T3 Ground Breaking Retail Multichannel Greek Airports Outlook 2015 Financials 9M2015 in Detail
18 18 Outlook 2015 Guidance slightly lifted driven by FRA Traffic New Outlook 2015 Passengers FRA Between +~3% and +~4% Revenue (IFRIC 12 adjusted) revenue between ~ 2.55 and ~ 2.6 bn. EBITDA between ~ 840 and ~ 850 mil. EBIT between ~ 520 and ~ 530 mil. Group result* between ~ 275 and ~ 295 mil. Dividend proposal stable *Group result before minorities
19 19 Agenda Financial Highlights Traffic Insight News from FRA Airport Charges at FRA T3 Ground Breaking Retail Multichannel Greek Airports Outlook 2015 Financials 9M2015 in Detail
20 20 Group P&L 9M 2015 Group Financials reflect growing Operations P&L in mil. 9M 15 9M 14 % Revenue 1,967 1, excl. IFRIC 12 1,957 1, EBITDA EBIT EBT Group result EPS in Comments All segments with growing earnings Tailwind from Retail, FRA pricing, US$ conversion, and new investments Improvement in financial result despite negative CHF loan valuation Group result and EPS with doubledigit increase 1,797 Revenue by segment in mil , EBITDA by segment in mil Revenue 9M 2014 Aviation Retail & Real Estate Ground Handling External Activities & Services Revenue 9M 2015 EBITDA 9M 2014 Aviation Retail & Real Estate Ground Handling External Activities & Services EBITDA 9M 2015 Due to commercial rounding slight discrepancies may occur when summing up, percent changes based on unrounded figures
21 21 Group P&L 9M 2015 External Activities increase its Share in Group EBITDA mil mil EBITDA 9M 2014 Revenue ex. IFRIC 12 IFRIC 12 revenue Other income Cost of materials ex. IFRIC 12 IFRIC 12 cost of materials Staff cost Other opex EBITDA 9M 2015 Segment share in Group EBITDA 9M 2014 Segment share in Group EBITDA 9M 2015 External Activities & Services Ground Handling 20,0% 5,7% 31,8% Aviation External Activities & Services Ground Handling 23,2% 5,9% 29,3% Aviation 42,5% Retail & Real Estate 41,6% Retail & Real Estate Due to commercial rounding slight discrepancies may occur when summing up
22 22 Group P&L 9M 2015 Group Result up due to higher EBITDA & Financial Result + 42 mil mil Group result 9M 2014 EBITDA D&A Financial result Taxes Group result 9M 2015 EPS 9M 2014 EPS 9M 2015 Split of financial result Comments mil 9M 15 9M 14 % Interest income Interest expenses At equity result Other result 1 8 >100 Financial result Improved interest result from lower interest rates, lower debt, and lower interest cost added back on provisions Split of equity result: Antalya down due to less Russian travelers Xi an and Hanover up Other financial result up, despite negative impact from CHF loan market valuation Due to commercial rounding slight discrepancies may occur when summing up, percent changes based on unrounded figures
23 23 Group Asset & Financial Situation 9M FCF per Share at 4.2 Operating cash flow Intangible assets PPE Airport operating projects Investment property DVDs from investments Free cash flow mil M M 2014 YTD development Sharp increase in OCF due to good earnings and lower cash outs for interests and taxes FRA capex 25% on previous year Stable remaining cash in and outflows Incl. DVD pay out FCF provided c. 260 mil. retained cash 2015 Outlook Capex won t exceed 2014 level FCF expected to remain above 10% of net debt Including DVD payout, FCF will lead to deleverage at high single digit percentage point level Due to commercial rounding slight discrepancies may occur when summing up
24 Due to commercial rounding slight discrepancies may occur when summing up 1) FCF predividend payout; figures correspond to 6M figures 2) Net debt divided by equity less noncontrolling interests and profit earmarked for distribution 24 Group Asset & Financial Situation Strong FCF eases Balance Sheet Dynamics FCF 1 Liquidity Gross debt Net debt Equity Gearing 2 mil % 97% Sept. 30, 2015 Dec. 31, 2014 Cash development FCF of 389 mil. clearly above previous year Repayment of gross debt and cash out for DVD led to slight decline in liquidity Net debt clearly below 3bn, 2015 net debt/ebitda therefore c. at 3.2x Balance sheet Group result, valuation of derivatives, and currency effects lead to increase in equity to more than 3.4 bn Gearing c.15 PP down on Dec. 31, 2014 Equity ratio at 37.6% (Dec. 31, 2014: 34.4%) Slightly diluting effects from accrued interest
25 25 Segment Aviation Incremental Revenue almost completely offset P&L in mil. 9M 15 9M 14 % Revenue Airport charges Security Services Other EBITDA EBIT Employees 6,019 6, Comments FRA traffic drives revenue growth Headwind from: Revenue increase slowed down by flat movement development and FraConnect 13 mil. impact from wage increases Other income 4 mil. down due to release of provisions in 2014 Additional opex from creation of provisions, noncapitalizable capex, and quality measures EBITDA performance in mil. Revenue split Security Services 12,8% 4,2% Other EBITDA 9M 2014 Revenue Other income Staff cost Other EBITDA 9M ,0% Aviation charges Due to commercial rounding slight discrepancies may occur when summing up, percent changes based on unrounded figures
26 26 Segment Retail & Real Estate More Traffic & higher spend per Passenger strong Result P&L in mil. 9M 15 9M 14 % Revenue Retail Real Estate Parking EBITDA EBIT Comments Strong revenue increase from retail and parking businesses Cost level flat on previous year EBITDA and EBIT increase in same magnitude as revenue EBITDA margin >80% Employees EBITDA performance in mil. Revenue split Parking 1,1% Other 17,4% 43,9% Retail EBITDA 9M 2014 Revenue Other income Staff cost Other EBITDA 9M 2015 Real Estate 37,6% Due to commercial rounding slight discrepancies may occur when summing up, percent changes based on unrounded figures
27 27 Segment Retail & Real Estate Retail per Passenger 6.7% up on Previous Year Retail revenue per Passenger 9M 12: M 13: M 14: M 15: ,40 3,10 2,95 3,95 3,74 3,42 3,24 4,11 3,95 3,93 3,69 3,22 3,41 3,26 3,04 FY 12: 3.32 FY 13: 3.60 FY 14: 3.43 mil. Shopping Services Advertis. Q1 Q2 Q3 Q4 Q1 Q2 Q3 Q4 Q1 Q2 Q3 Q4 Q1 Q2 Q
28 28 Segment Retail & Real Estate Development of Core Spending Destinations Volume Development % Change in % 2 China Japan Russia Korea Brazil vs. 9M 14 USA Germany Turkey Canada India 13 Retail Revenue per Passenger % Change in % China Japan Russia Korea Brazil vs. 9M 14 USA Germany Turkey Canada India 11 21
29 29 Segment Ground Handling Positive Earnings Momentum due Tight Cost Management P&L in mil. 9M 15 9M 14 % Revenue Ground Handling Infrastructure EBITDA EBIT Employees 9,297 8, Comments Revenue increase from higher volumes and prices in infrastructure Staff cost up due to volume and price EBITDA with good growth supported by lower other opex Despite higher D&A, EBIT up EBITDA performance in mil. Revenue split Infrastructure 43,5% 56,5% Ground Handling EBITDA 9M 2014 Revenue Other income Staff cost Other EBITDA 9M 2015 Due to commercial rounding slight discrepancies may occur when summing up, percent changes based on unrounded figures
30 30 Segment External Activities & Services Growth from Lima and new Investments P&L in mil. 9M 15 9M 14 % Revenue excl. IFRIC AMU 44 8 >100 Ljubljana 27 EBITDA EBIT Employees 4,901 4, Comments Strong increase from Lima traffic and positive US$ effect Full YTD contribution of AMU & LJU Lower earnings from Varna/Burgas and termination of Saudi mgmt. contracts Other income up from Air IT book gain Strong increase in EBITDA and EBIT EBITDA performance in mil. Revenue split Ljubljana Other 6,9% 16,0% EBITDA 9M 2014 AMU LJU LAP Twin Star Saudi Arabia Air IT Other EBITDA 9M 2015 Airmall 11,5% 12,8% Twin Star 52,8% Lima Due to commercial rounding slight discrepancies may occur when summing up, percent changes based on unrounded figures
31 31 External Activities Fully consolidated Investments 1 Airmall 2 Ljubljana 2 Lima Twin Star mil. 9M 15 9M 14 % 9M 15 9M 14 % 9M 15 9M 14 % 9M 15 9M 14 % Revenue ex IFRIC > EBITDA margin adjusted % % > % % 38.4% % 38.1% % 65.3% % 65.4% 8.5 EBIT margin adjusted 4 8.6% 1 9.5% > % % 31.6% % 30.8% % 48.3% % 49.6% 10.9 Result 4 1 > Passengers in mil ) Figures refer to IFRS accounting, not local GAAP, percent changes based on unrounded figures 2) Airmall acquired August 2014 and Ljubljana October 2014
32 32 External Activities At Equity consolidated Investments Antalya Pulkovo Hanover Xi An mil. 9M 15 9M 14 % 9M 15 9M 14 % 9M 15 9M 14 % 9M 15 9M 14 % Revenue ex IFRIC EBITDA margin adjusted % % % 61.1% % 46.2% % % % % 45.8 EBIT margin adjusted % % % 43.5% % 29.5% % 7 6.5% % % 62.6 Result > > Passengers in mil Except for Xi an all figures refer to IFRS accounting, percent changes based on unrounded figures

33 Thank you for your Attention!

34 34 Appendix Group P&L 9M 2015

35 35 Appendix Group Cash Flow Statement 9M 2015


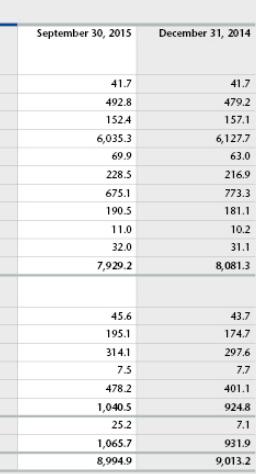


36 36 Appendix Financial Position as at September 30, 2015
37 37 Appendix Special Effects 9M 2015 mil. 9M 15 9M 14 Group financial result Market valuation of derivatives & F/X fluctuations Segment External Activities IFRIC 12 revenue AMU Holdings acquired August 2014 Revenue EBITDA EBIT Aerodrom Ljubljana acquired Oct Revenue 26.7 EBITDA 10.9 EBIT 3.4 Air Transport IT disposed April 2015 Revenue EBITDA EBIT Fraport Saudi Arabia ended June 2014 Revenue 9.5 EBITDA 3.1 EBIT 3.0
38 38 Appendix 9M Effects on Aviation EBITDA Balanced with staff cost Mainly FraConnect kickback More provisions released in 2014 Mainly wage increases, thereof: 8 mil. balanced in rev. Mainly: noncapitalizable capex, provisions created & quality measres mil EBITDA 9M 2014 Aviation charges Security revenue Other revenue Other income Staff cost Other EBITDA 9M 2015 Split of aviation charges 9M 2015 % share in aviation charges mil 9M 15 9M 14 % Passenger Security 5,6% Parking 6,1% Takeoff & emission Parking Security Takeoff & emission 20,9% 67,4% Passenger Total Due to commercial rounding slight discrepancies may occur when summing up, percent changes based on unrounded figures
39 39 Appendix Maturity Profile & Cash Position as at September 30, 2015 mil ,5 Fraport debt conditions on average ~ 3.3 % interest rate ~ 4.9 years maturity Bookvalue nominal ,6 Liquidity as of Sep 30, 2015 Financial Liabilities 1132,8 471,9 377,2 517,3 422,8 413,9 238,0 321,2 5,1 2,


40 40 Appendix IR Contact Fraport AG Frankfurt Airport Services Worldwide Frankfurt am Main Stefan J. Rüter Head of Finance & Investor Relations Svenja Ebeling Investor Relations Assistant Marc Poeschmann Manager Investor Relations Florian Fuchs Manager Investor Relations & Financial Reporting
Kepler Cheuvreux European Infrastructure Tour September, Stefan J. Rüter Head of Finance & IR
 September, 2016 Stefan J. Rüter Head of Finance & IR 2 Disclaimer This document has been prepared by Fraport solely for use in this presentation. The information contained in this document has not been
Analyst Presentation Q May 7, 2015 Dr Matthias Zieschang, CFO
 Analyst Presentation Q1 2015 May 7, 2015 Dr Matthias Zieschang, CFO Slide 2 Disclaimer This document has been prepared by Fraport solely for use in this presentation. The information contained in this
Bankhaus Lampe German Equity Forum London February Stefan Rueter SVP, Head of Finance and Investor Relations
 Bankhaus Lampe German Equity Forum London February 2016 Stefan Rueter SVP, Head of Finance and Investor Relations 2 Disclaimer This document has been prepared by Fraport solely for use in this presentation.
ODDO Forum Lyon January 2016
 ODDO Forum Lyon January 2016 Florian Fuchs Investor Relations Maximilian Schultheis Investor Relations 2 Disclaimer This document has been prepared by Fraport solely for use in this presentation. The information
Business Services, Leisure & Transport Conference London May, 2016
 Business Services, Leisure & Transport Conference London May, 2016 Stefan J. Rüter Head of Finance & IR Florian Fuchs IR 2 Disclaimer This document has been prepared by Fraport solely for use in this presentation.
UBS Global Transport, Travel & Leisure Conference 2015
 UBS Stefan J. Rueter Head of Finance & IR Marc Poeschmann Investor Relations 2 Disclaimer This document has been prepared by Fraport solely for use in this presentation. The information contained in this
Analyst Presentation Q May 8, 2014 Dr Matthias Zieschang, CFO
 Analyst Presentation Q1 2014 May 8, 2014 Dr Matthias Zieschang, CFO Slide 2 Disclaimer This document has been prepared by Fraport solely for use in this presentation. The information contained in this
Road Show North America September 2016
 Road Show North America September 2016 Stefan J. Rüter Head of Finance & IR Florian Fuchs IR 2 Disclaimer This document has been prepared by Fraport solely for use in this presentation. The information
Santander EuroLatam Infrastructure & Utilities Conference, New York Sept 2016
 Santander EuroLatam Infrastructure & Utilities Conference, New York 2728 Sept 2016 Stefan J. Rüter Head of Finance & IR Florian Fuchs IR 2 Santander EuroLatam Infrastructure & Utilities Conference, New
Road Show Luxembourg May 2016
 Road Show Luxembourg May 2016 Florian Fuchs Investor Relations Maximilian Schultheis Investor Relations 2 Disclaimer This document has been prepared by Fraport solely for use in this presentation. The
Road Show London April 2016
 Road Show London April 2016 Dr. Matthias Zieschang CFO Florian Fuchs Investor Relations 2 Disclaimer This document has been prepared by Fraport solely for use in this presentation. The information contained
FY2014. Frankfurt March 19, Dr Stefan Schulte CEO. Dr Matthias Zieschang CFO
 FY2014 Frankfurt March 19, 2015 Dr Stefan Schulte CEO Dr Matthias Zieschang CFO Slide 2 Disclaimer This document has been prepared by Fraport solely for use in this presentation. The information contained
Analyst Presentation 6M August 7, 2014 Dr Matthias Zieschang, CFO
 Analyst Presentation 6M 2014 August 7, 2014 Dr Matthias Zieschang, CFO Slide 2 Disclaimer This document has been prepared by Fraport solely for use in this presentation. The information contained in this
Roadshow FRANKFURT. May Dr Stefan Schulte, CEO Marc Poeschmann, Investor Relations
 Roadshow FRANKFURT May 2015 Dr Stefan Schulte, CEO Marc Poeschmann, Investor Relations Slide 2 Disclaimer This document has been prepared by Fraport solely for use in this presentation. The information
EuroLatam Conference
 New York September 2015 Stefan J. Rüter Head of Finance & Investor Relations Marc Poeschmann Investor Relations 2 Disclaimer This document has been prepared by Fraport solely for use in this presentation.
Roadshow Switzerland. July Dr Matthias Zieschang CFO. Marc Poeschmann Investor Relations
 Roadshow Switzerland July 2015 Dr Matthias Zieschang CFO Marc Poeschmann Investor Relations Slide 2 Disclaimer This document has been prepared by Fraport solely for use in this presentation. The information
Analyst Presentation 6M 2017
 August 3, 2017 / Frankfurt Main Dr. Matthias Zieschang / CFO Disclaimer This document has been prepared by Fraport solely for use in this presentation. The information contained in this document has not
dbaccess German, Swiss & Austrian Conference
 dbaccess German, Swiss & Austrian Conference Berlin June 2015 Dr Matthias Zieschang CFO Stefan J. Rüter Head of Finance & Investor Relations Slide 2 Disclaimer This document has been prepared by Fraport
Roadshow USA. April 2015
 Roadshow USA April 2015 Slide 2 Disclaimer This document has been prepared by Fraport solely for use in this presentation. The information contained in this document has not been independently verified.
dbaccess Berlin Conference
 June 2017 dbaccess Berlin Conference Dr. Matthias Zieschang / CFO Disclaimer This document has been prepared by Fraport solely for use in this presentation. The information contained in this document has
New York Presentation
 September 2017 New York Presentation Tanja Nagel / IR Florian Fuchs / IR Disclaimer This document has been prepared by Fraport solely for use in this presentation. The information contained in this document
July Roadshow Munich. Stefan J. Rüter, Head of Finance & IR Philipp Cölsch, IR. Fraport AG
 July 2017 Roadshow Munich Stefan J. Rüter, Head of Finance & IR Philipp Cölsch, IR isclaimer This document has been prepared by Fraport solely for use in this presentation. The information contained in
November Roadshow London. Dr. Matthias Zieschang / CFO Tanja Nagel / IR. Fraport AG
 November 2017 Roadshow London Dr. Matthias Zieschang / CFO Tanja Nagel / IR Disclaimer This document has been prepared by Fraport solely for use in this presentation. The information contained in this
April 6, Roadshow Luxembourg. Tanja Nagel / IR Florian Fuchs / IR
 April 6, 2018 Roadshow Luxembourg Tanja Nagel / IR Florian Fuchs / IR Disclaimer This document has been prepared by Fraport solely for use in this presentation. The information contained in this document
November Roadshow Brussles. Florian Fuchs / IR Maximilian Schultheis / IR. Fraport AG
 November 2017 Roadshow Brussles Florian Fuchs / IR Maximilian Schultheis / IR Disclaimer This document has been prepared by Fraport solely for use in this presentation. The information contained in this
Road Show Zurich. Dr. Matthias Zieschang / CFO Florian Fuchs / IR. May 16, 2018 / Frankfurt Main
 Road Show Zurich r. Matthias Zieschang / CFO Florian Fuchs / IR May 16, 2018 / Frankfurt Main isclaimer This document has been prepared by Fraport solely for use in this presentation. The information contained
Analyst Presentation FY2013 Preliminary Figures. Dr. Stefan Schulte, CEO & Dr. Matthias Zieschang, CFO
 Analyst Presentation FY inary Figures Fraport Headquarters in Frankfurt March 7, 2014 Dr. Stefan Schulte, CEO & Dr. Matthias Zieschang, CFO 2 Analyst Presentation FY preliminary Disclaimer This document
January Roadshow London. Dr. Stefan Schulte / CEO Stefan J. Rüter / Head of Finance & IR. Fraport AG
 January 2017 Roadshow London Dr. Stefan Schulte / CEO Stefan J. Rüter / Head of Finance & IR Disclaimer This document has been prepared by Fraport solely for use in this presentation. The information contained
German Investment Seminar 2015 New York
 German Investment Seminar 2015 New York January 2015 Dr Matthias Zieschang CFO Slide 2 Disclaimer This document has been prepared by Fraport solely for use in this presentation. The information contained
ODDO CONFERENCE 2015 LYON
 ODDO CONFERENCE 2015 LYON January 2015 Florian Fuchs Marc Poeschmann Investor Relations Slide 2 Disclaimer This document has been prepared by Fraport solely for use in this presentation. The information
Analyst Presentation FY 2016
 March 17, 2017 / Frankfurt Main Dr. Stefan Schulte / CEO Dr. Matthias Zieschang / CFO Disclaimer This document has been prepared by Fraport solely for use in this presentation. The information contained
April 2017 / Dublin. Roadshow Dublin. Florian Fuchs / IR Maximilian Schultheis / IR. Fraport AG
 April 2017 / Dublin Roadshow Dublin Florian Fuchs / IR Maximilian Schultheis / IR Disclaimer This document has been prepared by Fraport solely for use in this presentation. The information contained in
IR Presentation. October 2018 Traffic Figures 9M 2018 Financial Results
 IR Presentation October 2018 Traffic Figures 9M 2018 Financial Results Disclaimer This document has been prepared by Fraport solely for use in this presentation. The information contained in this document
Analyst Presentation FY 2018
 March 19, 2019 I Frankfurt Main r. Stefan Schulte I CEO r. Matthias Zieschang I CFO isclaimer This document has been prepared by Fraport solely for use in this presentation. The information contained in
UBS Transport Conference
 UBS Transport Conference Christoph Nanke / Head of Finance & IR Tanja Nagel / IR September 10, 2018 / Frankfurt Disclaimer This document has been prepared by Fraport solely for use in this presentation.
dbaccess Berlin Conference
 dbaccess Berlin Conference Dr. Matthias Zieschang / CFO Christoph Nanke / Head of Finance & IR June 6, 2018 / Berlin Disclaimer This document has been prepared by Fraport solely for use in this presentation.
Baader Investment Conference
 Baader Investment Conference Tanja Nagel / IR Florian Fuchs / IR September 2018 / Munich Disclaimer This document has been prepared by Fraport solely for use in this presentation. The information contained
9M Group Interim Report. January 1 to September 30, 2015
 9M Group Interim Report January 1 to September 30, 2015 Contents Group Interim Management Report 1 Group Interim Financial Statements 22 Overview of Business Development 2 Situation of the Group 3 Changes
Preliminary Full Year Results 2013
 Preliminary Full Year Results 2013 2 Preliminary Full Year Results 2013 Consolidated Income Statement million 2013 2012 adjusted Revenue 2,561.4 2,442.0 Change in work-in-process 0.6 0.5 Other internal
2016 FULL YEAR FINANCIAL RESULTS PRESENTATION TO INVESTORS & ANALYSTS
 2016 FULL YEAR FINANCIAL RESULTS PRESENTATION TO INVESTORS & ANALYSTS Stephan Widrig Chief Executive Officer Lukas Brosi Chief Financial Officer SCHEDULE 1. Business Update 2. Financial performance FY2016
2015 half year financial results Presentation to investors & analysts
 2015 half year financial results Presentation to investors & analysts Stephan Widrig Chief Executive Officer Daniel Schmucki Chief Financial Officer Zurich Airport 03/09/2015 Schedule 1. Major events HY2015
SMART STEEL. Q Results. Detlef Borghardt, CEO Dr. Matthias Heiden, CFO. November 8, 2018
 SMART STEEL Q3 218 Results Detlef Borghardt, CEO Dr. Matthias Heiden, CFO November 8, 218 Agenda Business Summary Preliminaries confirmed Market update Segments: Status and profitability trend in the regions
Air Berlin PLC 13 th August Analyst Call 2nd Quarter 2015
 Air Berlin PLC 13 th August 2015 Analyst Call 2nd Quarter 2015 DISCLAIMER This presentation has been prepared by Air Berlin PLC. No representation, warranty or undertaking, express or implied, is made
Group Interim Report. January 1 to March 31, 2013
 Group Interim Report January 1 to March 31, 2013 Group Interim Report January 1 to March 31, 2013 1 Business Development from January 1 to March 31, 2013 Adjustment of the previous year s figures Fraport
Fraport AG Frankfurt Airport Services Worldwide Consolidated Income Statement * million
 Consolidated Income Statement * 2007 2008 Change in % Revenue 2.329,0 2.101,6-9,8 Change in work-in-process 0,5 0,4-20,0 Other internal work capitalized 24,6 33,8 37,4 Other operating income 71,7 66,1-7,8
KION GROUP AG Q Update Call. Gordon Riske (CEO), Anke Groth (CFO) Frankfurt, 26 July 2018
, Anke Groth (CFO) Frankfurt, 26 July 2018") KION GROUP AG Q2 Update Call Gordon Riske (CEO), Anke Groth (CFO) Frankfurt, 26 July Agenda 1. Highlights 2. Market Update 3. Financial Update 4. Outlook 2 KION GROUP AG Q2 Update Call 26 July Q2 Strategic
KION GROUP AG Q2 Update Call Gordon Riske (CEO), Anke Groth (CFO) Frankfurt, 26 July Agenda 1. Highlights 2. Market Update 3. Financial Update 4. Outlook 2 KION GROUP AG Q2 Update Call 26 July Q2 Strategic
KION UPDATE CALL Q Gordon Riske, CEO Thomas Toepfer, CFO Wiesbaden, 7 May 2015
 KION UPDATE CALL 2015 Gordon Riske, CEO Thomas Toepfer, CFO Wiesbaden, 7 May 2015 AGENDA 1 Highlights Gordon Riske 2 Market update Gordon Riske 3 Financial update Thomas Toepfer 4 Outlook Gordon Riske
Analyst and Investor Conference Call Q2 2018
 Analyst and Investor Conference Call Q2 2018 Ulrik Svensson CFO and Member of the Executive Board Frankfurt, 31 July 2018 Disclaimer The information herein is based on publicly available information. It
SMART STEEL. Q Results. Detlef Borghardt, CEO Dr. Matthias Heiden, CFO. August 14, 2018
 SMART STEEL Q2 218 Results Detlef Borghardt, CEO Dr. Matthias Heiden, CFO August 14, 218 Agenda Business Summary Guidance adjustment FY 218 Market update Regional trends: Status and profitability trend
Agenda. 1. Highlights 9M 2013 Results. 2. Financials. 3. Conclusion
 1November 2013 Legal Disclaimer Information in this presentation may involve guidance, expectations, beliefs, plans, intentions or strategies regarding the future. These forward-looking statements involve
A G ood Good Y ear for lughafen Flughafen W i Wien: en: Results 2012
 A Good Year for Flughafen Wien: Results 2012 All major corporate targets met in 2012 investors confidence returns Increase in share price: 81% over lowest level in 2012 investors confidence returnsrns
Agenda. 1. Highlights FY 2012 Results. 2. Operational Performance Priorities for Financials. 5. Conclusion
 1MARCH 2013 Legal Disclaimer Information in this presentation may involve guidance, expectations, beliefs, plans, intentions or strategies regarding the future. These forward-looking statements involve
Results 4Q18. Feb. 28, GRU (SP) SDU (RJ) Fare: US$62
 SDU (RJ) Fare: US$62") Results 4Q18 Feb. 28, 2019 GRU (SP) SDU (RJ) Fare: US$62 4Q18 Highlights Indicators 4Q18 Var. x 4Q17 ASK (BN) 12.5 +2.4% Traffic (000) 8,944 +3.4% Net operating revenues: R$3.2 billion (+10.1% vs. 4Q17)
Results 4Q18 Feb. 28, 2019 GRU (SP) SDU (RJ) Fare: US$62 4Q18 Highlights Indicators 4Q18 Var. x 4Q17 ASK (BN) 12.5 +2.4% Traffic (000) 8,944 +3.4% Net operating revenues: R$3.2 billion (+10.1% vs. 4Q17)
Kuehne + Nagel International AG
 Kuehne + Nagel International AG Analyst Conference Call 1 st Half-Year 2011 Results July 18, 2011 (CET 14.00) Schindellegi, Switzerland Agenda Welcome & Highlights 1st Half Year 2011 Gerard van Kesteren
Amadeus FY 2014 Results
 Amadeus FY 2014 Results February 27, 2015 Disclaimer This presentation may contain certain statements which are not purely historical facts, including statements about anticipated or expected future revenue
TURKEY: RECENT DEVELOPMENTS January March 2018
 TURKEY: RECENT DEVELOPMENTS January March 218 3 81 4 698 961 7 34 7 96 9 66 8 98 1 931 1 6 11 2 11 88 11 19 1 883 1 97 12 48 12 112 Per capita GDP tripled while nominal GDP quadrupled in last 1 years 237
ICELANDAIR GROUP HF PRESENTATION OF Q RESULTS 31 JULY 2014
 ICELANDAIR GROUP HF PRESENTATION OF Q2 2014 RESULTS 31 JULY 2014 FINANCIAL RESULTS BOGI NILS BOGASON ǀ CFO INCOME STATEMENT Q2 USD thousand Q2 2014 Q2 2013 % Chg. Operating Income 297.8 265.6 12% Salaries
TURKEY: RECENT DEVELOPMENTS January June 2018
 TURKEY: RECENT DEVELOPMENTS January June 218 3 81 4 698 961 7 34 7 96 9 66 8 98 1 931 1 6 11 2 11 88 11 19 1 883 1 97 12 48 12 112 Per capita GDP tripled while nominal GDP quadrupled in last 1 years 237
Results 2Q18. August 2, 2018
 Results August 2, 2018 Highlights Indicators Var. x 2Q17 Operating Income (R$ MM) 42.8 +92.7% Operating Margin 1.8% +0.8 p.p. Net operating revenues: R$2.4 billion (+9.0% vs. 2Q17) ASK (BN) 10.7 +2.2%
ANNUAL GENERAL MEETING METRO AG. 15 February 2019
 ANNUAL GENERAL MEETING METRO AG 15 February 2019 DISCLAIMER AND NOTES To the extent that statements in this presentation do not relate to historical or current facts, they constitute forward-looking statements.
TURKEY: RECENT DEVELOPMENTS January September 2018
 TURKEY: RECENT DEVELOPMENTS January September 218 3 81 4 698 961 7 34 7 96 9 66 8 98 1 931 1 6 11 11 88 11 19 1 883 1 97 12 48 12 112 Per capita GDP tripled while nominal GDP quadrupled in last 1 years
Results 3Q18. November 1, 2018
 Results 3Q18 November 1, 2018 3Q18 Highlights Indicators 3Q18 Var. x 3Q17 ASK (BN) 12.5 +3.7% Traffic (000) 8.677 +4.5% Net operating revenues: R$2.9 billion (+8.3% vs. 3Q17) RPK (BN) 9.9 +2.2% Load Factor
Q1 2017/18 RESULTS PRESENTATION. 13 February 2018
 Q1 2017/18 RESULTS PRESENTATION 13 February 2018 DISCLAIMER AND NOTES To the extent that statements in this presentation do not relate to historical or current facts, they constitute forward-looking statements.
2015 BUSINESS RESULTS: GROWTH DESPITE HEADWINDS. Positive Outlook for 2016
 2015 BUSINESS RESULTS: GROWTH DESPITE HEADWINDS Positive Outlook for 2016 2015: Successful year in spite of headwinds from crisis areas Good business development of the company in 2015: Revenue increase
THIRD QUARTER RESULTS Investor presentation 25/10/2018
 THIRD QUARTER RESULTS 2018 Investor presentation 25/10/2018 Summary Achievements and Key Figures Operating and Financial Review Outlook and Priorities 2018 Appendix Q3 Results 2018 Panalpina 2 Achievements
Q Results. Strong start in May 3, 2016
 Q1 2016 Results Strong start in 2016 May 3, 2016 Legal Disclaimer Information in this presentation may involve guidance, expectations, beliefs, plans, intentions or strategies regarding the future. These
Board of Directors Zurich, 24 March, 2009 Dufry Presentation - Full Year 2009 Results
 Dufry Presentation - Full Year 2009 Results March 2010 1 Legal Disclaimer Information in this presentation may involve guidance, expectations, beliefs, plans, intentions or strategies regarding the future.
HAMBURGER HAFEN UND LOGISTIK AG
 HAMBURGER HAFEN UND LOGISTIK AG Analyst Conference Call on the Interim Results January to September 2017 Hamburg, 14 November 2017 Disclaimer The facts and information contained herein are as up to date
Air Berlin PLC 11 th November 2015 Analyst Conference 3rd Quarter 2015
 Air Berlin PLC 11 th November 2015 Analyst Conference 3rd Quarter 2015 DISCLAIMER This presentation has been prepared by Air Berlin PLC. No representation, warranty or undertaking, express or implied,
Amadeus H Results
 Amadeus H1 2014 Results August 1, 2014 Disclaimer This presentation may contain certain statements which are not purely historical facts, including statements about anticipated or expected future revenue
KION Q3 UPDATE CALL Gordon Riske, CEO Thomas Toepfer, CFO Wiesbaden, 14 November 2013
 KION Q3 UPDATE CALL 2013 Gordon Riske, CEO Thomas Toepfer, CFO Wiesbaden, 14 November 2013 AGENDA 1 Highlights 2013 Gordon Riske 2 Financial Update Thomas Toepfer 3 Outlook Gordon Riske 14 November 2013
Leading the Way Financial Results 2015
 17.05.2016 Leading the Way Financial Results 2015 Vienna, 17 May 2016 Conference Call DISCLAIMER You must read the following before continuing: This document has been prepared by C.A.T. oil AG ( C.A.T.
HAMBURGER HAFEN UND LOGISTIK AG
 HAMBURGER HAFEN UND LOGISTIK AG Analyst Conference Call on the Interim Results January to March 2017 Hamburg, 12 May 2017 Disclaimer The facts and information contained herein are as up to date as is reasonably
Fourth Quarter 2014 Earnings Conference Call. 26 November 2014
 Fourth Quarter 2014 Earnings Conference Call 26 November 2014 Safe Harbor Statement & Disclosures The earnings call and accompanying material include forward-looking comments and information concerning
Results 1Q18. May 9, 2018
 Results 1Q18 May 9, 2018 1Q18 Highlights Indicators 1Q18 Var. x1q17 Operating Income (R$ MM) 504.3 +97.4% Operating Margin 17.0% +7.1 p.p. Net operating revenues: R$3.0 billion (+14.4% vs. 1Q17) ASK (BN)
GOOD RESULTS IN 2016 STRONG BALANCE SHEET
 GOOD RESULTS IN 2016 STRONG BALANCE SHEET Net profit in 2016 USD 89.1 million, as compared to USD 111.2 million in 2015 Q4 EBITDA USD 2.5 million, as compared to USD 22.9 million in Q4 2015 A fall in average
Bilfinger SE Quarterly Statement Q2 2018
 Bilfinger SE Quarterly Statement Q2 2018 August 14, 2018 Q2 2018 Stabilization phase completed, market environment support growth path Orders received with growth in the fourth consecutive quarter Continued
2016 Amadeus IT Group SA Results. February 26, 2016
 2015 Results February 26, 2016 Disclaimer This presentation may contain certain statements which are not purely historical facts, including statements about anticipated or expected future revenue and earnings
Air Berlin PLC Berlin, 15 August 2012 Analysts and Investors conference call
 Air Berlin PLC Berlin, 15 August 2012 Analysts and Investors conference call 2012 is the transition year business transformation Transition cost incur in 2012 due to the initiatives taken 2011 Measures
Q Results. Organic growth accelerates further. May 2, 2017
 Q1 2017 Results Organic growth accelerates further May 2, 2017 Legal Disclaimer Information in this presentation may involve guidance, expectations, beliefs, plans, intentions or strategies regarding the
Q Results. Lars Brorsen (CEO) Christoph Hobo (CFO) November 22, 2018
 Christoph Hobo (CFO) November 22, 2018") Q3 2018 Results Lars Brorsen (CEO) Christoph Hobo (CFO) November 22, 2018 Agenda 1. Highlights Q3 2018 2. Market outlook 3. Detailed results review 4. Company outlook 5. Q&A Appendix 1 Business summary
Q3 2018 Results Lars Brorsen (CEO) Christoph Hobo (CFO) November 22, 2018 Agenda 1. Highlights Q3 2018 2. Market outlook 3. Detailed results review 4. Company outlook 5. Q&A Appendix 1 Business summary
Investor Presentation. 1 st Quarter 2017
 Investor Presentation 1 st Quarter 2017 1 1 Disclaimer This document has been prepared by Mobily (the Company ) solely for presentation purposes. The information contained in this document has not been
9M 2017 Results. Ongoing strong growth and acceleration of cash flow generation. October 31, 2017
 9M 2017 Results Ongoing strong growth and acceleration of cash flow generation October 31, 2017 Legal Disclaimer Information in this presentation may involve guidance, expectations, beliefs, plans, intentions
FLUGHAFEN WIEN AG. Results for Q1/2013
 FLUGHAFEN WIEN AG Results for Q1/2013 Highlights in Q1/2013 Traffic -1.7% in Q1/2013 due to severe winter, capacity reduction by the airlines and strikes in Germany Growth in revenue as a result of higher
HY 2017 Results. Strong growth and cash generation. July 31, 2017
 HY 2017 Results Strong growth and cash generation July 31, 2017 Legal Disclaimer Information in this presentation may involve guidance, expectations, beliefs, plans, intentions or strategies regarding
Investor Meeting Presentation
 September 2015 HUGO BOSS September 2015 2 Agenda Financial Review First Half Year 2015 Strategic Outlook 2015 and beyond Financial Outlook 2015 HUGO BOSS September 2015 3 Agenda Financial Review First
H Results MTU Aero Engines Conference Call with Investors and Analysts August 1, 2011
 H1 2011 Results MTU Aero Engines Conference Call with Investors and Analysts August 1, 2011 Agenda Business Highlights Financial Highlights Segment Reporting Group Key Figures Guidance Appendix 1 Aug 2011
2016 Financial and Operating Performance March 16, 2017
 2016 Financial and Operating Performance March 16, 2017 2016 Highlights Solid financial and operating results driven by traffic growth Net Revenue up 1.8% YoY to 865m 2016 underlying EBITDA (net of IPO
Preliminary FY 2012 Results MTU Aero Engines Conference Call with Investors and Analysts February 19, 2013
 Preliminary FY 2012 Results MTU Aero Engines Conference Call with Investors and Analysts February 19, 2013 Agenda Business Highlights Financial Highlights Segment Reporting Group Key Figures Guidance Appendix
Preliminary Full Year Results 2011 MTU Aero Engines Conference Call with Investors and Analysts February 23, 2012
 Preliminary Full Year Results 2011 MTU Aero Engines Conference Call with Investors and Analysts February 23, 2012 Agenda Business Highlights Financial Highlights Segment Reporting Group Key Figures Guidance
Amadeus Jan - June 2015 Results
 Amadeus Jan - June 2015 Results July 31, 2015 Disclaimer This presentation may contain certain statements which are not purely historical facts, including statements about anticipated or expected future
Agenda. 1. Highlights FY 2013 Results. 2. Financials. 3. Conclusion
 1 March 2014 Legal Disclaimer Information in this presentation may involve guidance, expectations, beliefs, plans, intentions or strategies regarding the future. These forward-looking statements involve
2018 Half Year Results
 A GLOBAL LEADER IN METAL FLOW ENGINEERING 2018 Half Year Results 26 July 2018 Patrick André Chief Executive 1 Disclaimer This presentation, which has been prepared by Vesuvius plc (the Company ), includes
FY 2016 Results March 2nd, 2017
 FY 2016 Results March 2nd, 2017 Definitions & assumptions In this presentation: ForEx stands for Foreign Exchange Rates; Organic stands for effect net of ForEx and hedging derivatives; Q4 stands for fourth
Nine Months Results January to September 2014
 Panalpina Group 21 October 2014 Nine Months Results January to September 2014 21 October 2014 2 Highlights and key figures Operating and financial review Outlook Appendix 21 October 2014 3 Highlights and
Results 3Q17. November 8, 2017 #NOVAGOL
 Results 3Q17 November 8, 2017 #NOVAGOL 3Q17 Highlights Indicators 3Q17 Var. x 3Q16 ASK (BN) 12.0 4.5% Traffic (000) 8,303 2.2% RPK (BN) 9.6 5.1% Load Factor 80.2% +0.4 p.p. Yield (R$ cents) 24.85 +8.6%
Looking back on a good year
 Looking back on a good year Profit at USD 111.2 million, up by USD 44.7 million, or 67% EBITDA in 2015 at USD 219.0 million, as compared to USD 154.3 million in 2014 Operating revenue increased by 2% between
Analysts and Investors Conference Nine-month results 2012 November 7, 2012 Peter Sassenfeld, CFO. Turning Vision into Value.
 Analysts and Investors Conference Nine-month results 2012 November 7, 2012 Peter Sassenfeld, CFO Essentials nine-month period 2012 Positive EBT contributions by all divisions Progress on loss making projects:
HAMBURGER HAFEN UND LOGISTIK AG INTERIM RESULTS JANUARY SEPTEMBER 2015
 HAMBURGER HAFEN UND LOGISTIK AG INTERIM RESULTS JANUARY SEPTEMBER 2015 Analyst Conference Call, 12 November 2015 Hamburger Hafen und Logistik AG Disclaimer The facts and information contained herein are
Interim Results 9-month figures FY 14
 HEIDELBERGER DRUCKMASCHINEN AG, FEBRUARY 5, 214 Interim Results 9-month figures 14 Gerold Linzbach, CEO Dirk Kaliebe, CFO Robin Karpp, Head of IR Interim Results 9-month figures 14 February 5th, 214 Improved