GODREJ CONSUMER PRODUCTS LIMITED 1Q FY2016 PERFORMANCE UPDATE
|
|
|
- Edith Freeman
- 5 years ago
- Views:
Transcription
1 GODREJ CONSUMER PRODUCTS LIMITED 1Q FY2016 PERFORMANCE UPDATE July 29, 2015
2 PERFORMANCE UPDATE EXECUTIVE SUMMARY : MAJOR HIGHLIGHTS BUSINESS OVERVIEW : INDIA BUSINESS OVERVIEW : INTERNATIONAL
3 OVERALL 1Q FY16 FINANCIAL PERFORMANCE 1Q FY2016 Growth Consolidated India International Net Sales 11% 12% 11% Net Sales Organic* 10% 12% 8% Net sales - Organic constant currency* 12% 12% 13% EBITDA 30% 23% 40% EBITDA Organic* 29% 23% 37% EBITDA Organic constant currency* 32% 23% 44% Net profit 39% 12% 176% Net profit w/o exceptionals & one-offs 53% 30% 126% * Excludes Africa s inorganic sales of INR 27.4 crores and EBITDA of INR 3 crores for 1QFY16 3 I GCPL I Performance Update 1Q FY16 I July 29, 2015
4 EXCEPTIONAL AND ONE OFF ITEMS QFY QFY Consolidated India International Consolidated India International Reported Exceptional (post tax) Add: Restructuring Cost in Argentina and Darling Nigeria Less: ESOP income in India One off other Income (post tax) Less: Land Sales in Indonesia Less: Plant Sales in Darling Nigeria Less: ESOP income in India Net Profit w/o exceptional and one off All values in INR crore 4 I GCPL I Performance Update 1Q FY16 I July 29, 2015
5 PERFORMANCE UPDATE EXECUTIVE SUMMARY : MAJOR HIGHLIGHTS BUSINESS OVERVIEW : INDIA BUSINESS OVERVIEW : INTERNATIONAL
6 STRONG VOLUME LED SALES AND PROFIT GROWTH IN INDIA Net Sales 12% 1, Branded business net sales growth of 13% driven by robust volume growth of 13% 1QFY15 1QFY16 EBITDA Net Profit* % 30% QFY15 1QFY16 1QFY15 1QFY16 6 I GCPL I Performance Update 1Q FY16 I July 29, 2015 All values in INR crore * Net profit w/o exceptionals and one offs
7 STRONG VOLUME LED AHEAD OF MARKET GROWTH India business Sales (INR crs) Growth y-y Household Insecticides % Soaps % Hair Colours % Other Brands 56 14% Total Branded Gross Sales (A) 1,122 14% Total Branded (Volume) - 13% Excise duty on Branded Sales 73 23% Total Branded Net Sales 1,049 13% Total Unbranded & Export Gross Sales (B) 47 (11%) Total Gross Sales (C = A+B) 1,169 13% Excise Duty (D) 75 22% Total Net Sales (E = C-D) 1,095 12% 7 I GCPL I Performance Update 1Q FY16 I July 29, 2015


8 HOUSEHOLD INSECTICIDES CONTINUES TO DELIVER STRONG GROWTH Strong double-digit volume driven sales growth of 15% aided by success of new launches and deepening penetration Innovation and superior execution drives consistent market share gains across formats with highest ever overall market share Lower crude oil prices aid expansion in gross margins 8 I GCPL I Performance Update 1Q FY16 I July 29, 2015

9 CONSISTENT DOUBLE-DIGIT GROWTH IN HAIR COLOURS Strong double-digit volume driven sales growth of 12% Godrej Expert Rich Crème continues to gain market share led by increasing penetration Launched Godrej Nupur Coconut Henna Crème to address demand from herbal based powder users and up trade existing hair colour users 9 I GCPL I Performance Update 1Q FY16 I July 29, 2015

10 An Oil based hair colour with Henna in a crème format Sources of business Herbal based powder users (~1/4 th of the market) where we currently have no play Non users who will be attracted by the naturals platform and convenience together Up trades from henna and non-herbal powders and crème users 10 I GCPL I Performance Update 1Q FY16 I July 29, 2015

11 SOAPS SUSTAINS HEALTHY MOMENTUM Strong double-digit volume growth and mix driven sales growth of 13% Cinthol s strategy of focusing on functional benefits in the premium segment supported by 360 degree activations delivering encouraging results Positive momentum continuing in Godrej No. 1 led by re-launch and new positioning as India s No.1 purest soap Lower palm oil prices continue to boost gross margins 11 I GCPL I Performance Update 1Q FY16 I July 29, 2015


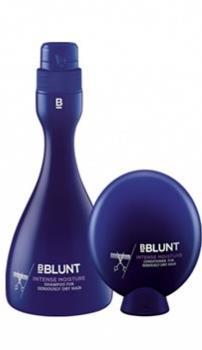
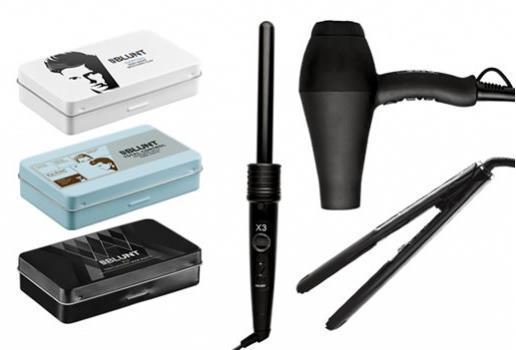

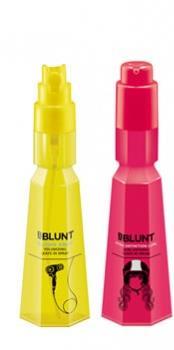

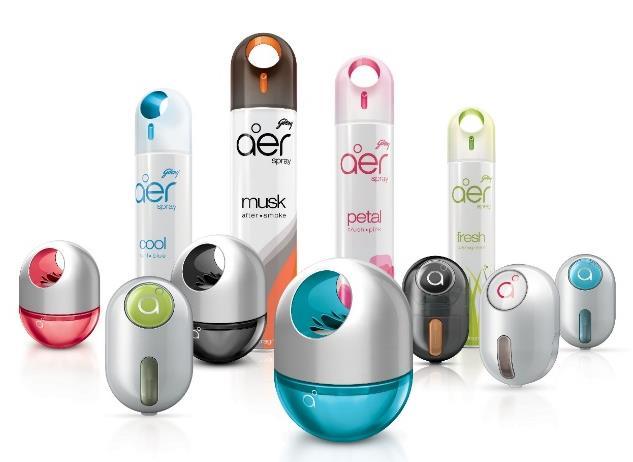
12 12 I GCPL I Performance Update 1Q FY16 I July 29, 2015 PREMIUMISING OUR PORTFOLIO


13 WE ARE THE HIGHEST RANKED INDIAN COMPANY IN FORBES THE WORLD S 100 MOST INNOVATIVE GROWTH COMPANIES 2015 Forbes s The World s 100 Most Innovative Growth Companies 2015 We ranked #24, with an innovation premium of 65% We were ranked #31 in 2014 In both years, we have been the highest ranked Indian company on the list 13 I GCPL I Performance Update 1Q FY16 I July 29, 2015
14 PERFORMANCE UPDATE EXECUTIVE SUMMARY : MAJOR HIGHLIGHTS BUSINESS OVERVIEW : INDIA BUSINESS OVERVIEW : INTERNATIONAL
15 CONSISTENT DOUBLE-DIGIT CONSTANT CURRENCY GROWTH 917 Organic Net Sales 8% 986 Organic EBITDA 37% QFY15 1QFY16 1QFY15 1QFY16 Strong organic constant currency sales growth of 13% driven by robust performance in Africa and Latin America Organic EBITDA margins of 13% expands 290bps y-y led by significant margin improvements in Indonesia and Latin America 15 I GCPL I Performance Update 1Q FY16 I July 29, 2015 All values in INR crore
16 AFRICA AND LATAM DELIVER ROBUST SALES GROWTH International business Sales (INR crs) Growth y-y Constant Currency Growth y-y Indonesia 353 1% 8% Indonesia (ex-foods) % Africa* % 32% Latin America % 29% Europe 155 (6%) (2%) Others** 35 31% 25% Total Net Sales 1,013 11% 16% * Includes inorganic sales of INR 27.4 crores for 1QFY16 ** Others include Sri Lanka, Bangladesh and Middle East 16 I GCPL I Performance Update 1Q FY16 I July 29, 2015
17 STRONG MARGIN GAINS ACROSS MOST BUSINESSES EBITDA Margin 21% 13% 9% 9% Indonesia* Africa Latin America Europe Y-Y change +560 bps (130) bps +570 bps +70 bps *Including foods business in the base quarter and before payment of technical & business support fees 17 I GCPL I Performance Update 1Q FY16 I July 29, 2015

18 INDONESIA OUTPERFORMING MARKET IN CHALLENGING OPERATING ENVIRONMENT Constant currency sales growth of 8% (ex-foods growth of 13%); well ahead of the FMCG industry growth in Indonesia FMCG industry growth was flat impacted by overall macro-economic slowdown in Indonesia Margin expands 560 bps y-y driven by lower crude oil prices and rationalisation of marketing and sales promotion investments Launched compact HIT aerosols 18 I GCPL I Performance Update 1Q FY16 I July 29, 2015

19 AFRICA GROWTH DRIVEN BY CONSISTENT AND STRONG PERFORMANCE IN DARLING Business presence in East, West and South African countries across different categories such as hair extensions, hair colours, household insecticides and personal wash EBITDA margins decline 130 bps y-y impacted by planned lag between price increases and increase in input costs, led by continuing currency depreciation This planned lag has helped deliver strong constant currency sales growth of 40% in Darling business 19 I GCPL I Performance Update 1Q FY16 I July 29, 2015
; expansion of 570 bps y-y led mainly by the implementation of Project Iceberg and price increases Hair colour market share in Argentina increases behind robust performance of Issue while")
20 SUSTAINED STRONG SALES AND PROFITABILITY GROWTH MOMENTUM IN LATAM Strong sales growth of 29% driven by success of new launches and superior on ground execution Margins improve to 9% (highest ever 1Q margins); expansion of 570 bps y-y led mainly by the implementation of Project Iceberg and price increases Hair colour market share in Argentina increases behind robust performance of Issue while market share in Chile increases aided by successful launch of Illicit Ammonia Free Hair Colour 20 I GCPL I Performance Update 1Q FY16 I July 29, 2015


21 WEAKNESS IN EUROPE BUSINESS Constant currency sales de-grew by 2%, due to the impact of adverse weather for most part of the quarter EBITDA margins improved 70 bps led by mix and rationalisation of spends Working on listing of our products in more modern trade outlets and new product launches / relaunches to accelerate our medium to long term growth 21 I GCPL I Performance Update 1Q FY16 I July 29, 2015
22 1Q FY2016 REPORTED PERFORMANCE SNAPSHOT India Consolidated 1Q FY15 1Q FY16 Y/Y 1Q FY15 1Q FY16 Y/Y Sales 977 1,095 12% 1,886 2,095 11% Gross Profit % 991 1,180 19% Gross Margin (%) 52.0% 58.4% 640 bps 52.6% 56.3% 380 bps EBITDA % % EBITDA Margin (%) 15.0% 16.5% 150 bps 12.8% 15.0% 220 bps Net Profit % % Net Profit Margin (%) 12.4% 12.4% - 7.6% 9.5% 190 bps 22 I GCPL I Performance Update 1Q FY16 I July 29, 2015 All values in INR crore


23 WE HAVE BEEN CONSISTENTLY RECOGNISED AS A GREAT PLACE TO WORK Recognised among the top 25 workplaces in Asia #1 in FMCG #6 overall 12 th year in a row on the list Ranked among the best employers in India in I GCPL I Performance Update 1Q FY16 I July 29, 2015


24 STOCKHOLDING PATTERN DII, 2% Others, 6% FII, 29% Promoter, 63% MAJOR INVESTORS Aberdeen Others First State Temasek GIC Vanguard Blackrock ADIA LIC Arisaig 24 I GCPL I Performance Update 1Q FY16 I July 29, 2015 As on June 30, 2015
25 WE REMAIN LASER FOCUSED ON EXECUTING OUR KEY PRIORITIES Extending leadership in our core categories Capitalising on international growth potential Accelerating innovation and renovation Building a future ready sales system Making our supply chain best in class Building an agile and high performance culture Re-enforcing our commitment to Godrej Good & Green 25 I GCPL I Performance Update 1Q FY16 I July 29, 2015
26 CONTACT US V SRINIVASAN v.srinivasan@godrejcp.com Tel: SAMEER SHAH sa.shah@godrejcp.com Tel: TAPAN JOSHI tapan.joshi@godrejcp.com Tel: for more details please visit 26 I GCPL I Performance Update 1Q FY16 I July 29, 2015
27 DISCLAIMER Some of the statements in this communication may be forward looking statements within the meaning of applicable laws and regulations. Actual results might differ substantially from those expressed or implied. Important developments that could affect the Company s operations include changes in the industry structure, significant changes in political and economic environment in India and overseas, tax laws, import duties, litigation and labour relations. 27 I GCPL I Performance Update 1Q FY16 I July 29, 2015
28 THANK YOU FOR YOUR TIME AND CONSIDERATION
Performance Update - 2Q FY16 October 24, 2015
 Performance Update - 2Q FY16 October 24, 2015 PERFORMANCE UPDATE 1 Executive Summary - Key Highlights 2 Business Overview - India 3 Business Overview - International 2 I GCPL I Performance Update 2Q FY16
Performance Update - 4Q FY16 May 3, 2016
 Performance Update - 4Q FY16 May 3, 2016 PERFORMANCE UPDATE 1 Executive Summary - Key Highlights 2 Business Overview - India 3 Business Overview - International 2 I GCPL I Performance Update 4Q FY16 I
Performance Update - 4Q FY18 May 8, 2018
 Performance Update - 4Q FY18 May 8, 2018 PERFORMANCE UPDATE 1 Executive Summary - Key Highlights 2 Business Overview - India 3 Business Overview - International 2 I GCPL I Performance Update 4Q FY18 I
Performance Update - 3Q FY18 January 30, 2018
 Performance Update - 3Q FY18 January 30, 2018 PERFORMANCE UPDATE 1 Executive Summary - Key Highlights 2 Business Overview - India 3 Business Overview - International 2 I GCPL I Performance Update 3Q FY18
Business snapshot. ~50% of revenues comes from international businesses. Leading market share in home care, hair care and personal care
 February 3, 2016 Business snapshot Emerging markets FMCG leader Excellent track record of value creation among FMCG companies in India Growing presence in Asia, Africa and Latin America $ Leading market
Business snapshot. ~50% of revenues comes from international businesses. Leading market share in home care, hair care and personal care
 May 24, 2016 Business snapshot Emerging markets FMCG leader Excellent track record of value creation among FMCG companies in India Growing presence in Asia, Africa and Latin America $ Leading market share
PRESS RELEASE. Mumbai, January 27, 2016: Godrej Consumer Products Limited (GCPL), a leading
, a leading") PRESS RELEASE 3Q FY 2016 results GCPL delivers a net profit growth of 23% on an organic constant currency net sales growth of 9%. Mumbai, January 27, 2016: Godrej Consumer Products Limited (GCPL), a leading
PRESS RELEASE 3Q FY 2016 results GCPL delivers a net profit growth of 23% on an organic constant currency net sales growth of 9%. Mumbai, January 27, 2016: Godrej Consumer Products Limited (GCPL), a leading
GODREJ CONSUMER PRODUCTS INVESTOR PRESENTATION
 1 GODREJ CONSUMER PRODUCTS INVESTOR PRESENTATION GODREJ CONSUMER PRODUCTS SNAPSHOT strong positions in core categories largest home grown HPC company US $1.3 billion in sales in FY 14 home care hair care
PRESS RELEASE. Mumbai, May 3, 2016: Godrej Consumer Products Limited (GCPL), a leading emerging
, a leading emerging") PRESS RELEASE 4Q FY 2016 results GCPL delivers a net profit growth of 17% on an organic constant currency net sales growth of 12%. Mumbai, May 3, 2016: Godrej Consumer Products Limited (GCPL), a leading
PRESS RELEASE 4Q FY 2016 results GCPL delivers a net profit growth of 17% on an organic constant currency net sales growth of 12%. Mumbai, May 3, 2016: Godrej Consumer Products Limited (GCPL), a leading
Business snapshot. 48% of revenue comes from international businesses. Leading market share in home care, hair care and personal care
 May 26, 2017 Business snapshot Emerging markets FMCG leader Excellent track record of value creation among FMCG companies in India Growing presence in Asia, Africa and Latin America Leading market share
PRESS RELEASE. de-stocking; consolidated net profit without exceptional items is INR 230 crore
 PRESS RELEASE 1Q FY2018 results India business delivers 6% sales growth despite GST driven de-stocking; consolidated net profit without exceptional items is INR 230 crore Mumbai, July 31, 2017: Godrej
PRESS RELEASE. Mumbai, January 30, 2017: Godrej Consumer Products Limited (GCPL), a leading
, a leading") PRESS RELEASE 3Q FY2017 results GCPL delivers sales growth of 8% and EBITDA growth of 14% Mumbai, January 30, 2017: Godrej Consumer Products Limited (GCPL), a leading emerging markets FMCG company, today
PRESS RELEASE 3Q FY2017 results GCPL delivers sales growth of 8% and EBITDA growth of 14% Mumbai, January 30, 2017: Godrej Consumer Products Limited (GCPL), a leading emerging markets FMCG company, today
GODREJ CONSUMER PRODUCTS INVESTOR PRESENTATION JUNE 2013
 GODREJ CONSUMER PRODUCTS INVESTOR PRESENTATION JUNE 2013 GODREJ CONSUMER PRODUCTS SNAPSHOT strong positions in core categories largest home grown HPC company US $1.2 billion in sales in FY 13 home care
GODREJ INDUSTRIES LIMITED Performance Update Q2& H1 FY I Godrej Industries Limited I Q2 & H1 FY Performance Update Nov 14,2017
 GODREJ INDUSTRIES LIMITED Performance Update Q2& H1 FY 2017-18 1 I Godrej Industries Limited I Q2 & H1 FY 2017-18 Performance Update Nov 14,2017 NOVEMBER 14, 2017 DISCLAIMER Some of the statements in this
Godrej Consumer Products Limited Transition to Ind AS
 July 13, 2016 Godrej Consumer Products Limited Transition to Ind AS 1 I GCPL I Transition to Ind AS I July 13, 2016 Indian Accounting Standards (Ind AS) implementation timeline Date of transition Ind AS
Godrej Consumer Products
 3QFY11 Results Update SECTOR: FMCG BSE SENSEX S&P CNX 19,151 5,743 Rs400 Godrej Consumer Products Neutral Bloomberg GCPL IN Equity Shares (m) 323.6 52-Week Range (Rs) 480/225 1,6,12 Rel. Perf. (%) 7/6/46
GODREJ CONSUMER PRODUCTS LTD
 GODREJ CONSUMER PRODUCTS LIMITED Result Update (CONSOLIDATED BASIS): Q1 FY15 ISIN: INE102D01028 AUGUST 9 th, 2014 STOCK DETAILS Sector FMCG BSE Code 532424 Face Value 1.00 52wk. High / Low (Rs.) 969.70/672.00
Godrej Consumer Products Ltd. Rating: Accumulate FMCG. Godrej Consumer Products Ltd STOCK IDEA
 Godrej Consumer Products Ltd. FMCG STOCK IDEA Rating: Accumulate Date August 16, 2013 CMP (Rs.) 892 Target (Rs.) 965 Potential Upside 8% BSE Sensex 19368 NSE Nifty 5742 Scrip Code Bloomberg IN Reuters
Godrej Consumer Products Ltd.
 RESULT UPDATE 1st August, 2017 Aug-16 Oct-16 Dec-16 Feb-17 Apr-17 Jun-17 Aug-17 India Equity Institutional Research II Result Update Q1FY18 II 1st August, 2017 CMP INR 1,035 Target INR 1,120 Potential
Godrej Consumer Products
 BSE SENSEX S&P CNX 17,602 5,337 Bloomberg GCPL IN Equity Shares (m) 340.3 52-Week Range (INR) 658/370 1,6,12 Rel. Perf. (%) 5/37/42 M.Cap. (INR b) 205.9 M.Cap. (USD b) 3.7 7 August 2012 1QFY13 Results
Godrej Consumer Products
 BSE SENSEX S&P CNX 18,755 5,698 Bloomberg GCPL IN Equity Shares (m) 340.3 52-Week Range (INR) 745/370 1,6,12 Rel. Perf. (%) 4/17/67 M.Cap. (INR b) 246.4 M.Cap. (USD b) 4.6 5 November 2012 2QFY13 Results
Godrej Consumer Products
 BSE SENSEX S&P CNX 16,739 5,049 Bloomberg GCPL IN Equity Shares (m) 323.6 52-Week Range (INR) 464/325 1,6,12 Rel. Perf. (%) 3/3/16 M.Cap. (INR b) 135.6 M.Cap. (USD b) 2.7 24 January 2012 3QFY12 Results
GODREJ CONSUMER PRODUCTS LTD
 GODREJ CONSUMER PRODUCTS LIMITED Result Update: Q4 FY14 ISIN: INE102D01028 APRIL 28 th, 2014 STOCK DETAILS Sector FMCG BSE Code 532424 Face Value 1.00 52wk. High / Low (Rs.) 977.40/672.00 Volume (2wk.
Unilever - CAGE Conference. Paul Polman CEO Roger Seabrook VP Investor Relations London - 19 th March 2012
 Unilever - CAGE Conference Paul Polman CEO Roger Seabrook VP Investor Relations London - 19 th March 2012 Contents 1 2011 key takeaways 2 Our progress over the last 3 years 3 Your questions addressed 2011
Hindustan Unilever Limited. SQ 18 Results Presentation : 12 th October 2018
 Hindustan Unilever Limited SQ 18 Results Presentation : 12 th October 2018 Safe Harbor Statement This Release / Communication, except for the historical information, may contain statements, including the
GODREJ CONSUMER PRODUCTS LTD. (Home Consumer Product)
") GODREJ CONSUMER PRODUCTS LTD. (Home Consumer Product) Adi Godrej ( Chairman ) A. Mahendran (M.D.) Group / S&P CNX 500/ Scrip ID GODREJCP Index BSE500 BSE code 532424 Industry Consumer Product Face Value
GODREJ CONSUMER PRODUCTS LTD. (Home Consumer Product) Adi Godrej ( Chairman ) A. Mahendran (M.D.) Group / S&P CNX 500/ Scrip ID GODREJCP Index BSE500 BSE code 532424 Industry Consumer Product Face Value
Company Research. Asian Paints Ltd Domestic paints volumes disappoint. Investment Overview: Date:
 Asian Paints Ltd Domestic paints volumes disappoint Date: 30.8.2012 Investment Overview: Asian Paints is India s largest paint company & Asia s third largest paint company, with a turnover of Rs 96322.40
RESULTS FOR THE QUARTER ENDING 30 st JUNE % COMPARABLE* DOMESTIC CONSUMER GROWTH, 12% UNDERLYING VOLUME GROWTH
 RESULTS FOR THE QUARTER ENDING 30 st JUNE 2018 16% COMPARABLE* DOMESTIC CONSUMER GROWTH, 12% UNDERLYING VOLUME GROWTH Mumbai, July 16 th, 2018: Hindustan Unilever Limited announced its results for the
Unilever Investor Event 2018 Graeme Pitkethly 4 th December 2018
 Unilever Investor Event 2018 Graeme Pitkethly 4 th December 2018 SAFE HARBOUR STATEMENT This announcement may contain forward-looking statements, including forward-looking statements within the meaning
BUY. BAJAJ CORP LIMITED Result Update: Q1 FY14. CMP (Rs) Target Price (Rs) AUGUST 10 th, 2013 HIGHLIGHTS
 Target Price (Rs) AUGUST 10 th, 2013 HIGHLIGHTS") BUY CMP (Rs) 243.00 Target Price (Rs) 268.00 BAJAJ CORP LIMITED Result Update: Q1 FY14 AUGUST 10 th, 2013 ISIN: INE933K01021 Stock Data Sector FMCG BSE Code 533229 Face Value 1.00 52wk. High / Low (Rs.)
BUY CMP (Rs) 243.00 Target Price (Rs) 268.00 BAJAJ CORP LIMITED Result Update: Q1 FY14 AUGUST 10 th, 2013 ISIN: INE933K01021 Stock Data Sector FMCG BSE Code 533229 Face Value 1.00 52wk. High / Low (Rs.)
Hindustan Unilever. Q1FY19 Result Update Maintaining strong volume trajectory on high base is the key. Sector: FMCG CMP: ` 1,644. Recommendation: HOLD
 Hindustan Unilever Q1FY19 Result Update Maintaining strong volume trajectory on high base is the key Sector: FMCG CMP: ` 1, Recommendation: HOLD Market Statistics Current stock price (`) 1, Shares O/S
S H Kelkar and Company Limited
 Crafting Sensorial Delight S H Kelkar and Company Limited Largest Indian-origin Fragrance & Flavour Company Q1 FY18 Earnings Presentation August 10, 2017 Disclaimer Certain statements and opinions with
Hindustan Unilever. Q4FY18 Result Update Strong volume growth on weak base and uptick in rural. Sector: FMCG CMP: ` 1,516. Recommendation: HOLD
 Hindustan Unilever QFY18 Result Update Strong volume growth on weak base and uptick in rural Sector: FMCG CMP: ` 1,1 Recommendation: HOLD Market Statistics Current stock price (`) 1,1 Shares O/S (cr.)
Safe Harbor Statement
 Hindustan Unilever Limited DQ 17 Results Presentation : 17 th January 2018 1 Safe Harbor Statement This Release / Communication, except for the historical information, may contain statements, including
2016 THIRD-QUARTER EARNINGS REVIEW October 25, 2016
 2016 THIRD-QUARTER EARNINGS REVIEW October 25, 2016 0 THIRD-QUARTER EARNINGS PRESENTATION WHIRLPOOL CORPORATION ADDITIONAL INFORMATION This presentation contains forward-looking statements about Whirlpool
Third-quarter 2018 results November 9, 2018
 ` Third-quarter 018 results November 9, 018 ` 1 Disclaimer This presentation may contain forward-looking statements. Such statements are not statements of historical fact, and reflect the beliefs and expectations
National Stock Exchange of India Limited. Ref.: GODREJAGRO
 Date: May 14, 2018 To, BSE Limited P. J. Towers, Dalal Street, Fort Mumbai 400 001 To, National Stock Exchange of India Limited Exchange Plaza, Bandra - Kurla Complex, Bandra (East), Mumbai-400 051 Ref.:
Presentation at Citigroup Smith Barney India Corporate Day. London, June 2003
 Presentation at Citigroup Smith Barney India Corporate Day London, June 2003 HINDUSTAN LEVER LIMITED Contents Economy Overview Strategy FY 2002 MQ 2003 2003 & Beyond.. HINDUSTAN LEVER LIMITED Contents
Godrej Consumer Products Ltd
 Consumer Staples-Household Products Bloomberg Code: GCPL IN India Research - Stock Broking Business of Household Brands for Brighter Living Market leader in Household Insecticide (HI) business to be benefited
Year End Results. PZ Cussons Plc 31 May 2018
 Year End Results PZ Cussons Plc 31 May 2018 Group Highlights Revenue Profits Initiatives Net debt Dividend Reported revenue 5.8% lower than prior year and 2.3% lower on a constant currency basis. Adjusted
VADILAL INDUSTRIES Q2 & H1FY16 Results Presentation
 VADILAL INDUSTRIES Q2 & H1FY16 Results Presentation Disclaimer 2 Certain statements in this document may be forward-looking statements. Such forward-looking statements are subject to certain risks and
2010 Full Year Results Conference Call. James Singh Chief Financial Officer
 2010 Full Year Results Conference Call James Singh Chief Financial Officer Disclaimer This presentation contains forward looking statements which reflect Management s current views and estimates. The forward
Result Presentation. Quarter ended September 30, 2018
 Result Presentation Quarter ended September 30, 2018 Disclaimer The particulars of this presentation contain statements related but not limited to revenues, financial results and supplemental financial
Phillips Carbon Black Limited
 Phillips Carbon Black Limited We Touch Lives Every Moment Investor Presentation October - 217 1 Part of a Dynamic Conglomerate. A Leader in the Industry Company Overview Largest in India and 7 th largest
FINANCIAL RESULTS Q1 FY17 July 26, 2016
 FINANCIAL RESULTS Q1 FY17 July 26, 2016 Environment 2 Global geo-political and economic uncertainty continues. Britain s surprise vote to leave the European Union weighs on consumer confidence and investor
Press Release. Consolidated Financial & Performance Highlights (Pharma & Biotech)
") Press Release Strides Shasun announces Q1 FY17 results Q1 FY17 Pharma Revenues* at INR 8,699 Mn, Growth of 43% YoY, Pharma EBITDA at INR 1,451 Mn, Growth of 57% YoY Bengaluru, August 17, 2016: Strides
Press Release Strides Shasun announces Q1 FY17 results Q1 FY17 Pharma Revenues* at INR 8,699 Mn, Growth of 43% YoY, Pharma EBITDA at INR 1,451 Mn, Growth of 57% YoY Bengaluru, August 17, 2016: Strides
Religare Investment Call
 v-17 Dec-17 Jan-18 Feb-18 Mar-18 Apr-18 May-18 Jun-18 Jul-18 Aug-18 Sep-18 Oct-18 v-18 Q2FY19 Result Update Q2FY19 Result Update BUY CMP (Rs) 5,813 Target Price (Rs) 6,519 Potential Upside 12.1% Sensex
Cravatex Limited. Stock Performance Details Shareholding Details September 2015
 Cravatex Limited Date: 20 th January, 2016 Stock Performance Details Shareholding Details September 2015 Current Price : ` 247.8^ Face Value : ` 10 per share 52 wk High / Low : ` 550.0 / 215.0 Total Traded
Company Research. Result Highlights: EBITDA margin improve substantially by 120bps y-o-y: Date:
 Asian Paints Ltd posted strong revenue growth due to festive season. Date: 23.01.2013 Result Highlights: Top-line grows by 18.61% yoy: Asian paints recorded sales of Rs.30371.40 mn against corresponding
FINANCIAL RESULTS. Q1 FY18 July 28, 2017
 FINANCIAL RESULTS Q1 FY18 July 28, 2017 2 Environment Global GDP growth expected to improve to 3.5% in 2017 vs 3.1% in 2016. However risks remain due to monetary policy normalization, geopolitical uncertainty
Axiata Group Berhad. 3Q 2018 Results. 23 November Tan Sri Jamaludin Ibrahim, President & Group CEO. Vivek Sood, Group CFO 3Q18
 Axiata Group Berhad 3Q 2018 Results 23 November 2018 Tan Sri Jamaludin Ibrahim, President & Group CEO Vivek Sood, Group CFO Disclaimer The following presentation contain statements about future events
GODREJ INDUSTRIES LIMITED
 GODREJ INDUSTRIES LIMITED Investor and Analyst Meet FY 2012-13 JUNE 2013 1 I Godrej Industries Limited I Investor and Analyst Meet June-2013 DISCLAIMER This presentation does not constitute or form part
September Quarter 2015 Results Presentation October 14, 2015
 September Quarter 2015 Results Presentation October 14, 2015 1 Safe Harbor Statement This Release / Communication, except for the historical information, may contain statements, including the words or
CA Cheuvreux Autumn Conference. Mr Jean Paul AGON Chief Executive Officer. September 30 th, September 30th,
 CA Cheuvreux Autumn Conference September 30 th, 2010 Mr Jean Paul AGON Chief Executive Officer September 30th, 2010 1 A few figures 1 st cosmetics group worldwide 23 international brands 17.5 billion euros
Half-year 2012 Results. August 1, 2012
 Half-year 2012 Results August 1, 2012 Disclaimer All forward-looking statements are Schneider Electric management s present expectations of future events and are subject to a number of factors and uncertainties
HUL. Q4FY17 Result Update Healthy performance, rich valuations. Sector: FMCG CMP: ` Recommendation: Hold
 HUL QFY17 Result Update Healthy performance, rich valuations Sector: FMCG CMP: ` 1009 Recommendation: Hold Market Statistics Current stock price (`) 1,009 Shares O/S (cr.) 21. Mcap (`cr) 218,9 52W H/L
August A Research Report On. By Islami Tijara Research Team. Copyright Reserved
 A Research Report On By Islami Tijara Research Team Hindustan Unilever Limited Hindustan Unilever Limited (HUL) is India's largest Fast Moving Consumer Goods Company; the company was first incorporated
Investor Presentation February 2016
 Dabur India Ltd Investor Presentation February 2016 FMCG Overview Fourth largest sector in the economy Current size of the Indian FMCG Market is around USD 45 bn Grown at an annual average of 11 per cent
Dabur India. CMP: INR130 TP: INR135 Neutral
 BSE SENSEX S&P CNX 18,625 5,664 29 October 2012 2QFY13 Results Update Sector: Consumer Dabur India CMP: INR130 TP: INR135 Neutral Bloomberg DABUR IN Equity Shares (m) 1,740.7 52-Week Range (Rs) 139/92
TransUnion Fourth Quarter 2018 Earnings. Jim Peck, President and CEO Todd Cello, CFO Chris Cartwright, President, USIS
 v v v TransUnion Fourth Quarter 2018 Earnings Jim Peck, President and CEO Todd Cello, CFO Chris Cartwright, President, USIS Forward-Looking Statement This presentation contains forward-looking statements
Axiata Group Berhad. 2Q 2018 Results. 24 August Tan Sri Jamaludin Ibrahim, President & Group CEO Vivek Sood, Group CFO
 Axiata Group Berhad 2Q 2018 Results 24 August 2018 Tan Sri Jamaludin Ibrahim, President & Group CEO Vivek Sood, Group CFO Introduction One of the most eventful quarters Idea at final stages of regulatory
Results SQ 10. October 26, Investor Presentation
 Results SQ 10 October 26, 2010 Investor Presentation Safe Harbour Statement This Release / Communication, except for the historical information, may contain statements, including the words or phrases such
Bajaj Auto Ltd. BUY. August 23, Investor s Rationale. Key Risk:
 Aug-12 Sep-12 Oct-12 Nov-12 Dec-12 Jan-13 Feb-13 Mar-13 Apr-13 May-13 Jun-13 Jul-13 Aug-13 Bajaj Auto Ltd. August 23, 2013 BSE Code: 532977 NSE Code: BAJAJ-AUTO Reuters Code: BAJA.NS Bloomberg Code: BJAUT
RESULTS FOR THE YEAR ENDED 31 MARCH Copyright Tate & Lyle PLC 2017
 RESULTS FOR THE YEAR ENDED 31 MARCH 2017 Copyright Tate & Lyle PLC 2017 Cautionary Statement This presentation for the Full Year Results for the year ended 31 March 2017 contains certain forward-looking
Phillips Carbon Black Limited January 2016
 Phillips Carbon Black Limited www.pcblltd.com January 2016 1 The Group Companies RP- Sanjiv Goenka Group Power & Natural Resources Carbon Black Retail Media & Entertainment Infrastructur e IT & Education
FINANCIAL RESULTS Q1 FY 19. July 26, 2018
 FINANCIAL RESULTS Q1 FY 19 July 26, 2018 2 Environment Global GDP growth outlook remains strong at 3.9 percent in both 2018 and 2019, but expansion is becoming less even. Near term momentum has picked
Q1 FY2018 Earnings Presentation. July 27, 2017
 Q1 FY2018 Earnings Presentation July 27, Cautionary statement Forward Looking Statements This presentation contains statements that contain forward looking statements including, but without limitation,
Financial Results Presentation
 Financial Results Presentation Q4 FY16: Quarter ended 31 March 2016 12 May 2016 Chua Sock Koong, Group CEO Forward looking statement important note The following presentation contains forward looking statements
Greenply Industries Ltd. Results Presentation Q1 FY16
 Greenply Industries Ltd Results Presentation Q1 FY16 Disclaimer Certain statements in this communication may be forward looking statements within the meaning of applicable laws and regulations. These forward-looking
BAJAJ AUTO LIMITED (BAL)
") COMPANY UPDATE Arun Agarwal arun.agarwal@kotak.com +91 22 6621 6143 BAJAJ AUTO LIMITED (BAL) PRICE: RS.1921 RECOMMENDATION: BUY TARGET PRICE: RS.2239 FY15E P/E: 13.7X BAL's performance in the domestic
COMPANY UPDATE Arun Agarwal arun.agarwal@kotak.com +91 22 6621 6143 BAJAJ AUTO LIMITED (BAL) PRICE: RS.1921 RECOMMENDATION: BUY TARGET PRICE: RS.2239 FY15E P/E: 13.7X BAL's performance in the domestic
Phillips Carbon Black Limited
 Phillips Carbon Black Limited We Touch Lives Every Moment Investor Presentation February- 218 1 Part of a Dynamic Conglomerate. Carbon Black Industry Global Overview What is Carbon Black? Global CB demand
Pidilite Industries. CMP: INR164 TP: INR186 Buy
 BSE SENSEX S&P CNX 16,640 5,043 Bloomberg PIDI IN Equity Shares (m) 506.1 52-Week Range (INR) 188/134 1,6,12 Rel. Perf. (%) 1/20/5 M.Cap. (INR b) 83.0 M.Cap. (USD b) 1.5 27 July 2012 1QFY13 Results Update
Group sales, profitability and financial position
 First half of : Nestlé delivers 3.5% organic growth combined with a 30 bps EBIT margin improvement Vevey, Switzerland, August 12, CHF Millions Reported Change vs. Reported Sales Group 52 267 +3.5% -1.5%
OPERATING AND FINANCIAL REVIEW MANAGEMENT DISCUSSION AND ANALYSIS GROUP REVIEW. Operating revenue 18,825 18,
 GROUP REVIEW GROUP (S$ million) (S$ million) Change (%) Operating revenue 18,825 18,071 4.2 EBITDA 5,219 5,119 1.9 EBITDA margin 27.7% 28.3% Share of associates pre-tax profits 2,005 2,141-6.4 EBITDA and
RESULTS FOR SEPTEMBER QUARTER % DOMESTIC CONSUMER SALES GROWTH, OPERATING PROFIT (PBIT) UP 11% IN SEPTEMBER QUARTER 2013
 UP 11% IN SEPTEMBER QUARTER 2013") RESULTS FOR SEPTEMBER QUARTER 2013 10% DOMESTIC CONSUMER SALES GROWTH, OPERATING PROFIT (PBIT) UP 11% IN SEPTEMBER QUARTER 2013 Mumbai, October 26 th, 2013: Hindustan Unilever Limited announced its results
RESULTS FOR SEPTEMBER QUARTER 2013 10% DOMESTIC CONSUMER SALES GROWTH, OPERATING PROFIT (PBIT) UP 11% IN SEPTEMBER QUARTER 2013 Mumbai, October 26 th, 2013: Hindustan Unilever Limited announced its results
SQ 02 Results - Snapshot
 SQ 02 Results - Snapshot HPC Power Brands up by 6.8%, driving HPC growth of 4.9% Foods decline by 15.7% leading to flat FMCG sales Operating Profits (PBIT) up 16.6%, Margin Expansion by 390 bps Declining
HDFC Bank Ltd. BUY. Investment Rationale. July 2, Volume No.. 1 Issue No. 28
 Jun-14 Jul-14 Aug-14 Sep-14 Oct-14 Nov-14 Dec-14 Jan-15 Feb-15 Mar-15 Apr-15 May-15 Jun-15. Volume No.. 1 Issue No. 28 HDFC Bank Ltd. July 2, 2015 BSE Code: 500180 NSE Code: HDFCBANK Reuters Code: HDBK.BO
SOLID START. FULL YEAR TARGETS REITERATED
 20 April 2018 SOLID START. FULL YEAR TARGETS REITERATED Trading Update Q1 2018 m Proforma** Like-for-like* Reported IFCN Rest of Health Total Health 700 1,216 1,916 +6% +1% +3% +1% +1% -5% +49% Hygiene
TCS Financial Results
 TCS Financial Results Quarter IV & Year Ended FY 2015-16 April 18, 2016 1 Copyright 2014 Tata Consultancy Services Limited Disclaimer Certain statements in this release concerning our future prospects
DQ 14 Results Presentation January 19, 2015
 DQ 14 Results Presentation January 19, 2015 1 Safe Harbor Statement This Release / Communication, except for the historical information, may contain statements, including the words or phrases such as expects,
DABUR INDIA LIMITED RESEARCH
 RESULTS REVIEW Dabur India Limited Hold Share Data Market Cap Rs. 79.5 bn Price Rs. 91.95 BSE Sensex 14,577.87 Reuters Bloomberg Avg. Volume (52 Week) DABU.BO DABUR IN 0.3mn 52-Week High/Low Rs. 134 /
Q2FY18 Performance Review 25 th October 2017
 Q2FY18 Performance Review 25 th October 2017 Q2FY18 Snapshot Consolidated Revenues (including GST/VAT) grew by 14% during the quarter with volumes growing by 10%. Q2FY18 Business Wise Sales Split Reported
Datatec Group Audited results for the year ended 29 February 2008
 Datatec Group Audited results for the year ended 29 February 2008 1 Datatec Group Highlights Revenue up 27% (12.2% organic) to over $4.0 billion Improved geographic spread of business helps to mitigate
Oriflame Holding AG FOURTH QUARTER 2018 INVESTOR PRESENTATION
 FEBRUARY 14, 9.3 CET Oriflame Holding AG FOURTH QUARTER 218 INVESTOR PRESENTATION Magnus Brännström, CEO Gabriel Bennet, CFO Nathalie Redmo, Sr. Manager IR Important clarifying information IFRS Oriflame
KRBL LIMITED. Investor Communication
 KRBL LIMITED Investor Communication Quarter and Year ended 31 st March 2018 CONTENTS 1. Q4 & FY18 Consolidated Financial Overview 2. Business Overview 3. Category Highlights 4. Marketing Initiatives 5.
Interim Results. Half year to 30 November 2012
 Interim Results Half year to 30 November 2012 Introduction Richard Harvey Chairman 2 Highlights Operating profit growth of 13% driven by Australia improvement and robust UK performance, and despite challenges
MQ 2015 & FY Results Presentation May 8, 2015
 MQ 2015 & FY 2014-15 Results Presentation May 8, 2015 1 Safe Harbor Statement This Release / Communication, except for the historical information, may contain statements, including the words or phrases
Colgate-Palmolive. Q3FY17 Result Update Steep decline in Sales; EBITDA margin contraction continues. Sector: FMCG CMP: ` 879. Recommendation: HOLD
 Colgate-Palmolive Q3FY17 Result Update Steep decline in Sales; EBITDA margin contraction continues Sector: FMCG CMP: ` 879 Recommendation: HOLD Market Statistics Current stock price (`) 879 Shares O/S
PRELIMINARY RESULTS February 2016
 25 February 2016 Nicandro Durante Chief Executive A strong performance driven by market share growth Excellent underlying performance, despite significant FX headwinds Outstanding quality share performance,
Despite Challenging Externalities, Axiata s Third Quarter Results Continue to Demonstrate Improved Underlying Performance
 MEDIA RELEASE Despite Challenging Externalities, Axiata s Third Quarter Results Continue to Demonstrate Improved Underlying Performance Based on underlying performance at constant currency and pre-mfrs
Key highlights for the year
 Recommendation Not Rated Snapshot CMP (26/04/2010) Rs. 693 Sector IT & Software Stock Details BSE Code NSE Code Bloomberg Code Market Cap (Rs. Crs) Free Float (%) 52- wk HI/Lo Avg. volume BSE (Quarterly)
First Quarter 2018 May 3, 2018
 First Quarter 2018 May 3, 2018 Safe Harbor Please note that in this presentation, we may discuss events or results that have not yet occurred or been realized, commonly referred to as forward-looking statements.
Stylam Industries Limited
 Stylam Industries Limited I N V E S T O R P R E S E N T A T I O N August 2018 Table of Contents 03 C O R P O R A T E O V E R V I E W 12 T H E R O A D A H E A D 15 F I N A N C I A L S N A P S H O T 01 Corporate
Colgate-Palmolive. Q2FY18 Result Update Volume pressure continues; Soft A&P aids Margin. Sector: FMCG CMP: ` 1,063. Recommendation: HOLD
 Colgate-Palmolive Q2FY18 Result Update Volume pressure continues; Soft A&P aids Margin Sector: FMCG CMP: ` 1,063 Recommendation: HOLD Market Statistics Current stock price (`) 1,063 Shares O/S (cr.) 27.2
FINANCIAL RESULTS Q3 FY18. January 23, 2018
 FINANCIAL RESULTS Q3 FY18 January 23, 2018 2 Environment Growth in advanced economies strengthened in 2017, helped by a increase in capital spending and exports. The recovery has been led by Europe. (World
Management Discussion and Analysis
 GROUP Financial Year ended 31 March Change (%) Change in constant currency (%) Operating revenue 16,711 16,961-1.5-2.6 EBITDA 4,998 5,013-0.3-1.5 EBITDA margin 29.9% 29.6% Share of associates' pre-tax
Q Earnings. November 2, 2016
 Q4 2016 Earnings November 2, 2016 Forward-Looking Statements and Non-GAAP Measures Forward-Looking Statements This presentation contains certain forward-looking statements within the meaning of the U.S.
United Bank for Africa Plc Audited 2016 Half Year Results for the Period Ended June 30, 2016.
 United Bank for Africa Plc Audited 2016 Half Year Results for the Period Ended June 30, 2016....Africa's Global Bank UBA SUSTAINS STRONG ASSET QUALITY AND PROFITABILITY; DECLARES N0.20 INTERIM DIVIDEND
Colgate-Palmolive. Q1FY18 Result Update Volume pressure continues; Soft A&P aids Margin. Sector: FMCG CMP: ` 1,083. Recommendation: HOLD
 Colgate-Palmolive Q1FY18 Result Update Volume pressure continues; Soft A&P aids Margin Sector: FMCG CMP: ` 1,083 Recommendation: HOLD Market Statistics Current stock price (`) 1,083 Shares O/S (cr.) 27.2
Third Quarter 2017 Results Jan Jenisch, CEO Ron Wirahadiraksa, CFO. October 27, 2017 LafargeHolcim Ltd 2015
 Third Quarter 2017 Results Jan Jenisch, CEO Ron Wirahadiraksa, CFO October 27, 2017 LafargeHolcim Ltd 2015 01 Initial views Q3 2017 and Outlook Jan Jenisch, Chief Executive Officer 2017 LafargeHolcim 2