Investor Presentation February 2016
|
|
|
- George Austin
- 5 years ago
- Views:
Transcription
1 Dabur India Ltd Investor Presentation February 2016
2 FMCG Overview Fourth largest sector in the economy Current size of the Indian FMCG Market is around USD 45 bn Grown at an annual average of 11 per cent over the last decade * Urban segment is the largest contributor to the sector- accounting for two-thirds of total revenue Sector is likely to touch sales of USD 100 bn by *Source: IBEF Report on FMCG
3 FMCG Growth Drivers Rising Income driving Purchases Growth of Modern Trade & E Commerce Low Penetration & Consumption Evolving consumer lifestyle Favorable demographics 2


4 Dabur An Overview One of the oldest and largest FMCG Companies in the country World s largest in Ayurveda and natural healthcare Total reach of 5.3mn outlets, one of the highest among FMCG companies 20 world class manufacturing facilities catering to needs of diverse markets Strong overseas presence with 31% contribution to consolidated sales 3


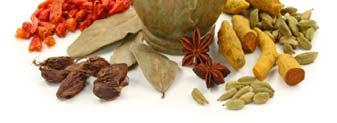

5 Dabur & Ayurveda 4


6 Health and Well-Being Health & Well being - The underlying theme across the portfolio Dabur Honey Weight Management Dabur Baby Massage Oil Focus on Ayurvedic Innovations in Free of paraffin and OTC- No.1 in Women Healthcare parabens -Safe for babies Health Tonics Category 5


7 Health and Well-Being Health & Well Being focus has been extended to HPC and Foods Red Tooth Paste- Focused on Ingredient Effectiveness Recently introduced the Real Wellnezz range with the Jamun flavour Odomos Protection from Dengue Sanifresh- Toilet Cleaner To safeguard the health of the family by ensuring hygiene Activ Juices for a healthy lifestyle 6
8 Distribution Framework Factory C&F Factory C&F GT Sockist MT STockist Insti Stockist t Super Sockist Wholesaler Sub Sockist Retailer Retailer Retailer Consumer Consumer Consumer Consumer 7

9 Key Milestones Established by Dr SK Burman in Kolkata Came out with first public issue Inducted professional management Crossed the 1000 crs turnover mark Dabur acquired Balsara Acquired Fem Pharma Acquired Hobi and Namaste Dabur crosses billion dollar turnover mark 8
10 Global Business Footprint 9
11 Dabur Performance Snapshot in INR bn in INR bn FY11 FY12 FY13 FY14 FY15 FY11 FY12 FY13 FY14 FY15 Dabur has had a strong & PAT growth trajectory on the back of a robust business model 10
12 Strong Financial Profile 13.9 Net Worth (INR Bn) ROIC 43.6% 45.2% 32.7% 34.0% 38.3% FY11 FY12 FY13 FY14 FY15 FY11 FY12 FY13 FY14 FY % *EBITDA Margin 18.9% 17.9% 17.8% 18.2% EPS FY11 FY12 FY13 FY14 FY15 FY11 FY12 FY13 FY14 FY15 11 *includes Non- Operating income


 Dabur India")


 * Others")


13 Business Structure Domestic (69%) Domestic FMCG (66%) Others (3%) Dabur India Ltd. Organic International (22%) International (31%) Namaste Labs (6%) Hobi Group (3%) * Others include Retail, Commodity exports etc Note: % figure in brackets indicate % share in Consolidated Sales for FY15 12


14 Sales By Business Vertical Domestic FMCG* Healthcare Healthcare Healthcare HPC Foods Health (33%) Supplemen ts Foods 18% Skin Care 19% Digestives HPC(48%) 5% 6% Foods(19%) Oral Care 14% Home Care 6% Hair Care 23% OTC & Ethicals 9% International Business Region Wise Breakdown * Breakdown of Domestic FMCG business basis FY15 Sales 13 America 16% Europe 12% Asia 17% Africa 23% Middle East 32%
15 India Business Strategy Healthcare Home & Personal Care Foods Increasing Doctor Advocacy Premiumization & Differentiation Leveraging g the Fruit equity associated with the Real brand Thrust on building the OTC portfolio Strong innovation pipeline Focus on Healthy range of products 14
 and the rest of the Domestic FMCG business to have focused attention on both segments of the business Demand generation from doctors shall be the key focus: Advocacy platform being")

16 Increasing Doctor Advocacy Project LEAD: Leveraging g Through Empowered Anchoring & Detailing Doctor Advocacy is the key to enhance consumer franchise Front end teams to be separated for Healthcare (OTC & Ethicals) and the rest of the Domestic FMCG business to have focused attention on both segments of the business Demand generation from doctors shall be the key focus: Advocacy platform being built Both Ayurvedic and Allopathic doctor reach to be ramped up Building the detailing team- Around 170 Medical representatives hired; Number will increase to 275 by end of the fiscal Head of business inducted for Medical detailing and marketing Doctor Detailing for Dabur Products using hand held devices IT Platform and hand held devices for seamless information flow for the detailing team 15


17 Continue to build bigger brands brands with turnover of INR 1bn+ with 3 brands over 10bn
18 Competitive Position We continue to lead across verticals- Healthcare, HPC and Foods #Relative Competitive Position #1 #1 #2 #2 #2 #1 #1 #2 #3 #1 #1 Healthcare Home and Personal Care Foods 17 * Position basis Nielsen Market Share data MAT Dec 15


19 Product Innovation India Ratnaprash Sugarfree Fem Diamond Bleach Gulabari Facewash Sanifresh Germguard International Dermoviva Bodywash Range Vatika Enriched Hair Oil- Gerghir Herbal Olive Enamel Care Toothpaste 18
20 Distribution Expansion Project Double Rolled out in FY13 to expand direct coverage in rural markets Direct Village coverage has increased from villages in FY11 to 44,000 villages in FY15 Focus on increasing efficiency and productivity of the channel Project Aimed at leveraging the potential of Top 130 towns which contribute to 50% of urban consumption Segregating the grocery channel teams for wholesale & retail Initiative is in line with renewed focus on urban markets Project CORE To enhance chemist coverage and provide further impetus to our Health Care portfolio Direct Chemist Coverage is currently 213,000 Strategy is to increase coverage and range for better throughput 19


21 International Business Overview In INR Mn Middle Key Markets East Africa South Asia 8992 Key Categories Hair Care Skin Care Oral Care FY11 FY12 FY13 FY14 FY15 International Sales FY15 Comprises 31% of Consolidated Sales in FY15 Localized supply chain network for efficient business operations Sustained investment in brands and innovation to grow the topline Business foray had been entirely organic since 1980 s, until FY when we acquired Hobi Group and Namaste Labs America 16% Europe 12% Asia 17% Africa 23% Middle East 32% 20


22 International-Competitive Position Hair Cream* 44.1% 36.5% 36.6% 6% No.1 Position in the Hair Cream Category in KSA,UAE and Egypt KSA UAE Egypt Hair Oils* 64.8 % 27.5 % 67.3 % No.1 Position in the Hair Oils Category in KSA& Egypt and No.2 in UAE KSA UAE Egypt *Volume Market Share Mat March
23 Region Wise Strategy Middle East Africa Asia America Europe Increase penetration in Hair Care across markets Increase share of Ethnic Hair Care by scaling up ORS(Namaste) Increase product width and penetration in neighboring markets Leveraging product technology and consumer insights for African Hair Care Cross pollinate to grow the Turkish and Export sales Strengthen Oral Care and Skin Care Cross pollinate with products from MENA and Turkeys Enter emerging markets like Myanmar with personal care products such as Toothpastes and Shampoos Continue to cater to large Indian Diaspora through the ethnic channels Expand consumer base in UK and rest of Europe by adding products, improving distribution and focused marketing 22

24 Financial Highlights 9MFY16 Growth 71% 7.1% 16.9% 17.9% 23 Sales EBITDA PAT Rs crs Rs crs Rs crs
25 Margin Profile 9MFY % 20.2% 14.7% 52% 13.3% 18.5% Q3FY15 Q3FY16 Q2FY15 Q2FY16 Q2FY15 Q2FY16 Gross Margin EBITDA Margin PAT Margin 308bps 169bps 134bps 24

26 Sustainability: A Key Focus Dabur is committed to being a responsible company and making a positive contribution to Society and Environment 1,141 acres under ,13,750 school b fi i cultivation for rare medicinal herbs in India 2,028 beneficiary families of our Self Help Group initiatives kids benefitting from our Healthcare Initiatives 13 States covered under our Agronomical Initiatives 1,674 farmers/beneficiaries of our Agronomical initiatives in India 586 women trained at our vocational training centers 25
27 Share Price Performance, Dividends and Shareholding Share Holding Pattern As on 31 st December 2015 Market Capitalization FII 20% Others DII 6% 5% in INR bn Promoters 68% 140% 200% 250% 250% Dividend History* FY11 FY12 FY13 FY14 FY15 175% 175% 200% 200% 175% 150% 150% 115% 130% FY03 FY04 FY05 FY06 FY07 FY08 FY09 FY10 FY11 FY12 FY13 FY14 FY15 26 *Bonus issue in FY07 & FY11
28 Consolidated P&L 27 DIL (Consolidated) P&L in Rs. million Q3FY16 Q3FY15 YoY (%) 9M FY16 9M FY15 YoY (%) Net Sales 21,224 20, % 62,786 58, % Other Operating Income Material Cost 9,232 9, % 28,207 28, % % of Sales 43.5% 47.7% 44.9% 48.0% Employee Costs 2,028 1, % 5,928 5, % % of Sales 9.6% 8.6% 9.4% 8.8% Ad Pro 3,500 3, % 9,590 8, % % of Sales 16.5% 15.4% 15.3% 14.7% Other Expenses 2,728 2, % 8,157 7, % % of Sales 12.9% 11.7% 13.0% 12.2% Other Non Operating Income % 6% 1,629 1, % EBITDA 4,386 3, % 12,673 10, % % of Sales 20.7% 18.8% 20.2% 18.5% Interest Exp. and Fin. Charges % % Depreciation & Amortization % % Profit Before Tax (PBT) 3,954 3, % 11,346 9, % Exceptional Item Tax Expenses % 2,126 1, % PAT(Before extraordinary item) 3,188 2, % 9,220 7, % % of Sales 15.0% 13.7% 14.7% 13.4% Extraordinary Item PAT(After extraordinary Items) 3,188 2, % 9,220 7, % Minority Interest (Profit)/Loss PAT (After Extra ordinary item & Minority Int) 3,185 2, % 9,208 7, % % of Sales 15.0% 13.6% 14.7% 13.3%
29 Statement of Assets and Liabilities 28 in Rs. million As at 31/03/2015) As at 31/03/2014) Â EQUITY AND LIABILITIES 1 Shareholders funds (a) Share capital (b) Reserves and surplus Sub-total - Shareholders' funds Minority interest Non-current liabilities (a) Long-term borrowings (b) Deferred tax liabilities (net) () (c) Oh Other long-term liabilities i (c) Long-term provisions Sub-total - Non-current liabilities Current liabilities (a) Short-term borrowings (b) () Trade py payables (c )Other current liabilities (d) Short-term provisions Sub-total - Current liabilities TOTAL - EQUITY AND LIABILITIES B ASSETS 1. Noncurrent Non-current assets (a) Fixed assets (b) Goodwill on consolidation (c) Non-current investments (d) Long-term loans and advances (e) Other non-current assets Sub-total - Non-current assets Current assets (a) Current investments (b) Inventories (c) Trade receivables (d) Cash and bank balances (e) Short-term loans and advances (f) Other current assets Sub-total - Current assets Total -Assets
30 Thank You
Dabur India Limited. Investor Presentation June 2018
 Dabur India Limited Investor Presentation June 2018 1 Contents 1. Dabur Overview 2. Business Structure 3. India Business 4. The Journey of our Gems 5. International Business 6. The next growth wave 7.
Dabur India Limited. Investor Communication. Quarter and Half Year ended September 30, 2014
 Dabur India Limited Investor Communication Quarter and Half Year ended September 30, 2014 November 3, 2014 Performance Overview : Q2 FY2014-15 Consolidated Sales Consolidated EBITDA EBITDA Margins Consolidated
Dabur India Limited Investor Presentation CLSA India Forum November 2018
 Dabur India Limited Investor Presentation CLSA India Forum November 2018 1 Agenda 1. Dabur Overview 2. Business Structure 3. India Business 4. International Business 5. The way forward 6. Annexure 2 Dabur
Dabur India Limited. Investor Communication. Quarter ended 30 th June August 4, 2017
 1 Dabur India Limited Investor Communication Quarter ended 30 th June 2017 August 4, 2017 GST Transition 2 GST implemented w.e.f. 1 st July 2017 De stocking in trade channels and institutions led to impact
Dabur India Limited. Investor Presentation November December 2018
 Dabur India Limited Investor Presentation November December 2018 1 Agenda 1. Dabur Overview 2. Business Structure 3. India Business 4. International Business 5. The Way Forward 6. Our Value Creators 7.
Dabur India Limited Investor Communication
 Dabur India Limited Investor Communication Quarter and Year ended 31 st March 2018 Contents 1. Q4 FY18 and FY18 Overview 2. Category Highlights 3. Business Initiatives 4. FY18 - Product Launches 5. International
Investor Communication. Quarter and Half Year ended 30 th September, 2016
 Investor Communication Quarter and Half Year ended 30 th September, 2016 October 26, 2016 Demand Slowdown : Underlying Factors 10 Index of Industrial Production 0 4 Sources of income have been affected
Dabur India. CMP: INR130 TP: INR135 Neutral
 BSE SENSEX S&P CNX 18,625 5,664 29 October 2012 2QFY13 Results Update Sector: Consumer Dabur India CMP: INR130 TP: INR135 Neutral Bloomberg DABUR IN Equity Shares (m) 1,740.7 52-Week Range (Rs) 139/92
Dabur India. Neutral. Rs93
 3QFY11 Results Update SECTOR: FMCG BSE SENSEX S&P CNX 18,022 5,417 Bloomberg DABUR IN Equity Shares (m) 1,738.0 52-Week Range (Rs) 112/79 1,6,12 Rel. Perf. (%) 5/-5/2 M.Cap. (Rs b) 160.8 M.Cap. (US$ b)
Dabur India (DABIND) 275
 275") Rating matrix Rating : Buy Target : 304 Target Period : 12 months Potential Upside : 11% What s changed? Target Changed from 283 to 304 EPS FY17E Changed from 7.5 to 7.9 EPS FY18E Changed from 8.1 to 8.6
Rating matrix Rating : Buy Target : 304 Target Period : 12 months Potential Upside : 11% What s changed? Target Changed from 283 to 304 EPS FY17E Changed from 7.5 to 7.9 EPS FY18E Changed from 8.1 to 8.6
DABUR INDIA LTD Result Update (CONSOLIDATED BASIS): Q3 FY19
: Q3 FY19") DABUR INDIA LTD Result Update (CONSOLIDATED BASIS): Q3 FY19 Index Details Stock Data Sector Personal Products BSE Code 500096 Face Value 1.00 52wk. High / Low (Rs.) 490.70/312.45 Volume (2wk. Avg.) 203000
DABUR INDIA LTD Result Update (CONSOLIDATED BASIS): Q3 FY19 Index Details Stock Data Sector Personal Products BSE Code 500096 Face Value 1.00 52wk. High / Low (Rs.) 490.70/312.45 Volume (2wk. Avg.) 203000
Dabur India Ltd. Q3FY18 Result Update Strong Volume led Domestic growth; IBD remains weak. Sector: FMCG CMP: ` 356. Recommendation: BUY
 Dabur India Ltd. Q3FY18 Result Update Strong Volume led Domestic growth; IBD remains weak Sector: FMCG CMP: ` 356 Recommendation: BUY Market statistics Current stock price (`) 356 Shares O/S (cr.) 176.2
Dabur India. CMP: INR106 TP: INR94 Neutral
 28 July 2011 1QFY12 Results Update Sector: FMCG BSE SENSEX S&P CNX 18,210 5,488 Dabur India CMP: INR106 TP: INR94 Neutral Bloomberg DABUR IN Equity Shares (m) 1,740.0 52-Week Range (INR) 122/87 1,6,12
Dabur India. Share gains power growth, Accumulate. Source: Company Data; PL Research
 Share gains power growth, Accumulate May 02, 2018 Amnish Aggarwal amnishaggarwal@plindia.com +91 22 66322233 Nishita Doshi nishitadoshi@plindia.com +91 22 66322381 Rating Accumulate Price Rs371 Target
Dabur India (DABIND) 304
 304") Rating matrix Rating : Buy Target : 338 Target Period : 12 months Potential Upside : 11% What s changed? Target Changed from 304 to 338 EPS FY17E Changed from 7.9 to 8.0 EPS FY18E Changed from 8.6 to 9.4
Rating matrix Rating : Buy Target : 338 Target Period : 12 months Potential Upside : 11% What s changed? Target Changed from 304 to 338 EPS FY17E Changed from 7.9 to 8.0 EPS FY18E Changed from 8.6 to 9.4
Dabur India (DABIND) 276
 276") Rating matrix Rating : Buy Target : 324 Target Period : 12 months Potential Upside : 17% What s changed? Target Changed from 338 to 324 EPS FY17E Changed from 7.6 to 7.2 EPS FY18E Changed from 8.3 to 7.9
Rating matrix Rating : Buy Target : 324 Target Period : 12 months Potential Upside : 17% What s changed? Target Changed from 338 to 324 EPS FY17E Changed from 7.6 to 7.2 EPS FY18E Changed from 8.3 to 7.9
GODREJ CONSUMER PRODUCTS INVESTOR PRESENTATION
 1 GODREJ CONSUMER PRODUCTS INVESTOR PRESENTATION GODREJ CONSUMER PRODUCTS SNAPSHOT strong positions in core categories largest home grown HPC company US $1.3 billion in sales in FY 14 home care hair care
Q2FY18 Performance Review 25 th October 2017
 Q2FY18 Performance Review 25 th October 2017 Q2FY18 Snapshot Consolidated Revenues (including GST/VAT) grew by 14% during the quarter with volumes growing by 10%. Q2FY18 Business Wise Sales Split Reported
Pioneers of laminated tubes in India. Corporate Presentation
 Pioneers of laminated tubes in India Corporate Presentation M17617 Safe Harbour Certain statements in this presentation concerning our future growth prospects are forward-looking statements. The Company
Dabur India (DABIND) 290
 290") Rating matrix Rating : Buy Target : 338 Target Period : 12 months Potential Upside : 16% What s changed? Target Unchanged EPS FY17E Changed from 7.9 to 7.6 EPS FY18E Changed from 8.6 to 8.3 Rating Unchanged
Rating matrix Rating : Buy Target : 338 Target Period : 12 months Potential Upside : 16% What s changed? Target Unchanged EPS FY17E Changed from 7.9 to 7.6 EPS FY18E Changed from 8.6 to 8.3 Rating Unchanged
Dabur. Bargain hunting BUY COMPANY UPDATE 12 DEC CMP (as on 12 Dec 2013) Rs 168 Target Price Rs 192
 Rs 168 Target Price Rs 192") INDUSTRY FMCG CMP (as on 12 Dec 2013) Rs 168 Target Price Rs 192 Nifty 6,237 Sensex 20,926 KEY STOCK DATA Bloomberg/Reuters DABUR IN/DABU.BO No. of Shares (mn) 1,744 MCap (Rs bn)/(us$ mn) 293/4,742 6m
INDUSTRY FMCG CMP (as on 12 Dec 2013) Rs 168 Target Price Rs 192 Nifty 6,237 Sensex 20,926 KEY STOCK DATA Bloomberg/Reuters DABUR IN/DABU.BO No. of Shares (mn) 1,744 MCap (Rs bn)/(us$ mn) 293/4,742 6m
KRBL LIMITED. Investor Communication
 KRBL LIMITED Investor Communication Quarter and Year ended 31 st March 2018 CONTENTS 1. Q4 & FY18 Consolidated Financial Overview 2. Business Overview 3. Category Highlights 4. Marketing Initiatives 5.
Dabur India. Source: Company Data; PL Research
 Deflation and poor demand impacts sales; Accumulate July 27, 2016 Amnish Aggarwal amnishaggarwal@plindia.com +91 22 66322233 Gaurav Jogani gauravjogani@plindia.com +91 22 66322238 Rating Accumulate Price
Dabur India. Steady recovery in place; Accumulate. Source: Company Data; PL Research
 Steady recovery in place; Accumulate January 31, 2018 Amnish Aggarwal amnishaggarwal@plindia.com +91 22 66322233 Nishita Doshi nishitadoshi@plindia.com +91 22 66322381 Rating Accumulate Price Rs354 Target
DABUR INDIA LIMITED RESEARCH
 RESULTS REVIEW Dabur India Limited Hold Share Data Market Cap Rs. 79.5 bn Price Rs. 91.95 BSE Sensex 14,577.87 Reuters Bloomberg Avg. Volume (52 Week) DABU.BO DABUR IN 0.3mn 52-Week High/Low Rs. 134 /
Dabur India (DABIND) 287
 287") Rating matrix Rating : Hold Target : 305 Target Period : 12 months Potential Upside : 6% What s changed? Target Changed from 324 to 305 EPS FY18E Changed from 7.9 to 7.5 EPS FY19E Changed from 8.5 to 8.0
Rating matrix Rating : Hold Target : 305 Target Period : 12 months Potential Upside : 6% What s changed? Target Changed from 324 to 305 EPS FY18E Changed from 7.9 to 7.5 EPS FY19E Changed from 8.5 to 8.0
Presentation at Citigroup Smith Barney India Corporate Day. London, June 2003
 Presentation at Citigroup Smith Barney India Corporate Day London, June 2003 HINDUSTAN LEVER LIMITED Contents Economy Overview Strategy FY 2002 MQ 2003 2003 & Beyond.. HINDUSTAN LEVER LIMITED Contents
PROCTER & GAMBLE HYGIENE & HEALTH CARE LTD Result Update (PARENT BASIS): Q4 FY15
: Q4 FY15") PROCTER & GAMBLE HYGIENE & HEALTH CARE LTD Result Update (PARENT BASIS): Q4 FY15 ISIN: INE179A01014 OCTOBER 5 th 2015 STOCK DETAILS Sector FMCG BSE Code 500459 Face Value 10.00 52wk. High / Low (Rs.) 7435.00/5144.40
PROCTER & GAMBLE HYGIENE & HEALTH CARE LTD Result Update (PARENT BASIS): Q4 FY15 ISIN: INE179A01014 OCTOBER 5 th 2015 STOCK DETAILS Sector FMCG BSE Code 500459 Face Value 10.00 52wk. High / Low (Rs.) 7435.00/5144.40
DABUR Going from strength to strength
 RESULT UPDATE DABUR Going from strength to strength India Equity Research Consumer Goods Dabur s Q1FY13 numbers were marginally ahead of our estimates, led by strong volume growth (domestic volume up 11.6%
Tata Consultancy Services (TCS)
") Jan-16 Jun-16 Nov-16 Apr-17 Sep-17 Feb-18 Jul-18 Dec-18 3QFY2019 Result Update IT January 11, 2019 Tata Consultancy Services (TCS) Performance highlights (` cr) 3QFY19 2QFY19 % chg (QoQ) 3QFY18 % chg (yoy)
Jan-16 Jun-16 Nov-16 Apr-17 Sep-17 Feb-18 Jul-18 Dec-18 3QFY2019 Result Update IT January 11, 2019 Tata Consultancy Services (TCS) Performance highlights (` cr) 3QFY19 2QFY19 % chg (QoQ) 3QFY18 % chg (yoy)
CHANGE IN STANCE DABUR IN EQUITY June 13, 2017
 BUY CHANGE IN STANCE DABUR IN EQUITY June 13, 2017 Turning healthier Dabur was the worst performing FMCG stock YTD, up 2% vs 25% for FMCG. Our thesis that Dabur was worst hit by demonetisation given rural
Business snapshot. ~50% of revenues comes from international businesses. Leading market share in home care, hair care and personal care
 February 3, 2016 Business snapshot Emerging markets FMCG leader Excellent track record of value creation among FMCG companies in India Growing presence in Asia, Africa and Latin America $ Leading market
Dabur India (DABIND) 355
 355") Rating matrix Rating : Buy Target : 390 Target Period : 12 months Potential Upside : 10% What s changed? Target Changed from 375 to 390 EPS FY19E Changed from 8.9 to 8.5 EPS FY20E Introduced at 9.7 Rating
Rating matrix Rating : Buy Target : 390 Target Period : 12 months Potential Upside : 10% What s changed? Target Changed from 375 to 390 EPS FY19E Changed from 8.9 to 8.5 EPS FY20E Introduced at 9.7 Rating
INVESTOR PRESENTATION JANUARY Version -3
 INVESTOR PRESENTATION JANUARY - 2018 Version -3 FLOW BAJAJ PATHFINDER AND NEW VISION MISSION VALUES BUSINESS CONTEXT & INITIATIVES OF Q3 Q3 RESULTS SUMMARY WAY FORWARD DETAILED PERFORMANCE THE NAYA BAJAJ
Business snapshot. ~50% of revenues comes from international businesses. Leading market share in home care, hair care and personal care
 May 24, 2016 Business snapshot Emerging markets FMCG leader Excellent track record of value creation among FMCG companies in India Growing presence in Asia, Africa and Latin America $ Leading market share
Uncommon sense. April 2009
 Uncommon sense April 2009 Disclaimer This investor presentation has been prepared by Marico Limited ( Marico ) and does not constitute a prospectus or placement memorandum or an offer to acquire any securities.
GODREJ CONSUMER PRODUCTS LIMITED 1Q FY2016 PERFORMANCE UPDATE
 GODREJ CONSUMER PRODUCTS LIMITED 1Q FY2016 PERFORMANCE UPDATE July 29, 2015 PERFORMANCE UPDATE EXECUTIVE SUMMARY : MAJOR HIGHLIGHTS BUSINESS OVERVIEW : INDIA BUSINESS OVERVIEW : INTERNATIONAL OVERALL 1Q
Recovery to be gradual; Maintain HOLD
 Dabur India Equity Research Consumers June 22, 2017 Company Update Refer to important disclosures at the end of this report Recovery to be gradual; Maintain HOLD Emkay Your success is our success CMP Target
BUY SIMPLEX INFRASTRUCTURES LTD SYNOPSIS. CMP Target Price FEBRUARY 28 th Result Update (PARENT BASIS): Q3 FY15
: Q3 FY15") BUY CMP 408.40 Target Price 460.00 SIMPLEX INFRASTRUCTURES LIMITED Result Update (PARENT BASIS): Q3 FY15 FEBRUARY 28 th 2015 ISIN: INE059B01024 Index Details Stock Data Sector Construction & Engineering
BUY CMP 408.40 Target Price 460.00 SIMPLEX INFRASTRUCTURES LIMITED Result Update (PARENT BASIS): Q3 FY15 FEBRUARY 28 th 2015 ISIN: INE059B01024 Index Details Stock Data Sector Construction & Engineering
Business snapshot. 48% of revenue comes from international businesses. Leading market share in home care, hair care and personal care
 May 26, 2017 Business snapshot Emerging markets FMCG leader Excellent track record of value creation among FMCG companies in India Growing presence in Asia, Africa and Latin America Leading market share
BUY. KDDL LTD Result Update (PARENT BASIS): Q1 FY16 SYNOPSIS. CMP Target Price AUGUST 22 nd 2015 ISIN: INE291D01011
: Q1 FY16 SYNOPSIS. CMP Target Price AUGUST 22 nd 2015 ISIN: INE291D01011") BUY CMP 280.10 Target Price 322.00 KDDL LTD Result Update (PARENT BASIS): Q1 FY16 AUGUST 22 nd 2015 ISIN: INE291D01011 Index Details Stock Data Sector Other Apparels & Accessories BSE Code 532054 Face
BUY CMP 280.10 Target Price 322.00 KDDL LTD Result Update (PARENT BASIS): Q1 FY16 AUGUST 22 nd 2015 ISIN: INE291D01011 Index Details Stock Data Sector Other Apparels & Accessories BSE Code 532054 Face
DABUR Healthy and juicy
 RESULT UPDATE DABUR Healthy and juicy India Equity Research Consumer Goods Dabur s Q2FY13 numbers were in line our estimates as domestic volume was up 9% YoY (as against 5.0%, 8.0%, 9.5% and 11.6% YoY
Narnolia Securities Ltd. RAJEEV ANAND 16-Oct-17
 16-Oct-17 INDUSTRY - Con. Staples Bloomberg Code- BJCOR IN BSE Code - 533229 NSE Code - BAJAJCORP NIFTY - 10167 Company Data CMP 414 Target Price 410 Previous Target Price 410 Upside -1% 52wk Range H/L
Colgate-Palmolive. Q1FY18 Result Update Volume pressure continues; Soft A&P aids Margin. Sector: FMCG CMP: ` 1,083. Recommendation: HOLD
 Colgate-Palmolive Q1FY18 Result Update Volume pressure continues; Soft A&P aids Margin Sector: FMCG CMP: ` 1,083 Recommendation: HOLD Market Statistics Current stock price (`) 1,083 Shares O/S (cr.) 27.2
Narnolia Securities Ltd. RAJEEV ANAND 15-Jan-18
 15-Jan-18 INDUSTRY - Con. Staples Bloomberg Code- BJCOR IN BSE Code - 533229 NSE Code - BAJAJCORP NIFTY - 10681 Company Data CMP 508 Target Price 570 Previous Target Price 410 Upside 12% 52wk Range H/L
Colgate-Palmolive. Q2FY18 Result Update Volume pressure continues; Soft A&P aids Margin. Sector: FMCG CMP: ` 1,063. Recommendation: HOLD
 Colgate-Palmolive Q2FY18 Result Update Volume pressure continues; Soft A&P aids Margin Sector: FMCG CMP: ` 1,063 Recommendation: HOLD Market Statistics Current stock price (`) 1,063 Shares O/S (cr.) 27.2
Financials/Valu FY15 FY16 FY17 FY18E FY19E. Almond Drops Hair Oil (ADHO) volume declined by 7% YoY and 120 BAJAJCORP NIFTY
 volume declined by 7% YoY and 120 BAJAJCORP NIFTY") 14-Jul-17 INDUSTRY - Con. Staples BSE Code - 533229 NSE Code - BAJAJCORP NIFTY - 9892 Company Data CMP 406 Target Price 410 Previous Target Price 455 Upside 1% 52wk Range H/L Mkt Capital (Rs Cr) Av. Volume
14-Jul-17 INDUSTRY - Con. Staples BSE Code - 533229 NSE Code - BAJAJCORP NIFTY - 9892 Company Data CMP 406 Target Price 410 Previous Target Price 455 Upside 1% 52wk Range H/L Mkt Capital (Rs Cr) Av. Volume
Dabur India. Institutional Equities. 1QFY19 Result Update
 1QFY19 Result Update Institutional Equities Dabur India 2 August 2018 Reuters: DABU.NS; Bloomberg: DABUR IN Consistency Is Key To The Game Dabur India s (DABUR) operating performance in 1QFY19 was better
Dabur India. Result Update Q3 FY15. Dabur matched our expectations by recording modest 9.2% yoy revenue
 Change in Estimates Rating Target Dabur India Q3 FY15 Dabur matched our expectations by recording modest 9.2% yoy revenue growth at ~Rs21bn during Q3 FY15 Domestic FMCG business revenues increased by ~13%
Matrimony.com Ltd BUY. Performance Update. Target Price `1,016. 4QFY2018 Result Update Cable. Historical share price chart.
 4QFY2018 Result Update Cable May 7, 2018 Matrimony.com Ltd Performance Update Y/E March (` cr) 4QFY18 4QFY17 % yoy 3QFY18 % qoq Net sales 84 75 12 84 1 EBITDA 20 11 78 17 15 EBITDA margin (%) 23.6 14.8
PRESS RELEASE. Mumbai, January 27, 2016: Godrej Consumer Products Limited (GCPL), a leading
, a leading") PRESS RELEASE 3Q FY 2016 results GCPL delivers a net profit growth of 23% on an organic constant currency net sales growth of 9%. Mumbai, January 27, 2016: Godrej Consumer Products Limited (GCPL), a leading
PRESS RELEASE 3Q FY 2016 results GCPL delivers a net profit growth of 23% on an organic constant currency net sales growth of 9%. Mumbai, January 27, 2016: Godrej Consumer Products Limited (GCPL), a leading
Va Tech Wabag Ltd. 11 th March, 2014 BUY
 Company Report BROKING DEPOSITORY DISTRIBUTION FINANCIAL ADVISORY Va Tech Wabag Ltd. 11 th March, 2014 BUY CMP Target Price Rs.691.30 Rs.870.00 VA Tech Wabag is Indian multinational player technology focused
Results Presentation November 2015
 Results Presentation November 2015 Safe Harbor This presentation and the accompanying slides (the Presentation ), which have been prepared by Balkrishna Industries Limited (the Company ), have been prepared
PRESS RELEASE. Mumbai, May 3, 2016: Godrej Consumer Products Limited (GCPL), a leading emerging
, a leading emerging") PRESS RELEASE 4Q FY 2016 results GCPL delivers a net profit growth of 17% on an organic constant currency net sales growth of 12%. Mumbai, May 3, 2016: Godrej Consumer Products Limited (GCPL), a leading
PRESS RELEASE 4Q FY 2016 results GCPL delivers a net profit growth of 17% on an organic constant currency net sales growth of 12%. Mumbai, May 3, 2016: Godrej Consumer Products Limited (GCPL), a leading
Hindustan Unilever Ltd.
 Nov-16 Dec-16 Jan-17 Feb-17 Mar-17 Apr-17 May-17 Jun-17 Jul-17 Aug-17 Sep-17 Oct-17 Nov-17. Volume No.. I Issue No. 152 Hindustan Unilever Ltd. December 1, 2017 BSE Code: 500696 NSE Code: HINDUNILVR Reuters
Press Release. Consolidated Financial & Performance Highlights (Pharma & Biotech)
") Press Release Strides Shasun announces Q1 FY17 results Q1 FY17 Pharma Revenues* at INR 8,699 Mn, Growth of 43% YoY, Pharma EBITDA at INR 1,451 Mn, Growth of 57% YoY Bengaluru, August 17, 2016: Strides
Press Release Strides Shasun announces Q1 FY17 results Q1 FY17 Pharma Revenues* at INR 8,699 Mn, Growth of 43% YoY, Pharma EBITDA at INR 1,451 Mn, Growth of 57% YoY Bengaluru, August 17, 2016: Strides
SKP Research September 8, 2004
 September 8, 2004 ESSEL PROPACK LIMITED (EPL) Sensex 5298.16 CMP Rs.224.55 Initiating Coverage BUY Incorporated in 1984, Essel Propack Limited (EPL) is an Essel Group company. It manufactures laminated
Bajaj Corp Ltd Bloomberg Code: BJCOR IN
 Consumer Staples-Household Products Bloomberg Code: BJCOR IN India Research - Stock Broking In Pursuit of Excellence, with Almond Drops Hair Oil Leading position in Light Hair Oil market and Well established
PEER GROUPS CMP MARKET CAP EPS P/E (X) P/BV(X) DIVIDEND Company Name (Rs.) Rs. in mn. (Rs.) Ratio Ratio (%)
 P/BV(X) DIVIDEND Company Name (Rs.) Rs. in mn. (Rs.) Ratio Ratio (%)") BUY CMP 4105.40 Target Price 4515.00 GILLETTE INDIA LIMITED Result Update (PARENT BASIS): Q2 FY15 FEBRUARY 25 th, 2015 ISIN: INE322A01010 Stock Data Sector FMCG BSE Code 507815 Face Value / Div. Per Share
BUY CMP 4105.40 Target Price 4515.00 GILLETTE INDIA LIMITED Result Update (PARENT BASIS): Q2 FY15 FEBRUARY 25 th, 2015 ISIN: INE322A01010 Stock Data Sector FMCG BSE Code 507815 Face Value / Div. Per Share
Parag Milk Foods BUY. Performance Update CMP. `324 Target Price `410. 1QFY2019 Result Update Dairy Products. Investment Period 12 Months
 1QFY2019 Result Update Dairy Products August 8, 2018 Parag Milk Foods Performance Update Y/E March (` cr) Q1FY19 Q1FY18 % yoy Q4FY18 % qoq Net sales 549 413 32.9 518 5.9 EBITDA 60 29 103% 55 8.4% EBITDA
FMCG. Equity Research INDIA. Downgrade HUL; prefer Dabur. Reason for report: Sector update. April 6, 2016 BSE Sensex: 24884
 Equity Research April 6, 2016 BSE Sensex: 24884 Hindustan Unilever (HOLD) Target price Rs845 Target PE 37.5x FY18E Dabur India (BUY) Target price Rs289 Target PE 31.3x FY18E Research Analysts: Anand Mour
Dabur India. Worst is over; Accumulate. Source: Company Data; PL Research
 Worst is over; Accumulate October 31, 2017 Amnish Aggarwal amnishaggarwal@plindia.com +91 22 66322233 Gaurav Jogani gauravjogani@plindia.com +91 22 66322238 Rating Accumulate Price Rs333 Target Price Rs342
COLGATE-PALMOLIVE (INDIA) LTD Result Update (PARENT BASIS): Q1 FY15
 LTD Result Update (PARENT BASIS): Q1 FY15") COLGATE-PALMOLIVE (INDIA) LTD Result Update (PARENT BASIS): Q1 FY15 ISIN: INE259A01022 OCTOBER 1 st, 2014 STOCK DETAILS Sector FMCG BSE Code 500830 Face Value 1.00 52wk. High / Low (Rs.) 1767.30/1219.00
COLGATE-PALMOLIVE (INDIA) LTD Result Update (PARENT BASIS): Q1 FY15 ISIN: INE259A01022 OCTOBER 1 st, 2014 STOCK DETAILS Sector FMCG BSE Code 500830 Face Value 1.00 52wk. High / Low (Rs.) 1767.30/1219.00
PEER GROUPS CMP MARKET CAP EPS P/E (X) P/BV(X) DIVIDEND Company Name (Rs.) Rs. in mn. (Rs.) Ratio Ratio (%)
 P/BV(X) DIVIDEND Company Name (Rs.) Rs. in mn. (Rs.) Ratio Ratio (%)") BUY CMP 734.45 Target Price 845.00 WELSPUN INDIA LIMITED Result Update (CONSOLIDATED): Q2 FY16 OCTOBER 24 th 2015 ISIN: INE192B01023 Index Details Stock Data Sector Textiles BSE Code 514162 Face Value
BUY CMP 734.45 Target Price 845.00 WELSPUN INDIA LIMITED Result Update (CONSOLIDATED): Q2 FY16 OCTOBER 24 th 2015 ISIN: INE192B01023 Index Details Stock Data Sector Textiles BSE Code 514162 Face Value
BUY. BAJAJ CORP LIMITED Result Update: Q1 FY14. CMP (Rs) Target Price (Rs) AUGUST 10 th, 2013 HIGHLIGHTS
 Target Price (Rs) AUGUST 10 th, 2013 HIGHLIGHTS") BUY CMP (Rs) 243.00 Target Price (Rs) 268.00 BAJAJ CORP LIMITED Result Update: Q1 FY14 AUGUST 10 th, 2013 ISIN: INE933K01021 Stock Data Sector FMCG BSE Code 533229 Face Value 1.00 52wk. High / Low (Rs.)
BUY CMP (Rs) 243.00 Target Price (Rs) 268.00 BAJAJ CORP LIMITED Result Update: Q1 FY14 AUGUST 10 th, 2013 ISIN: INE933K01021 Stock Data Sector FMCG BSE Code 533229 Face Value 1.00 52wk. High / Low (Rs.)
Avenue Supermarts Limited
 IPO Note Retail March 4, 2017 Avenue Supermarts Limited A retailer with a growth appetite Avenue Supermarts Ltd (ASL), founded in 2002, is the owner of well established supermarket chain D-Mart. ASL is
HINDUSTAN LEVER LIMITED
 India HINDUSTAN LEVER LIMITED CLSA Investors Meet Hong Kong, May 2001 Hindustan Lever Leading consumer products company Financials - 2000 - Turnover Rs. 106 bln - Net Profit Rs. 13 bln - EPS Rs. 5.95 -
Performance Update - 4Q FY16 May 3, 2016
 Performance Update - 4Q FY16 May 3, 2016 PERFORMANCE UPDATE 1 Executive Summary - Key Highlights 2 Business Overview - India 3 Business Overview - International 2 I GCPL I Performance Update 4Q FY16 I
Procter & Gamble Hygiene & Health Care
 3QFY216 Result Update FMCG May 6, 216 Procter & Gamble Hygiene & Health Care Performance Highlights Quarterly Data (` cr) 3QFY16 3QFY15 % yoy 2QFY16 % qoq Revenue 614 555 1.5 714 (14.) EBITDA 133 123 8.5
FINANCIAL RESULTS. Q1 FY18 July 28, 2017
 FINANCIAL RESULTS Q1 FY18 July 28, 2017 2 Environment Global GDP growth expected to improve to 3.5% in 2017 vs 3.1% in 2016. However risks remain due to monetary policy normalization, geopolitical uncertainty
Performance Update - 4Q FY18 May 8, 2018
 Performance Update - 4Q FY18 May 8, 2018 PERFORMANCE UPDATE 1 Executive Summary - Key Highlights 2 Business Overview - India 3 Business Overview - International 2 I GCPL I Performance Update 4Q FY18 I
Company Overview. Company Fundamentals
 Trading November 6, 2012 CMP Rs. 9.4 BSE Code 519483 BSE ID TAIIND High/Low 1Y (Rs.) 11.3 / 6.2 Average Volume (3M) 9178 Market Cap (Rs. Cr.) 6 Shareholding % Sep-12 Jun-12 Promoters 20.27 20.27 DIIs #
Religare Investment Call
 v-17 Dec-17 Jan-18 Feb-18 Mar-18 Apr-18 May-18 Jun-18 Jul-18 Aug-18 Sep-18 Oct-18 v-18 Q2FY19 Result Update Q2FY19 Result Update BUY CMP (Rs) 5,813 Target Price (Rs) 6,519 Potential Upside 12.1% Sensex
Speciality Restaurants
 For private circulation only Volume No. I Issue No. 13 Speciality Restaurants Profit growth to resume Price: Rs 141 Target Price: Rs 185 Sensex: 21754 Nifty: 6493 FINANCIAL SUMMARY NET OPM OP OTHER PBIDT
Company Overview. FY15 and recent performance. The company has operating profit of INR65.2m in Q2FY16. Table 1: Key financials
 IT Software Products l BSE Research ABM Knowledgeware Ltd. The Varhad Group CMP: INR265.40 Stock data BSE code 531161 BSE ID ABMKNO Face value (INR) 10.0 No of shares (m) 10.0 Market cap (INRm) 2,654.3
Meghmani Organics Limited (MOL) Q2 & H1FY18 Investor Presentation (November 2017)
 Q2 & H1FY18 Investor Presentation (November 2017)") 1 Meghmani Organics Limited (MOL) Q2 & H1FY18 Investor Presentation (November 2017) Robust performance in Q2, PAT up 78% Net Sales (In Rs mn) EBITDA (In Rs mn) 4,536 up 19% YoY 1,028 Up 29% YoY EBITDA
1 Meghmani Organics Limited (MOL) Q2 & H1FY18 Investor Presentation (November 2017) Robust performance in Q2, PAT up 78% Net Sales (In Rs mn) EBITDA (In Rs mn) 4,536 up 19% YoY 1,028 Up 29% YoY EBITDA
Hindustan Unilever Limited. SQ 18 Results Presentation : 12 th October 2018
 Hindustan Unilever Limited SQ 18 Results Presentation : 12 th October 2018 Safe Harbor Statement This Release / Communication, except for the historical information, may contain statements, including the
Key highlights for the year
 Recommendation Not Rated Snapshot CMP (26/04/2010) Rs. 693 Sector IT & Software Stock Details BSE Code NSE Code Bloomberg Code Market Cap (Rs. Crs) Free Float (%) 52- wk HI/Lo Avg. volume BSE (Quarterly)
Rallis India NEUTRAL. Performance Highlights CMP. `237 Target Price - 1QFY2018 Result Update Agrichemical. Investment Period - 3-year price chart
 Jan-12 Jul-12 Jan-13 Jul-13 Jan-14 Jul-14 Jan-15 Jul-15 Jan-16 Jul-16 Jan-17 1QFY2018 Result Update Agrichemical July 26, 2017 Rallis India Performance Highlights Y/E March (` cr) 1QFY2018 4QFY2017 % chg
Bata India BUY. Performance Update. CMP Target Price `842. 1QFY2019 Result Update Footwear. Historical share price chart.
 Jul-15 Oct-15 Jan-16 Apr-16 Jul-16 Oct-16 Jan-17 Apr-17 Jul-17 Oct-17 Jan-18 Apr-18 Jul-18 1QFY2019 Result Update Footwear July 23, 2018 Bata India Performance Update Y/E March (` cr) 1QFY19 1QFY18 % yoy
Mahindra & Mahindra Ltd.
 Jan-16 Apr-16 Jul-16 Oct-16 Jan-17 Apr-17 Jul-17 Oct-17 Jan-18 Apr-18 Jul-18 Oct-18 Jan-19 3QFY2019 Result Update Automobile February 15, 2019 Mahindra & Mahindra Ltd. Performance Update Y/E March (` cr)
IFGL Refractories Limited (Formerly IFGL Exports Limited) Investor Presentation December 2017
 Investor Presentation December 2017") IFGL Refractories Limited (Formerly IFGL Exports Limited) Investor Presentation December 2017 Safe Harbor This presentation and the accompanying slides (the Presentation ), has been prepared by IFGL Refractories
IFGL Refractories Limited (Formerly IFGL Exports Limited) Investor Presentation December 2017 Safe Harbor This presentation and the accompanying slides (the Presentation ), has been prepared by IFGL Refractories
Phillips Carbon Black Limited
 Phillips Carbon Black Limited We Touch Lives Every Moment Investor Presentation February- 218 1 Part of a Dynamic Conglomerate. Carbon Black Industry Global Overview What is Carbon Black? Global CB demand
Tata Steel NEUTRAL. Performance Highlights CMP. `226 Target Price - 2QFY2016 Result Update Steel. Investment Period - 3-year price chart
 2QFY2016 Result Update Steel November 6, 2015 Tata Steel Performance Highlights Standalone (` cr) 2QFY16 2QFY15 yoy % 1QFY16 qoq % Net revenue 9,531 10,785 (11.6) 9,094 4.8 EBITDA 1,862 3,094 (39.8) 1,689
Hathway Cable and Datacom Limited Investor Update Q1-FY19
 Hathway Cable and Datacom Limited Investor Update Q1-FY19 Safe Harbour The information contained in this presentation is only current as of its date. All actions and statements made herein or otherwise
GODREJ CONSUMER PRODUCTS INVESTOR PRESENTATION JUNE 2013
 GODREJ CONSUMER PRODUCTS INVESTOR PRESENTATION JUNE 2013 GODREJ CONSUMER PRODUCTS SNAPSHOT strong positions in core categories largest home grown HPC company US $1.2 billion in sales in FY 13 home care
IFGL Refractories Limited (Formerly IFGL Exports Limited) Investor Presentation February 2018
 Investor Presentation February 2018") IFGL Refractories Limited (Formerly IFGL Exports Limited) Investor Presentation February 2018 Safe Harbor This presentation and the accompanying slides (the Presentation ), has been prepared by IFGL Refractories
IFGL Refractories Limited (Formerly IFGL Exports Limited) Investor Presentation February 2018 Safe Harbor This presentation and the accompanying slides (the Presentation ), has been prepared by IFGL Refractories
Performance Update - 2Q FY16 October 24, 2015
 Performance Update - 2Q FY16 October 24, 2015 PERFORMANCE UPDATE 1 Executive Summary - Key Highlights 2 Business Overview - India 3 Business Overview - International 2 I GCPL I Performance Update 2Q FY16
SQ 02 Results - Snapshot
 SQ 02 Results - Snapshot HPC Power Brands up by 6.8%, driving HPC growth of 4.9% Foods decline by 15.7% leading to flat FMCG sales Operating Profits (PBIT) up 16.6%, Margin Expansion by 390 bps Declining
Shaily Engineering Plastics Limited. Result Update Presentation Q3 & 9MFY18 February 2018
 Shaily Engineering Plastics Limited Result Update Presentation Q3 & 9MFY18 February 2018 Safe Harbor This presentation and the accompanying slides (the Presentation ), which have been prepared by Shaily
SQ 14 Results Presentation October 27, 2014
 SQ 14 Results Presentation October 27, 2014 1 Safe Harbor Statement This Release / Communication, except for the historical information, may contain statements, including the words or phrases such as expects,
CMP Rs. 27. Usha Martin Limited. Iron & Steel. Key highlights of the quarter and FY12
 Iron & Steel CMP Rs. 27 May 1, 212 BSE Code 517146 BSE ID USHAMARTIN High/Low 1Y (Rs.) 6 / 22 Avg. vol (3m) 122,74 Market Cap (Rs Cr) 812 Net IB Debt (Rs Cr) 1,943 Enterprise value(rs Cr) 2,755 Shareholding
Presentation Outline. Q1 FY11 Performance Summary
 LARSEN & TOUBRO LIMITED Analyst Presentation Q1 FY11 Presentation Outline Q1 FY11 Performance Summary Segmental e Analysis s Performance of Key Subsidiaries Outlook 2 Presentation Outline Q1 FY11 Performance
BUY. MENON PISTONS LTD Result Update (PARENT BASIS): Q1 FY16 SYNOPSIS. CMP Target Price SEPTEMBER 3 rd, 2015
: Q1 FY16 SYNOPSIS. CMP Target Price SEPTEMBER 3 rd, 2015") BUY CMP 151.00 Target Price 174.00 MENON PISTONS LTD Result Update (PARENT BASIS): Q1 FY16 SEPTEMBER 3 rd, 2015 ISIN: INE650G01011 Stock Details Stock Data Sector Auto Parts & Equipment BSE Code 531727
BUY CMP 151.00 Target Price 174.00 MENON PISTONS LTD Result Update (PARENT BASIS): Q1 FY16 SEPTEMBER 3 rd, 2015 ISIN: INE650G01011 Stock Details Stock Data Sector Auto Parts & Equipment BSE Code 531727
Hathway Cable and Datacom Limited Investor Update Q2-FY18
 Hathway Cable and Datacom Limited Investor Update Q2-FY18 Safe Harbour The information contained in this presentation is only current as of its date. All actions and statements made herein or otherwise
Blue Star Ltd BUY. Performance Update. CMP Target Price `754 `867. 4QFY2018 Result Update Cons. Durable. 3-year price chart.
 May-15 Aug-15 Nov-15 Feb-16 May-16 Aug-16 Nov-16 Feb-17 May-17 Aug-17 Nov-17 Feb-18 May-18 4QFY2018 Result Update Cons. Durable May 16, 2018 Blue Star Ltd Performance Update 4QFY18 4QFY17 % chg. (yoy)
Rallis India NEUTRAL. Performance Highlights CMP. `215 Target Price - 3QFY2017 Result Update Agrichemical. Investment Period - 3-year price chart
 3QFY2017 Result Update Agrichemical January 25, 2017 Rallis India Performance Highlights Y/E March (` cr) 3QFY2017 2QFY2017 % chg (qoq) 3QFY2016 % chg (yoy) Net sales 326 540 (39.7) 306 6.5 Other income
Earnings Presentation
 G L O B U S S P I R I T S L I M I T E D Q3 & 9M FY18 Earnings Presentation 14 F e b r u a r y 2 0 1 8 2 SAFE HARBOR This presentation contains statements that contain forward looking statements including,
Sub: Disclosure under Regulation 30 of the SEBI (Listing Obligations & Disclosure Requirements) Regulations, 2015
 Regulations, 2015") February 12, 2019 To, The Manager, DCS CRD Corporate Relationship Department, BSE Limited Phiroze Jeejeebhoy Tower, Dalal Street, Mumbai 400 001. Security Cods: 539207 ISIN: INE122R01018 To, The Listing
February 12, 2019 To, The Manager, DCS CRD Corporate Relationship Department, BSE Limited Phiroze Jeejeebhoy Tower, Dalal Street, Mumbai 400 001. Security Cods: 539207 ISIN: INE122R01018 To, The Listing
Greenply Industries Ltd. Result Presentation - Q3 & 9M FY15
 Greenply Industries Ltd Result Presentation - Q3 & 9M FY15 Disclaimer Certain statements in this communication may be forward looking statements within the meaning of applicable laws and regulations. These