KRBL LIMITED. Investor Communication
|
|
|
- Claud White
- 5 years ago
- Views:
Transcription

1 KRBL LIMITED Investor Communication Quarter and Year ended 31 st March 2018
2 CONTENTS 1. Q4 & FY18 Consolidated Financial Overview 2. Business Overview 3. Category Highlights 4. Marketing Initiatives 5. FY18 - Product / Variant Launches 6. Final Dividend 7. Financial Statements 8. Award s and Recognitions
3 Q4 FY18 CONSOLIDATED FINANCIAL OVERVIEW 1. Consolidated revenues stands at Rs. 881 cr. as against Rs. 914 cr. same period previous year EBITDA of Rs. 210 cr. an increase of 18.15% over same period previous year. EBITDA Margin stands at 23.78% as against 19.40% same period previous year. Profit before Tax of Rs. 162 cr. as against Rs. 159 cr. same period previous year Profit after Tax stands at Rs. 95 cr. as against Rs. 109 cr same period previous year. PAT Margin stands at 10.91%. Earnings per equity share of Rs per share as against Rs.4.64 per share same period previous year.
4 FY18 CONSOLIDATED FINANCIAL OVERVIEW 1. Consolidated revenues grew by 3% to Rs cr. 2. Highest ever EBITDA of Rs. 792 cr., an increase of 21% over EBITDA Margin stands at 24% as against 21% in Highest ever Profit before Tax of Rs. 655 cr., an increase of 22% over Highest ever Profit after Tax of Rs. 435 cr., an increase of 9% over PAT Margin stands at 13%. Earnings per equity share of Rs per share as compared to Rs per share in the previous year. 6. Final dividend proposed : 230% on face value i.e. INR 2.3 per share.
5 FY18 CONSOLIDATED FINANCIALS (1/2) Revenue 3,158 3,264 Total Revenue grew by 3% on account of better price realization of rice both in domestic & international market and higher income from power, Furfural oil & Glucose Business. FY 17 FY 18 EBIDTA EBIDTA margins increased from 20.70% in FY17 to 24.27% in FY18. Increase in EBIDTA margins by 356 bps due to strong brand image & better cost controls. FY 17 FY 18 Material cost came down from 70.83% in FY17 to 66.81% in FY18. PBT FY 17 FY 18 Consolidated Profit Before Tax (PBT) grew by 21.85%. PBT margin increased by 305 bps to reach 20.07%. (Rs. In Crore)
6 FY18 CONSOLIDATED FINANCIALS (2/2) ROCE 20.57% 21.14% Return on Capital Employed (ROCE) increased from 20.57% in FY 17 to in FY 18. FY 2017 FY 2018 Sale CAGR (5 Year) 2,080 3,247 5 year Revenue grew at CAGR of 9%. FY 2013 FY EBIDTA CAGR (5 Year) Year EBIDTA increased at CAGR of 21%. FY 2013 FY 2018 (Rs. In Crore)
7 CONTENTS 1. Q4 & FY18 Consolidated Financial Overview 2. Business Overview 3. Category Highlights 4. Marketing Initiatives 5. FY18 - Product / Variant Launches 6. Final Dividend 7. Financial Statements 8. Award s and Recognitions
8 FY BUSINESS OVERVIEW FY 17 FY % 40.00% 65.00% 60.00% INTERNATIONAL DOMESTIC INTERNATIONAL DOMESTIC Contribution of International Business increased from 35% to 40% Domestic contribution came down from 65% to 60%

9 FY BUSINESS OVERVIEW Power Income from sale of electricity has increased by 26% on account pf higher Generation due to first full year operation of 27.3 Mw wind power plant at Gujarat commissioned in FY17. FY 17 FY 18 Furfural & Furfural Alcohol FY 17 FY 18 Total revenue on account of sale of FF & FF Alcohol increased by 124% in FY18 on account of first full year operation of Furfural oil plant which was commissioned in FY17. Glucose 3 FY 17 FY 18 7 Glucose Business Revenue increased by 89% on account with higher production of glucose during the year. (Rs. In Crore)


10 FY BUSINESS OVERVIEW Our belief in green power has seen us emerge as a diversified power generator with interest in Biomass, Wind and Solar Power with total installed capacity of Mw.


11 FY BUSINESS OVERVIEW Domestic owerful an- ndia and nternational istribution ie-ups Distribution tie-up with largest retailers Pan India. International Distribution tie-up with largest retailers globally
12 CONTENTS 1. Q4 FY18 & FY18 and Consolidated FY18 Financial Financial Overview Overview 2. Business Overview 3. Category Highlights 4. Marketing Initiatives 5. FY18 - Product / Variant Launches 6. Final Dividend 7. Financial Statements 8. Award s and Recognitions
13 HIGHLIGHTS OF DOMESTIC MARKET Top 5 Brands (All India Share) (Value-Wise): (%) Top 5 Brands (Share in Metro Market) (Value-Wise): (%) India Gate Peer 1 Peer 2 Peer 3 Peer 4 India Gate Peer 1 Peer 2 Peer 3 Peer 4 Highest all-india (Urban and Rural combined) market share of KRBL Limited In value terms, India Gate Basmati Rice brand enjoys a leading position in the Indian urban and rural areas combined with a 35% market share compared to 32% in the previous year. Highest all-india Metros market share of KRBL Limited In value terms, India Gate Basmati Rice is a dominant brand in Indian Metropolitan area with a 36% market share compared to 32% in the previous year. (Source: AC Nielsen MAT March 2018 data)
14 HIGHLIGHTS OF DOMESTIC MARKET Top 5 Brands (Share in Traditional Market) (Value-Wise): (%) Top 5 Brands (Share in Modern Market) (Value-Wise): (%) India Gate Peer 1 Peer 2 Peer 3 Peer 4 India Gate Peer 1 Peer 2 Peer 3 Peer 4 Highest All India Traditional Trade Market Share of KRBL Limited In value terms, India Gate Basmati Rice brand enjoys a leading position in the Indian traditional trade areas combined with a 33% market share compared to 28% in the previous year. Highest All India Modern Trade Market Share of KRBL Limited In value terms, India Gate Basmati Rice brand enjoys a leading position in the Indian Modern Trade areas combined with a 39% market share compared to 37% in the previous year. (Source: AC Nielsen MAT March 2018 data)
15 INTERNATIONAL BUSINESS Q-4 FY 18 India Gate #1 Indian Basmati brand in UAE: 36% market share; Next peer at 7.7% market share India Gate & Nurjahan #1 & #2 Indian Basmati brand in Qatar with 35.30%. Next peer at 7.1% market share India Gate #1 Premium Indian Basmati brand in Bahrain and Lebanon India Gate dominance in Oman with India Gate and Nurjahan in Indian Basmati Segment India Gate and Bab Al Hind leadership in Kuwait with 19.7% market share India Gate and Bab Al Hind #2 in Indian Basmati white rice segment in Saudi Arabia (Source: AC Nielsen Middle East Period ending December 2016 November 2017), Retail Data, APEDA Data, KRBL Export Data
16 INTERNATIONAL BUSINESS Q-4 FY 18 Dominance in South Africa with a total import share of 29% Nurjahan #1 brand in South Africa Leadership in North Africa with a total import share of 11% with KRBL brands. Dominance in the Australasia region. India Gate # 1 brand in Australia and New Zealand with a total import share of 26% India Gate is the most aspirational brand in Singapore and Hong Kong with a total import share of over 9% India Gate #1 Indian Basmati brand in Canada both in Ethnic and Modern Trade (Source: AC Nielsen Middle East Period ending December 2016 November 2017), Retail Data, APEDA Data, KRBL Export Data
17 CONTENTS 1. Q4 FY18 & FY18 and Consolidated FY18 Financial Financial Overview Overview 2. Business Overview 3. Category Highlights 4. Marketing Initiatives 5. FY18 - Product / Variant Launches 6. Final Dividend 7. Financial Statements 8. Award s and Recognitions


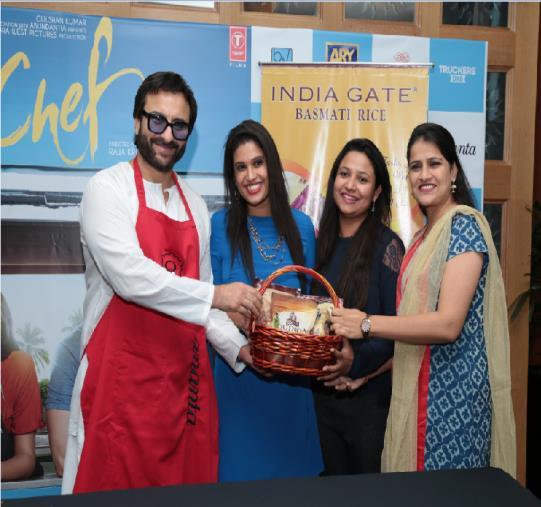
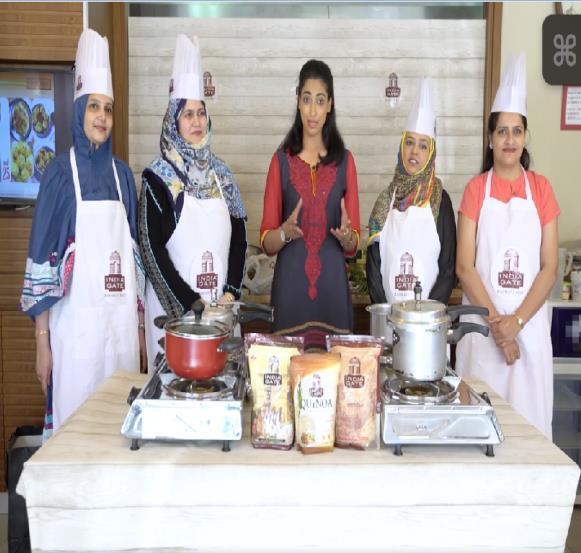
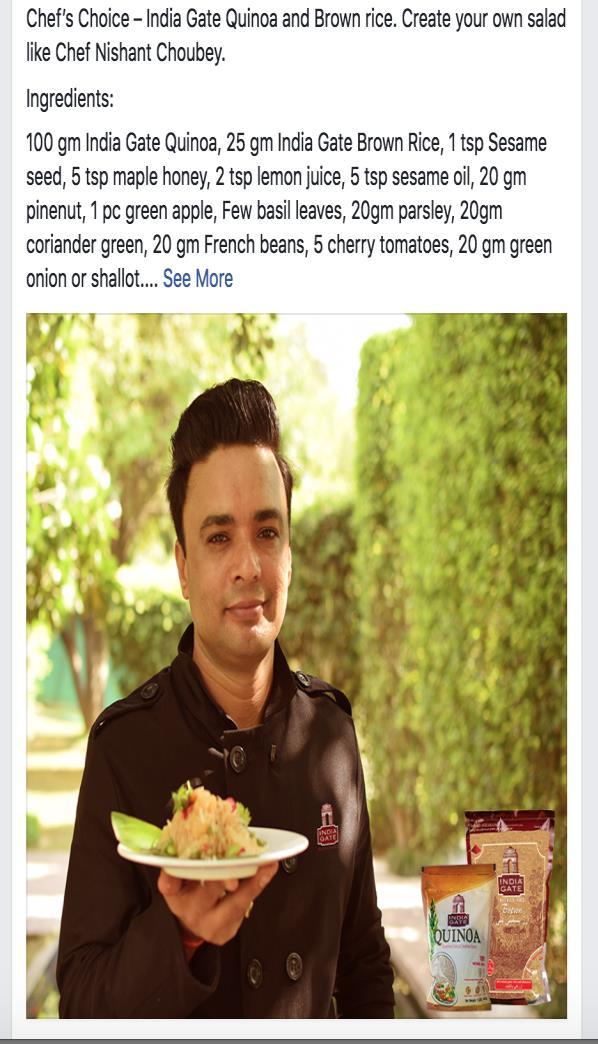
18 MARKETING INITIATIVES - DOMESTIC 2,000,000 views
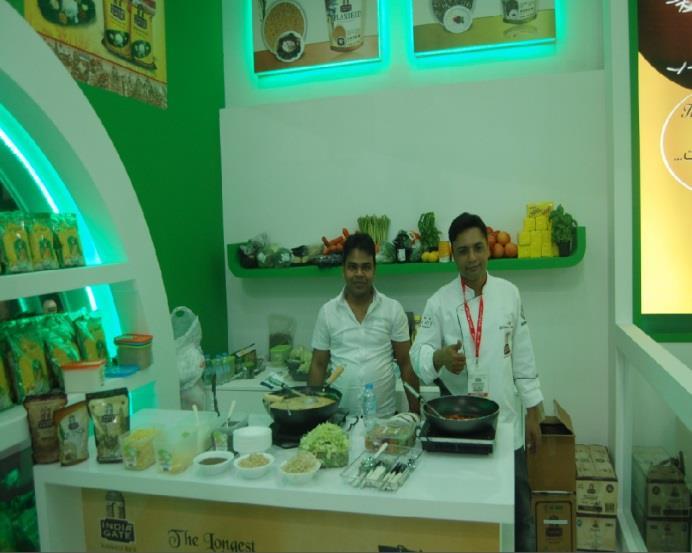

19 MARKETING INITIATIVES - INTERNATIONAL
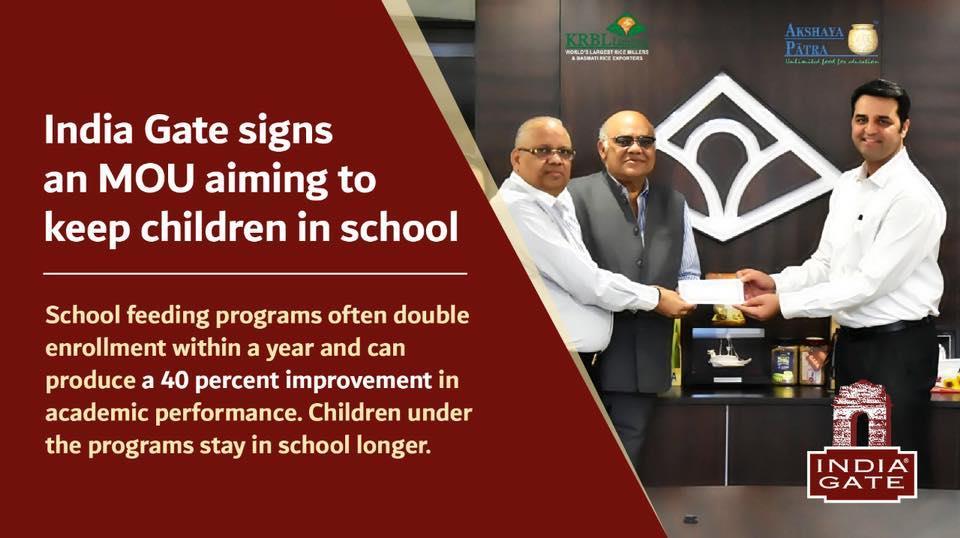


20 OTHER INITIATIVES
21 CONTENTS 1. Q4 FY18 & FY18 and Consolidated FY18 Financial Financial Overview Overview 2. Business Overview 3. Category Highlights 4. Marketing Initiatives 5. FY18 - Product / Variant Launches 6. Final Dividend 7. Financial Statements 8. Award s and Recognitions


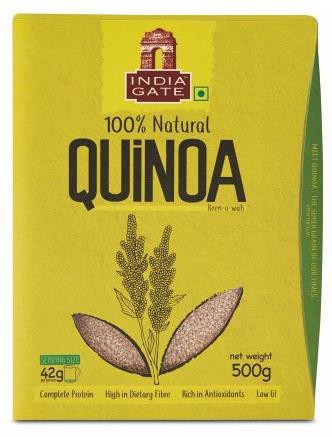
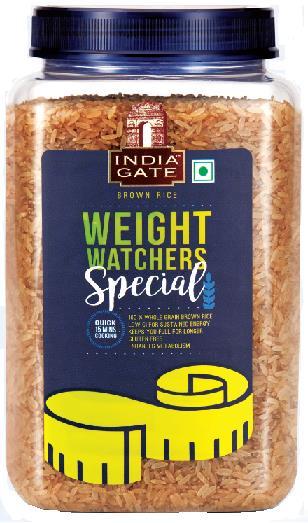
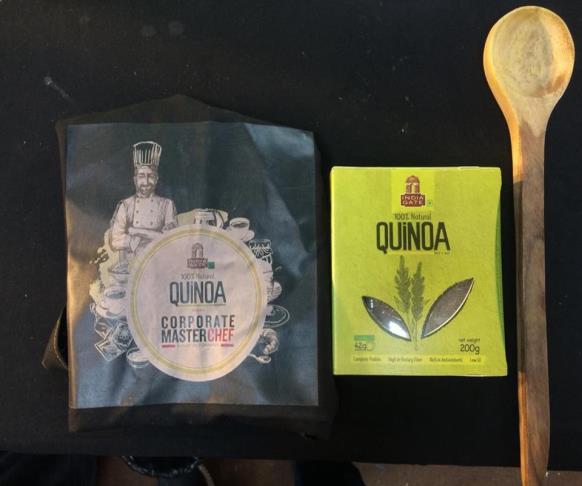
22 PRODUCT / VARIANT LAUNCHED IN FY18
23 CONTENTS 1. Q4 FY18 & FY18 and Consolidated FY18 Financial Financial Overview Overview 2. Business Overview 3. Category Highlights 4. Marketing Initiatives 5. FY18 - Product / Variant Launches 6. Final Dividend 7. Financial Statements 8. Award s and Recognitions
24 FINAL DIVIDEND Dividend Per Share (Rs.) 2.30 Final Dividend Proposed Dividend (in%) 230% Total dividend (Rs cr.) 54.14

25 CONTENTS 1. Q4 FY18 & FY18 and Consolidated FY18 Financial Financial Overview Overview 2. Business Overview 3. Category Highlights 4. Marketing Initiatives 5. FY18 - Product / Variant Launches 6. Final Dividend 7. Financial Statements 8. Award s and Recognitions
26 CONSOLIDATED PROFIT & LOSS (Rs. In Lacs) Particulars Q4 FY 18 Q4 FY 17 YOY(%) FY'18 FY'17 YOY(%) Revenue from operations 87,601 91, % 3,24,652 3,14, % Other Income % 1,754 1, % Total Income 88,125 91, % 3,26,406 3,15, % Expenses Material Cost 59,018 65, % 2,16,917 2,22, % % of Revenue 67.37% 71.53% % 70.83% - Employee expense 2,117 1, % 7,719 7, % % of Revenue 2.42% 2.13% 2.38% 2.27% Advertisement and publicity 1,624 1, % 4,999 4, % % of Revenue 1.85% 1.96% 1.54% 1.55% Other expenses 4,406 4, % 17,568 15, % % of Revenue 5.03% 5.12% 5.41% 4.90% Operating Profit 20,436 17, % 77,449 64, % % of Revenue 23.33% 19.26% 23.86% 20.45% EBITDA 20,960 17, % 79,203 65, % % of Revenue 23.78% 19.40% 24.27% 20.70% Finance costs 3, % 6,924 5, % Depreciation and amortization expense 1,652 1, % 6,778 6, % Profit/(loss) before exceptional items and tax from 16,154 15, % 65,501 53, % continuing operations % of Revenue 18.33% 17.36% 20.07% 17.02% Income tax expense 6,626 4, % 22,057 13, % Profit for the year from continuing operations 9,528 10, % 43,444 39, % % of Revenue 10.81% 11.96% 13.31% 12.65% Total Other Comprehensive Income, net of tax Total Comprehensive income for the period 9,617 10, % 43,461 39, % % of Revenue 10.91% 11.92% 13.32% 12.62% Non Controlling Interest Owners Net Profit for the period / year 9,617 10, % 43,461 39, % % of Revenue 10.91% 11.92% 13.31% 12.62%
27 CONSOLIDATED BALANCE SHEET (1/2) Particulars As at March 31, 2018 (Audited) (Rs. In Lacs) As at March 31, 2017 (Audited) A Assets 1 Non- Current Assets (a) Property, plant and equipment 97,656 1,00,756 (b) Capital work in progress (c) Investment property (d) Goodwill (e) Other Intangible assets (f) Financial assets (i) Loans (ii) Others (g) Prepayments 1,280 1,368 (h) Other non-current Assets 2,267 3,144 Total Non- Current Assets 1,02,369 1,06,916 2 Current Assets (a) Inventories 2,46,272 2,01,996 (b) Financial assets (i) Investments 899 1,011 (ii) Trade receivables 24,410 23,002 (iii) Derivative instrument 2 - (iv) Cash and cash equivalents 3, (v) Bank Balances Other than (iv) above 3, (vi) Loans (vii) Other financial assets 1,348 2,641 (c) Prepayments 1,077 1,258 (d) Other current assets 1,002 4,913 Total Current Assets 2,82,018 2,35,308 Total Assets 3,84,387 3,42,224
28 CONSOLIDATED BALANCE SHEET (2/2) Particulars As at March 31, 2018 (Audited) (Rs. In Lacs) As at March 31, 2017 (Audited) B EQUITY AND LIABILITIES 1 EQUITY (a) Equity share capital 2,354 2,354 (b) Other Equity (i) Equity attributable to shareholders of the company 2,26,436 1,88,378 (ii) Non Controlling Interest Total Equity 2,28,878 1,90,820 2 Non- current liabilities (a) Financial liabilities (i) Borrowings 5,195 8,732 (b) Provisions (c) Deferred Tax Liabilities (net) 13,202 11,378 Total Non- current liabilities 18,987 20,596 3 Current liabilities (a) Financial Liabilities (i) Borrowings 1,16,415 96,505 (ii) Trade payables 9,960 25,417 (iii) Other financial liabilities 3,326 4,292 (b) Other current liabilities 5,202 2,899 (c) Provisions (d) Liability for current tax (net) Total Current liabilities 1,36,522 1,30,808 Total Equity and Liabilities 3,84,387 3,42,224
29 CONTENTS 1. Q4 FY18 & FY18 and Consolidated FY18 Financial Financial Overview Overview 2. Business Overview 3. Category Highlights 4. Marketing Initiatives 5. FY18 - Product / Variant Launches 6. Final Dividend 7. Financial Statements 8. Award s and Recognitions
")


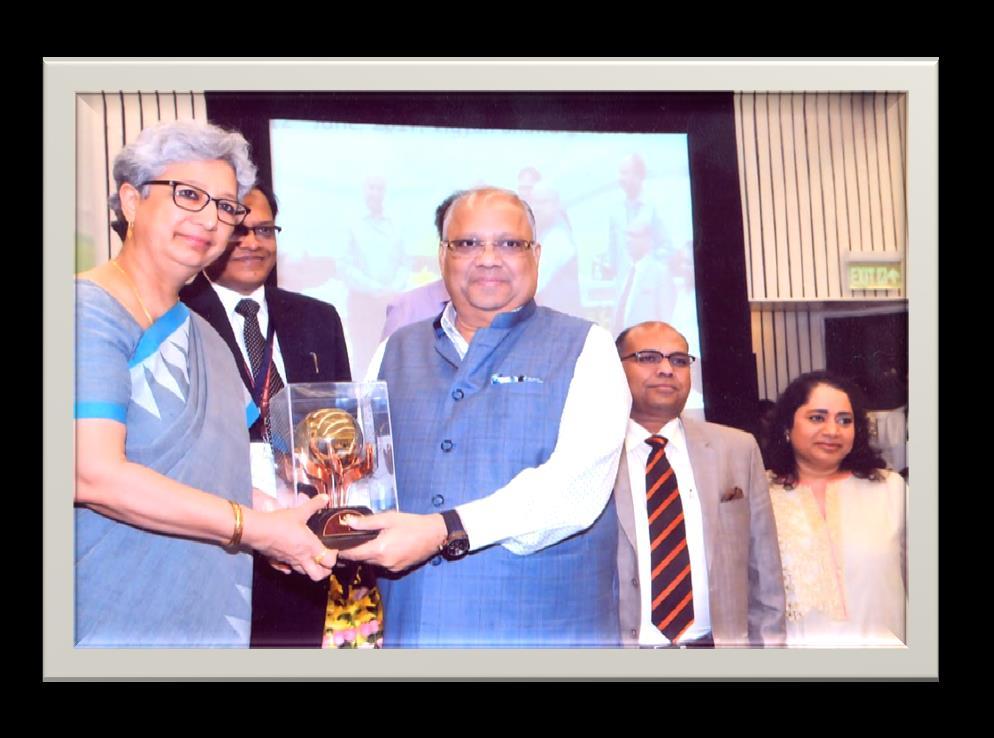
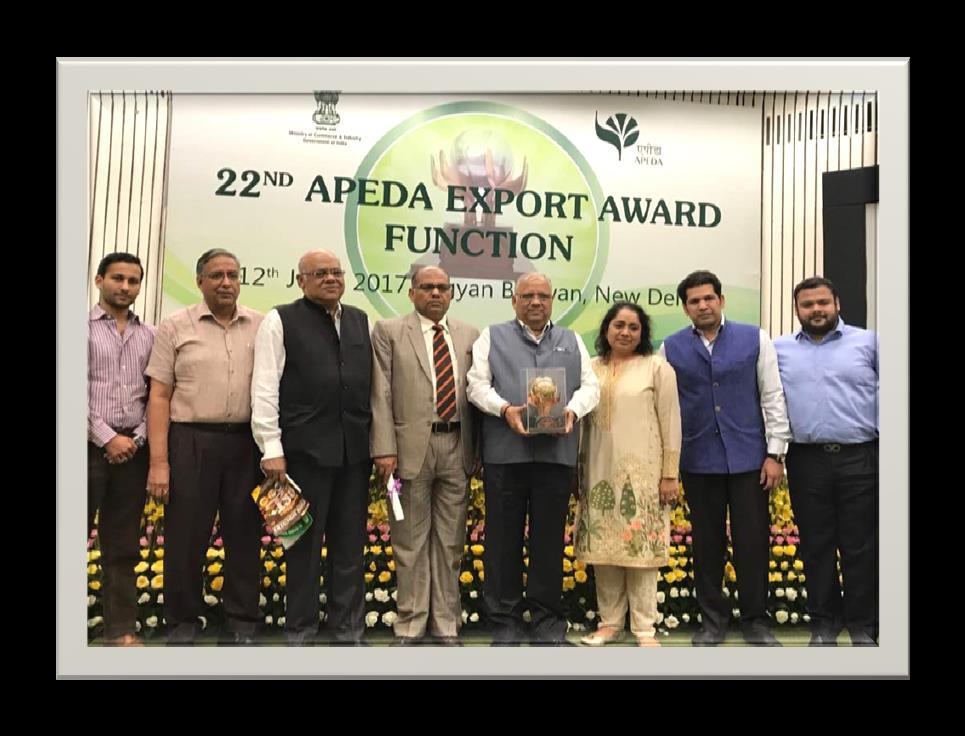
30 AWARD S AND RECOGNITIONS (1/2) KRBL Limited won several awards on account of its contribution to the Industry and its India Gate Basmati Rice as per below:

31 AWARD S AND RECOGNITIONS (2/2)
32
Corporate Presentation July 2017
 Corporate Presentation July 2017 IMPORTANT NOTICE Safe Harbor This presentation contains statements that contain forward looking statements including, but without limitation, statements relating to the
IMPORTANT NOTICE Safe Harbor
 IMPORTANT NOTICE Safe Harbor This presentation contains statements that contain forward looking statements including, but without limitation, statements relating to the implementation of strategic initiatives,
Corporate Presentation September, 2017
 Corporate Presentation September, 2017 Important Notice Safe Harbor This presentation contains statements that contain forward looking statements including, but without limitation, statements relating
E A R N I N G S P R E S E N T A T I O N Q 3 & 9 M, F Y
 R I S E Research Innovation Scale Excellence E A R N I N G S P R E S E N T A T I O N Q 3 & 9 M, F Y 1 8-19 Disclaimer Certain statements in this communication may be forward looking statements within the
KRBL Limited ~ by Abhishek Shete
 KRBL Limited ~ by Abhishek Shete (abhishekshete@aggienetwork.com) Business case for Indian basmati rice Annual global rice production is around 500 Million metric tons (MMT). There is an additional inventory
Q3 FY2012 Market Update
 Q3 FY2012 Market Update 2 Table of Contents 1. Third Quarter FY2012 Financial Results 3 2. Strategic Initiatives 5 3. Company Background 6 4. Management and Board of Directors 7 5. Industry Overview 8
BIOCON GROUP F A C T S H E E T
 BIOCON GROUP F A C T S H E E T March - 2017 BALANCE SHEET (Rs Cr) March 31, 2017 March 31, 2016 ASSETS Non-current assets (a) Property, plant and equipment 3,553 1,681 (b) Capital work-in-progress 533
Greenply Industries Ltd. Results Presentation Q1 FY16
 Greenply Industries Ltd Results Presentation Q1 FY16 Disclaimer Certain statements in this communication may be forward looking statements within the meaning of applicable laws and regulations. These forward-looking
APL APOLLO TUBES LTD.
 APL APOLLO TUBES LTD. Q2 & H1 FY19 Earnings Presentation Infrastructure Construction Automobiles Energy Agriculture November 5, 2018 Safe Harbour Except for the historical information contained herein,
\/ Floor 25, Phiroze Jeejeebhoy Towers Bandra (E)
") 400 110 E: KRBL/BlBHU/STK_EX_1819/38 October 29, 2018 Limited The General Manager National Stock Exchange of India Limited Department of Corporate Services Exchange Plaza, C-1, Block-G BSE Limited Bandra-Kurla
400 110 E: KRBL/BlBHU/STK_EX_1819/38 October 29, 2018 Limited The General Manager National Stock Exchange of India Limited Department of Corporate Services Exchange Plaza, C-1, Block-G BSE Limited Bandra-Kurla
Best ever results: FY 2015
 Best ever results: FY 2015 Total shipments reached 7,664 units, up 6% Net revenues grew 3% (-3% at constant currencies) to Euro 2,854 million Adjusted EBIT 1 of Euro 473 million, 200bps margin increase
Sub: Disclosure under Regulation 30 of the SEBI (Listing Obligations & Disclosure Requirements) Regulations, 2015
 Regulations, 2015") February 12, 2019 To, The Manager, DCS CRD Corporate Relationship Department, BSE Limited Phiroze Jeejeebhoy Tower, Dalal Street, Mumbai 400 001. Security Cods: 539207 ISIN: INE122R01018 To, The Listing
February 12, 2019 To, The Manager, DCS CRD Corporate Relationship Department, BSE Limited Phiroze Jeejeebhoy Tower, Dalal Street, Mumbai 400 001. Security Cods: 539207 ISIN: INE122R01018 To, The Listing
Aster DM Healthcare Ltd
 IPO Note Healthcare Feb 08, 2018 Aster DM Healthcare Ltd Aster DM Healthcare Ltd (ADHL) is one of the largest private healthcare service providers which operates in multiple GCC states and is an emerging
Greenply Industries Ltd. Result Presentation - Q3 & 9M FY15
 Greenply Industries Ltd Result Presentation - Q3 & 9M FY15 Disclaimer Certain statements in this communication may be forward looking statements within the meaning of applicable laws and regulations. These
APL APOLLO TUBES LTD.
 APL APOLLO TUBES LTD. Q3 & 9M FY18 Earnings Presentation Infrastructure Construction Automobiles Energy Agriculture January 25, 2018 Safe Harbour Except for the historical information contained herein,
BUY SIMPLEX INFRASTRUCTURES LTD SYNOPSIS. CMP Target Price FEBRUARY 28 th Result Update (PARENT BASIS): Q3 FY15
: Q3 FY15") BUY CMP 408.40 Target Price 460.00 SIMPLEX INFRASTRUCTURES LIMITED Result Update (PARENT BASIS): Q3 FY15 FEBRUARY 28 th 2015 ISIN: INE059B01024 Index Details Stock Data Sector Construction & Engineering
BUY CMP 408.40 Target Price 460.00 SIMPLEX INFRASTRUCTURES LIMITED Result Update (PARENT BASIS): Q3 FY15 FEBRUARY 28 th 2015 ISIN: INE059B01024 Index Details Stock Data Sector Construction & Engineering
Agenda. Financial Review. Review of Operations. Future Plans and Strategies. Open Forum
 22 October 2009 1 Disclaimer The information contained in this presentation is intended solely for your personal reference. Such information is subject to change without notice, its accuracy is not guaranteed
Interim Results 17 November 2011
 Interim Results 17 November 2011 Alan Parker Executive Chairman First 100 days Considerations: Group leadership and strategy Business model, at home and abroad Customer attraction in different markets
(Rs. in Lacs) Statement of Standalone Unaudited Financial Results for the Quarter and Half Year ended September 30, 2017 Quarter Ended
 Statement of Standalone Unaudited Financial Results for the Quarter and Half Year ended September 30, 2017 Quarter Ended") Statement of Standalone Unaudited Financial Results for the Quarter and September 30, 2017 1 Income 18,425 15,044 12,975 a. Revenue from operations 31,400 30,304 1,043 929 1,265 b. Other Income 2,308 1,464
Statement of Standalone Unaudited Financial Results for the Quarter and September 30, 2017 1 Income 18,425 15,044 12,975 a. Revenue from operations 31,400 30,304 1,043 929 1,265 b. Other Income 2,308 1,464
BUY. KDDL LTD Result Update (PARENT BASIS): Q1 FY16 SYNOPSIS. CMP Target Price AUGUST 22 nd 2015 ISIN: INE291D01011
: Q1 FY16 SYNOPSIS. CMP Target Price AUGUST 22 nd 2015 ISIN: INE291D01011") BUY CMP 280.10 Target Price 322.00 KDDL LTD Result Update (PARENT BASIS): Q1 FY16 AUGUST 22 nd 2015 ISIN: INE291D01011 Index Details Stock Data Sector Other Apparels & Accessories BSE Code 532054 Face
BUY CMP 280.10 Target Price 322.00 KDDL LTD Result Update (PARENT BASIS): Q1 FY16 AUGUST 22 nd 2015 ISIN: INE291D01011 Index Details Stock Data Sector Other Apparels & Accessories BSE Code 532054 Face
PSP Projects Ltd. 1 P a g e. Subscribe with Long Recommendation. Term View BACKGROUND
 Subscribe with Long Recommendation Term View BACKGROUND Price Band Rs. 205 Rs. 210 (PSP) is a multidisciplinary construction company Bidding Date 17 th Sep - 19 th May 2017 Book Running Lead Manager Registrar
Strong Margins, Robust Profitability Quarter I Results, FY EBITDA up 44%, Net profit up 43%
 Strong Margins, Robust Profitability Quarter I Results, FY 2013 14 EBITDA up 44%, Net profit up 43% Mumbai, Aug 7, 2013: Pharma Major, Lupin Ltd. reported its performance for the first quarter ending 30
Bajaj Auto Ltd. CMP: Rs.1426 Recommendation: Buy Target Price: Rs March. 1 P age. 21 st July Key Data Financial Year End
 CMP: Rs.1426 Recommendation: Buy Target Price: Rs.1593 Key Data Financial Year End March Market Cap (Rs. Cr.) 41,241 Market Cap (USD Bn.) 9.2 Free Float Factor 0.49 52 Week H/L 1664.5/1189.6 Avg. 12M volumes
Quarterly Results Q3FY15
 Quarterly Results Q3FY15 13 th February 2015 Safe Harbor Certain statements in these slides are forward-looking statements. These statements are based on management's current expectations and are subject
Transition to IndAS. Impact Assessment of Financial Statements FY16. July 2016
 Transition to IndAS Impact Assessment of Financial Statements FY16 July 2016 Disclaimer The objective of this communication is to provide information on the expected impact of transition to Ind AS on the
IWL: NOI: 37: oa= September, The Secretary BSE Limited Phiroze Jeejeebhoy Towers Limited Dalal Street, Mumbai
 IWL: NOI: 37: 2016 The Secretary BSE Limited Phiroze Jeejeebhoy Towers Limited Dalal Street, Mumbai 400001 Scrip code: 539083 Fax No 022-22723121/2037/39/41/61 Dear Sir, The Secretary National Stock Exchange
Revised Life Underwriting Guidelines FY:
 Revised Life Underwriting Guidelines FY: 2012 2013 Non Medical Limits for ULIPs, Traditional (excluding Term plans) and Guaranteed savings insurance plan (GSIP) A. Male,female and minor/student lives Age
Phillips Carbon Black Limited January 2016
 Phillips Carbon Black Limited www.pcblltd.com January 2016 1 The Group Companies RP- Sanjiv Goenka Group Power & Natural Resources Carbon Black Retail Media & Entertainment Infrastructur e IT & Education
DOLLAR INDUSTRIES LTD
 SECTOR REPORT June 3, 217 Pankaj Kumar pankajr.kumar@kotak.com +91 22 6218 6434 DOLLAR INDUSTRIES LTD PRICE: RS.21 RECOMMENDATION: NOT RATED Dollar Industries Limited was promoted by Dindayal Gupta under
Uncommon sense. April 2009
 Uncommon sense April 2009 Disclaimer This investor presentation has been prepared by Marico Limited ( Marico ) and does not constitute a prospectus or placement memorandum or an offer to acquire any securities.
(Rs. in Lacs) Statement of Unaudited Standalone Financial Results for the Quarter Ended on June 30, 2017 Quarter Ended Sr.
 Statement of Unaudited Standalone Financial Results for the Quarter Ended on June 30, 2017 Quarter Ended Sr.") (Rs. in Lacs) Statement of Unaudited Standalone Financial Results for the on June 30, 2017 1 Income a. Revenue from operations 12,975 15,260 b. Other Income 1,265 535 Total Revenue 14,240 15,795 2 Expenses
(Rs. in Lacs) Statement of Unaudited Standalone Financial Results for the on June 30, 2017 1 Income a. Revenue from operations 12,975 15,260 b. Other Income 1,265 535 Total Revenue 14,240 15,795 2 Expenses
BUY. BAJAJ CORP LIMITED Result Update: Q1 FY14. CMP (Rs) Target Price (Rs) AUGUST 10 th, 2013 HIGHLIGHTS
 Target Price (Rs) AUGUST 10 th, 2013 HIGHLIGHTS") BUY CMP (Rs) 243.00 Target Price (Rs) 268.00 BAJAJ CORP LIMITED Result Update: Q1 FY14 AUGUST 10 th, 2013 ISIN: INE933K01021 Stock Data Sector FMCG BSE Code 533229 Face Value 1.00 52wk. High / Low (Rs.)
BUY CMP (Rs) 243.00 Target Price (Rs) 268.00 BAJAJ CORP LIMITED Result Update: Q1 FY14 AUGUST 10 th, 2013 ISIN: INE933K01021 Stock Data Sector FMCG BSE Code 533229 Face Value 1.00 52wk. High / Low (Rs.)
Symphony Ltd. RESULT UPDATE 31st October 2017
 . RESULT UPDATE 31st October 2017 Oct-14 Apr-15 Oct-15 Apr-16 Oct-16 Apr-17 Oct-17 India Equity Institutional Research II Result Update Q2FY18 II 31st October 2017. CMP INR 1,465 Target INR 1,700 Potential
PEER GROUPS CMP MARKET CAP EPS P/E (X) P/BV(X) DIVIDEND Company Name (Rs.) Rs. in mn. (Rs.) Ratio Ratio (%)
 P/BV(X) DIVIDEND Company Name (Rs.) Rs. in mn. (Rs.) Ratio Ratio (%)") BUY CMP 1025.45 Target Price 1160.00 INDO COUNT INDUSTRIES LTD Result Update (PARENT BASIS): Q2 FY16 DECEMBER 1 st 2015 ISIN: INE483B01018 Index Details Stock Data Sector Textiles BSE Code 521016 Face
BUY CMP 1025.45 Target Price 1160.00 INDO COUNT INDUSTRIES LTD Result Update (PARENT BASIS): Q2 FY16 DECEMBER 1 st 2015 ISIN: INE483B01018 Index Details Stock Data Sector Textiles BSE Code 521016 Face
Investor Presentation February 2016
 Dabur India Ltd Investor Presentation February 2016 FMCG Overview Fourth largest sector in the economy Current size of the Indian FMCG Market is around USD 45 bn Grown at an annual average of 11 per cent
PEER GROUPS CMP MARKET CAP EPS P/E (X) P/BV(X) DIVIDEND Company Name (Rs.) Rs. in mn. (Rs.) Ratio Ratio (%)
 P/BV(X) DIVIDEND Company Name (Rs.) Rs. in mn. (Rs.) Ratio Ratio (%)") BUY CMP 2125.00 Target Price 2330.00 CERA SANITARYWARE LTD Result Update (PARENT BASIS): Q1 FY16 JULY 15 th 2015 ISIN: INE739E01017 Index Details Stock Data Sector Furniture & Furnishing BSE Code 532443
BUY CMP 2125.00 Target Price 2330.00 CERA SANITARYWARE LTD Result Update (PARENT BASIS): Q1 FY16 JULY 15 th 2015 ISIN: INE739E01017 Index Details Stock Data Sector Furniture & Furnishing BSE Code 532443
Pennar Industries Ltd.
 4 Recommendation CMP Target Price Sector Stock Details BUY Rs. 25 Rs.31 Metals Moderate Quarter Pennar Industries has reported a moderate consolidated quarter due to lower demand in the auto, engineering,
Dutron Polymers Limited
 Plastic Products October 30, 2012 *CMP Rs. 24 BSE Code 517437 BSE ID DUTRON High/Low 1Y (Rs.) 28.3/20.2 Average Volume (3M) 17345 Market Cap (Rs. Cr.) 14 Shareholding % Jun-12 Sept-12 Promoters 62.42 62.42
Phillips Carbon Black Limited
 Phillips Carbon Black Limited We Touch Lives Every Moment Investor Presentation October - 217 1 Part of a Dynamic Conglomerate. A Leader in the Industry Company Overview Largest in India and 7 th largest
Phillips Carbon Black Limited. Efficient Growth November 2015
 Phillips Carbon Black Limited Efficient Growth www.pcblltd.com November 2015 1 The Group Companies RP- Sanjiv Goenka Group Power & Natural Resources Carbon Black Retail Media & Entertainment Infrastructure
Hindustan Unilever Ltd.
 Nov-16 Dec-16 Jan-17 Feb-17 Mar-17 Apr-17 May-17 Jun-17 Jul-17 Aug-17 Sep-17 Oct-17 Nov-17. Volume No.. I Issue No. 152 Hindustan Unilever Ltd. December 1, 2017 BSE Code: 500696 NSE Code: HINDUNILVR Reuters
Capacity expansion to drive growth and profitability
 STOCK POINTER Swaraj Engines Ltd. BUY Target Price `656 CMP `41 FY14 PE 6.9x Index Details Sensex 17,853 Nifty 5,39 BSE 1 5,367 Industry Auto parts Scrip Details Mkt Cap (` cr) 59 BVPS (`) 161 O/s Shares
PEER GROUPS CMP MARKET CAP EPS P/E (X) P/BV(X) DIVIDEND Company Name (Rs.) Rs. in mn. (Rs.) Ratio Ratio (%)
 P/BV(X) DIVIDEND Company Name (Rs.) Rs. in mn. (Rs.) Ratio Ratio (%)") BUY CMP 469.40 Target Price 540.00 AVANTI FEEDS LIMITED Result Update (PARENT BASIS): Q2 FY16 DECEMBER 12 th 2015 ISIN: INE871C01012 Index Details Stock Data Sector Food products BSE Code 512573 Face Value
BUY CMP 469.40 Target Price 540.00 AVANTI FEEDS LIMITED Result Update (PARENT BASIS): Q2 FY16 DECEMBER 12 th 2015 ISIN: INE871C01012 Index Details Stock Data Sector Food products BSE Code 512573 Face Value
Narnolia Securities Ltd. RAJEEV ANAND 16-Oct-17
 16-Oct-17 INDUSTRY - Con. Staples Bloomberg Code- BJCOR IN BSE Code - 533229 NSE Code - BAJAJCORP NIFTY - 10167 Company Data CMP 414 Target Price 410 Previous Target Price 410 Upside -1% 52wk Range H/L
EARNINGS PRESENTATION 9M/Q3-FY2018
 EARNINGS PRESENTATION 9M/Q3-FY2018 Executive Summary OVERVIEW Ion Exchange (India) Ltd (Ion Exchange), formed in 1964, is a pioneer in water, waste water treatment & environment solutions and caters to
PEER GROUPS CMP MARKET CAP EPS P/E (X) P/BV(X) DIVIDEND Company Name (Rs.) Rs. in mn. (Rs.) Ratio Ratio (%)
 P/BV(X) DIVIDEND Company Name (Rs.) Rs. in mn. (Rs.) Ratio Ratio (%)") BUY CMP 244.05 Target Price 280.00 KALPATARU POWER TRANSMISSION LTD. Result Update (PARENT BASIS): Q3 FY15 March 2 nd 2015 ISIN: INE220B01022 Index Details Stock Data Sector Heavy Electrical Equipment
BUY CMP 244.05 Target Price 280.00 KALPATARU POWER TRANSMISSION LTD. Result Update (PARENT BASIS): Q3 FY15 March 2 nd 2015 ISIN: INE220B01022 Index Details Stock Data Sector Heavy Electrical Equipment
Asian Granito BUY. Performance Highlights CMP. `270 Target Price `351. Outlook and valuation. 3QFY2017 Result Update Ceramics
 3QFY2017 Result Update Ceramics January 25, 2017 Asian Granito Performance Highlights Quarterly Data (` cr) 3QFY17 3QFY16 % yoy 2QFY17 % qoq Revenue 247 236 4.3 265 (7.1) EBITDA 34 27 25.3 31 7.2 Margin
Presentation. 2013/14 Annual Results. 17 September 2014
 Corporate Presentation 2013/14 Annual Results 17 September 2014 Disclaimer The information contained in this presentation is intended solely for your personal reference. Such information is subject to
Financial Results Analysis Quarter & 9 Months Ended December 31, 2011
 Financial Results Analysis Quarter & 9 Months Ended December 31, 2011 Disclaimer 1 Statements in this document relating to future status, events, or circumstances, including but not limited to statements
IFGL Refractories Limited (Formerly IFGL Exports Limited) Investor Presentation December 2017
 Investor Presentation December 2017") IFGL Refractories Limited (Formerly IFGL Exports Limited) Investor Presentation December 2017 Safe Harbor This presentation and the accompanying slides (the Presentation ), has been prepared by IFGL Refractories
IFGL Refractories Limited (Formerly IFGL Exports Limited) Investor Presentation December 2017 Safe Harbor This presentation and the accompanying slides (the Presentation ), has been prepared by IFGL Refractories
FY 16 IND-AS FINANCIALS
 1 FY 16 IND-AS FINANCIALS 5th August 2016 Analyst Presentation Contents Background FMCG Performance Q1 FY 16 Ind-AS financials Q2FY 16 Ind-AS financials Q3 FY 16 Ind-AS financials Q4FY 16 Ind-AS financials
Company Research. Result Highlights: EBITDA margin improve substantially by 120bps y-o-y: Date:
 Asian Paints Ltd posted strong revenue growth due to festive season. Date: 23.01.2013 Result Highlights: Top-line grows by 18.61% yoy: Asian paints recorded sales of Rs.30371.40 mn against corresponding
Investor Relations Presentation December 2012
 Investor Relations Presentation December 2012 Contents 1. QNB at a Glance 2. QNB Comparative Positioning Qatar and MENA 3. Financial Highlights December 2012 4. Economic Overview 2 QNB at a Glance QNB
Year Ended No. (Unaudited)
") Regd. Office : Survey No. 344-350, Changodar, Sarkhej Bavla Highway, Ahmedabad-382213 UNAUDITED FINANCIAL RESULTS FOR THE QUARTER ENDED 30TH JUNE, 2012 (Rs. In Lacs) Particulars Standalone Sr. Quarter
Regd. Office : Survey No. 344-350, Changodar, Sarkhej Bavla Highway, Ahmedabad-382213 UNAUDITED FINANCIAL RESULTS FOR THE QUARTER ENDED 30TH JUNE, 2012 (Rs. In Lacs) Particulars Standalone Sr. Quarter
TARA JEWELS LIMITED (TJL)
") TARA JEWELS LIMITED (TJL) Date : 7 th May, 2013 Stock Performance Details Background Current Price : Rs. 161.00** Face Value : Rs. 10 per share 52 wk High / Low : Rs. 245.4 / Rs. 160.0 Total Traded Volumes
TARA JEWELS LIMITED (TJL) Date : 7 th May, 2013 Stock Performance Details Background Current Price : Rs. 161.00** Face Value : Rs. 10 per share 52 wk High / Low : Rs. 245.4 / Rs. 160.0 Total Traded Volumes
PRESS RELEASE FINANCIAL RESULTS FOR FOURTH QUARTER & FULL YEAR FY
 PRESS RELEASE FINANCIAL RESULTS FOR FOURTH QUARTER & FULL YEAR FY2016-17 JSPL achieves several firsts & new highs in Q4 Sinter plant & Coke Oven batteries of 4MT expansion of Angul Steel Plant commissioned
Results Presentation November 2015
 Results Presentation November 2015 Safe Harbor This presentation and the accompanying slides (the Presentation ), which have been prepared by Balkrishna Industries Limited (the Company ), have been prepared
Q1 FY Presentation. 07 th Aug 2015
 Q1 FY 2016- Presentation 07 th Aug 2015 DISCLAIMER This presentation and the discussion that follows may contain certain words or phrases that are forward - looking statements, based on current expectations
ZUARI AGRO CHEMICALS LIMITED Investors Presentation Q2 FY 2019
 ZUARI AGRO CHEMICALS LIMITED Investors Presentation Q2 FY 2019 1 DISCLAIMER The views expressed here may contain information derived from publicly available sources that have not been independently verified.
Travel Insurance and Assistance in the Asia-Pacific Region
 Travel Insurance and Assistance in the Asia-Pacific Region Report Prospectus October 2013 Web: www.finaccord.com. E-mail: info@finaccord.com 1 Prospectus contents Page What is the research? What methodology
FY2016 RESULTS. 1 February 2016 to 31 January Inditex continues to roll out its global, fully integrated store and online model.
 FY2016 RESULTS 1 February 2016 to 31 January 2017 Inditex continues to roll out its global, fully integrated store and online model. Strong operating performance: Net sales for FY2016 reached 23.3 billion,
Dabur India Limited Investor Communication
 Dabur India Limited Investor Communication Quarter and Year ended 31 st March 2018 Contents 1. Q4 FY18 and FY18 Overview 2. Category Highlights 3. Business Initiatives 4. FY18 - Product Launches 5. International
Company Secretary; Obligations and Disclosure Requirements) Regulations, 2015 e Earnings Presentation
 Regulations, 2015 e Earnings Presentation") / '» IWL: N01: 21: 2018 18th May, 2018 The Secretary The Secretary BSE Limited National Stock Exchange of India Limited Phiroze Jeejeebhoy Towers Exchange Plaza, Bandra Kurla Complex Dalal Street, Mumbai
/ '» IWL: N01: 21: 2018 18th May, 2018 The Secretary The Secretary BSE Limited National Stock Exchange of India Limited Phiroze Jeejeebhoy Towers Exchange Plaza, Bandra Kurla Complex Dalal Street, Mumbai
Havells India Limited
 Havells India Limited Q3 FY19 {DEC 31, 2018} {Un-Audited Financial Results} We recommend that readers refer to the Havells India financials to get a better appreciation of the business performance. A copy
JOINDRE CAPITAL SERVICES LTD. SEBI REGN NO. INH / INB / INB
 RESEARCH REPORT 14 th Sept 2017 LYPSA GEMS & JEWELLERY LTD NSE : LYPSAGEMS Sector: GEMS & JEWELLERY BSE: 534532 View - BUY CMP : Rs. 39 Target Price: Rs 69 (In next 12 to 15 mths) BUSINESS BACKGROUND Lypsa
BUY ASIAN PAINTS LTD. Result Update (CONSOLIDATED BASIS): Q2 FY16. CMP Target Price OCTOBER 24 th 2015 SYNOPSIS
: Q2 FY16. CMP Target Price OCTOBER 24 th 2015 SYNOPSIS") BUY CMP 856.75 Target Price 945.00 ASIAN PAINTS LIMITED Result Update (CONSOLIDATED BASIS): Q2 FY16 OCTOBER 24 th 2015 ISIN: INE021A01026 Index Details Stock Data Sector Paints BSE Code 500820 Face Value
BUY CMP 856.75 Target Price 945.00 ASIAN PAINTS LIMITED Result Update (CONSOLIDATED BASIS): Q2 FY16 OCTOBER 24 th 2015 ISIN: INE021A01026 Index Details Stock Data Sector Paints BSE Code 500820 Face Value
26 MAY Boustead Singapore Limited / Boustead Projects Limited Joint FY2015 Financial Results Presentation
 26 MAY 2015 Boustead Singapore Limited / Boustead Projects Limited Joint FY2015 Financial Results Presentation Disclaimer This presentation contains certain statements that are not statements of historical
Inox Wind BUY. Performance Highlights. CMP Target Price `390 `505. 2QFY2016 Result Update Capital Goods. 3 year price chart
 2QFY2016 Result Update Capital Goods October 27, 2015 Inox Wind Performance Highlights Quarterly Data (Consolidated) ( ` cr) 2QFY16 2QFY15 % chg (yoy) 1QFY16 % chg (qoq) Revenues 1,008 543 85.6 636 58.6
FY2017 RESULTS. 1 February 2017 to 31 January Inditex continues to roll out its global, fully integrated store and online platform.
 FY2017 RESULTS 1 February 2017 to 31 January 2018 Inditex continues to roll out its global, fully integrated store and online platform. Strong operating performance: Net sales for FY2017 reached 25.3 billion,
PRESS RELEASE FINANCIAL RESULTS FOR THIRD QUARTER & NINE MONTHS FY
 PRESS RELEASE FINANCIAL RESULTS FOR THIRD QUARTER & NINE MONTHS FY 2017-18 Volume & Operating Profit Ramp up Continues Consolidated Revenues up 21% YoY Consolidated EBITDA up 26% YoY JPL EBITDA up 18%
PEER GROUPS CMP MARKET CAP EPS P/E (X) P/BV(X) DIVIDEND Company Name (Rs.) Rs. in mn. (Rs.) Ratio Ratio (%)
 P/BV(X) DIVIDEND Company Name (Rs.) Rs. in mn. (Rs.) Ratio Ratio (%)") BUY CMP 55.30 Target Price 65.00 UMANG DAIRIES LTD Result Update (PARENT BASIS): Q4 FY15 JUNE 17 th 2015 ISIN: INE864B01027 Index Details Stock Data Sector Packaged Foods BSE Code 500231 Face Value 5.00
BUY CMP 55.30 Target Price 65.00 UMANG DAIRIES LTD Result Update (PARENT BASIS): Q4 FY15 JUNE 17 th 2015 ISIN: INE864B01027 Index Details Stock Data Sector Packaged Foods BSE Code 500231 Face Value 5.00
KRBL Ltd. COMPANY REPORT. Buy. Rs.170. Summary. Investment highlights. Nifty: 3911; Sensex: 13566
 COMPANY REPORT Analyst Utpal Choudhury +91-22-6637 1185 utpal.choudhury@idbicapital.com Maitali Shah +91-22-6637 1189 maitali.shah@idbicapital.com Nifty: 3911; Sensex: 13566 Key Stock Data Sector Agro
FY18 Presentation. 14 th November 2017
 Q2 FY18 Presentation 14 th November 2017 Safety & HR 8.0431 Mn Accident free man hours till 30 th September 2017 HRS 1197 9108 Statutory & Regulatory Shareholding pattern in compliance with Regulation
Religare Investment Call
 Q3FY18 Result Update Consumer Durables Symphony Ltd. BUY CMP (Rs) Target Price (Rs) Potential Upside Sensex Nifty Key Stock data BSE Code NSE Code Bloomberg Shares o/s, Cr (FV 2) Market Cap (Rs Cr) 3M
Religare Investment Call
 v-17 Dec-17 Jan-18 Feb-18 Mar-18 Apr-18 May-18 Jun-18 Jul-18 Aug-18 Sep-18 Oct-18 v-18 Q2FY19 Result Update Q2FY19 Result Update BUY CMP (Rs) 5,813 Target Price (Rs) 6,519 Potential Upside 12.1% Sensex
Dilip Buildcon Ltd. 1 P a g e. Stock Details. Dilip Buildcon 2.1% Sensex 0.9%
 Recommendation BUY CMP 889 Target Price 1324 Sector Stock Details Construction-Roads BSE Code 540047 NSE Code Bloomberg Code DBL DBL IN Market Cap (Rs cr) 12162 Free Float (%) 24.4 52- wk HI/Lo (Rs) 1009/217
PTC INDIA LTD. INVESTOR PRESENTATION Q4FY17 & FY17
 PTC INDIA LTD. INVESTOR PRESENTATION Q4FY17 & FY17 DISCLAIMER This presentation and the accompanying slides (the Presentation ), which have been prepared by PTC India Limited (the Company ), have been
Indiabulls Housing Finance Limited Unaudited Financial Results Q3 FY January 22, 2014
 Indiabulls Housing Finance Limited Unaudited Financial Results Q3 FY 2013-14 January 22, 2014 Safe Harbour Statement This document contains certain forward-looking statements based on current expectations
Q4 FY Presentation 26 th May 2016
 Q4 FY 2016- Presentation 26 th May 2016 1 Disclaimer This presentation and the discussion that follows may contain certain words or phrases that are forward - looking statements, based on current expectations
JUBILANT LIFE SCIENCES Q4 & FY2016 RESULTS
 PRESS RELEASE Noida, Tuesday, May 24, 2016 Jubilant Life Sciences Ltd. 1A, Sector 16A, Noida 201301, India Tel.: +91 120 4361000 http://www.jubl.com JUBILANT LIFE SCIENCES Q4 & FY2016 RESULTS JUBILANT
Q3 FY17-18 EARNINGS PRESENTATION. 7 th February 2018
 Q3 FY17-18 EARNINGS PRESENTATION 7 th February 2018 Disclaimer This presentation contains statements that constitute forward looking statements including and without limitation, statements relating to
Va Tech Wabag Ltd. 11 th March, 2014 BUY
 Company Report BROKING DEPOSITORY DISTRIBUTION FINANCIAL ADVISORY Va Tech Wabag Ltd. 11 th March, 2014 BUY CMP Target Price Rs.691.30 Rs.870.00 VA Tech Wabag is Indian multinational player technology focused
Q3 FY2019 Review Note. 7 th February 2019
 Q3 FY2019 Review Note 7 th February 2019 Safe harbour statement Certain statements contained in this document may be statements of future expectations and other forward looking statements that are based
LT Foods BUY. Performance Update. CMP Target Price `92 `128. 3QFY2018 Result Update Media February 12, 2018
 Feb-15 May-15 Aug-15 Nov-15 Feb-16 May-16 Aug-16 Nov-16 Feb-17 May-17 Aug-17 Nov-17 Feb-18 3QFY2018 Result Update Media February 12, 2018 LT Foods Performance Update Y/E March (` cr) 3QFY18 3QFY17 % yoy
LT Foods BUY. Performance Update. CMP Target Price `76 `128. 4QFY2018 Result Update Media
 May- Aug- Oct-15 Jan-16 Apr-16 Jul-16 Oct-16 Jan-17 Apr-17 Jul-17 Oct-17 Jan-18 Apr-18 4QFY2018 Result Update Media May 28, 2018 LT Foods Performance Update (` cr) 4QFY18 4QFY17 % yoy 3QFY18 % qoq Revenue
Preliminary Results Announcement. Year ended December 2002
 Preliminary Results Announcement Year ended December 2002 Financial Highlights Turnover up 9.8m to 133.5m, a 7.9% increase, 12.4% at constant currency Operating margin on continuing operations up from
KEWAL KIRAN CLOTHING LTD. Financial Results Review Q4 FY2018 and fiscal year ended
 KEWAL KIRAN CLOTHING LTD Financial Results Review Q4 FY2018 and fiscal year ended 31.03.2018 Operational Performance: Q4 and FY 2018 Q4 FY 2018 % of Q4 FY 2017 % of FY 2018 % of FY 2017 % of Rs crs sales
H S B C H O L D I N G S P L C HSBC HOLDINGS PLC THE CAPITAL REQUIREMENTS. (Country-by-Country Reporting) REGULATION 2013
 REGULATION 2013") HSBC HOLDINGS PLC THE CAPITAL REQUIREMENTS (Country-by-Country Reporting) REGULATION 2013 31 December 2015 This report has been prepared for HSBC Holdings plc and its subsidiaries (the HSBC Group ) to
HSBC HOLDINGS PLC THE CAPITAL REQUIREMENTS (Country-by-Country Reporting) REGULATION 2013 31 December 2015 This report has been prepared for HSBC Holdings plc and its subsidiaries (the HSBC Group ) to
Phillips Carbon Black Limited
 Phillips Carbon Black Limited We Touch Lives Every Moment Investor Presentation February- 218 1 Part of a Dynamic Conglomerate. Carbon Black Industry Global Overview What is Carbon Black? Global CB demand
BALKRISHNA INDUSTRIES LTD
 Jan-15 Feb-15 Mar-15 Apr-15 May-15 Jun-15 Jul-15 Aug-15 Sep-15 Oct-15 Nov-15 Dec-15 Jan-16 BALKRISHNA INDUSTRIES LTD 8888888888888888888888888888888888888888888888888888888888888888888s.. January19, 2016
Quarterly result- Revenues in line with our Expectations, Profits Disappoint.
 Recommendation HOLD Snapshot CMP (09/06/2010) Rs. 1295 Maruti Suzuki India Limited, a subsidiary of Suzuki Motor Corporation Sector Auto of Japan, is the leader in the Indian car market with 54% market
Voltas BUY. Performance Highlights CMP. `327 Target Price `407. 4QFY2016 Result Update Construction & Eng. Quarterly highlights - Consolidated
 4QFY2016 Result Update Construction & Eng. May 24, 2016 Voltas Performance Highlights Quarterly highlights - Consolidated Y/E March (` cr) 4QFY16 4QFY15 3QFY16 % chg (yoy) % chg (qoq) Net sales 1,876 1,484
VOLTAS LTD PRICE: RS.154 RESULT UPDATE. Numbers are ahead of expectations on account of all-round margin expansion.
 RESULT UPDATE Sanjeev Zarbade sanjeev.zarbade@kotak.com +91 22 6621 6305 VOLTAS LTD PRICE: RS.154 RECOMMENDATION: BUY TARGET PRICE: RS.185 FY10E P/E: 15.8X Numbers are ahead of expectations on account
PEER GROUPS CMP MARKET CAP EPS P/E (X) P/BV(X) DIVIDEND Company Name (Rs.) Rs. in mn. (Rs.) Ratio Ratio (%)
 P/BV(X) DIVIDEND Company Name (Rs.) Rs. in mn. (Rs.) Ratio Ratio (%)") BUY CMP 1750.50 Target Price 1995.00 BAJAJ FINSERV LIMITED (CONSOLIDATED) Result Update: Q1 FY16 SEPTEMBER 26 th, 2015 ISIN: INE918I01018 Index Details Stock Data Sector Financial Services BSE Code 532978
BUY CMP 1750.50 Target Price 1995.00 BAJAJ FINSERV LIMITED (CONSOLIDATED) Result Update: Q1 FY16 SEPTEMBER 26 th, 2015 ISIN: INE918I01018 Index Details Stock Data Sector Financial Services BSE Code 532978
Meghmani Organics Limited (MOL) Q2 & H1FY18 Investor Presentation (November 2017)
 Q2 & H1FY18 Investor Presentation (November 2017)") 1 Meghmani Organics Limited (MOL) Q2 & H1FY18 Investor Presentation (November 2017) Robust performance in Q2, PAT up 78% Net Sales (In Rs mn) EBITDA (In Rs mn) 4,536 up 19% YoY 1,028 Up 29% YoY EBITDA
1 Meghmani Organics Limited (MOL) Q2 & H1FY18 Investor Presentation (November 2017) Robust performance in Q2, PAT up 78% Net Sales (In Rs mn) EBITDA (In Rs mn) 4,536 up 19% YoY 1,028 Up 29% YoY EBITDA
CASTROL INDIA LTD. (CIL)
") RESULT UPDATE Sumit Pokharna sumit.pokharna@kotak.com +91 22 6621 6313 Summary table (Rs mn) CY11E CY12E CY13E Sales 29,816 31,948 33,984 Growth (%) 9.0 7.1 6.4 EBITDA 6,698 8,054 10,304 EBITDA Margin
RESULT UPDATE Sumit Pokharna sumit.pokharna@kotak.com +91 22 6621 6313 Summary table (Rs mn) CY11E CY12E CY13E Sales 29,816 31,948 33,984 Growth (%) 9.0 7.1 6.4 EBITDA 6,698 8,054 10,304 EBITDA Margin
Financial Results CONFERENCE CALL Third Quarter Results. Cesena 14 th November2014. Ended 30 th September 2014
 Financial Results 2014 Third Quarter Results Ended 30 th September 2014 CONFERENCE CALL Cesena 14 th November2014 1. TREVI Group 2. 9M 2014 Financial Results 3. Q&A 4. Appendix Rome (ITALY) Metro Line
Indiabulls Housing Finance Limited Unaudited Financial Results Q1 FY July 18, 2013
 Indiabulls Housing Finance Limited Unaudited Financial Results Q1 FY 2013-14 July 18, 2013 Safe Harbour Statement This document contains certain forward-looking statements based on current expectations
KPIT Cummins Infosystems Ltd
 4 Recommendation HOLD Q1FY13 results above expectations; onsite volume growth of 7%, pricing stable. CMP Target Price Sector Stock Details Rs.126 Rs.137 IT Software products BSE Code 532400 NSE Code Bloomberg
Servcorp Limited Results Presentation
 Servcorp Limited Results Presentation Wednesday 20 February 2013 A.G. Moufarrige, Chief Executive Officer Marcus Moufarrige, Chief Operating Officer Operational Highlights Revenue of $102,668,000 Statutory