Havells India Limited
|
|
|
- Rosalind Strickland
- 5 years ago
- Views:
Transcription
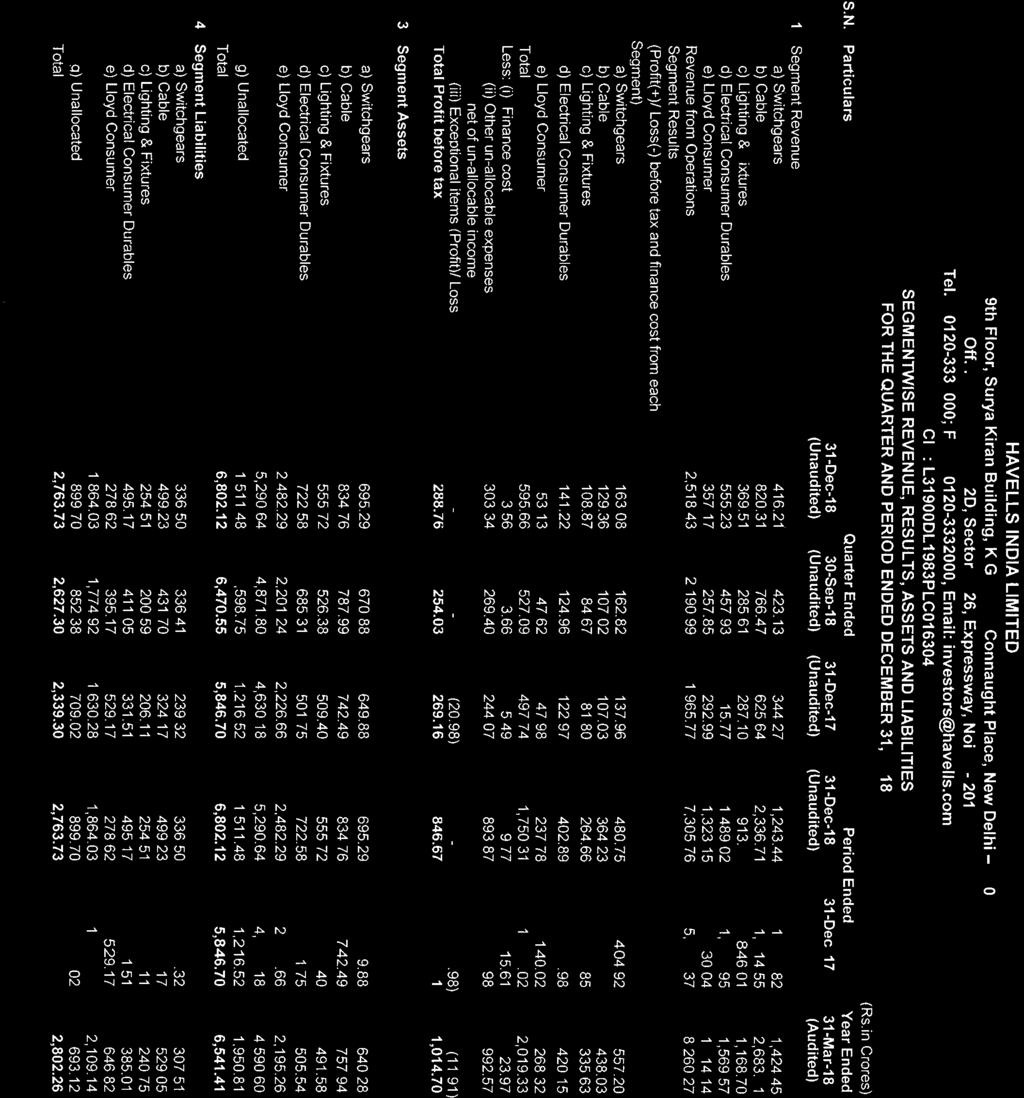
1 Havells India Limited Q3 FY19 {DEC 31, 2018} {Un-Audited Financial Results} We recommend that readers refer to the Havells India financials to get a better appreciation of the business performance. A copy of the latest quarterly/ yearly Financial Results of Havells India Limited are available on Havells website The results are approved by the Board of Directors in their meeting held on 22 nd Jan CIN: L31900DL1983PLC Havells India Limited - 1 -
2 TABLE OF CONTENTS Section 1 Havells India Performance at a glance stand alone 1.1 Summary of Financial Statements- quarterly 1.2 Segment wise net revenue analysis- quarterly 1.3 Segment wise contribution margin analysis- quarterly 1.4 Summary of Financial Statements- nine months 1.5 Segment wise net revenue analysis- nine months 1.6 Segment wise contribution margin analysis- nine months 1.7 Balance Sheet highlights 1.8 Cash flow highlights 1.9 Net Debt 1.10 Financial Ratios Section 2 Shareholders information 2.1 Shareholding Pattern Annexure Financial Results Havells India Limited - 2 -
3 SECTION 1. HAVELLS INDIA (STANDALONE) Table 1.1: P&L Summary (Havells India) Quarterly In crores of Rupees Q3 Q3 Change Q3 Q3 Q3 Q3 Change FY 19 FY 18 % FY 19 FY 18 FY 19 FY 18 % (Havells) (Havells) (Havells) (Lloyd) (Lloyd) (Total) (Total) (Total) Net Revenue 2, , % , , % % % as a % to NR 25.1% 26.9% 14.9% 16.4% 23.7% 25.3% Add: Depreciation / Amortization Less: Advertisement and Sales Promotion % % as a % to NR 3.2% 3.2% 6.1% 8.7% 3.6% 4.0% Less: Other SG&A % % as a % to NR 10.1% 10.4% 8.3% 6.5% 9.9% 9.8% EBIDTA % % as a % to NR 13.2% 15.2% 1.7% 2.9% 11.5% 13.3% Depreciation / Amortization Interest Expense Foreign Exchange (gain)/loss (7.4) (5.4) (3.2) (11.5) (10.6) (16.9) Interest Income (C) Others (D) Add: Other Income (C) + (D) Profit before tax and exceptional items % % as a % to NR 13.1% 13.9% 1.3% 5.1% 11.5% 12.6% Exceptional items Profit before tax % % as a % to NR 13.1% 15.2% 1.3% 5.1% 11.5% 13.7% Tax Net Profit % as a % to NR 7.8% 9.9% Other Comprehensive Income/(Expense) (0.6) (1.4) Total Comprehensive Income Results Summary Growth across verticals and channel broadly maintained sequentially except ECD and Lloyd. Expect to improve in ensuing quarter owing to price increase and receding commodity cost Havells India Limited - 3 -
4 Table 1.2: Business wise net revenue analysis (Havells India) Quarterly In crores of rupees Q3 FY19 Q3 FY18 Change (%) Switchgears % Cables % Lighting & Fixtures % Electrical Cons. Durables % Others* % Sub Total 2, , % Lloyd % Total 2, , % Government led initiative in electrification and infrastructure aiding Switchgear and Cable business Festive season in Q3 enabled growth in Small domestic appliances, water heaters continue to gain market share, overall ECD portfolio sustained growth Others refers to EESL and B2G project business Table 1.3: Business wise contribution margin (as a % of net revenue) analysis (Havells India) Quarterly update Revenue Mix % Q3 FY19 Q3 FY18 Q2 FY19 Revenue Mix % Margins % Margins % Margins % Switchgears 19% % 21% % 38.5% Cables 38% % 37% % 14.0% Lighting & Fixtures 15% % 16% % 29.8% Electrical Cons. Durables 26% % 25% % 27.3% Others 2% % 1% % - Sub Total 100% % 100% % 24.8% Lloyd % % 18.5% Total 100% % 100% % 24.1% by Segment Margins improved sequentially and sustained at normal levels ECD contribution impacted due to delay in passing increased input cost. We expect margins to improve during Q4 in line with the yearly average Lloyd s margins impacted due to increase in material cost and Rupee depreciation Havells India Limited - 4 -
5 Table 1.4: P&L Summary (Havells India): Nine months In crores of Rupees 9M 9M Change 9M 9M 9M 9M Change FY 19 FY 18 % FY 19 FY 18 FY 19 FY 18 % (Havells) (Havells) (Havells) (Lloyd) (Lloyd) (Total) (Total) (Total) Net Revenue 5, , %* 1, , , % 1, , % , , % as a % to NR 25.3% 26.0% 18.0% 16.9% 24.0% 24.6% Add: Depreciation / Amortization Less: Advertisement and Sales Promotion % % as a % to NR 3.2% 3.0% 6.7% 7.3% 3.9% 3.6% Less: Other SG&A % % as a % to NR 10.5% 11.3% 6.3% 6.3% 9.7% 10.6% EBIDTA % % as a % to NR 13.2% 13.6% 6.1% 4.8% 11.9% 12.3% Depreciation / Amortization Interest Expense Foreign Exchange (gain)/loss (12.6) (15.3) 5.7 (14.3) (6.9) (29.6) Interest Income (C) Others (D) Add: Other Income (C) + (D) Profit before tax and exceptional items % % as a % to NR 13.2% 13.0% 4.5% 5.0% 11.6% 11.8% Exceptional items Profit before tax % % as a % to NR 13.2% 13.4% 4.5% 5.0% 11.6% 12.2% Tax Net Profit % as a % to NR 8.0% 8.7% Other Comprehensive Income/(Expense) (1.8) (4.3) Total Comprehensive Income *27% growth, adjusted for excise impact in exempted zones Havells India Limited - 5 -
6 Table 1.5: Business wise net revenue analysis (Havells India): Nine months In crores of rupees 9M FY19 9M FY18 Change (%) Adjusted for excise (%) Switchgears 1, , % 25% Cables 2, , % 28% Lighting & Fixtures % 20% Electrical Cons. Durables 1, , % 39% Others (55%) (55%) Sub Total 5, , % 27% Lloyd 1, %^ 59%^ Total 7, , %^ 31%^ ^ Lloyd revenue in 9M FY18 is from 8 th May 2017 onwards, hence not comparable. Robust revenue growth achievement across segments Table 1.6: Business wise contribution margin analysis (Havells India): Nine months Revenue Mix % 9M FY19 Margins % Revenue Mix % 9M FY18 Margins % Switchgears 21% % 21% % Cables 39% % 38% % Lighting & Fixtures 14% % 15% % Electrical Cons. Durables 25% % 23% % Others 1% % 3% % Sub Total 100% 1, % 100% 1, % Lloyd %^ % Total 100% 1, %^ 100% 1, % Due to transition in tax regime towards GST in FY18, figures for 9M are not strictly comparable ^ Lloyd contribution in 9M FY18 is from 8 th May 2017 onwards, hence not comparable. Havells India Limited - 6 -
7 Table 1.7: Balance Sheet highlights - Standalone As at Dec 18 As at Sep 18 In crores of rupees Unaudited Unaudited ASSETS Non-current assets Property, plant and equipment 1,240 1,245 Capital work in progress Investment property Goodwill Other intangible assets 1,163 1,164 Investment in subsidiaries Financial assets (i) Trade receivables 6 6 (ii) Other financial assets (iii) Other bank balances - - Other non-current assets ,170 3,003 Current assets Inventories 2,070 1,845 Financial assets (i) Trade receivables (ii) Cash and cash equivalents (iii) Other bank balances (iv) Loans 9 9 (iv) Corporate Investment (v) Other financial assets 9 8 Other current assets Assets classified as held for sale ,632 3,467 Total Assets 6,802 6,471 Equity Equity share capital Other equity 3,976 3,781 Non-current liabilities Financial liabilities 4,039 3,844 (i) Borrowings (ii) Other financial liabilities 1 5 Provisions Deferred tax liabilities (Net) Other non-current liabilities Current liabilities Financial liabilities (i) Borrowings (ii) Trade payables 1,425 1,402 (iii) Other financial liabilities Other current liabilities Provisions Current tax liabilities (Net) ,381 2,276 Total Equity and Liabilities 6,802 6,471 Havells India Limited - 7 -
8 Table 1.8: Cash flow highlights - Standalone In crores of rupees Q3 FY19 H1 YTD PBT Exceptional items - - Depreciation Others (25) (44) Working Capital Changes (211) (405) Taxes Paid (59) (97) Operating Net Cash Flow (A) Capex (142) (143) Others 25 3 Net Cash Flow from Investing Activities (B) (117) (140) Dividends paid - (301) Others (3) 4 Net Cash Flow from Financing Activities (C) (3) (297) Net Cash Flow (A+B+C) (91) (351) Opening Cash 1,175 1,526 Closing Cash 1,084 1,175 Capex for the quarter mainly includes Rs. 102 crores for building Lloyd AC plant. There were some additional capex of Rs. 24 crores for capacity expansion in cables Working capital change pertains to higher inventory for the forthcoming AC season and prepayment of few foreign suppliers Havells India Limited - 8 -
9 Table 1.9: Total Net Debt (Havells India Standalone) In crores of rupees Q3 FY19 Q3 FY18 1. Short Term Term loan Total debt Less: Cash 1, Total Net debt (975.5) (678.5) Table 1.10: Financial Ratios (Havells Standalone) Financial Ratios Q3 FY19 Q3 FY18 Profitability OPM (%) 11.5% 13.3% {EBIDTA/NR} ROCE % 31.8% 26.8% {EBITDA TTM/ Avg. CE} RONW % 22.0% 19.7% {PAT TTM/ Avg. NW} Inventory mainly increased in Lloyd and ECD segments to cater for forthcoming season Payable days reduced as some of the foreign currency denominated liabilities were settled before due date in view of depreciating trend in Rupee Liquidity Ratios Current Ratio {CA/CL} Debtors days {Debtors /NR TTM} Inventory days {Inventories /NR TTM} Creditors days {TC /NR TTM} Net working capital days Havells India Limited - 9 -

10 SECTION 2. SHAREHOLDING RELATED INFORMATION Table 2.1: Shareholding Pattern DISCLOSURE OF INFORMATION, COMMUNICATION WITH INVESTORS / ANALYSTS / FINANCIAL COMMUNITY Havells will be issuing fresh information Update, like the one you are reading now; on the day it declares its Quarterly/ Half Yearly Financial Results. Some forward looking statements on projections, estimates, expectations, outlook etc. are included in such updates to help investors / analysts get a better comprehension of the Company's prospects and make informed investment decisions. Actual results may, however, differ materially from those stated on account of factors such as changes in government regulations, tax regimes, economic developments within India and the countries within which the Company conducts its business, exchange rate and interest rate movements, impact of competing products and their pricing, product demand and supply constraints. The information contained in such updates is made public and does not therefore constitute unpublished price sensitive information under the SEBI (Listing Obligations and Disclosure Requirements) Regulations, For further information / clarification, you may contact Mr. Manish Kaushik, GM (Finance) at Havells India Limited, QRG Towers, 2D Sector 126, Expressway, Noida UP (India), Tel: Fax no.: ; ir@havells.com. Havells India Limited


11
12
Havells India Limited
 Havells India Limited Financial Year 2015-16 {MARCH 31, 2016} {Audited Financial Results} We recommend that readers refer to the Havells India financials to get a better appreciation of the business performance.
Havells India. Q1FY18 Result Update Strong Sales growth; Margins decline. Sector: Consumer Durable CMP: ` 467. Recommendation: BUY
 Havells India Q1FY18 Result Update Strong Sales growth; Margins decline Sector: Consumer Durable CMP: ` 467 Recommendation: BUY Market statistics Current stock price (`) 467 Shares O/S (cr.) 62.5 Mcap
Havells India. Q3FY17 Result Update Positive surprise; Maintain Buy. Sector: Consumer Durable CMP: ` 376. Recommendation: BUY.
 Havells India Q3FY17 Result Update Positive surprise; Maintain Buy Sector: Consumer Durable CMP: ` 376 Recommendation: BUY Market statistics Current stock price (`) 376 Shares O/S (cr.) 62.5 Mcap (` cr)
Havells India. Q4FY17 Result Update Strong Sales growth; Margins stable. Sector: Consumer Durable CMP: ` 515. Recommendation: BUY
 Havells India Q4FY17 Result Update Strong Sales growth; Margins stable Sector: Consumer Durable CMP: ` 515 Recommendation: BUY Market statistics Current stock price (`) 515 Shares O/S (cr.) 62.5 Mcap (`
Havells India. Q4FY16 Result Update In-line result; Consistent improvement in performance. Sector: Consumer Durable CMP: ` 342. Recommendation: BUY
 Havells India Q4FY16 Result Update In-line result; Consistent improvement in performance Sector: Consumer Durable CMP: ` 342 Recommendation: BUY Market statistics Current stock price (`) 342 Shares O/S
M&M + MVML Revenue (excluding GST impact) Rs crore
 Rs crore") MAHINDRA & MAHINDRA LIMITED Registered Office: Gateway Building, Apollo Bunder, Mumbai 400 001. Tel: +91 22 22021031, Fax: +91 22 22875485 Website: www.mahindra.com, Email: group.communications@mahindra.com
MAHINDRA & MAHINDRA LIMITED Registered Office: Gateway Building, Apollo Bunder, Mumbai 400 001. Tel: +91 22 22021031, Fax: +91 22 22875485 Website: www.mahindra.com, Email: group.communications@mahindra.com
Quick Heal Technologies Limited
 Quick Heal Technologies Limited Q2 & FY18 Results Update November 2017 1 DISCLAIMER This presentation and the following discussion may contain forward looking statements by Quick Heal Technologies Limited
V-Guard Industries. Q3 & 9M FY2017 Earnings Presentation
 V-Guard Industries Q3 & 9M FY2017 Earnings Presentation Disclaimer Certain statements in this communication may be forward looking statements within the meaning of applicable laws and regulations. These
HT MEDIA GROUP Q2 FY Consolidated Financial Results
 HT MEDIA GROUP Q2 FY 2018-19 Consolidated Financial Results 1 Cautionary Statements Certain statements in this presentation may be forward-looking statements. Such forward looking statements are subject
FY 16 IND-AS FINANCIALS
 1 FY 16 IND-AS FINANCIALS 5th August 2016 Analyst Presentation Contents Background FMCG Performance Q1 FY 16 Ind-AS financials Q2FY 16 Ind-AS financials Q3 FY 16 Ind-AS financials Q4FY 16 Ind-AS financials
BHARAT FORGE LIMITED Analyst Update FY 2018 Results
 BHARAT FORGE LIMITED Analyst Update FY 2018 Results BFL 12 MONTH REPORT FY18 has been a record year for the company with revenue growth surpassing underlying demand growth across sectors and geographies.
Result Update. Havells. Buy
 Result Update Havells Buy Q2 was weak on the margin front with input cost pressures visible. The one bright spot has been the inventory build-up for the festive season in the ECD business, as evident in
Dixon An ISO 9001 : 2008, : 2004 Company Dixon Technologies (India) Ltd.
 Ltd.") Dixon An ISO 9001 : 2008, 14001 : 2004 Company Dixon Technologies (India) Ltd. (Formerly Known as Dixon Technologies (India) Pvt. Ltd ) CIN : L32101 UP1993PLC066581 Regd. Office: B-14 & 15, Phase-IL Noida-201305,
Dixon An ISO 9001 : 2008, 14001 : 2004 Company Dixon Technologies (India) Ltd. (Formerly Known as Dixon Technologies (India) Pvt. Ltd ) CIN : L32101 UP1993PLC066581 Regd. Office: B-14 & 15, Phase-IL Noida-201305,
KEWAL KIRAN CLOTHING LTD. Financial Results Review Q4 FY2018 and fiscal year ended
 KEWAL KIRAN CLOTHING LTD Financial Results Review Q4 FY2018 and fiscal year ended 31.03.2018 Operational Performance: Q4 and FY 2018 Q4 FY 2018 % of Q4 FY 2017 % of FY 2018 % of FY 2017 % of Rs crs sales
Religare Investment Call
 Q3FY18 Result Update Consumer Durables Symphony Ltd. BUY CMP (Rs) Target Price (Rs) Potential Upside Sensex Nifty Key Stock data BSE Code NSE Code Bloomberg Shares o/s, Cr (FV 2) Market Cap (Rs Cr) 3M
Blue Star Ltd BUY. Performance Update. CMP Target Price `703 `867. 1QFY2019 Result Update Cons. Durable. 3-year price chart.
 Aug-15 Oct-15 Dec-15 Feb-16 Apr-16 Jun-16 Aug-16 Oct-16 Dec-16 Jan-17 Apr-17 May-17 Jul-17 Sep-17 Nov-17 Jan-18 Mar-18 May-18 Jul-18 1QFY2019 Result Update Cons. Durable August 10, 2018 Blue Star Ltd Performance
Crompton Greaves Consumer Electricals
 INDUSTRY APPLIANCES CMP (as on 27 July 2017) Rs 209 Target Price Rs 252 Nifty 10,021 Sensex 32,383 KEY STOCK DATA Bloomberg CROMPTON IN No. of Shares (mn) 627 MCap (Rs bn)/(us$ mn) 131/2,046 6m avg traded
CMP* (Rs) 242 Upside/ (Downside) (%) 2. Market Cap. (Rs bn) 157 Free Float (%) 65.6 Shares O/S (mn) 630
 242 Upside/ (Downside) (%) 2. Market Cap. (Rs bn) 157 Free Float (%) 65.6 Shares O/S (mn) 630") 4QFY17 Result Update June 02,2017 Market Cap. (Rs bn) 157 Free Float (%) 65.6 Shares O/S (mn) 630 Decent Performance to Continue; Maintain Crompton Greaves Consumer Electricals (CGCEL) has delivered a
4QFY17 Result Update June 02,2017 Market Cap. (Rs bn) 157 Free Float (%) 65.6 Shares O/S (mn) 630 Decent Performance to Continue; Maintain Crompton Greaves Consumer Electricals (CGCEL) has delivered a
Asian Paints. Source: Company Data; PL Research
 Premium valuations to sustain, Accumulate October 4, 17 Amnish Aggarwal amnishaggarwal@plindia.com +91 Gaurav Jogani gauravjogani@plindia.com +91 8 Rating Accumulate Price Rs1,1 Target Price Rs1,9 Implied
Music Broadcast BUY. Performance Update. CMP Target Price `329 `475. 2QFY2019 Result Update Media. Historical share price chart.
 Mar-17 May-17 Jul-17 Sep-17 Nov-17 Jan-18 Mar-18 May-18 Jul-18 Sep-18 2QFY2019 Result Update Media November 3, 2018 Music Broadcast Performance Update Y/E March (` cr) 2QFY19 2QFY18 % yoy 1QFY19 % qoq
E A R N I N G S P R E S E N T A T I O N Q 3 & 9 M, F Y
 R I S E Research Innovation Scale Excellence E A R N I N G S P R E S E N T A T I O N Q 3 & 9 M, F Y 1 8-19 Disclaimer Certain statements in this communication may be forward looking statements within the
Crompton Greaves Consumer Electricals
 INDUSTRY APPLIANCES CMP (as on 27 Oct 2017) Rs 219 Target Price Rs 268 Nifty 10,323 Sensex 33,157 KEY STOCK DATA Bloomberg CROMPTON IN No. of Shares (mn) 627 MCap (Rs bn)/(us$ mn) 137/2,106 6m avg traded
TTK Prestige. Q2FY18 Result Update Healthy Sales growth; Margins expands. Sector: Consumer Durable CMP: ` 6,145. Recommendation: HOLD
 TTK Prestige Q2FY18 Result Update Healthy Sales growth; Margins expands Sector: Consumer Durable CMP: ` 6,145 Recommendation: HOLD Market statistics Current stock price (`) 6,145 Shares O/S (cr.) 1.2 Mcap
(Rs. in Lacs) Statement of Standalone Unaudited Financial Results for the Quarter and Half Year ended September 30, 2017 Quarter Ended
 Statement of Standalone Unaudited Financial Results for the Quarter and Half Year ended September 30, 2017 Quarter Ended") Statement of Standalone Unaudited Financial Results for the Quarter and September 30, 2017 1 Income 18,425 15,044 12,975 a. Revenue from operations 31,400 30,304 1,043 929 1,265 b. Other Income 2,308 1,464
Statement of Standalone Unaudited Financial Results for the Quarter and September 30, 2017 1 Income 18,425 15,044 12,975 a. Revenue from operations 31,400 30,304 1,043 929 1,265 b. Other Income 2,308 1,464
Voltas. Institutional Equities. Management Meet Update ACCUMULATE. Sector: Capital Goods CMP: Rs309 Target Price: Rs325 Upside: 5% 23 December 2016
 Management Meet Update Institutional Equities Voltas Reuters: VOLT.BO; Bloomberg: VOLT IN We had a meeting with the management of Voltas recently to get the latest business update. While the management
Asian Oilfield Services Limited
 23 December 2015 CMP: Rs.63.2 Industry: Oil and Gas BSE Group/Index: XD Promoters Samara Capital Partners Fund Year of incorporation 1992 Registered office 703, IRIS Tech Park, Tower-A, 7th Floor, Sector
Symphony Ltd. RESULT UPDATE 31st October 2017
 . RESULT UPDATE 31st October 2017 Oct-14 Apr-15 Oct-15 Apr-16 Oct-16 Apr-17 Oct-17 India Equity Institutional Research II Result Update Q2FY18 II 31st October 2017. CMP INR 1,465 Target INR 1,700 Potential
(Rs. in Lacs) Statement of Unaudited Standalone Financial Results for the Quarter Ended on June 30, 2017 Quarter Ended Sr.
 Statement of Unaudited Standalone Financial Results for the Quarter Ended on June 30, 2017 Quarter Ended Sr.") (Rs. in Lacs) Statement of Unaudited Standalone Financial Results for the on June 30, 2017 1 Income a. Revenue from operations 12,975 15,260 b. Other Income 1,265 535 Total Revenue 14,240 15,795 2 Expenses
(Rs. in Lacs) Statement of Unaudited Standalone Financial Results for the on June 30, 2017 1 Income a. Revenue from operations 12,975 15,260 b. Other Income 1,265 535 Total Revenue 14,240 15,795 2 Expenses
HT Media Ltd (NSE: HTMEDIA; BSE: ) Q4 FY2017 Earnings Presentation May 19, 2017
 Q4 FY2017 Earnings Presentation May 19, 2017") HT Media Ltd (NSE: HTMEDIA; BSE: 532662) Q4 FY2017 Earnings Presentation May 19, 2017 1 Table of Contents Particulars Slide no Financial Highlights 3 Financial Overview 6 About Us 14 Contact Us 16 Conference
HT Media Ltd (NSE: HTMEDIA; BSE: 532662) Q4 FY2017 Earnings Presentation May 19, 2017 1 Table of Contents Particulars Slide no Financial Highlights 3 Financial Overview 6 About Us 14 Contact Us 16 Conference
Newgen Software Technologies Ltd
 IPO Note IT Jan 12, 2018 Newgen Software Technologies Ltd Incorporated in 1992, Newgen Software Technologies Limited (NSTL) is a New Delhi based IT company and a global provider of Business Process Management
Visaka Industries Ltd
 Company Update Superior Product Mix & New Age Markets to Aid Growth New investments to aid growth: Visaka continues to give a good set of numbers. YoY EPS grew at 142% aided by a revenue growth of 1.5%
HCC BUY. Infrastructure April 10, QIP step in the right direction EVENT UPDATE. India Research. Bloomberg: HCC IN Reuters: HCNS.
 Jan-14 Mar-14 Apr-14 May-14 Jul-14 Aug-14 Sep-14 Nov-14 Dec-14 Jan-15 India Research Infrastructure April 10, 2015 EVENT UPDATE Bloomberg: IN Reuters: HCNS.BO BUY QIP step in the right direction has successfully
M&M + MVML* Results Q3 F2018 Growth YOY YTD F2018. Revenues and Other Income % 35173
 MAHINDRA & MAHINDRA LIMITED Registered Office: Gateway Building, Apollo Bunder, Mumbai 400 001. Tel: +91 22 22021031, Fax: +91 22 22875485 Website: www.mahindra.com, Email: group.communications@mahindra.com
Recommendation HOLD Dismal performance drags margins Appreciating Japanese Yen, drop in volumes and increase in. Rs. 1,126.
 Recommendation HOLD Dismal performance drags margins Appreciating Japanese Yen, drop in volumes and increase in Rs. 1,126 Raw material costs pulled down Maruti s EBITDA margin to Rs 1,200 6.5% in Q2FY12
V-Guard Industries Ltd 9 th June, 2012
 Company Report BROKING DEPOSITORY DISTRIBUTION FINANCIAL ADVISORY V-Guard Industries Ltd 9 th June, 2012 CMP Rs.215.00 The V-Guard Group has emerged as one of the most trusted brand in India. VGIL plans
Q4 M&M + MVML PAT after (EI) at Rs crore up by 50%
 at Rs crore up by 50%") MAHINDRA & MAHINDRA LIMITED Registered Office: Gateway Building, Apollo Bunder, Mumbai 400 001. Tel: +91 22 22021031, Fax: +91 22 22875485 Website: www.mahindra.com, Email: group.communications@mahindra.com
MAHINDRA & MAHINDRA LIMITED Registered Office: Gateway Building, Apollo Bunder, Mumbai 400 001. Tel: +91 22 22021031, Fax: +91 22 22875485 Website: www.mahindra.com, Email: group.communications@mahindra.com
Bajaj Electricals Ltd.
 4 Recommendation CMP Target Price Sector Stock Details Book Profit Rs. 197 Rs. 178 Consumer Durable Quarterly Analysis Bajaj Electricals has reported a dismal performance where the EBIDTA margin was down
NOIDA, November 01, 2018: Triveni Turbine Limited (TTL), the market leader in
, the market leader in") For immediate release Registered office: A-44, Hosiery Complex, Phase-II, NOIDA 201 305, Uttar Pradesh Corporate office: Express Trade Towers, 8 th floor, Plot No.- 15-16, Sector 16A, Noida 201301 Manufacturing
For immediate release Registered office: A-44, Hosiery Complex, Phase-II, NOIDA 201 305, Uttar Pradesh Corporate office: Express Trade Towers, 8 th floor, Plot No.- 15-16, Sector 16A, Noida 201301 Manufacturing
CDW CORPORATION. Second Quarter 2014 Webcast Conference Call. July 31, investor.cdw.com
 CDW CORPORATION Second Quarter 2014 Webcast Conference Call July 31, 2014 www.cdw.com investor.cdw.com AGENDA 2nd Quarter Results Key Performance Drivers Financial Results Outlook Questions and Answers
Capacity expansion to drive growth and profitability
 STOCK POINTER Swaraj Engines Ltd. BUY Target Price `656 CMP `41 FY14 PE 6.9x Index Details Sensex 17,853 Nifty 5,39 BSE 1 5,367 Industry Auto parts Scrip Details Mkt Cap (` cr) 59 BVPS (`) 161 O/s Shares
Revenues and Other Income Rs. Crore Profit from ordinary activities before tax Rs. Crore
 MAHINDRA & MAHINDRA LIMITED Registered Office: Gateway Building, Apollo Bunder, Mumbai 400 001. Tel: +91 22 22021031, Fax: +91 22 22875485 Website: www.mahindra.com, Email: group.communications@mahindra.com
CMP* (Rs) 208 Upside/ (Downside) (%) 18. Market Cap. (Rs bn) Free Float (%) 65.6 Shares O/S (mn) 630
 208 Upside/ (Downside) (%) 18. Market Cap. (Rs bn) Free Float (%) 65.6 Shares O/S (mn) 630") 1QFY18 Result Update July 28,2017 CMP* (Rs) 208 Bloomberg Ticker CROMPTON IN Market Cap. (Rs bn) 130.6 Free Float (%) 65.6 Shares O/S (mn) 630 Channel De-stocking Impairs Top-line; Recovery Ahead Crompton
1QFY18 Result Update July 28,2017 CMP* (Rs) 208 Bloomberg Ticker CROMPTON IN Market Cap. (Rs bn) 130.6 Free Float (%) 65.6 Shares O/S (mn) 630 Channel De-stocking Impairs Top-line; Recovery Ahead Crompton
Bangalore Fort Farms Limited
 8 February 2016 CMP: Rs. 30.5 Industry: Miscellaneous BSE Group/Index: XT Promoters Revati Holding Private Ltd. Year of incorporation 1965 Registered office 18th K M Stone, Delhi Moradabad Rd, Village
Gillette India. Institutional Equities. 1QFY18 Result Update
 1QFY18 Result Update Institutional Equities Gillette India 14 November 2017 Reuters: GILE.NS; Bloomberg: GILL IN Robust Growth In Operating Margin Gillette India s or GIL s overall top-line performance
Key Highlights. YoY (% change) Q1FY10. QoQ % Particulars 2Q FY10 2Q FY09 Realizations per tone 31,899 53,436-40% 30,462 5% Source: Company
 Q1FY10. QoQ % Particulars 2Q FY10 2Q FY09 Realizations per tone 31,899 53,436-40% 30,462 5% Source: Company") 29th October, 2009 Key Data INR CMP 743 Target Price 646 Earlier target price 481 Bloomberg Code JSTL IN Reuters Code JSTL.BO BSE Code 500228 NSE Code JSWSTEEL Face Value (INR) 10 Market Cap (INR bn) 142
29th October, 2009 Key Data INR CMP 743 Target Price 646 Earlier target price 481 Bloomberg Code JSTL IN Reuters Code JSTL.BO BSE Code 500228 NSE Code JSWSTEEL Face Value (INR) 10 Market Cap (INR bn) 142
Mahindra & Mahindra Ltd.
 Nov-15 Jan-16 Apr-16 Jul-16 Oct-16 Jan-17 Apr-17 Jul-17 Oct-17 Jan-18 Apr-18 Jul-18 Oct-18 2QFY2019 Result Update Automobile November 15, 2018 Mahindra & Mahindra Ltd. Performance Update Y/E March (` cr)
Ahluwalia Contracts (India)
") May-14 Jul-14 Aug-14 Sep-14 Oct-14 Dec-14 Jan-15 Feb-15 Apr-15 May-15 India Research Infrastructure May 22, 215 QUARTERLY REVIEW Bloomberg: AHLU IN Reuters: AHLU.BO BUY Better performance ahead ACIL posted
May-14 Jul-14 Aug-14 Sep-14 Oct-14 Dec-14 Jan-15 Feb-15 Apr-15 May-15 India Research Infrastructure May 22, 215 QUARTERLY REVIEW Bloomberg: AHLU IN Reuters: AHLU.BO BUY Better performance ahead ACIL posted
Power Mech Projects. Institutional Equities. 2QFY18 Result Update BUY. Strong Business Scalability Likely; Retain Buy
 2QFY18 Result Update Power Mech Projects 23 November 217 Reuters: POMP.BO; Bloomberg: POWM IN Strong Business Scalability Likely; Retain Buy Power Mech Projects (PMPL) posted 2QFY18 consolidated revenues
Havells India Limited. June 2015
 Havells India Limited June 2015 INTRODUCTION Havells is a leading electrical consumer product company in India An efficient interplay Higher Market Share Higher Profitability Free Cash Flow Superior Return
Jindal SAW Limited Sector: Iron & Steel Products
 Q4 & FY18 - Results Update Jindal SAW Limited Sector: Iron & Steel Products 28th May 2018 CMP (INR) (As on 25th May 2018) 107.40 Target (INR) 210 Upside(%) 95% Recommendation Strong Buy BSE Code 500378
KPIT CUMMINS INFOSYSTEMS Ltd.
 KPIT CUMMINS INFOSYSTEMS Ltd. Technology Co with Focus on R&D Attractive Valuations 30 th April-2013 Buy Rating with TP `128 Upside 23% 1 KPIT Cummins Infosystems Ltd Stock Data No. of shares : 19.28 cr
Rallis India NEUTRAL. Performance Highlights CMP. `237 Target Price - 1QFY2018 Result Update Agrichemical. Investment Period - 3-year price chart
 Jan-12 Jul-12 Jan-13 Jul-13 Jan-14 Jul-14 Jan-15 Jul-15 Jan-16 Jul-16 Jan-17 1QFY2018 Result Update Agrichemical July 26, 2017 Rallis India Performance Highlights Y/E March (` cr) 1QFY2018 4QFY2017 % chg
Goodyear India ACCUMULATE. Performance Highlights. CMP Target Price `326 `374. 1QCY2012 Result Update Tyres. Key financials
 1QCY212 Result Update Tyres June 6, 212 Goodyear India Performance Highlights Y/E December (` cr) 1QCY212 1QCY211 % chg (yoy) 4QCY211 % chg (qoq) Net sales 331 336 (1.6) 395 (16.2) EBITDA 2 24 (18.6) 34
V-Guard Industries. Institutional Equities. Conference-call Update BUY. Sector: White Goods CMP: Rs914 Target Price: Rs1,109 Upside: 21%
 Conference-call Update Institutional Equities V-Guard Industries 7 November 214 Reuters: VGUA.NS; Bloomberg: VGRD IN We hosted the conference-call of V-Guard Industries (VIL) on 5 November 214 to discuss
Music Broadcast BUY. Performance Update. CMP Target Price `293 `475. 3QFY2019 Result Update Media. Stock Info Sector Market Cap (Rs cr) Media
 Media") Mar-17 May-17 Jul-17 Sep-17 Nov-17 Jan-18 Mar-18 May-18 Jul-18 Sep-18 Nov-18 Jan-19 3QFY2019 Result Update Media January 31, 2019 Music Broadcast Performance Update Y/E March (` cr) 3QFY19 3QFY18 % yoy
Mar-17 May-17 Jul-17 Sep-17 Nov-17 Jan-18 Mar-18 May-18 Jul-18 Sep-18 Nov-18 Jan-19 3QFY2019 Result Update Media January 31, 2019 Music Broadcast Performance Update Y/E March (` cr) 3QFY19 3QFY18 % yoy
Tata Consultancy Services (TCS)
") Jan-16 Jun-16 Nov-16 Apr-17 Sep-17 Feb-18 Jul-18 Dec-18 3QFY2019 Result Update IT January 11, 2019 Tata Consultancy Services (TCS) Performance highlights (` cr) 3QFY19 2QFY19 % chg (QoQ) 3QFY18 % chg (yoy)
Jan-16 Jun-16 Nov-16 Apr-17 Sep-17 Feb-18 Jul-18 Dec-18 3QFY2019 Result Update IT January 11, 2019 Tata Consultancy Services (TCS) Performance highlights (` cr) 3QFY19 2QFY19 % chg (QoQ) 3QFY18 % chg (yoy)
Godrej Consumer Products Limited Transition to Ind AS
 July 13, 2016 Godrej Consumer Products Limited Transition to Ind AS 1 I GCPL I Transition to Ind AS I July 13, 2016 Indian Accounting Standards (Ind AS) implementation timeline Date of transition Ind AS
Rallis India NEUTRAL. Performance Highlights CMP. `242 Target Price - 4QFY2017 Result Update Agrichemical. Investment Period - 3-year price chart
 Jan-12 Jul-12 Jan-13 Jul-13 Jan-14 Jul-14 Jan-15 Jul-15 Jan-16 Jul-16 Jan-17 4QFY2017 Result Update Agrichemical May 2, 2017 Rallis India Performance Highlights Y/E March (` cr) 4QFY2017 3QFY2017 % chg
Financial Performance Q1FY19 Jul 18, 2018
 Financial Performance Q1FY19 Jul 18, 2018 1 Agenda Financial Highlights Business Update Financial Statements Income Statement Balance Sheet Business Analysis Shareholding Pattern 2 Financial Highlights
CMP* (Rs) 1,458 Upside/ (Downside) (%) 10 Bloomberg Ticker. ABB IN Market Cap. (Rs bn) 309 Free Float (%) 25 Shares O/S (mn) 212
 1,458 Upside/ (Downside) (%) 10 Bloomberg Ticker. ABB IN Market Cap. (Rs bn) 309 Free Float (%) 25 Shares O/S (mn) 212") 2QCY17 Result Update July 20, 2017 Market Cap. (Rs bn) 309 Free Float (%) 25 Shares O/S (mn) 212 Well-placed in Power T&D Hi-tech Space; Order Book Remains Robust India s revenue rose by 6.0% YoY to Rs23.3bn
2QCY17 Result Update July 20, 2017 Market Cap. (Rs bn) 309 Free Float (%) 25 Shares O/S (mn) 212 Well-placed in Power T&D Hi-tech Space; Order Book Remains Robust India s revenue rose by 6.0% YoY to Rs23.3bn
Larsen & Toubro. Revenues a positive surprise...so is other income! Q1FY13 Result Update
 Revenues a positive surprise...so is other income! July 23, 2012 Rupa Shah rupashah@plindia.com +91-22-66322244 Rating Accumulate Price Rs1,378 Target Price Rs1,517 Implied Upside 10.1% Sensex 16,877 Nifty
FY18 Presentation. 14 th November 2017
 Q2 FY18 Presentation 14 th November 2017 Safety & HR 8.0431 Mn Accident free man hours till 30 th September 2017 HRS 1197 9108 Statutory & Regulatory Shareholding pattern in compliance with Regulation
SUBSCRIBE To ASTRON PAPER & BOARD MILL LTD. Growing business at reasonable valuation
 SUBSCRIBE To ASTRON PAPER & BOARD MILL LTD. Growing business at reasonable valuation 12th Dec 2017 Salient features of the IPO: Astron Paper and Board Mill Lmt. (APBML), incorporated in 2010, is engaged
Crompton Greaves Consumer Electricals (CROMPTON IN) Rating: BUY CMP: Rs195 TP: Rs276
 Rating: BUY CMP: Rs195 TP: Rs276") Crompton Greaves Consumer Electricals (CROMPTON IN) Rating: BUY CMP: Rs195 TP: Rs276 October 26, 2018 Q2FY19 Result Update Change in Estimates Target Reco Change in Estimates Current Previous FY19E FY20E
Crompton Greaves Consumer Electricals (CROMPTON IN) Rating: BUY CMP: Rs195 TP: Rs276 October 26, 2018 Q2FY19 Result Update Change in Estimates Target Reco Change in Estimates Current Previous FY19E FY20E
Crompton Greaves Consumer Electricals
 INDUSTRY APPLIANCES CMP (as on 26 Oct 2018) Rs 195 Target Price Rs 280 Nifty 10,030 Sensex 33,349 KEY STOCK DATA Bloomberg CROMPTON IN No. of Shares (mn) 627 MCap (Rsbn)/(US$ mn) 123/1,670 6m avg traded
Bajaj Auto Ltd. CMP: Rs.1426 Recommendation: Buy Target Price: Rs March. 1 P age. 21 st July Key Data Financial Year End
 CMP: Rs.1426 Recommendation: Buy Target Price: Rs.1593 Key Data Financial Year End March Market Cap (Rs. Cr.) 41,241 Market Cap (USD Bn.) 9.2 Free Float Factor 0.49 52 Week H/L 1664.5/1189.6 Avg. 12M volumes
Infomerics Valuation And Rating Pvt. Ltd.
 Press Release Intex Technologies (India) Limited January 22, 2019 Ratings Sl. Instrument/Facility No. 1. Long Fund Based Limits 2. Long Debt- Loan 3. Long Non- Fund Based 4. Short Non- Fund Based Total
GMM Pfaudler Limited BUY. Performance Update CMP. `945 Target Price ` QFY2019 Result Update Industrial Machinery. Investment Period 12 Months
 2QFY2019 Result Update Industrial Machinery October 26, 2018 GMM Pfaudler Limited Performance Update Standalone (` cr) Q2FY19 Q2FY18 % yoy Q1FY19 % qoq Net sales 99.2 93.2 29.8% 76.4 6.4% EBITDA 16.0 15.3
1. Executive Summary Chairman s Message Steel Industry Overview Steel Industry Outlook Standalone Financial Performance 7
 Table of Contents 1. Executive Summary 3 2. Chairman s Message 4 3. Steel Industry Overview 5 4. Steel Industry Outlook 6 5. Standalone Financial Performance 7 6. Quarterly Performance Trends 12 7. Graphite
Trident Ltd.: Q1FY18 Result Update
 Jan-16 Feb-16 Mar-16 Apr-16 May-16 Jun-16 Jul-16 Aug-16 Sep-16 Oct-16 Nov-16 Dec-16 Jan-17 Feb-17 Mar-17 Apr-17 May-17 Jun-17 Jul-17 Aug-17 Edelweiss Investment Research Trident Ltd.: Q1FY18 Result Update
Trident Ltd. Buy & Add on dips
 Trident Ltd. Buy & Add on dips 33,351.8 38,689.6 37,553.3 36,656.6 46,944.2 18-Apr-17 18-May-17 18-Jun-17 18-Jul-17 18-Aug-17 18-Sep-17 18-Oct-17 18-Nov-17 18-Dec-17 18-Jan-18 18-Feb-18 18-Mar-18 Trident
Maruti Suzuki. Source: Company Data; PL Research
 Run continues, Royalty reduction positive ; Buy January 29, 2018 Saksham Kaushal sakshamkaushal@plindia.com +91 22 66322235 Poorvi Banka poorvibanka@plindia.com +91 22 66322426 Rating BUY Price Rs9,277
Adani Ports & SEZ Rating: Target price: EPS:
 Adani Ports & SEZ : price: EPS: Volume traction continues in a seasonally good quarter; maintain Adani Ports & SEZ reported a good quarter with total operating revenues (standalone) of Rs. 8.02bn and PAT
MRF BUY. Performance Highlights. CMP `9,407 Target Price `11,343. Company Update Automobile. Key financials
 Company Update Automobile February 22, 212 MRF Performance Highlights Y/E Sept. (` cr) 1QSY12 1QSY11 % chg (yoy) 4QSY11 % chg (qoq) Net sales 2,875 2,167 32.7 2,62 9.8 EBITDA 258 243 5.9 181 42.6 EBITDA
S H Kelkar and Company Limited
 Crafting Sensorial Delight S H Kelkar and Company Limited Largest Indian-origin Fragrance & Flavour Company Q1 FY18 Earnings Presentation August 10, 2017 Disclaimer Certain statements and opinions with
Recommendation HOLD Results in line with our expectations CMP (15/10/2010) Rs Target Rs Sector
 Rs Target Rs Sector") Recommendation HOLD Results in line with our expectations CMP (15/10/2010) Rs. 3212 Target Rs. 3208 Sector IT & Software BSE Code NSE Code Bloomberg Code Market Cap (Rs. cr) Free Float (%) 52- wk HI/Lo
Recommendation HOLD Results in line with our expectations CMP (15/10/2010) Rs. 3212 Target Rs. 3208 Sector IT & Software BSE Code NSE Code Bloomberg Code Market Cap (Rs. cr) Free Float (%) 52- wk HI/Lo
Devine Impex Limited. Key Data (as on 23 December 2015) 23 December 2015
 23 December 2015") 23 December 2015 CMP: Rs.7.4 Industry: Trading BSE Group/Index: Group XT Promoters Rohit Jain and family Year of incorporation 1995 Registered office SCF 103, Chamber No. 7, I Floor, Phase XI, Mohali (S
23 December 2015 CMP: Rs.7.4 Industry: Trading BSE Group/Index: Group XT Promoters Rohit Jain and family Year of incorporation 1995 Registered office SCF 103, Chamber No. 7, I Floor, Phase XI, Mohali (S
Still on track. Exhibit 1: ICT is on track for FY09E
 Country: India Sector: Indian Education Diviya Nagarajan Diviya.Nagarajan@jmfinancial.in Tel: (91 22) 6630 3066 Subhashini Gurumurthy Subhashini.Gurumurthy@jmfinancial.in Tel: (91 22) 6630 3069 Price:
Margin PAT (Rs Margin
 4 Recommendation BUY Best bet at current FMCG space, Attractive Valuations; BUY CMP Rs. 345 ITC posted a good quarter in terms of Net Sales/Gross Profit/EBITDA/PAT increased by 11.8%/13.9%/18.4%/18.2%
Quick take. Ruchira Papers Ltd. BUY. Creating value through paper. Target Price. Investment Period 12 Months. 3 year daily price chart.
 Ltd. Creating value through paper Limited (RPL) manufactures writing paper, printing paper and Kraft paper. The company's white writing and printing paper is used in making notebooks and writing material,
KRBL LIMITED. Investor Communication
 KRBL LIMITED Investor Communication Quarter and Year ended 31 st March 2018 CONTENTS 1. Q4 & FY18 Consolidated Financial Overview 2. Business Overview 3. Category Highlights 4. Marketing Initiatives 5.
L&T Press Release Issued by Corporate Brand Management & Communications
 L&T Press Release Issued by Corporate Brand Management & Communications L&T House, 2 nd Floor, Ballard Estate, Mumbai 400 001 Tel: 91 22 6752 5656 / 836 Fax: 91 22 6752 5796 CIN: L99999MH1946PLC004768
Britannia Industries
 Sustains momentum; Input cost gains peaked out November 09, 2015 Amnish Aggarwal amnishaggarwal@plindia.com +91 22 66322233 Gaurav Jogani gauravjogani@plindia.com +91 22 66322238 Rating Accumulate Price
Healty cigarette-driven growth
 INDUSTRY FMCG CMP (as on 27 Jul 2017) Rs 289 Target Price Rs 353 Nifty 10,021 Sensex 32,383 KEY STOCK DATA Bloomberg ITC IN No. of Shares (mn) 12,161 12,162 MCap (Rs bn)/(us$ mn) 3,509/54,743 6m avg traded
Mahindra & Mahindra. Source: Company Data; PL Research
 Tractors drive Q2 performance; Accumulate November 11, 2016 Rohan Korde rohankorde@plindia.com +91 22 66322235 Rating Accumulate Price Rs1,242 Target Price Rs1,503 Implied Upside 21.0% Sensex 26,819 Nifty
MANPASAND BEVERAGES LTD Result Update (PARENT BASIS): Q2 FY18
: Q2 FY18") MANPASAND BEVERAGES LTD Result Update (PARENT BASIS): Q2 FY18 Index Details Stock Data Sector Non-alcoholic Beverages BSE Code 539207 Face Value 10.00 52wk. High / Low (Rs.) 511.83/253.38 Volume (2wk.
MANPASAND BEVERAGES LTD Result Update (PARENT BASIS): Q2 FY18 Index Details Stock Data Sector Non-alcoholic Beverages BSE Code 539207 Face Value 10.00 52wk. High / Low (Rs.) 511.83/253.38 Volume (2wk.
Preceding 3 months ended 31 December months ended 31 March 2018
 SORIL Holdings and Ventures Limited (Formerly known as Indiabulls Wholesale Services Limited) Statement of audited consolidated financial results for the quarter and year 31 March 2018 3 months 31 March
Tech Mahindra Limited Consolidated Fact Sheet Data. P&L Summary (Rs in Mn)
") Tech Mahindra Limited Consolidated Fact Sheet Data. P&L Summary (Rs in Mn) Particulars FY 2016-17 FY 2017-18 Revenue From Services 69,209 71,674 75,575 74,950 291,408 73,361 76,064 Cost of services 48,807
Tech Mahindra Limited Consolidated Fact Sheet Data. P&L Summary (Rs in Mn) Particulars FY 2016-17 FY 2017-18 Revenue From Services 69,209 71,674 75,575 74,950 291,408 73,361 76,064 Cost of services 48,807
Cummins India Ltd Bloomberg Code: KKC IN
 Company Update Margins Under Pressure; Domestic Recovery Underway Half-yearly revenue was flat; margins were under pressure: Cummins India revenue, EBITDA and PAT for H1FY17 reached to Rs.24,784mn, Rs.4,649mn
Greenply Industries Ltd. Result Presentation - Q3 & 9M FY15
 Greenply Industries Ltd Result Presentation - Q3 & 9M FY15 Disclaimer Certain statements in this communication may be forward looking statements within the meaning of applicable laws and regulations. These
BASF India Limited Q2FY18 Result Analysis
 BASF India Limited Q2FY18 Result Analysis 18 November 2017 CMP (INR): (Nov 17, 2017) 1946.05 Revised Target (INR) 2338 Upside(%) 20% Recommendation : BUY BSE Code 500042 NSE Code BASF Reuters Ticker BASF.BO
ITC. Institutional Equities. 4QFY18 Result Update. Tracking Expectations ACCUMULATE. Sector: FMCG CMP: Rs286 Target Price: Rs290 Upside: 1%
 4QFY18 Result Update Institutional Equities ITC 17 May 2018 Reuters: ITC.NS; Bloomberg: ITC IN Tracking Expectations ITC s growth in 4QFY18 was modest and in line with expectations. On the revenue side,
Havells India BUY. Future Ready -FY18 AR Analysis. 27 June 2018 India Consumer Durables Company Update
 27 June 2018 India Consumer Durables Company Update Havells India BUY Future Ready -FY18 AR Analysis In its FY18 Annual Report, Havells has strongly focused on the role IT has played across the company
Inox Wind BUY. Performance Highlights. CMP Target Price `390 `505. 2QFY2016 Result Update Capital Goods. 3 year price chart
 2QFY2016 Result Update Capital Goods October 27, 2015 Inox Wind Performance Highlights Quarterly Data (Consolidated) ( ` cr) 2QFY16 2QFY15 % chg (yoy) 1QFY16 % chg (qoq) Revenues 1,008 543 85.6 636 58.6
Blue Star Ltd BUY. Performance Update. CMP Target Price `754 `867. 4QFY2018 Result Update Cons. Durable. 3-year price chart.
 May-15 Aug-15 Nov-15 Feb-16 May-16 Aug-16 Nov-16 Feb-17 May-17 Aug-17 Nov-17 Feb-18 May-18 4QFY2018 Result Update Cons. Durable May 16, 2018 Blue Star Ltd Performance Update 4QFY18 4QFY17 % chg. (yoy)
LEEL ELECTRICALS LIMITED (Formerly Lloyd Electric & Engineering Ltd.) June 06, 2018
 June 06, 2018") .. lm, L twai..7, r 1 ENGINEERING AIR LEEL ELECTRICALS LIMITED (Formerly Lloyd Electric & Engineering Ltd.) 159, Okhla Industrial Estate, Phase-III, New Delhi - 1 10 020 (INDIA) Tel. : +91-11-40627200,
.. lm, L twai..7, r 1 ENGINEERING AIR LEEL ELECTRICALS LIMITED (Formerly Lloyd Electric & Engineering Ltd.) 159, Okhla Industrial Estate, Phase-III, New Delhi - 1 10 020 (INDIA) Tel. : +91-11-40627200,
Graphite India BUY. Performance Highlights. CMP Target Price `88 `109. 1QFY2012 Result Update Capital Goods
 1QFY2012 Result Update Capital Goods July 25, 2011 Graphite India Performance Highlights Y/E March (` cr) 1QFY2012 4QFY2011 % chg (qoq) 1QFY2011 % chg (yoy) Net sales 319 303 5.1 258 23.3 EBITDA 61 59
BUY. KDDL LTD Result Update (PARENT BASIS): Q1 FY16 SYNOPSIS. CMP Target Price AUGUST 22 nd 2015 ISIN: INE291D01011
: Q1 FY16 SYNOPSIS. CMP Target Price AUGUST 22 nd 2015 ISIN: INE291D01011") BUY CMP 280.10 Target Price 322.00 KDDL LTD Result Update (PARENT BASIS): Q1 FY16 AUGUST 22 nd 2015 ISIN: INE291D01011 Index Details Stock Data Sector Other Apparels & Accessories BSE Code 532054 Face
BUY CMP 280.10 Target Price 322.00 KDDL LTD Result Update (PARENT BASIS): Q1 FY16 AUGUST 22 nd 2015 ISIN: INE291D01011 Index Details Stock Data Sector Other Apparels & Accessories BSE Code 532054 Face
Q1 M&M + MVML PAT (after EI) at Rs crore up by 67%
 at Rs crore up by 67%") MAHINDRA & MAHINDRA LIMITED Registered Office: Gateway Building, Apollo Bunder, Mumbai 400 001. Tel: +91 22 22021031, Fax: +91 22 22875485 Website: www.mahindra.com, Email: group.communications@mahindra.com
MAHINDRA & MAHINDRA LIMITED Registered Office: Gateway Building, Apollo Bunder, Mumbai 400 001. Tel: +91 22 22021031, Fax: +91 22 22875485 Website: www.mahindra.com, Email: group.communications@mahindra.com
Power Mech Projects. Institutional Equities. 2QFY19 Result Update BUY. Strong Order Book Drives Robust Execution
 2QFY19 Result Update Power Mech Projects 21 November 218 Reuters: POMP.BO; Bloomberg: POWM IN Strong Order Book Drives Robust Execution Power Mech Projects (PMPL) posted 2QFY19 consolidated revenues of