Annual General Meeting
|
|
|
- Eustace Walton
- 5 years ago
- Views:
Transcription

1 Annual General Meeting Presented by: Norman Celliers Chief executive officer 20 June 2014


2
3 FULL YEAR RESULTS Executive summary Feb 13 Feb 14 4Jun 14 Sum of the parts (see through) Sum of the parts per share (see through) 23% R4,164m R4.26 R5,155m R5.26 R5,992m R6.11 Recurring headline earnings Recurring headline earnings per share (cents) 16% R251,1m 25.7 R292,1m 29.8 Headline earnings Headline earnings per share (cents) 28% R196,3m 20.1 R252,5m 25.8
4 BUSINESS DEFINITION Over the past months we havereconfirmed our business definition Long term value investor with a primary focus on Agribusiness, specifically the food and beverage sectors Listed on the JSE ZED hybrid private equity vehicle Key characteristics of investment considerations: Growth sectors or subsectors Management with proven track record High barriers to entry Unique and defendable products (brands) Simple (easy to understand) Scalable business models Focused execution
5 INDUSTRY FOCUS and our investment focus the AGRIBUSINESSindustry with a specific focus on the food and beverage sub sectors. Upstream Midstream Downstream Services and support Inputs Primary production Processing Secondary production Distributionib i Retail Marketing and sales Services and support
6 EXPANDED STRATEGY We have expanded our strategy accordingly. Historically Going forward Industry: Sub sector: Geography: Criteria: Influence: Agribusiness Food and Beverages South Africa (Direct) Rest of World (via portfolio) Arbitrage Undervalued Passive Agribusiness Food and Beverages Bio Fuels Non food (i.e. Rubber, timber) South Africa (Direct) Sub Sahara Africa (Direct) Rest of World (via portfolio) Arbitrage Undervalued Growth sectors Consolidation Passive Active Invest in and build the businesses of tomorrow
7 PORTFOLIO RATIONALISATION Zeder s portfolio has been rationalised to 5 core investments valued at approximately R6b R1 billion CHA SOTP (see through) R5, Jun 14 CS ZA AVL KA Other financial i instruments t Nett Cash Chayton Outspan Senwes Pioneer Tuinroete Agri BKB OVK NWK Suidwes Beleggings Capespan Overberg Agri KLK Agricol MGK KWV Holdings KWV / Capevin Holdings Agri Voedsel Beleggings Kaap Agri
8 CAPITAL REALLOCATION During FY2014investments totaling R879mwere made while R570m was realised through disinvestments from non core exposures. R m Capespan Chayton ZAAD AVL Other Kaap Agri 25 Overberg Suidwes CVH NWK Investments during FY2014 Investments since YE Disposals during FY2014
9 INCREASED INFLUENCE We focused and increased our influence over core portfolio companies % % % Agricol Chayton Capespan AVL Kaap Agri CVH 2.6 Core portfolio Non core portfolio available for sale
10 LARGER INVESTMENTS Each of our core investments now reflect investment values of at least R500m providing an improved balance to portfolio. R m 3,000 2,674 2,000 1, , AVL Capespan Zaad Kaap Agri Chayton Other CVH Cash Liabilities ,000 Core portfolio Cash/assets for sale
11 Despite difficult conditions, Pioneer delivered goodresults for the year ended 30 September 2013 Source: Pioneer Foods FY results presentation


12 and Pioneer has undergone a significant internal realignment and repositioning Source: Pioneer Foods Interim Results presentation


13 and Pioneer released positiveinterim interim results for 6 months (H1) ended 31 March Source: Pioneer Foods Interim Results presentation
14 Capespan delivered solid results for year ended 31 December 2013 with RHEPS increasing by 42,2%.
15 Over 70 years, the Capespan Group has developed two large and complimentary divisions which are increasingly less interdependent. FRUIT LOGISTICS Cartons exported (millions) Profit before tax (R m) 89.7 Non-SA 18.7 Non-SA 20.0 SA 24.9 SA Profit before tax = R88,7m Profit before tax = R89,7m


16 Throughits investment in Golden WingMau Mau, Capespan has established a credible entry into the growing Chinese market. Capespan has 25% interest in Golden Wing Mau Company started trading in Shenzhen in 1997 Delivered Sustained Annual Growth average 35% P.A Procures from 40 Fruit Production Bases in China 15 Regional Packing/ Storage Facilities in Key areas 40 Distribution Centres, covering 80 Cities in China total employees over 2500 Daily provides Fresh Fruit to over 2000 Supermarket outlets throughout China covering consumer market of 500 million people
17 Kaap Agri celebrated its 101 st year and has become a well established, focused business with growth ambitions.


18 Thegroup continues to deliver strong and consistent results.


19 Business activities are focused arounddiversified diversified crops and areas.


20 ZAAD Agricol and KKSB are category leaders spanning a broad product range with complimentary geographical footprints and brands. Strong footprint + Broad product range + Trusted brands Vegetable seeds Forage seeds Pasture seeds Agronomy seeds Horticulture seeds Lucerne seeds Lawn seeds Turf seeds Bird seeds Confectionary seeds


21 ZAAD Zeder believes that Zaad is one of the most exciting companies in its portfolio with a scalable platform for sustainable growth. R millions Recurring Earnings Very good investment to date Capital invested to date ~ R342m Market value of investment ~ R679m HEPS growth encouraging 2012/13 increased by 16% Diluted due to acquisition and rights Significant growth opportunities Geographical expansion Range extention Organic or M&A Klein Karoo Agricol


22 Chayton is the holding company for large scale grain farming and related investments in Africa.
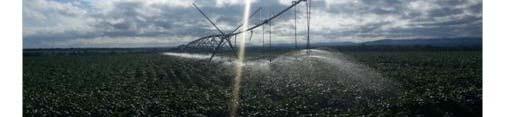
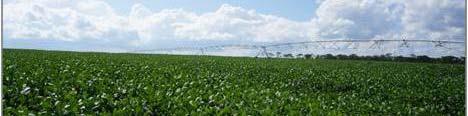
23 4,200irrigated hectares havebeen completed within 24months and additional capacity is currently being added to the farms Irrigated hectares 5,969 6, ,000 4,169 4,769 Operations under control and efficiency 5,369 improvements being bi implemented Harvested yields ahead of budget but wheat pricing weak 4200 y 2, Somawhe 2,597 Somawhe 3,197 Somawhe 3,797 Somawhe 4397 Mkushi Mkushi Mkushi Mkushi 1,572 1,572 1, Solid investment thus far but high entry price Somawhe excellent 1,572 investment that offers opportunity to scale 2015


24 while a leading mill was acquired and has been integrated within the group. Recently acquired Mpongwe Milling in Zambia s Copperbelt Maize and wheat milling operations 50,000 tons of maize and 24,000 tons of wheat milled annually Synergies with the farm operations Offers the opportunity to expand across the value chain hi


25 SIGNIFICANT INFLUENCE Zeder s portfolio investments represent a significant groupwith exciting prospects. Zeder Revenue RHE (%) (R m) (Rm) (R m) (Rm) 14% (30%) 20, % 5, % 7, % % ,866 1,126
26 THANK YOU
Audited results for the year ended 28 February Sum-of-the-parts value per share up 26,7% to R3,99
 Zeder Investments Limited Incorporated in the Republic of South Africa (Registration number: 2006/019240/06) JSE share code: ZED ISIN number: ZAE000088431 ("Zeder" or "the Group" or "the Company") Audited
table of contents Interest in investments 5 Board of directors 7 Chairman s letter 8 Review of operations 12 Corporate governance 18
 annual report 2014 table of contents Interest in investments 5 Board of directors 7 Chairman s letter 8 Review of operations 12 Corporate governance 18 Summary consolidated financial statements 21 Notice
PSG GROUP INTERIM RESULTS AUGUST 2011
 PSG GROUP INTERIM RESULTS AUGUST 2011 Group structure 34.2% 71.3% 42.4% R9bn market cap 33 underlying companies 39,000 people 100% 63.1% 49% 2 2012 Interim results overview Our benchmarks: SOTP and recurring
Investing in the broad agribusiness industry, with a specific focus on the food and beverage sectors.
 Investing in the broad agribusiness industry, with a specific focus on the food and beverage sectors. VIEW THIS REPORT ONLINE AT: WWW.ZEDER.COM ANNUAL REPORT 2013 #GATEFOLD table of contents Interest in
ZEDER IS AN ACTIVE INVESTOR IN THE BROAD AGRIBUSINESS INDUSTRY, WITH A SPECIFIC FOCUS ON THE FOOD AND BEVERAGE SECTORS.
 ANNUAL REPORT 2017 ZEDER IS AN ACTIVE INVESTOR IN THE BROAD AGRIBUSINESS INDUSTRY, WITH A SPECIFIC FOCUS ON THE FOOD AND BEVERAGE SECTORS. VIEW THIS REPORT ONLINE AT WWW.ZEDER.CO.ZA. CONTENTS 2 4 6 10
zeder investments limited
 zeder investments limited Annual report 2011 Annual report 2011 www.zeder.co.za table of contents Group structure 2 Directors 5 Letter to shareholders 6 Review of investments 12 Corporate governance 14
28 February 2017 Results Presentation
 28 February 2017 Results Presentation DNA of PSG Group Financial Capitec PSG Konsult Education Curro FutureLearn (Impak) ITSI Various CSI projects Food & Agri Zeder portfolio Pioneer Foods Capespan Zaad
INTEREST IN INVESTMENTS
 ANNUAL REPORT 2016 CONTENTS 2 4 6 10 20 24 46 IBC Interest in investments Board of directors Chairman s letter Review of operations Corporate governance Summarised consolidated financial statements Notice
Zeder focuses on the agricultural, food, beverages, food processing and related sectors.
 annual report 2009 Contents Directors and group structure 2 Chairman s letter 5 Chief executive officer s report 7 Financial statements 16 Notice of annual general meeting 43 Form of proxy Administration
Interim Results 6 months ended 30 September 2008
 Interim Results 6 months ended 30 September 2008 2008 highlights Revenue + 15.9% Operating profit - 44.6% 3326,7 2871,4 315,7 2177,8 256,9 1915,2 214,2 174,8 2005 2006 2007 2008 2005 2006 2007 2008 Headline
11051_PSG_Group_IAR_FRONT_PG1-45_V5_ _ES. Review of operations
 11051_PSG_Group_IAR_FRONT_PG1-45_V5_20170515_ES Review of operations 24 SOTP VALUE AND RECURRING HEADLINE EARNINGS When evaluating PSG s performance over the short to medium term, we focus on the growth
The two key benchmarks which PSG believes to measure performance by are sum-of-the-parts ( SOTP ) value and recurring headline earnings per share.
 value and recurring headline earnings per share.") PSG Group Limited Incorporated in the Republic of South Africa Registration number: 1970/008484/06 JSE Ltd ( JSE ) share code: PSG ISIN code: ZAE000013017 ( PSG Group or PSG or the company or the group
PSG Group Limited Incorporated in the Republic of South Africa Registration number: 1970/008484/06 JSE Ltd ( JSE ) share code: PSG ISIN code: ZAE000013017 ( PSG Group or PSG or the company or the group
ANNUAL FINANCIAL STATEMENTS FOR THE YEAR ENDED 29 FEBRUARY 2016 REGISTRATION NUMBER: 2006/019240/06
 ANNUAL FINANCIAL STATEMENTS REGISTRATION NUMBER: 2006/019240/06 These annual financial statements were compiled under the supervision of Mr WL Greeff, financial director of the group and Chartered Accountant
INTERIM RESULTS PRESENTATION. August 2013
 INTERIM RESULTS PRESENTATION August 2013 H1 2013 highlights Financial performance Y-o-Y R794m Operating revenue 16% R488m R293m Operating expenses 3% NPAT 191% 341.9 cents EPS 192% 333.2 cents HEPS 36%
Zeder focuses on the agricultural, food, beverages, food
 annual report 2008 CONTENTS Directors 2 Chairman s letter 5 Chief executive officer s report 7 Financial statements 13 Notice of annual general meeting 37 Form of proxy Inserted Administration IBC Zeder
Annual Results Presentation. for the year ended 30 September 2014
 Annual Results Presentation for the year ended 30 September 2014 AGENDA Business Overview Poultry Industry Trends Financial Overview Industry Matters Prospects Q & A 2 2 BUSINESS OVERVIEW 3 THE PERIOD
In US$ million 4Q2017 4Q2016 Change FY2017 FY2016 Change. Revenue 11, , % 43, , %
 NEWS RELEASE WILMAR REPORTS NET EARNINGS OF US$428 MILLION FOR 4Q2017 AND US$1.22 BILLION FOR FY2017 - Strong performance in Oilseeds & Grains - FY2017 EBITDA up 15% to US$2.58 billion - Total dividend
Employees continued. CEO and CFO report
 Employees continued CEO and CFO report 22 CEO and CFO report Dear Stakeholders The two key benchmarks used by PSG Group to measure performance are sum-of-the-parts ( SOTP ) value and recurring earnings
2017 Preliminary Results. 1 March 2018
 1 March 2018 Forward-Looking Statement Any forward-looking statements made in this presentation have been made in good faith based on the information available as of the date of this presentation and are
Managing Director s Address Annual General Meeting of Shareholders - Melbourne Thursday, December 7, 2017 at am. G A Hunt
 Managing Director s Address Annual General Meeting of Shareholders - Melbourne Thursday, December 7, 2017 at 10.00 am G A Hunt Thank you Chairman, and good morning everyone. I would also like to welcome
29 Feb 28 Feb 31 Aug 6 Oct Share 5-year Asset/Liability Rm Rm Rm Rm of total CAGR#
 PSG Group Limited Incorporated in the Republic of South Africa Registration number: 1970/008484/06 JSE Ltd ( JSE ) share code: PSG ISIN code: ZAE000013017 ( PSG Group or PSG or the company or the group
TONGAAT HULETT INTERIM RESULTS FOR THE HALF-YEAR ENDED 30 SEPTEMBER 2011
 1 TONGAAT HULETT INTERIM RESULTS FOR THE HALF-YEAR ENDED 30 SEPTEMBER 2011 Revenue of R6,027 billion (2010: R4,724 billion) +27,6% Profit from operations of R1,047 billion (2010: R963 million) +8,7% Total
Company Presentation 1Q 2014 Results. 30 April 2014
 Company Presentation 1Q 2014 Results 30 April 2014 Presentation Outline 1 Business Overview 2 Plantation Highlights 3 Financial Highlights 4 Strategies and Expansion 2 Section 1 Business Overview 3 Integrated
annual report 2007
 www.zeder.co.za annual report 2007 administration DETAILS OF ZEDER INVESTMENTS LIMITED Registration number 2006/019240/06 Share code: ZED ISIN code: ZAE000088431 CONTENTS Directors 2 Chairman s letter
Group Results Presentation for the six months ended 31 March 2016
 Group Results Presentation for the six months ended 31 March 2016 Index Overview Financial performance Operational performance Outlook 2 Overview Noel Doyle Chief Operating Officer Disclaimer Forward-looking
Annual Results November 2015
 Annual Results 2015 November 2015 Forward looking statements We may make statements that are not historical facts and relate to analyses and other information based on forecasts of future results and estimates
2018 Interim Results 30 August 2018
 2018 Interim Results 30 August 2018 Disclaimer Statements in this presentation with respect to each of Total Produce s and Dole Food Company's ("Dole") business, strategies, projected financial figures,
Company Presentation 1Q 2013 Results 29 April Company Presentation 4Q and FY 2012 Results. 27 Feb 2013
 Company Presentation 1Q 2013 Results 29 April 2013 Company Presentation 4Q and FY 2012 Results 27 Feb 2013 Presentation Outline 1 Plantation Highlights 2 Financial Highlights Click to edit Master title
Investment for Growth. AGM May 2013
 Investment for Growth AGM 2013 22 May 2013 Forward-Looking Statement Any forward-looking statements made in this presentation have been made in good faith based on the information available as of the date
ANNUAL GENERAL MEETING 22 JUNE 2018 SPIER WINE ESTATE, STELLENBOSCH
 ANNUAL GENERAL MEETING 22 JUNE 2018 SPIER WINE ESTATE, STELLENBOSCH NOTE FROM THE CHAIRMAN 22 JUNE 2018 SPIER WINE ESTATE, STELLENBOSCH Firstly, a word of thanks To all our clients, shareholders, family
ABSA Bank and JSE Showcase. 11 April 2013
 ABSA Bank and JSE Showcase 11 April 2013 Group Overview Largest independent electrical distributor in Sub-Saharan Africa Focused on electrical and lighting products Supply across all major market segments
Year-end Results.
 2013 Year-end Results www.jse.co.za Operating environment 2013 a year of mixed signals at a macro level Definite sense that we are not yet out of the woods globally But companies are beginning to learn
INTERIM RESULTS PRESENTATION
 INTERIM RESULTS PRESENTATION for the six months ended 31 March 2016 Agenda Strategic Update Financial Performance Divisional Performance Outlook and Imperatives 1 Strategic Update Phil Roux CEO 2 Environmental
ABRIDGED GROUP INCOME STATEMENT R'000 R'000. Share of profit of associate
 Capevin Holdings Limited Incorporated in the Republic of South Africa Registration number: 1997/020857/06 JSE share code: CVH ISIN number: ZAE000167714 ("Capevin Holdings" or "the company" or "the group")
Company Presentation 1Q 2012 Results. 30 April 2012
 Company Presentation 1Q 2012 Results 30 April 2012 Presentation Outline 1 Plantation Highlights 2 Financial Highlights 3 Strategies and Expansion 4 Appendix 1 1 Section 1 Plantation Highlights g 2 Planted
TONGAAT HULETT AUDITED RESULTS FOR THE YEAR ENDED 31 MARCH 2013
 1 TONGAAT HULETT AUDITED RESULTS FOR THE YEAR ENDED 31 MARCH 2013 Revenue of R14,373 billion (2012: R12,081 billion) +19,0% Profit from operations of R2,145 billion (2012: R1,921 billion) +11,7% Cash flow
Annual General Meeting
 Annual General Meeting 18 May 2012 Disclaimer Forward Looking Statements Any forward-looking statements made in this presentation have been made in good faith based on the information available as of the
Tiger Brands Limited. Group Results Presentation. for the year ended 30 September 2015
 Tiger Brands Limited Group Results Presentation for the year ended 30 September 2015 2 Index Strategic review 3 Strategic review Peter Matlare Chief Executive Officer 4 Key strategic deliverables 1 Improve
2011 Annual Results. November 2011
 2011 Annual Results November 2011 1 Agenda Highlights Group results Operational review Strategic review 2 Highlights HEPS from continuing operations up 21% Dividend increased by 30% to 108 cents per share
FINANCIAL RESULTS. for the twelve months ending 31 March 2015
 FINANCIAL RESULTS for the twelve months ending 31 March 2015 AGENDA 1. Introduction 2. Financial Overview 3. Market overview 4. Strategic Response 5. Prospects 2 GROUP OVERVIEW Gavin Dalgleish, Managing
Company Presentation 2Q and 1H 2012 Results. 15 Aug 2012
 Company Presentation 2Q and 1H 2012 Results 15 Aug 2012 Presentation Outline 1 Plantation Highlights 2 Financial Highlights 3 Strategies and Expansion 4 Appendix 1 1 Section 1 Plantation Highlights g 2
TONGAAT HULETT AUDITED RESULTS FOR THE YEAR ENDED 31 MARCH 2011
 1 TONGAAT HULETT AUDITED RESULTS FOR THE YEAR ENDED 31 MARCH 2011 Revenue of R9,681 billion (2010: R8,789 billion) Profit from operations of R1,338 billion (2010: R1,500 billion) Headline earnings of R806
GROUP RESULTS PRESENTATION For the year ended 30 September 2017
 GROUP RESULTS PRESENTATION For the year ended 30 September 2017 Index Overview Financial & operational performance Strategy update 2 Disclaimer Forward-looking statement This document contains forward
REVIEWED PRELIMINARY CONSOLIDATED FINANCIAL RESULTS FOR THE YEAR ENDED 28 FEBRUARY 2017
 PSG Group Limited Incorporated in the Republic of South Africa Registration number: 1970/008484/06 JSE Ltd ( JSE ) share code: PSG ISIN code: ZAE000013017 ( PSG Group or PSG or the company or the group
Interim Results. Six months ended 31 August 2016
 Interim Results Six months ended 31 August 2016 Stefanutti Stocks City A multi-disciplinary construction group (Vision) (Mission) 2 www.stefanuttistocks.com y 2 Agenda Six month overview Operational Overview
Exploring Opportunities in Emerging Markets. Opportunities in the Agribusiness sector June 14, 2012
 Exploring Opportunities in Emerging Markets Opportunities in the Agribusiness sector June 14, 2012 Agribusiness: Supporting the Entire Value Chain Goal : deliver development impact along the global agri-supply
STRATEGIC PROGRESS LEADS TO RECORD RESULTS FOR OLAM IN FY2011
 NEWS RELEASE Olam International Limited 9 Temasek Boulevard #11-02 Suntec Tower Two Singapore 038989 telephone 65 63394100 facsimile 65 63399755 Website www.olamonline.com Regn no. 199504676-H STRATEGIC
ANNUAL RESULTS PRESENTATION. for the year ended 30 September 2016
 ANNUAL RESULTS PRESENTATION for the year ended 30 September 2016 What a year!! Salient Features: Massive discontinuities Drought Rand volatility Wheat duty So Portfolio and brand strength matters (size
Select Harvests Limited ( SHV )
") Select Harvests Limited ( SHV ) 2016 Annual General Meeting Growing Together 25 November 2016 Disclaimer & Basis of Preparation This presentation is provided for information purposes only and has been
Select Harvests Limited ( SHV ) 2016 Annual General Meeting Growing Together 25 November 2016 Disclaimer & Basis of Preparation This presentation is provided for information purposes only and has been
KAP INDUSTRIAL HOLDINGS LIMITED UNAUDITED RESULTS FOR THE SIX MONTHS ENDED 31 DECEMBER 2018
 KAP INDUSTRIAL HOLDINGS LIMITED INTEGRATED INTO EVERY DAY INTRODUCTION JAAP DU TOIT CHAIRMAN AGENDA INTRODUCTION JAAP DU TOIT UNAUDITED INTERIM RESULTS FOR THE SIX STRATEGY MONTHS IMPLEMENTATION ENDED
Investor Presentation September 2011
 Investor Presentation September 2011 For further information contact: 1 aston.swift@intertek.com sarah.ogilvie@intertek.com +44 (0)20 7396 3400 Cautionary statement regarding forward-looking statements
Sowing the seeds of tomorrow.
 Sowing the seeds of tomorrow. July 2007 1 Outline of Presentation Financial overview The Emerging Tata Chemicals 2 FINANCIAL OVERVIEW 3 Financials Revenue growth 5810* 6,000 in Rs. crore 5,000 0% 4 GR
TONGAAT HULETT INTERIM RESULTS FOR THE SIX MONTHS ENDED 30 SEPTEMBER 2017
 1 TONGAAT HULETT INTERIM RESULTS FOR THE SIX MONTHS ENDED 30 SEPTEMBER 2017 Revenue of R8,118 billion (2016: R8,503 billion) - 4,5% Operating profit of R1,471 billion (2016: R1,350 billion) +9,0% Headline
LISTING OF KAAP AGRI ON THE MAIN BOARD OF THE JSE LIMITED ( JSE ) AND ABRIDGED PRE- LISTING STATEMENT
 AND ABRIDGED PRE- LISTING STATEMENT") KAAP AGRI LIMITED (Incorporated in the Republic of South Africa) (Registration number 2011/113185/06) Share code: KAL, ISIN: ZAE000244711 ( Kaap Agri or the Company ) LISTING OF KAAP AGRI ON THE MAIN BOARD
KAAP AGRI LIMITED (Incorporated in the Republic of South Africa) (Registration number 2011/113185/06) Share code: KAL, ISIN: ZAE000244711 ( Kaap Agri or the Company ) LISTING OF KAAP AGRI ON THE MAIN BOARD
OPERATIONS AND FINANCIAL REVIEW
 MEWAH INTERNATIONAL INC. ANNUAL REPORT 2015 13 OPERATIONS AND FY 2013 FY 2014 FY 2015 INCOME STATEMENT Revenue 3,194 3,439 2,675 Operating margin 115.5 94.6 94.2 Profit after tax 20.9 2.7 6.5 Earnings
REVIEWED PRELIMINARY CONSOLIDATED FINANCIAL RESULTS FOR THE YEAR ENDED 28 FEBRUARY 2018
 PSG Group Limited Incorporated in the Republic of South Africa Registration number: 1970/008484/06 JSE Ltd ( JSE ) share code: PSG ISIN code: ZAE000013017 ( PSG Group or PSG or the company or the group
responsability Investments SSF conference, Zurich, January 16, 2018
 responsability Investments SSF conference, Zurich, January 16, 2018 1/12 RESPONSABILITY INVESTMENTS AG At a glance Key features Sectors Investor Base Founded in 2003 USD 3.1bn AuM Finance 14 different
SBG SECURITIES CONFERENCE DECEMBER Andrew A. Darfoor Group Chief Executive Officer
 SBG SECURITIES CONFERENCE DECEMBER 2016 Andrew A. Darfoor Group Chief Executive Officer ALEXANDER FORBES AT A GLANCE 2 Focus History Employees Life insurance, pensions, consulting & asset management for
SA Food Inflation Why all the fuss?
 SA Food Inflation Why all the fuss? Gina Schoeman Lead SA Economist February/March 211 The Food Map SA CPI Global EM SA CPI Food The Food Story SA SA Retail SA Manu SA Agri 2 Global food inflation Global
ARYZTA AG 2011 AGM. 1 December 2011
 ARYZTA AG 2011 AGM 1 December 2011 Forward Looking Statement This document contains forward looking statements which reflect management s current views and estimates. The forward looking statements involve
Company Presentation 2Q 2018 Results. 26 July 2018
 Company Presentation 2Q 2018 Results 26 July 2018 Click Presentation to edit Master Outline title style 1 2 Plantation Highlights Financial Highlights 3 4 Strategies and Expansion Appendix 2 Click to edit
PSG Group Ltd is an investment holding company consisting of underlying investments that operate across a diverse range of industries which include
 ANNUAL REPORT 2015 PSG Group Ltd is an investment holding company consisting of underlying investments that operate across a diverse range of industries which include financial services, banking, private
Qube Holdings Limited Investor Presentation FY 16 Interim Results
 Qube Holdings Limited Investor Presentation FY 16 Interim Results 1 Disclaimer Important Notice ABN 141 497 230 53 The information contained in this Presentation or subsequently provided to the recipient
Investor Presentation. November 2017
 Investor Presentation November 2017 DNA of PSG Group Financial Capitec PSG Konsult Education Curro Stadio FutureLearn ITSI CSI projects Food & Agri Zeder Pioneer Foods Capespan Zaad Kaap Agri Agrivision
Summarised consolidated financial statements. for the year ended 30 September 2018
 Summarised consolidated financial statements Salient features 8 786 451 Value of transactions () + 7,1% 354,1 Recurring headline earnings per share (cents) + 0,7% 84,7 (: 82,6) Final dividend per share
Key Financial Disclosures for the six months ended 31 December 2017
 15,000 lambs and ewes on the move in the Airies Station sheep yards, near Burkes Pass, February 2018. Key Financial Disclosures for the six months ended 31 December 2017 The financial statements contained
SEED CO LIMITED. Half Year Ended September 2016 ANALYST BRIEFING
 SEED CO LIMITED Half Year Ended September 2016 ANALYST BRIEFING Seed Co Group Half Year Financial Review By Matorofa John- GFD Income Statement For the Half Year ended Sept 2016 Group Income Statement
TRELLIDOR HOLDINGS LIMITED AUDITED RESULTS FOR THE YEAR ENDED 30 JUNE 2016
 TRELLIDOR HOLDINGS LIMITED AUDITED RESULTS FOR THE YEAR ENDED 30 JUNE 2016 OVERVIEW Trellidor is the market leading manufacturer of custom made barrier security products Distribution through dedicated
Company Presentation 3Q and 9M 2012 Results. 31 Oct 2012
 Company Presentation 3Q and 9M 2012 Results 31 Oct 2012 Presentation Outline 1 Plantation Highlights 2 Financial Highlights 3 Strategies and Expansion 4 Appendix 1 1 Section 1 Plantation Highlights g 2
For personal use only
 ASX and Media Release 16 August 2018 GALE Pacific delivers to top end of guidance with FY18 PBT $12.5m GALE Pacific Limited (ASX: GAP) is pleased to announce its financial results for the full year ended
AVI Limited presentation to shareholders & analysts for the six months ended 31 December 2017
 AVI Limited presentation to shareholders & analysts for the six months ended 31 December 2017 AGENDA Key features and results history Group financial results Performance and prospects Questions and answers
Q3 FY2012 Market Update
 Q3 FY2012 Market Update 2 Table of Contents 1. Third Quarter FY2012 Financial Results 3 2. Strategic Initiatives 5 3. Company Background 6 4. Management and Board of Directors 7 5. Industry Overview 8
KAP INDUSTRIAL HOLDINGS LIMITED (KAP) UNAUDITED INTERIM RESULTS FOR THE SIX MONTHS ENDED 31 DECEMBER 2017
 UNAUDITED INTERIM RESULTS FOR THE SIX MONTHS ENDED 31 DECEMBER 2017") KAP INDUSTRIAL HOLDINGS LIMITED (KAP) UNAUDITED INTERIM RESULTS FOR THE SIX MONTHS ENDED 31 DECEMBER 2017 WELCOME JAAP DU TOIT CHAIRMAN AGENDA WELCOME UNAUDITED INTERIM RESULTS FOR THE SIX STRATEGY MONTHS
KAP INDUSTRIAL HOLDINGS LIMITED (KAP) UNAUDITED INTERIM RESULTS FOR THE SIX MONTHS ENDED 31 DECEMBER 2017 WELCOME JAAP DU TOIT CHAIRMAN AGENDA WELCOME UNAUDITED INTERIM RESULTS FOR THE SIX STRATEGY MONTHS
Mondi Capital Markets Day
 Mondi Capital Markets Day Wrap up and Q&A Andrew King 3 November 2015 Our strategic value drivers remain unchanged Strategic value drivers We are passionate about performance driving productivity and efficiency
ANNUAL RESULTS PRESENTATION
 ANNUAL RESULTS PRESENTATION FOR THE YEAR ENDED 30 SEPTEMBER 2016 CONTENTS 2 Annual Results Presentation 8 Financial Performance 19 Divisional Performance 19 Essential Foods 26 Groceries 35 International
Liberty Holdings Limited Financial results presentation for the year ended 31 December
 Liberty Holdings Limited Financial results presentation 2016 for the year ended 31 December Results agenda Annual results 2016 Group financial Operational activities Conclusion preview and strategic performance
Creating Value While Feeding the World
 1 Creating Value While Feeding the World CAGNY 2016 Ray Young Executive Vice President and Chief Financial Officer Vince Macciocchi President WILD Flavors and Specialty Ingredients Safe Harbor Statement
FINANCIAL RESULTS PRESENTATION MAY 2010
 FINANCIAL RESULTS PRESENTATION MAY 2010 HIGHLIGHTS POSTITIVES Good physical performance Growth continues Cane up by more than 1mt Sugar up more than 100 000t Strong domestic sales World sugar price up
INTERIM RESULTS PRESENTATION FOR THE SIX MONTHS ENDED 31 MARCH 2017
 INTERIM RESULTS PRESENTATION FOR THE SIX MONTHS ENDED 31 MARCH 2017 SALIENT FEATURES 1 ST HALF Regression in consumer confidence and spending No business is insulated by past success Considered choices
PRESENTATION TO INVESTORS FOR THE YEAR ENDED 30 SEPTEMBER 2015
 PRESENTATION TO INVESTORS FOR THE YEAR ENDED 30 SEPTEMBER 2015 AGENDA GROUP OVERVIEW Alan Dickson, CEO FINANCIAL OVERVIEW Nick Thomson, CFO SEGMENTAL DISCUSSIONS ICT Mark Taylor Applied electronics Peter
INTERIM REPORT We are mens-mense, we CARE
 INTERIM REPORT 2018 We are mens-mense, we CARE Salient features Value of transactions () Recurring headline earnings per share (cents) 4 451 839 +4,5%* 223,12 +7,2% Revenue () Interim dividend per share
UNAUDITED CONDENSED CONSOLIDATED INTERIM FINANCIAL STATEMENTS FOR THE SIX MONTHS ENDED 31 MARCH 2018
 UNAUDITED CONDENSED CONSOLIDATED INTERIM FINANCIAL STATEMENTS FOR THE SIX MONTHS ENDED 31 MARCH UNAUDITED CONDENSED CONSOLIDATED INTERIM FINANCIAL STATEMENTS FOR THE SIX MONTHS ENDED 31 MARCH PIONEER FOOD
Results presentation. for the 26 weeks ended 26 August 2018
 Results presentation for the 26 weeks ended 26 August 2018 Agenda Chairman s introduction Gareth Ackerman Chairman Results overview Bakar Jakoet Chief Finance Officer Progress on our plan Richard Brasher
Barloworld Limited. Reviewed interim results to 31 March May 15, 2006
 Barloworld Limited Reviewed interim results to 31 March 2006 May 15, 2006 BARLOWORLD IS A DIVERSIFIED INDUSTRIAL COMPANY Over 26 000 people in 31 countries Barloworld s way of doing business - market-leading
Tactics to Grow in 2016
 Tactics to Grow in 2016 1 What is your definition of growth? Expansion Optimization Increasing in size Transition Maximizing returns and performance Moving to the next chapter 2 Why have a growth plan?
Nampak 2013 Interim Results
 Nampak 2013 Interim Results May 2013 1 Agenda Salient features Group results Operational review Strategic update Outlook 2 Salient Features Revenue up 7%, Africa up 19% Trading profit up 6% Profits from
Acquisition of Crown Flour Mills Limited 12 January 2010 Singapore
 Acquisition of Crown Flour Mills Limited 12 January 2010 Singapore 1 1 Cautionary note on forward-looking statements This presentation may contain statements regarding the business of Olam International
For personal use only. FY17 AGM Presentation
 FY17 AGM Presentation 22 November 2017 1 Agenda Chairman s Address Items of Business 2 Murray River Organics is a leading Australian producer, manufacturer, packer and seller of organic, natural and better-for-you
Tongaat Hulett Limited Registration No: 1892/000610/06 JSE share code: TON ISIN: ZAE Audited Results for the year ended 31 March 2012
 Tongaat Hulett Limited Registration No: 1892/000610/06 JSE share code: TON ISIN: ZAE000096541 Audited Results for the year ended 31 March 2012 - Revenue of R12,081 billion (2011: R9,681 billion) +24,8%
Huhtamaki Strong positions i for profitable growth. CEO Jukka Moisio Pohjola One-on-one Day March 9, 2011
 Huhtamaki Strong positions i for profitable growth CEO Jukka Moisio Pohjola One-on-one Day March 9, 2011 Huhtamaki in 2011 Key Fig gures 201 0 EUR 2.0 Billion in net sales 12,000 People employed Globally
2015 ANNUAL RESULTS PRESENTATION
 2015 ANNUAL RESULTS PRESENTATION Francois Kuttel & Imraan Soomra AGENDA Group Overview Financial Review Operational Review & Outlook Guidance GROUP OVERVIEW South Africa s most empowered listed company
Q Interim Report Healthy net sales growth in constant currencies
 GROUP October 25, 2013 Interim Report Healthy net sales growth in constant currencies CEO Jukka Moisio Director, Finance Thomas Geust Group highlights 2 Q3 Q3 Q1-Q3 Q1-Q3 FY EUR million 2013 2012 2013
For personal use only
 Freedom Foods Group Limited Presentation to Morgan's Conference October 2016 Important Information This presentation is provided for information purposes only. The information contained in this presentation
WILMAR INTERNATIONAL LIMITED 4Q2016 Results Briefing. Feb 20, 2017
 WILMAR INTERNATIONAL LIMITED 4Q2016 Results Briefing Feb 20, 2017 IMPORTANT NOTICE Information in this presentation may contain projections and forward looking statements that reflect the Company s current
Interim Report First Half 2015 Conference Call
 Interim Report First Half 2015 Conference Call Munich, 6 August 2015 Klaus Josef Lutz, CEO Andreas Helber, CFO Agenda 1. Development of the Group in the first half of 2015 2. Development of the Segments
Company Presentation 4Q 2017 Results. 28 Feb 2018
 Company Presentation 4Q 2017 Results 28 Feb 2018 Presentation Outline 1 2 Plantation Highlights Financial Highlights 3 4 Strategies and Expansion Appendix Plantation Highlights Planted Area In Ha 31 Dec
Annual Financial Statements as per 31 December Press Conference
 Annual Financial Statements as per 31 December 2014. Press Conference Munich, 26 March 2015 Klaus Josef Lutz, CEO Andreas Helber, CFO Agenda. 1. Financial Year 2014 2. Performance of the Segments 3. Group
Interim Results 2018
 Interim Results 2018 Forward looking statements We may make statements that are not historical facts and relate to analyses and other information based on forecasts of future results and estimates of amounts
Attached is an ASX and Media Release from Brambles Limited on its financial results for the year ended 30 June 2018.
 Brambles Limited ABN 22 000 129 868 Level 10 Angel Place 123 Pitt Street Sydney NSW 2000 Australia GPO Box 4173 Sydney NSW 2001 Tel +61 2 9256 5222 Fax +61 2 9256 5299 www.brambles.com 24 August 2018 The
Company Presentation 4Q 2018 Results. 28 Feb 2019
 Company Presentation 4Q 2018 Results 28 Feb 2019 Click Presentation to edit Master Outline title style 1 2 Plantation Highlights Financial Highlights 3 4 Strategies and Expansion Appendix 2 Click to edit