Q4 Presentation February, 2012
|
|
|
- Amanda Brown
- 5 years ago
- Views:
Transcription

1 Q4 Presentation February, 2012
2 Disclaimer This presentation has been prepared by Duni AB (the Company ) solely for use at this investor presentation and is furnished to you solely for your information and may not be reproduced or redistributed, in whole or in part, to any other person. By attending the meeting where this presentation is made, or by reading the presentation slides, you agree to be bound by the following limitations. This presentation is not for presentation or transmission into the United States or to any U.S. person, as that term is defined under Regulation S promulgated under the Securities Act of 1933, as amended. This presentation contains various forward-looking statements that reflect management s current views with respect to future events and financial and operational performance. The words believe, expect, anticipate, intend, may, plan, estimate, should, could, aim, target, might, or, in each case, their negative, or similar expressions identify certain of these forward-looking statements. Others can be identified from the context in which the statements are made. These forward-looking statements involve known and unknown risks, uncertainties and other factors, which are in some cases beyond the Company s control and may cause actual results or performance to differ materially from those expressed or implied from such forward-looking statements. These risks include but are not limited to the Company s ability to operate profitably, maintain its competitive position, to promote and improve its reputation and the awareness of the brands in its portfolio, to successfully operate its growth strategy and the impact of changes in pricing policies, political and regulatory developments in the markets in which the Company operates, and other risks. The information and opinions contained in this document are provided as at the date of this presentation and are subject to change without notice. No representation or warranty (expressed or implied) is made as to, and no reliance should be placed on, the fairness, accuracy or completeness of the information contained herein. Accordingly, none of the Company, or any of its principal shareholders or subsidiary undertakings or any of such person s officers or employees accepts any liability whatsoever arising directly or indirectly from the use of this document. 2
3 2011 Q4 Highlights Stable sales in Professional Prioritized growth initiatives within Professional generated results. Decline in Retail attributed to one private label customer, otherwise stable development. Lower demand from hygiene sector including stock reductions affected sales within Tissue. Healthy profitability during the seasonally strongest quarter Strong gross margin. Some degree of cautiousness in the markets. Evolin, the new premium material ready for market launch Additional activities for efficiency improvements initiated Net sales SEK m (1 097) Underlying operating income SEK 151 m (163) Underlying operating margin 14.2% (14,8%)

4 Market Outlook HORECA market long-term growing in line or slightly above GDP Positive eating out trend. Higher growth in take-away sector. Retail growth in line with GDP over time Retail sector struggles in a tough economic climate. Mixed signals in HoReCa sector Northern Europe still stable, worsening economic climate mainly affecting Southern Europe. Cost per meal more sensitive to economic downturn than number of visits. Key input material including traded goods easing off from high levels 4
 HoReCa")
5 HORECA Sales Development Germany (Nov 2011) HoReCa total 5

6 Restaurant Sales Development, Sweden (Dec 2010 Dec 2011) +1.0% in volume in Dec and +4.3% in value. +3.2% in volume YTD and +6.3% in value 6

7 Business Areas
8 Professional Stability in all regions Sales and EBIT 1) Geographical split sales Q SEK millions % 14% 12% 10% 8% 6% 4% 2% 0% Net sales Professional Nordic Central Europe South & East Europe Rest of the World Q Q Growth 1.6% 1.1% 0.8% 28.6% Growth at fixed exchange rates 1.6% 0.4% 1.7% 28.6% Sales EBIT Margin TOTAL % 0.1% Customer confidence negatively influenced by EUR/debt crisis. Gross margin improved as a result of price increases and leveling off raw materials prices. 1) Excluding non-recurring costs and market valuation of derivatives 8
9 Retail Challenging business environment Sales and EBIT 1) Geographical split - sales Q % Net sales Retail Q Q Growth Growth at fixed exchange rates % 2% Nordic Central Europe % 2..2% 10.7% 0.6% SEK millions % 2% South & East Europe Rest of the World % 100.0% 72.7% 100.0% 4% 200 TOTAL % 7.0% % 8% Volume decline entirely due to loss of major private label customer. Sales EBIT Margin Duni has gained market shares in the UK and Benelux. Some delay in price increases. 1) Excluding non-recurring costs and market valuation of derivatives 9
10 Tissue Result trend remains positive Sales and EBIT Sales mix Q SEK millions % 12% 10% 8% 6% 4% 2% 0% External 40% Internal 60% Sales EBIT Margin Lower demand from hygiene sector, including stock decrease. Continued improvement in production efficiency enables stable margins. 10
11 11Financials
12 Strong Gross Margin SEKm Q Q YTD 2011 YTD 2010 Net sales Gross profit Gross margin 29.7 % 28.4 % 27.1% 26.5 % Selling expenses Administrative expenses R&D expenses 9 9 Other operating net 9 18 Operating income (reported) Non recurring items 1) Operating income (underlying) Operating margin (underlying) 14.2 % 14.8 % 10.6 % 10.9 % Financial net Taxes Net income Earnings per share ) Restructuring costs and market valuation of derivatives 12
13 Stable operating margin in Professional SEKm Q Q YTD 2011 YTD 2010 Professional Net sales Operating income 1) Operating margin 16.1% 16.4% 12.9% 13.8% Retail Net sales Operating income 1) Operating margin 11.7% 14.1% 3.4% 4.6% Tissue Net sales Operating income 1) Operating margin 5.4% 5.4% 5.9% 3.7% Duni Net sales Operating income 1) Operating margin 14.2% 14.8% 10.6% 10.9% 1) Excluding non-recurring cost and market valuation of derivates 13
14 Capex affected by buy-back of German premises SEKm Q Q YTD 2011 YTD 2010 EBITDA 1) Capital expenditure Change in; Inventory Accounts receivable Accounts payable Other operating working capital Change in working capital Operating cash flow ) Excluding non-recurring costs and market valuation of derivatives 14
15 Continued solid financial position SEKm Goodwill Tangible and intangible fixed assets Net financial assets 1) Inventories Accounts receivable Accounts payable Other operating assets and liabilities 3) Net assets Net debt Equity Equity and net debt ROCE 2) 49% 17% 19% 21% ROCE 2) w/o Goodwill 29% 40% Net debt / Equity 36% 29% 35% Net debt / EBITDA 2) ) Deferred tax assets and liabilities + Income tax receivables and payables 2) Excluding non-recurring costs and market valuation of derivatives 3) Including restructuring provision and derivatives 15


16 Strategic challenge
17 Financial Targets 2011 Sales growth > 5% Organic growth of 5% over a business cycle Consider acquisitions to reach new markets or to strengthen current market positions -0.8% (at fixed exchange rates) EBIT margin > 10% Top line growth premium focus Improvements in manufacturing, sourcing and logistics 10.6% Dividend payout ratio 40+% Target at least 40% of net profit 3.50 SEK per share (proposal) 17


18 Exploring Different Growth Paths Core geography New geography New Horeca concepts Concept expansion Table top Market Penetration Platform expansion 18


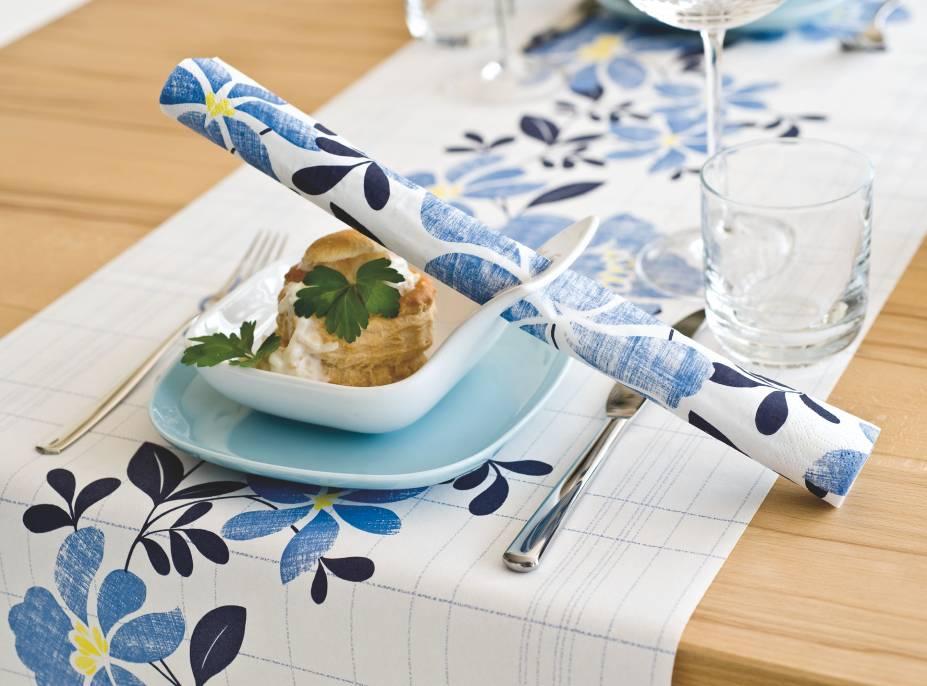
19 Market Penetration -Evolin Evolin -the revolutionary new table covering from Duni. Innovation that for the first time combines single use convenience with the premium look and feel of linen. Unique Duni technology/process: patent pending. 19


20 Why Evolin? Market research pointed out that linenusers are looking for a better way to balance a premium image with everyday convenience. Over 80% of the total professional table covering market is still linen. The table covering market < Single use: 2,5 bn SEK Textile: 15 bn SEK Evolin has been developed to offer a true alternative to linen. 20
Q2 Presentation July, 2011
 Q2 Presentation 2011 15 July, 2011 Disclaimer This presentation has been prepared by Duni AB (the Company ) solely for use at this investor presentation and is furnished to you solely for your information
Q4 Presentation February, 2013
 Q4 Presentation 2012 14 February, 2013 Disclaimer This presentation has been prepared by Duni AB (the Company ) solely for use at this investor presentation and is furnished to you solely for your information
Q1 Presentation April, 2011
 Q1 Presentation 2011 28 April, 2011 Disclaimer This presentation has been prepared by Duni AB (the Company ) solely for use at this investor presentation and is furnished to you solely for your information
Q1 Presentation April, 2013
 Q1 Presentation 19 April, Disclaimer This presentation has been prepared by Duni AB (the Company ) solely for use at this investor presentation and is furnished to you solely for your information and may
Q Presentation 1
 Q2 2009 Presentation 1 Disclaimer This presentation has been prepared by Duni AB (the Company ) solely for use at this investor presentation and is furnished to you solely for your information and may
Eng US. Q1 Presentation April, 2015
 Eng US Presentation 2015 24 April, 2015 Eng US Disclaimer This presentation has been prepared by Duni AB (the Company ) solely for use at this investor presentation and is furnished to you solely for your
Q Presentation.
 Q4 Presentation www.duni.com 1 Disclaimer This presentation has been prepared by Duni AB (the Company ) solely for use at this investor presentation and is furnished to you solely for your information
Eng US. 14 July 2017
 Eng US 14 July 2017 Presentation 2017 Eng US Disclaimer This presentation has been prepared by Duni AB (the Company ) solely for use at this investor presentation and is furnished to you solely for your
Eng US. 9 February Q4 Presentation 2017
 Eng US 9 February 2018 Q4 Presentation 2017 Eng US Disclaimer This presentation has been prepared by Duni AB (the Company ) solely for use at this investor presentation and is furnished to you solely for
Third Quarter 2016 Presentation. 11 November, 2016
 Third Quarter 2016 Presentation 11 November, 2016 Henrik Borelius, CEO Tomas Björksiöö, CFO 2 Financial summary of Q3: Continued stable development Net sales SEK 2.6bn (2.5), growth 5%, adjusted growth
Fourth Quarter 2016 Presentation. 15 February, 2017
 Fourth Quarter 2016 Presentation 15 February, 2017 Henrik Borelius, CEO Tomas Björksiöö, CFO 2 Financial summary of Q4: Continued stable development Net sales SEK 2,647m (2,564), adjusted growth 4% Operating
Q results 24 April Henri de Sauvage-Nolting, President and CEO Danko Maras, CFO Jacob Broberg, SVP IR
 Q1 2018 results 24 April 2018 Henri de Sauvage-Nolting, President and CEO Danko Maras, CFO Jacob Broberg, SVP IR 2 Q1 highlights Good EBIT delivery and Easter sales Net sales amounted to SEK 1,562m (1,222).
Interim Report Q3/2018 October 26, Magnus Welander, CEO Lennart Mauritzson, CFO
 Interim Report Q3/2018 October 26, 2018 Magnus Welander, CEO Lennart Mauritzson, CFO Q3/2018 Solid quarter with significant launches for future growth Net sales of SEK 1,561m (1,385) +12.7% (+3.8% excluding
Thule Group SEB Nordic Seminar Magnus Welander CEO and President
 Thule Group SEB Nordic Seminar 2018 Magnus Welander CEO and President 2018-01-10 Active Life, Simplified. Slide 2 We are a Global Premium Branded Sports&Outdoor Company Sales: SEK 5,849m EBIT: SEK 1,062m
Interim Report Q2/2018 July 19, Magnus Welander, CEO Lennart Mauritzson, CFO
 Interim Report Q2/2018 July 19, 2018 Magnus Welander, CEO Lennart Mauritzson, CFO 2018/Q2 Strong performance in Europe Net sales of SEK 2,155m (1,955) +10.2% (+7.0% excluding currency effects) Region Europe
Second Quarter 2016 Presentation. 28 July, 2016
 Second Quarter 2016 Presentation 28 July, 2016 Henrik Borelius, CEO Tomas Björksiöö, CFO Financial summary: Stable development in net sales and operating profit Net sales SEK 2.5bn (2.4), growth 4.3%,
Interim Report for Duni AB (publ) 1 January 31 December 2010 (compared with the same period of the previous year)
 1 January 31 December 2010 (compared with the same period of the previous year)") Interim Report for Duni AB (publ) 1 January 31 (compared with the same period of the previous year) 16 February 2011 Improved operating margin of 14.8% for the quarter 1 January 31 Net sales amounted to
Interim Report for Duni AB (publ) 1 January 31 (compared with the same period of the previous year) 16 February 2011 Improved operating margin of 14.8% for the quarter 1 January 31 Net sales amounted to
Year End Report 2017 February 13, Magnus Welander, CEO Lennart Mauritzson, CFO
 Year End Report 2017 Magnus Welander, CEO Lennart Mauritzson, CFO 2017/Q4 Continued good performance in smallest quarter of the year Net sales of SEK 1,006m (983) +2.3% (+6.5% excluding currency effects)
First quarter 2017 Presentation. 5 May, 2017
 First quarter 2017 Presentation 5 May, 2017 Henrik Borelius, CEO Tomas Björksiöö, CFO Financial summary of : Continued stable development Net sales SEK 2,661m (2,472), adjusted growth 6% Operating profit
Interim Report for Duni AB (publ) 1 January 30 June 2009
 1 January 30 June 2009") Interim Report for Duni AB (publ) 1 January 30 2009 (compared with the same period of the previous year) 29 July 2009 Strong cash flow and stable profitability 1 January 30 2009 Net sales increased by
Interim Report for Duni AB (publ) 1 January 30 2009 (compared with the same period of the previous year) 29 July 2009 Strong cash flow and stable profitability 1 January 30 2009 Net sales increased by
Q results 23 April Bengt Baron, CEO Danko Maras, CFO Jacob Broberg, SVP IR
 Q1 2015 results 23 April 2015 Bengt Baron, CEO Danko Maras, CFO Jacob Broberg, SVP IR 2 Q1 highlights Continued sales growth, improved operating profit (EBIT) and strong cash flow Net sales for the quarter
Record first six months
 Record first six months 1 JANUARY 30 JUNE 2016 23 August 2016 Earnings conference call Presenters: Martin Ellis (CEO) and Jonas Olin (CFO) The statements about the future in this document contain an element
Road Show Q3/2017 Thule Group AB. Magnus Welander, Lennart Mauritzson November 2017
 Road Show Q3/2017 Thule Group AB Magnus Welander, Lennart Mauritzson November 2017 Active Life, Simplified. Slide 2 Our Investment Case Attractive Market Attractive Company Favorable mega-trends driving
Q3 Interim Report 2016 October 28, Magnus Welander, CEO Lennart Mauritzson, CFO
 Q3 Interim Report 2016 October 28, 2016 Magnus Welander, CEO Lennart Mauritzson, CFO Q3 2016 Highlights Continued strong profitability and strong cash generation Net sales of SEK 1,366m (1,343) Thule Group
Q presentation. 10 May Nordic market leader in chicken products
 Q1 2016 presentation 10 May 2016 Nordic market leader in chicken products 0 Summary of Q1 2016 Strong growth in net sales, particularly in chilled products Continued strong performance in Sweden Substantial
2017/Q1 Road Show Thule Group. Magnus Welander, Lennart Mauritzson April-May 2017
 2017/Q1 Road Show Thule Group Magnus Welander, Lennart Mauritzson April-May 2017 Active Life, Simplified. Slide 2 Our Investment Case Attractive Market Attractive Company Favorable mega-trends driving
Q results 29 April Bengt Baron, CEO Danko Maras, CFO Jacob Broberg, SVP IR
 Q1 2013 results 29 April 2013 Bengt Baron, CEO Danko Maras, CFO Jacob Broberg, SVP IR 2 Q1 highlights Significantly improved underlying profitability Underlying EBIT of SEK 91m (47) Underlying margin of
Interim Report for Duni AB (publ) 1 January 31 March 2015
 1 January 31 March 2015") Interim Report for Duni AB (publ) 1 January 31 (compared with the same period of the previous year) 24 April Strong first quarter 1 January 31 Net sales amounted to SEK 1,046 m (921). Adjusted for exchange
Interim Report for Duni AB (publ) 1 January 31 (compared with the same period of the previous year) 24 April Strong first quarter 1 January 31 Net sales amounted to SEK 1,046 m (921). Adjusted for exchange
Scandi Standard (SCST SS) Q Presentation 5 November 2018
 Q Presentation 5 November 2018") Scandi Standard (SCST SS) Q3 2018 Presentation 5 November 2018 Revenue by category Chilled 55% Frozen 19% Ready to eat 18% Other 8% Revenue by channel Retail 68% Food service 15% Export 9% Industry 3%
Scandi Standard (SCST SS) Q3 2018 Presentation 5 November 2018 Revenue by category Chilled 55% Frozen 19% Ready to eat 18% Other 8% Revenue by channel Retail 68% Food service 15% Export 9% Industry 3%
Q Interim Report. Jan Sep 2017 CEO Anders Holmgren & CFO Christine Rankin 9 Nov 2017
 Cherry AB (STO: CHER-B.ST) Q3 217 Interim Report Jan Sep 217 CEO Anders Holmgren & CFO Christine Rankin 9 Nov 217 Now listed on Nasdaq Stockholm, Mid Cap segment Dynamic player in the Swedish gambling
Interim Report for Duni AB (publ) 1 January 31 March 2016
 1 January 31 March 2016") Interim Report for Duni AB (publ) 1 January 31 (compared with the same period of the previous year) 21 April Currency and calendar effects impact profit 1 January 31 Net sales for continuing operations
Interim Report for Duni AB (publ) 1 January 31 (compared with the same period of the previous year) 21 April Currency and calendar effects impact profit 1 January 31 Net sales for continuing operations
Scandi Standard Q Presentation. 22 November 2017
 Scandi Standard Q3 2017 Presentation 22 November 2017 Highlights Q3 2017 Successful acquisition of Manor Farm (Ireland) - Market leader in Ireland representing ~¼ of group Net Sales and strong margins
Creating a pan-nordic platform
 Creating a pan-nordic platform June 2018 Norway s leading discount variety retailer Important notice ABOUT THIS PRESENTATION By reading this company presentation (the Presentation ), or attending any meeting
Cloetta and LEAF to merge Creating a Nordic market leader. December 16, 2011
 Cloetta and LEAF to merge Creating a Nordic market leader December 16, 2011 Presenters Olof Svenfelt Lennart Bylock Bengt Baron Chairman of Cloetta Board member of Malfors Promotor, current majority shareholder
FULL-YEAR RESULTS 2016
 FULL-YEAR RESULTS 2016 INVESTOR PRESENTATION RESULTS FROM JANUARY TO DECEMBER 2016 ZURICH 02 MARCH 2017 Achievements and key figures Operating and financial review Outlook and priorities 2017 Appendix
Year-End Report for Duni AB (publ) 1 January 31 December 2016
 1 January 31 December 2016") Year-End Report for Duni AB (publ) 1 January 31 (compared to the same period previous year) 10 February 2017 Growth within Table Top business area 1 October 31 Net sales amounted to SEK 1,234 m (1,170).
Year-End Report for Duni AB (publ) 1 January 31 (compared to the same period previous year) 10 February 2017 Growth within Table Top business area 1 October 31 Net sales amounted to SEK 1,234 m (1,170).
VOLVO CAR GROUP results presentation Third quarter and first nine months 2018
 VOLVO CAR GROUP results presentation Third quarter and first nine months 2018 Nils Mösko, vice president & Head of investor relations Patrik Tolf, Deputy CFO & head of Group Finance DISCLAIMER By accepting
Q results 19 July Bengt Baron, CEO Danko Maras, CFO Jacob Broberg, SVP IR
 Q2 2013 results 19 July 2013 Bengt Baron, CEO Danko Maras, CFO Jacob Broberg, SVP IR 2 Q2 highlights Significantly improved underlying profitability Net sales of SEK 1,131m (1,212) Underlying EBIT of SEK
Margins under pressure from higher pulp prices efficiency program initiated
 P R E S S RELEASE INTERIM REPORT FOR DUNI AB (PUBL) 1 JANUARY 30 SEPTEMBER (compared to the same period previous year) 18 October Margins under pressure from higher pulp prices efficiency program initiated
Financial Results for the Second Quarter and First Six Months July 2011
 Financial Results for the Second Quarter and First Six Months 211 18 July 211 SEK (million) Margin (%) 51% year on year second quarter sales growth Strong sales growth across all segments & each segment
Interim Report for Duni AB (publ) 1 January 30 June 2017 (compared to the same period previous year)
 1 January 30 June 2017 (compared to the same period previous year)") Interim Report for Duni AB (publ) 1 January 30 (compared to the same period previous year) 14 July Strong growth and acquisition in New Zealand 1 April 30 Net sales amounted to SEK 1,101 m (1,013). Adjusted
Interim Report for Duni AB (publ) 1 January 30 (compared to the same period previous year) 14 July Strong growth and acquisition in New Zealand 1 April 30 Net sales amounted to SEK 1,101 m (1,013). Adjusted
Scandi Standard Q Presentation. 20 February 2018
 Scandi Standard Q4 2017 Presentation 20 February 2018 Highlights Q4 2017 8% revenue growth ex. Manor Farm - 7% on a proforma basis MSEK 65 improvement in Adj. EBIT ex Manor Farm - Sweden still challenging
Q Cherry AB (publ) Q Presentation 16 August 2018
 Q Presentation 16 August 2018") Cherry AB (publ) Q2 218 Presentation 16 August 218 Presenters: Morten Klein, Executive Chairman Gunnar Lind, Acting CEO Christine Rankin, CFO Q2218 Cherry at a glance Offering a broad platform of exciting
Cherry AB (publ) Q2 218 Presentation 16 August 218 Presenters: Morten Klein, Executive Chairman Gunnar Lind, Acting CEO Christine Rankin, CFO Q2218 Cherry at a glance Offering a broad platform of exciting
Q Results Presentation. February 5, 2019
 Results Presentation February 5, 2019 Building on our strengths going forward Temporary financial underperformance in Building on the strengths Full focus on Profitable Growth opportunities in Husqvarna,
VOLVO CAR GROUP results presentation January March 2018
 VOLVO CAR GROUP results presentation January March 2018 Patrik Tolf, Deputy CFO & head of Group Finance Nils Mösko, vice president & Head of investor relations DISCLAIMER By accepting this document, the
Q presentation. 5 February 2015
 Q4 2014 presentation 5 February 2015 Agenda Highlights Financial overview Market outlook Q4 Highlights Strong finish to a record year Revenue of NOK 7 549 million, up 10.3% EBITDA* of NOK 396 million,
HALF-YEAR RESULTS 2017
 HALF-YEAR RESULTS 2017 INVESTOR PRESENTATION RESULTS FROM JANUARY TO JUNE 2017 BASEL 20 JULY 2017 Achievements and key figures Operating and financial review Outlook and priorities 2017 Appendix 2 ACHIEVEMENTS
Year-end report Jan-Dec February, 2018
 1 Year-end report Jan-Dec 2017 1 February, 2018 Executive summary on development We follow our strategic plan Good sales growth continues Supply chain back on track Efficiency improvements according to
The Group s net turnover increased by 11 per cent to SEK 287 M (323)
") 1 VBG GROUP AB (publ) in Vänersborg is the Parent Company of an international engineering Group with wholly-owned manufacturing and sales companies in Europe, India and the USA. The Group s operations
1 VBG GROUP AB (publ) in Vänersborg is the Parent Company of an international engineering Group with wholly-owned manufacturing and sales companies in Europe, India and the USA. The Group s operations
Interim report. January June Mattias Björk, CFO. Mårten Andersson, CEO. 17 August 2018
 Q2 Interim report January June Mårten Andersson, CEO Mattias Björk, CFO 17 August Financial development in Q2 Net sales SEK 1,428m (872) EBITA SEK 86m (99) 1600 1400 1200 1000 800 600 400 200 0 160 140
Q Interim Results Presentation
 Riservato & Confidenziale Q1 2017 Interim Results Presentation June 1st, 2017 Authorised and regulated by the Financial Conduit Authority Disclaimer THIS PRESENTATION IS NOT, NOR SHALL BE CONSTRUED AS,
NINE MONTHS RESULTS 2017
 NINE MONTHS RESULTS 2017 INVESTOR PRESENTATION RESULTS FROM JANUARY TO SEPTEMBER 2017 BASEL 19 OCTOBER 2017 Achievements and key figures Operating and financial review Outlook and priorities 2017 Appendix
STRABAG SE JANUARY MARCH 2018 RESULTS
 STRABAG SE JANUARY MARCH 2018 RESULTS 30 MAY 2018 DISCLAIMER This presentation is made by STRABAG SE (the "Company") solely for use at investor meetings and is furnished to you solely for your information.
Second quarter Vestas Wind Systems A/S. Copenhagen, 18 August Classification: Public
 Second quarter Vestas Wind Systems A/S Copenhagen, 18 August Disclaimer and cautionary statement This presentation contains forward-looking statements concerning Vestas' financial condition, results of
RECORD-BREAKING FOURTH QUARTER SALES AND EBITA AS MARKET CONDITIONS RETURN TO NORMAL
 RECORD-BREAKING FOURTH QUARTER SALES AND EBITA AS MARKET CONDITIONS RETURN TO NORMAL Bygghemma Group First AB (publ) 1 Today s presenters Mikael Olander President and CEO Martin Edblad CFO Bygghemma Group
Results FY 2017 Schaeffler AG. Conference Call March 7, 2018 Munich
 Results FY 2017 Schaeffler AG Conference Call Munich Disclaimer This presentation contains forward-looking statements. The words "anticipate", "assume", "believe", "estimate", "expect", "intend", "may",
Q CEO Anders Holmgren & CFO Christine Rankin 3 May 2018
 Cherry AB (STO: CHER-B.ST) Q1 218 CEO Anders Holmgren & CFO Christine Rankin 3 May 218 Q1 218: Highlights A strong start and we expect to keep the momentum All business areas reported a solid 218 kick-off
A year of successful acquisitions
 A year of successful acquisitions 1 JANUARY 31 DECEMBER 2017 8 February 2018 Earnings conference call Presenters: Martin Ellis (CEO) and Jonas Olin (CFO) The statements about the future in this document
INTERIM REPORT JANUARY - SEPTEMBER 2015 NOVEMBER 3, 2015
 INTERIM REPORT JANUARY - SEPTEMBER NOVEMBER 3, EBITA (MSEK) Pro forma 2014 LTM ONE TARGET: TO INCREASE PROFITS EVERY YEAR 1998 1999 2000 2001 2002 2003 2004 2005 2006 2007 2008 2009 2010 2011 2012 2013
Investor Conference Call Q Results
 Science For A Better Life Investor Conference Call Q1 2009 Results Werner Wenning, CEO April 29 2009 Q1 2009 Investor Conference Call Werner Wenning Disclaimer This presentation may contain forward-looking
Presentation of Addtech
 1 Presentation of Addtech Addtech in brief A technology trading company Refining link between suppliers and customers Focus on Added Value in product Middle to low-sized volume From standard products to
EVRY IFRS 15 Transition 4 MAY 2018
 EVRY Transition 4 MAY 2018 Transition EVRY has adopted using the modified retrospective method Only contracts not completed at 31 December 2017 have been subject to transition to Prior comparative periods
KION UPDATE CALL Q Gordon Riske, CEO Thomas Toepfer, CFO Wiesbaden, 7 May 2015
 KION UPDATE CALL 2015 Gordon Riske, CEO Thomas Toepfer, CFO Wiesbaden, 7 May 2015 AGENDA 1 Highlights Gordon Riske 2 Market update Gordon Riske 3 Financial update Thomas Toepfer 4 Outlook Gordon Riske
INTERIM REPORT JANUARY 29 FOURTH QUARTER 2014
 INTERIM REPORT JANUARY 29 FOURTH QUARTER 2014 FULL YEAR 2014 ACTIVE PORTFOLIO MANAGEMENT Acquisition of Varel International Energy Services Divestments of Sandvik Material Technologies distribution business
Opportunity Day Q118. The Stock Exchange of Thailand. 1 June COL Public Company Limited
 COL Public Company Limited 1 June 2018 Opportunity Day Q118 The Stock Exchange of Thailand Important Notice The information contained in this presentation is for information purposes only and does not
STRABAG SE JANUARY MARCH 2016 RESULTS
 STRABAG SE JANUARY MARCH 2016 RESULTS 31 MAY 2016 DISCLAIMER This presentation is made by STRABAG SE (the "Company") solely for use at investor meetings and is furnished to you solely for your information.
TomTom Q results. Harold Goddijn - CEO & Marina Wyatt - CFO 18 February 2011
 TomTom Q4 2010 results Harold Goddijn - CEO & Marina Wyatt - CFO 18 February 2011 Financial highlights Content & Services revenue grew by 16% to 98 million Automotive revenue grew by 52% to 55 million
Second quarter Vestas Wind Systems A/S. Copenhagen, 17 August Classification: Public
 Second quarter Vestas Wind Systems A/S Copenhagen, 17 August Classification: Public Disclaimer and cautionary statement This document contains forward-looking statements concerning Vestas financial condition,
1H18 Results Presentation Sid Takla Interim Chief Executive Officer Lyndal York Chief Financial Officer
 1H18 Results Presentation Sid Takla Interim Chief Executive Officer Lyndal York Chief Financial Officer 21 August 2018 Important Notice and Disclaimer This presentation has been prepared by Asaleo Care
KONE Q APRIL 25, 2018 HENRIK EHRNROOTH, PRESIDENT & CEO ILKKA HARA, CFO
 KONE 2018 APRIL 25, 2018 HENRIK EHRNROOTH, PRESIDENT & CEO ILKKA HARA, CFO 2018 Highlights Solid growth in orders received with stabilizing margins Profitability continued to be burdened Good progress
VOLVO CAR GROUP results presentation January December 2016
 VOLVO CAR GROUP results presentation January December Håkan Samuelsson, president & CEO Hans oscarsson, senior vice president & CFO DISCLAIMER By accepting this document, the person to whom it is provided
KION Q3 UPDATE CALL Gordon Riske, CEO Thomas Toepfer, CFO Wiesbaden, 14 November 2013
 KION Q3 UPDATE CALL 2013 Gordon Riske, CEO Thomas Toepfer, CFO Wiesbaden, 14 November 2013 AGENDA 1 Highlights 2013 Gordon Riske 2 Financial Update Thomas Toepfer 3 Outlook Gordon Riske 14 November 2013
Migros Ticaret A.Ş. 9M 2017 Financial Results. Migros 2016 Sustainability Report released
 Migros Ticaret A.Ş. 9M 2017 Financial Results Migros 2016 Sustainability Report released Disclaimer Statement Migros Ticaret A.Ş. (the Company ) has prepared this presentation for the sole purpose of providing
Interim report. January September Mårten Andersson, CEO Mattias Björk, CFO 6 November 2018
 Q3 Interim report January September Mårten Andersson, CEO Mattias Björk, CFO 6 November Financial development in Q3 Net sales SEK 1,470m (1 224) EBITA SEK 123m (96) 1600 1400 1200 1000 800 600 400 200
SEB Nordic Seminar. Copenhagen, 8 January 2016
 SEB Nordic Seminar Copenhagen, 8 January 2016 Cloetta the leading Nordic confectionery player Founded by the three Cloetta brothers in 1862 Annual sales of SEK 5,313m in 2014 Adjusted EBIT of SEK 632m
P R E S S RELEASE YEAR-END REPORT FOR DUNI AB (PUBL) 1 JANUARI 31 DECEMBER Organic growth and continuing high input material costs
 1 JANUARI 31 DECEMBER Organic growth and continuing high input material costs") P R E S S RELEASE YEAR-END REPORT FOR DUNI AB (PUBL) 1 JANUARI 31 DECEMBER (compared to the same period previous year) 14 February 2019 Organic growth and continuing high input material costs 1 OCTOBER
P R E S S RELEASE YEAR-END REPORT FOR DUNI AB (PUBL) 1 JANUARI 31 DECEMBER (compared to the same period previous year) 14 February 2019 Organic growth and continuing high input material costs 1 OCTOBER
2005 FULL YEAR RESULTS. March / April 2006
 2005 FULL YEAR RESULTS March / April 2006 DISCLAIMER Safe Harbour Statement This presentation contains forward-looking statements (made pursuant to the safe harbour provisions of the Private Securities
LANXESS AG Executing on Strategy and Operations
 LANXESS AG Executing on Strategy and Operations 17 th Annual Citigroup Chemicals Conference New York, December 5 th 6 th, 2006 Matthias Zachert, CFO Conference 2006 Chart-No. 1 Safe harbour statement This
Press release. Annual results
 Press release Annual results 2017 Profile Beter Bed Holding is a European retail organisation that strives to offer its customers a comfortable and healthy night s rest every night at an affordable price.
HALF-YEAR RESULTS 2016 INVESTOR PRESENTATION
 HALF-YEAR RESULTS 2016 INVESTOR PRESENTATION RESULTS FOR JANUARY TO JUNE 2016 20 JULY 2016 Highlights and key figures Operating and financial review Outlook and priorities Appendix HALF-YEAR RESULTS 20
HIGHLIGHTS INTERIM REPORT Q XXL ASA. Q3 Growth
 INTERIM REPORT Q3 2017 XXL ASA HIGHLIGHTS Total revenues of NOK 2 417 million (NOK 2 080 million), up 16 per cent Like-for-like growth of 6 per cent EBITDA of NOK 252 million (NOK 214 million) Solid results
INTERIM REPORT JANUARY SEPTEMBER OCTOBER 2017
 INTERIM REPORT JANUARY SEPTEMBER 2017 26 OCTOBER 2017 EBITA before acquisition costs (MSEK) LTM ONE TARGET: TO INCREASE PROFITS EVERY YEAR 1998 1999 2000 2001 2002 2003 2004 2005 2006 2007 2008 2009 2010
2 ND QUARTER 2017 RESULTS ANNOUNCEMENT
 2 ND QUARTER 2017 RESULTS ANNOUNCEMENT TOMRA SYSTEMS ASA 2 nd Quarter Results 19.07.2017 HIGHLIGHTS FROM THE QUARTER Revenues Gross margin Operating expenses EBITA Cashflow TOMRA Collection TOMRA Sorting
Q Results presentation
 Results presentation Summary Good sales development across all business areas Lower seasonal operating loss Improvements for Americas and Europe & Asia/Pacific Stable for Construction Continued improvement
1,633m 2013 Revenues 2013 ANNUAL RESULTS. 13 March ,427 Employees in % of Revenues for International in 2013
 1,633m 2013 Revenues 2013 ANNUAL RESULTS 13 March 2014 55% of Revenues for International in 2013 20,427 Employees in 2013 Disclaimer This presentation contains forward-looking statements (as defined in
Interim Report January March 2017
 First Quarter - 2017 Interim Report January March 2017 Order intake was MSEK 1,314.0 (1,142.0), which is an overall growth of.1% adjusted to 4.7% for acquisitions of MSEK 118.0. The overall year to date
Second quarter Vestas Wind Systems A/S. Aarhus, 20 August 2014
 Second quarter Vestas Wind Systems A/S Aarhus, 20 August Disclaimer and cautionary statement This presentation contains forward-looking statements concerning Vestas' financial condition, results of operations
ContextVision. Expecting solid results and awaiting progress update on research program
 1Q17 Preview (report due April 27 th ) April 24 th 2017 Share price: NOK 61.75 Target: NOK 100.00 (unchanged) Risk: Medium ContextVision Key share data Sector Reuters Bloomberg Health Care COVI.OL COV
Interim Financial Report Zumtobel Group 2007/08. December 7, 2007
 Interim Financial Report Zumtobel Group 2007/08 December 7, 2007 Presentation Dr A. Ludwig / T. Spitzenpfeil Q2 2007/08 key facts and figures On track for double digit EBIT margin Zumtobel Group Continuing
Improved margin and cash flow in Q1 2013
 2013-06-04 BofA Merrill Lynch Global Telecom & Media conference June 4, 2013 Per-Arne Blomquist President and CEO 1 Improved margin and cash flow in Q1 2013 Revenue growth impacted by reduced mobile interconnect
SMA SOLAR TECHNOLOGY AG Analyst / Investor Presentation Quarterly Financial Results: January to September 2015 Pierre-Pascal Urbon, CEO/CFO November
 SMA SOLAR TECHNOLOGY AG Analyst / Investor Presentation Quarterly Financial Results: January to September Pierre-Pascal Urbon, CEO/CFO November 12, Date, Author SMA Solar Technology AG Disclaimer IMPORTANT
new business seize the potential H&M GROUP CAPITAL MARKETS DAY 2018
 new business seize the potential H&M GROUP CAPITAL MARKETS DAY 2018 Disclaimer THIS PRESENTATION IS NOT AN OFFER OR SOLICITATION OF AN OFFER TO BUY OR SELL SECURITIES. IT IS SOLELY FOR USE AT A CAPITAL
Conference Call Half Year Closing Zurich, 22 August 2013
 Conference Call Half Year Closing 2013 Zurich, 22 August 2013 Disclaimer This communication contains statements that constitute forward-looking statements. In this communication, such forward-looking statements
INEOS STYROLUTION. Q1/ 2018 Investor Earnings Call
 INEOS STYROLUTION Q1/ 2018 Investor Earnings Call Disclaimer The following presentation includes forward-looking statements, within the meaning of the US securities laws, based on our current expectations
9M 2017 FILA Group Results
 9M 2017 FILA Group Results Disclaimer This document has been prepared by F.I.L.A. S.p.A. ( F.I.L.A. or the Company ), for information purposes only, exclusively with the aim of assisting you to understand
For personal use only
 Investor Presentation Half Year Results to 31 December 2016 24 February 2017 PETER CAUGHEY, CEO & MANAGING DIRECTOR 1 Agenda Overview Financials Business conditions, strategy and outlook 2 Overview 1H17
Q Preliminary Earnings Results Summary. February 1, 2018
 Q4 2017 Preliminary Earnings Results Summary February 1, 2018 SAFE HARBOR STATEMENT This presentation may contain projections or other forward-looking statements within the meaning Section 27A of the Private
WA WallVision AB (publ), corp. no Interim report January 1, 2016 September 30, 2016 THIRD QUARTER: ORGANIC GROWTH IN CORE MARKETS
, corp. no Interim report January 1, 2016 September 30, 2016 THIRD QUARTER: ORGANIC GROWTH IN CORE MARKETS") All figures pertain to the Group unless otherwise stated. Comparisons in the interim report refer to the corresponding period in the 2015 fiscal year, unless otherwise stated. THIRD QUARTER: ORGANIC GROWTH
All figures pertain to the Group unless otherwise stated. Comparisons in the interim report refer to the corresponding period in the 2015 fiscal year, unless otherwise stated. THIRD QUARTER: ORGANIC GROWTH
Investor Presentation
 Investor Presentation 1 Disclaimer This document has been prepared by Energy One Limited (EOL) and comprises written materials and slides for a presentation concerning EOL. This presentation is for information
Clas Ohlson: Year-end report 1 May April 2013
 Clas Ohlson: Year-end report 1 May 2012 30 April 2013 Fourth quarter * Sales totalled SEK 1,274 M (1,272). In local currencies, growth was 3%. * Operating loss of SEK 19 M reported (profit: 10). * Loss