Thule Group SEB Nordic Seminar Magnus Welander CEO and President
|
|
|
- Dylan Bryan
- 6 years ago
- Views:
Transcription

1 Thule Group SEB Nordic Seminar 2018 Magnus Welander CEO and President


2 Active Life, Simplified. Slide 2

3 We are a Global Premium Branded Sports&Outdoor Company Sales: SEK 5,849m EBIT: SEK 1,062m (18.2%) Sales in 140 countries * LTM 2017/Q3; Underlying EBIT Slide 3

4 Our investment case remains strong Attractive Market Attractive Company Favorable mega-trends driving market growth Strong user-influenced Innovation and Product Development Differentiated Premium Brand Global Route-to-Market Strategy and Implementation Strong Position in the Value Chain Sustainable business approach Slide 4


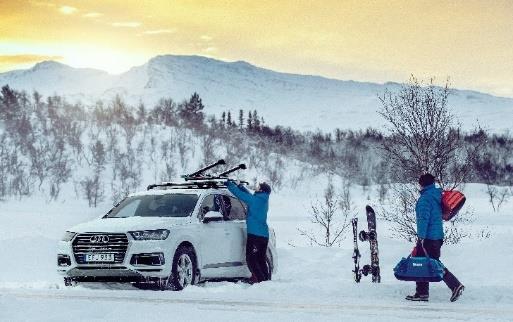
5 Product is King mindset is our biggest strength Slide 5


6 Focus to build on the emotional feel of the Thule brand across all channels Slide 6


7 Consumers connect with our brand and products in many different ways Images Slide 7

8 Focus on cost efficient Supply Chain that meets increased customer demands Customers expecting more and more from brands Less and less inventory in retail Later cut-off times for orders Simplified ordering processes More flexible pick&pack approach Economies of scale as majority of product portfolio has become global Flexible own plants and supplier structure Efficiency gains via improved and modernized structure in Distribution Centers Slide 8


9 Focus on tools to drive sales in Brick&Mortar and On-line retail Slide 9


10 Sustainability Focus in all aspects of what we do Sustainable and reliable manufacturing Responsible business practices Products that inspire a healthy and active lifestyle Climate smart logistics Genuine social engagement Slide 10

11 Regions & Product Categories
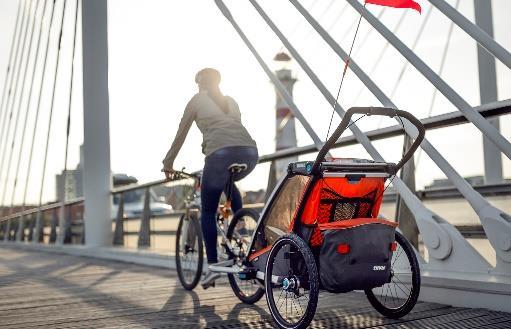
12 Region Europe&ROW with fantastic performance Q1-Q3 in 2017 Region Europe&ROW Region Americas SHARE OF NET SALES (2017/Q3 LTM) 70% 30% SALES GROWTH CONSTANT CURRENCY +13.3% +3.8% (2017 Q1-Q3 vs 2016 Q1-Q3) KEY DIFFERENCES BETWEEN REGIONS Product sub-category exposure differs: Booming RV Products category focused on Europe only Very successful Multisport Trailer launch in Active with Kids focused on N. Europe Region Americas significantly higher historical exposure to declining Legacy/OE Bags Brick&Mortar retail is going through difficult period in N. America Slide 12


 +7%")

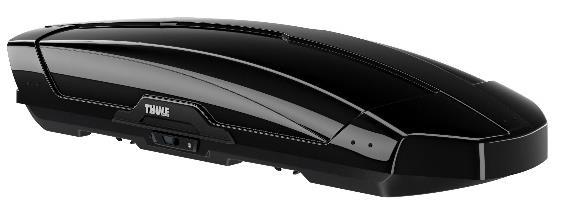
13 Sport&Cargo Carriers: 2/3 of our sales with ambition to continue stable growth SHARE OF NET SALES 2017/Q2 LTM 65% Stable growth SALES GROWTH 2017H1 vs. 2016H1 (Constant Currency) +7% LONG-TERM AMBITION Strengthen Global No. 1 position Bike Racks Roof Racks Boxes&Baskets Water/Winter/Other Slide 13


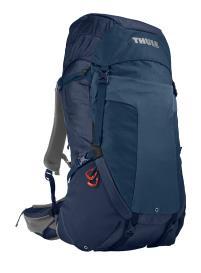
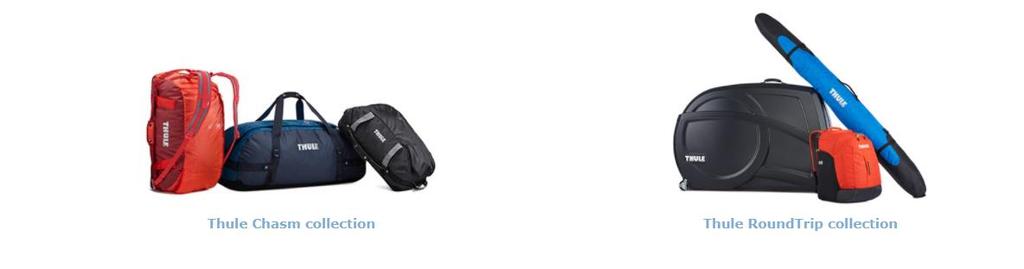
14 Packs, Bags & Luggage: A category with challenges, but also big potential SHARE OF NET SALES 2017/Q2 LTM SALES GROWTH 2017H1 vs. 2016H1 (Constant Currency) 15% - 4% LONG-TERM AMBITION Strong growth Become serious contender in Luggage Share gains in Smaller Everyday Bags and Sport&Outdoor Packs Shrinking Legacy/OE becomes less relevant Legacy/OE Bags&Cases Smaller Everyday Bags Luggage Sport&Outdoor Packs Slide 14

15 2017: Entry into 100 Bio SEK Luggage market with Thule Subterra collection Slide 15

 8% Strong growth +48% LONG- TERM")

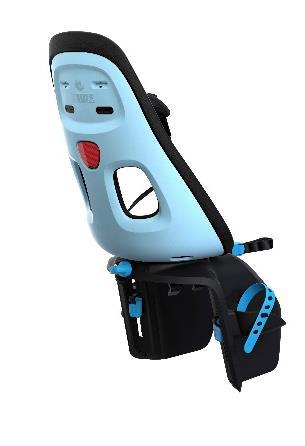
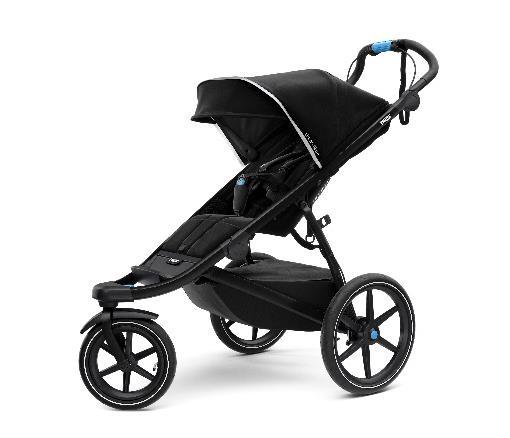
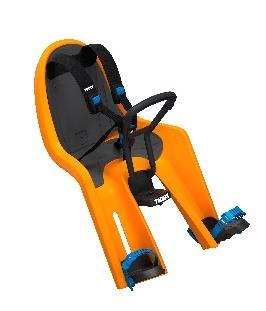
16 Active with Kids: We have grown to be a serious player in Juvenile products SHARE OF NET SALES 2017/Q2 LTM SALES GROWTH 2017H1 vs. 2016H1 (Constant Currency) 8% Strong growth +48% LONG- TERM AMBITION Become serious contender in Strollers Share gains in strong sub-categories of Bike Trailers and Child Bike Seats Strollers Bike/Multisport Trailers Child Bike Seats Slide 16

17 2014: Entry into stroller market with award winning Thule Urban Glide jogger Slide 17
 Slide")
18 Targeting a 10 Bio SEK premium stroller market Thule Urban Glide 2 (2018/Q1) Slide 18
")
19 Targeting a 10 Bio SEK premium stroller market Thule Sleek (2018/Q3) Slide 19

 12% Outpace the Market +31%")

20 RV Products: A cyclical business with positive trend in recent years SHARE OF NET SALES 2017/Q2 LTM SALES GROWTH 2017H1 vs. 2016H1 (Constant Currency) 12% Outpace the Market +31% LONG- TERM AMBITION Continue to win market share Flexible set-up for potential future cyclicality Awnings&Tents Bike Racks Other RV Products Slide 20

21 Financials
22 We have delivered on our promise to profitably grow a brand focused business Sales growth (constant currency) EBIT-margin (underlying) SEKm 6,3% 5,2% 5,3% 5,3% 5,3% 5759 >5% 5304 >15% 5018 SEKm 13,0% ,4% ,3% 16,6% 17,6% 18,2% >17% June LTM June LTM Reported Sales Sales YoY growth in constant currency Reported EBIT EBIT margin % EBIT Slide 22

23 Our ambition is to continue on our successful journey PRODUCT DRIVEN GROWTH SUPPLY CHAIN EFFICIENCY SIGNIFICANT CASH GENERATION EXPLORE STRATEGIC M&A GREAT SHAREHOLDER RETURN Slide 23
24 2017 YTD September Strong sales and EBIT growth Reported Net Sales Underlying EBIT and Margin SEKm SEKm 20.3% 20.6% YTD 2016 YTD 2017 YTD 2016 YTD 2017 Note: EBIT adjusted for non-recurring items & depr/amort on excess values. 1 Constant currency adjustment based on average FX rates 1 January September Slide 24
25 2017 YTD Sep Performance vs. Financial Targets Organic Growth 5% Constant Currency Net Sales Growth (excl. Acquisitions) +9.3% Underlying EBIT Margin 20% 18.2% LTM YTD 2017/Q3 at 20.6% Net Debt / EBITDA x 1.5x 1.6x (YE 2016) Dividend Policy 50% 51% * * Ordinary dividend of SEK 3.40 per share. In addition to the ordinary dividend an extraordinary dividend of SEK 7.50 per share was distributed to the shareholders in May. Slide 25

26 Looking forward

27 We aim at making 2018 another record year for Thule Group Major initiatives to drive growth across all 4 categories Product development spend at record high levels Additional Sales and Marketing efforts Continued push with new retail tools for Brick&Mortar and On-line in new channels for Luggage and Juvenile Supply Chain efficiencies while meeting higher demands Opening of new plant in Pila Poland in January Year 2 savings from N. America DC set-up We expect a more balanced growth over the year 2017/Q1 very strong with RV Products and Multisport Trailers Big launches in 2018/Q2-Q3 in Sport&Cargo Carriers (as 2017) Key launches in Strollers and Packs, Bags & Luggage 2018/H2 Slide 27

28 Q&A
29 Disclaimer This presentation has been prepared by Thule Group AB (publ) (the Company ) solely for use at this presentation and is furnished to you solely for your information and may not be reproduced or redistributed, in whole or in part, to any other person. The presentation does not constitute an invitation or offer to acquire, purchase or subscribe for securities. By attending the meeting where this presentation is made, or by reading the presentation slides, you agree to be bound by the following limitations. Statements in this presentation, which are not historical facts, such as expectations, anticipations, beliefs and estimates, are forward-looking statements within the meaning of the United States Private Securities Litigation Reform Act of Such statements involve risks and uncertainties which may cause actual results to materially differ from those expressed in such forward-looking statements. This presentation may contain various forward-looking statements that reflect management s current views with respect to future events and financial and operational performance. The words believe, expect, anticipate, intend, may, plan, estimate, should, could, aim, target, might, or, in each case, their negative, or similar expressions identify certain of these forward-looking statements. Others can be identified from the context in which the statements are made. These forward-looking statements involve known and unknown risks, uncertainties and other factors, which are in some cases beyond the Company s control and may cause actual results or performance to differ materially from those expressed or implied from such forward-looking statements. These risks include but are not limited to the Company s ability to operate profitably, maintain its competitive position, to promote and improve its reputation and the awareness of the brands in its portfolio, to successfully operate its growth strategy and the impact of changes in pricing policies, political and regulatory developments in the markets in which the Company operates, and other risks. The information and opinions contained in this document are provided as at the date of this presentation and are subject to change without notice. No representation or warranty (expressed or implied) is made as to, and no reliance should be placed on, the fairness, accuracy or completeness of the information contained herein. Accordingly, none of the Company, or any of its principal shareholders or subsidiary undertakings or any of such person s officers or employees accepts any liability whatsoever arising directly or indirectly from the use of this document. Slide 29
30
Road Show Q3/2017 Thule Group AB. Magnus Welander, Lennart Mauritzson November 2017
 Road Show Q3/2017 Thule Group AB Magnus Welander, Lennart Mauritzson November 2017 Active Life, Simplified. Slide 2 Our Investment Case Attractive Market Attractive Company Favorable mega-trends driving
Year End Report 2017 February 13, Magnus Welander, CEO Lennart Mauritzson, CFO
 Year End Report 2017 Magnus Welander, CEO Lennart Mauritzson, CFO 2017/Q4 Continued good performance in smallest quarter of the year Net sales of SEK 1,006m (983) +2.3% (+6.5% excluding currency effects)
2017/Q1 Road Show Thule Group. Magnus Welander, Lennart Mauritzson April-May 2017
 2017/Q1 Road Show Thule Group Magnus Welander, Lennart Mauritzson April-May 2017 Active Life, Simplified. Slide 2 Our Investment Case Attractive Market Attractive Company Favorable mega-trends driving
Interim Report Q2/2018 July 19, Magnus Welander, CEO Lennart Mauritzson, CFO
 Interim Report Q2/2018 July 19, 2018 Magnus Welander, CEO Lennart Mauritzson, CFO 2018/Q2 Strong performance in Europe Net sales of SEK 2,155m (1,955) +10.2% (+7.0% excluding currency effects) Region Europe
Interim Report Q3/2018 October 26, Magnus Welander, CEO Lennart Mauritzson, CFO
 Interim Report Q3/2018 October 26, 2018 Magnus Welander, CEO Lennart Mauritzson, CFO Q3/2018 Solid quarter with significant launches for future growth Net sales of SEK 1,561m (1,385) +12.7% (+3.8% excluding
Q3 Interim Report 2016 October 28, Magnus Welander, CEO Lennart Mauritzson, CFO
 Q3 Interim Report 2016 October 28, 2016 Magnus Welander, CEO Lennart Mauritzson, CFO Q3 2016 Highlights Continued strong profitability and strong cash generation Net sales of SEK 1,366m (1,343) Thule Group
Roadshow Presentation. May 2015
 Roadshow Presentation May 2015 Today s Presenters Magnus Welander Chief Executive Officer Lennart Mauritzson Chief Financial Officer Joined Thule Group: 2006, CEO since 2010 Born: 1966 Previous Experience:
Interim report for the third quarter, July-September 2017
 Interim report for the third quarter, July-September 2017 Net sales 1 for the quarter amounted to SEK 1,385m (1,295), corresponding to an increase of 6.9 percent. Adjusted for exchange rate fluctuations,
Interim report for the first quarter, January March 2018
 Interim report for the first quarter, January March 2018 Net sales 1 for the quarter amounted to SEK 1,611m (1,526), corresponding to an increase of 5.6 percent. Adjusted for exchange rate fluctuations,
Q1 Presentation April, 2011
 Q1 Presentation 2011 28 April, 2011 Disclaimer This presentation has been prepared by Duni AB (the Company ) solely for use at this investor presentation and is furnished to you solely for your information
Q2 Presentation July, 2011
 Q2 Presentation 2011 15 July, 2011 Disclaimer This presentation has been prepared by Duni AB (the Company ) solely for use at this investor presentation and is furnished to you solely for your information
Q4 Presentation February, 2012
 Q4 Presentation 2011 15 February, 2012 Disclaimer This presentation has been prepared by Duni AB (the Company ) solely for use at this investor presentation and is furnished to you solely for your information
Q Presentation 1
 Q2 2009 Presentation 1 Disclaimer This presentation has been prepared by Duni AB (the Company ) solely for use at this investor presentation and is furnished to you solely for your information and may
Q1 Presentation April, 2013
 Q1 Presentation 19 April, Disclaimer This presentation has been prepared by Duni AB (the Company ) solely for use at this investor presentation and is furnished to you solely for your information and may
Q4 Presentation February, 2013
 Q4 Presentation 2012 14 February, 2013 Disclaimer This presentation has been prepared by Duni AB (the Company ) solely for use at this investor presentation and is furnished to you solely for your information
Interim report for the second quarter, April-June 2017
 Interim report for the second quarter, April-June 2017 Net sales 1 for the quarter amounted to SEK 1,955m (1,725), corresponding to an increase of 13.3 percent. Adjusted for exchange-rate fluctuations,
Year-end report, fourth quarter, October December 2018
 Year-end report, fourth quarter, October December 2018 Fourth Quarter Net sales 1 for the fourth quarter amounted to SEK 1,157m (1,006), corresponding to an increase of 15.0 percent. Adjusted for exchange
Q results 24 April Henri de Sauvage-Nolting, President and CEO Danko Maras, CFO Jacob Broberg, SVP IR
 Q1 2018 results 24 April 2018 Henri de Sauvage-Nolting, President and CEO Danko Maras, CFO Jacob Broberg, SVP IR 2 Q1 highlights Good EBIT delivery and Easter sales Net sales amounted to SEK 1,562m (1,222).
Eng US. Q1 Presentation April, 2015
 Eng US Presentation 2015 24 April, 2015 Eng US Disclaimer This presentation has been prepared by Duni AB (the Company ) solely for use at this investor presentation and is furnished to you solely for your
Third Quarter 2016 Presentation. 11 November, 2016
 Third Quarter 2016 Presentation 11 November, 2016 Henrik Borelius, CEO Tomas Björksiöö, CFO 2 Financial summary of Q3: Continued stable development Net sales SEK 2.6bn (2.5), growth 5%, adjusted growth
Eng US. 14 July 2017
 Eng US 14 July 2017 Presentation 2017 Eng US Disclaimer This presentation has been prepared by Duni AB (the Company ) solely for use at this investor presentation and is furnished to you solely for your
Q results 23 April Bengt Baron, CEO Danko Maras, CFO Jacob Broberg, SVP IR
 Q1 2015 results 23 April 2015 Bengt Baron, CEO Danko Maras, CFO Jacob Broberg, SVP IR 2 Q1 highlights Continued sales growth, improved operating profit (EBIT) and strong cash flow Net sales for the quarter
Q Presentation.
 Q4 Presentation www.duni.com 1 Disclaimer This presentation has been prepared by Duni AB (the Company ) solely for use at this investor presentation and is furnished to you solely for your information
Annual and Sustainability Report
 2017 Annual and Sustainability Report Successful launches were the driving force behind a fantastic year CEO s statement 6 This is Thule Group 4 Rapid growth in new product categories such as strollers
Q presentation. 10 May Nordic market leader in chicken products
 Q1 2016 presentation 10 May 2016 Nordic market leader in chicken products 0 Summary of Q1 2016 Strong growth in net sales, particularly in chilled products Continued strong performance in Sweden Substantial
Second Quarter 2016 Presentation. 28 July, 2016
 Second Quarter 2016 Presentation 28 July, 2016 Henrik Borelius, CEO Tomas Björksiöö, CFO Financial summary: Stable development in net sales and operating profit Net sales SEK 2.5bn (2.4), growth 4.3%,
Eng US. 9 February Q4 Presentation 2017
 Eng US 9 February 2018 Q4 Presentation 2017 Eng US Disclaimer This presentation has been prepared by Duni AB (the Company ) solely for use at this investor presentation and is furnished to you solely for
Fourth Quarter 2016 Presentation. 15 February, 2017
 Fourth Quarter 2016 Presentation 15 February, 2017 Henrik Borelius, CEO Tomas Björksiöö, CFO 2 Financial summary of Q4: Continued stable development Net sales SEK 2,647m (2,564), adjusted growth 4% Operating
First quarter 2017 Presentation. 5 May, 2017
 First quarter 2017 Presentation 5 May, 2017 Henrik Borelius, CEO Tomas Björksiöö, CFO Financial summary of : Continued stable development Net sales SEK 2,661m (2,472), adjusted growth 6% Operating profit
Thule Group publishes prospectus and announces price range for its initial public offering on Nasdaq Stockholm
 Malmö, 13 November, 2014 Thule Group publishes prospectus and announces price range for its initial public offering on Nasdaq Stockholm Following the announcement of its intention to float on 4 November
Q results 19 July Bengt Baron, CEO Danko Maras, CFO Jacob Broberg, SVP IR
 Q2 2013 results 19 July 2013 Bengt Baron, CEO Danko Maras, CFO Jacob Broberg, SVP IR 2 Q2 highlights Significantly improved underlying profitability Net sales of SEK 1,131m (1,212) Underlying EBIT of SEK
To put our customers, employees and suppliers at the heart of our business decisions. Operating results 1Q16
 To put our customers, employees and suppliers at the heart of our business decisions. Operating results 1Q16 Date 13 May 2016 Important Notice The information contained in this presentation is for information
Q Results presentation
 Q1 2016 Results presentation 12 May 2016 1 Disclaimer This presentation (the "Presentation") has been prepared and is issued by, and is the sole responsibility of Telepizza Group, S.A. ( Telepizza" or
Q Interim Report. Jan Sep 2017 CEO Anders Holmgren & CFO Christine Rankin 9 Nov 2017
 Cherry AB (STO: CHER-B.ST) Q3 217 Interim Report Jan Sep 217 CEO Anders Holmgren & CFO Christine Rankin 9 Nov 217 Now listed on Nasdaq Stockholm, Mid Cap segment Dynamic player in the Swedish gambling
Invitation to acquire shares in Thule Group AB (publ)
") Invitation to acquire shares in Thule Group AB (publ) Distribution of this prospectus and acquisition of shares in Thule Group are subject to restrictions in certain jurisdictions, please see the section
Invitation to acquire shares in Thule Group AB (publ) Distribution of this prospectus and acquisition of shares in Thule Group are subject to restrictions in certain jurisdictions, please see the section
Q results 29 April Bengt Baron, CEO Danko Maras, CFO Jacob Broberg, SVP IR
 Q1 2013 results 29 April 2013 Bengt Baron, CEO Danko Maras, CFO Jacob Broberg, SVP IR 2 Q1 highlights Significantly improved underlying profitability Underlying EBIT of SEK 91m (47) Underlying margin of
Mekonomen Group has entered into an agreement to acquire FTZ and Inter-Team to expand operations into Denmark and Poland.
 Mekonomen Group has entered into an agreement to acquire FTZ and Inter-Team to expand operations into Denmark and Poland July 6, 2018 Disclaimer The contents of this presentation document ( Presentation
Q Results. Lars Brorsen (CEO) Christoph Hobo (CFO) November 22, 2018
 Christoph Hobo (CFO) November 22, 2018") Q3 2018 Results Lars Brorsen (CEO) Christoph Hobo (CFO) November 22, 2018 Agenda 1. Highlights Q3 2018 2. Market outlook 3. Detailed results review 4. Company outlook 5. Q&A Appendix 1 Business summary
Q3 2018 Results Lars Brorsen (CEO) Christoph Hobo (CFO) November 22, 2018 Agenda 1. Highlights Q3 2018 2. Market outlook 3. Detailed results review 4. Company outlook 5. Q&A Appendix 1 Business summary
Q Cherry AB (publ) Q Presentation 16 August 2018
 Q Presentation 16 August 2018") Cherry AB (publ) Q2 218 Presentation 16 August 218 Presenters: Morten Klein, Executive Chairman Gunnar Lind, Acting CEO Christine Rankin, CFO Q2218 Cherry at a glance Offering a broad platform of exciting
Cherry AB (publ) Q2 218 Presentation 16 August 218 Presenters: Morten Klein, Executive Chairman Gunnar Lind, Acting CEO Christine Rankin, CFO Q2218 Cherry at a glance Offering a broad platform of exciting
WE PACKAGING FOR A. INVESTING FOR SUSTAINABLE AND PROFITABLE GROWTH Capital Markets Day Stockholm
 WE PACKAGING FOR A INVESTING FOR SUSTAINABLE AND PROFITABLE GROWTH Capital Markets Day 2015 2015-11-12 Stockholm 1 WELCOME TO BILLERUDKORSNÄS CAPITAL MARKETS DAY 13:00 Investing for sustainable and profitable
STRATEGICALLY POSITIONED FOR GROWTH.
 STRATEGICALLY POSITIONED FOR GROWTH. ANNUAL REPORT 2017 SHOP APOTHEKE EUROPE N.V. DR. ULRICH WANDEL, CFO 12 MARCH 2018 DISCLAIMER. 2 THIS PRESENTATION AND ITS CONTENTS ARE NOT FOR RELEASE, PUBLICATION
EVRY ASA Q PRESENTATION CEO BJÖRN IVROTH CFO HENRIK SCHIBLER
 1 EVRY ASA Q1 2018 PRESENTATION CEO BJÖRN IVROTH CFO HENRIK SCHIBLER Agenda Group highlights Business update Financial highlights Business area performance Targets and Concluding remarks Q&A 2 Group highlights
Record first six months
 Record first six months 1 JANUARY 30 JUNE 2016 23 August 2016 Earnings conference call Presenters: Martin Ellis (CEO) and Jonas Olin (CFO) The statements about the future in this document contain an element
2012 Third Quarter Review
 November 2, 2012 1 Panalpina Group Basel, November 2, 2012 November 2, 2012 2 Highlights and key figures Operating and financial review Outlook November 2, 2012 3 Further business growth in Ocean Freight
TomTom Q results. Harold Goddijn - CEO & Marina Wyatt - CFO 18 February 2011
 TomTom Q4 2010 results Harold Goddijn - CEO & Marina Wyatt - CFO 18 February 2011 Financial highlights Content & Services revenue grew by 16% to 98 million Automotive revenue grew by 52% to 55 million
VOLVO CAR GROUP results presentation Third quarter and first nine months 2018
 VOLVO CAR GROUP results presentation Third quarter and first nine months 2018 Nils Mösko, vice president & Head of investor relations Patrik Tolf, Deputy CFO & head of Group Finance DISCLAIMER By accepting
Third quarter results 2018
 1 Third quarter results 2018 25 October 2018 Peter A. Ruzicka, President & CEO Disclaimer This presentation has been prepared by Orkla ASA (the Company ) solely for information purposes. The presentation
KION GROUP AG Q Update Call. Gordon Riske (CEO), Anke Groth (CFO) Frankfurt, 26 July 2018
, Anke Groth (CFO) Frankfurt, 26 July 2018") KION GROUP AG Q2 Update Call Gordon Riske (CEO), Anke Groth (CFO) Frankfurt, 26 July Agenda 1. Highlights 2. Market Update 3. Financial Update 4. Outlook 2 KION GROUP AG Q2 Update Call 26 July Q2 Strategic
KION GROUP AG Q2 Update Call Gordon Riske (CEO), Anke Groth (CFO) Frankfurt, 26 July Agenda 1. Highlights 2. Market Update 3. Financial Update 4. Outlook 2 KION GROUP AG Q2 Update Call 26 July Q2 Strategic
Q CEO Anders Holmgren & CFO Christine Rankin 3 May 2018
 Cherry AB (STO: CHER-B.ST) Q1 218 CEO Anders Holmgren & CFO Christine Rankin 3 May 218 Q1 218: Highlights A strong start and we expect to keep the momentum All business areas reported a solid 218 kick-off
new business seize the potential H&M GROUP CAPITAL MARKETS DAY 2018
 new business seize the potential H&M GROUP CAPITAL MARKETS DAY 2018 Disclaimer THIS PRESENTATION IS NOT AN OFFER OR SOLICITATION OF AN OFFER TO BUY OR SELL SECURITIES. IT IS SOLELY FOR USE AT A CAPITAL
SEB Nordic Seminar. Copenhagen, 8 January 2016
 SEB Nordic Seminar Copenhagen, 8 January 2016 Cloetta the leading Nordic confectionery player Founded by the three Cloetta brothers in 1862 Annual sales of SEK 5,313m in 2014 Adjusted EBIT of SEK 632m
Scandi Standard Q Presentation. 22 November 2017
 Scandi Standard Q3 2017 Presentation 22 November 2017 Highlights Q3 2017 Successful acquisition of Manor Farm (Ireland) - Market leader in Ireland representing ~¼ of group Net Sales and strong margins
NOBINA AB INVESTOR PRESENTATION, YEAR-END REPORT MARCH 2016 FEBRUARY 2017
 1 NOBINA AB INVESTOR PRESENTATION, YEAR-END REPORT MARCH 2016 FEBRUARY 2017 LARGEST PUBLIC TRANSPORT COMPANY IN THE NORDIC REGION Nobina s economies of scale, market expertise and outstanding bus fleet,
2Q RESULTS DISCUSSION
 2Q 2017 2016 RESULTS DISCUSSION Financial Statement - Summary PLN m 2Q 2016 2Q 2017 % of Sales 2Q 2016 % of Sales 2Q 2017 Y/Y Change Net sales 5 341 6 084 14% EBITDA Normalized 110 120 2,1% 2,0% 9% One-off
NOBINA AB Investor presentation, Interim report March 2018 May 2018
 1 NOBINA AB Investor presentation, Interim report March 2018 May 2018 FINANCIAL OVERVIEW ¹ NET SALES EBIT EBT CASH FLOW 2,361 (2,205) 104 (95) 72 (58) -74 (-60) FINANCIAL HIGHLIGHTS Net sales grew 7.1%
16 May M FY 2017/18 FINANCIAL RESULTS
 16 May 2018 6M FY 2017/18 FINANCIAL RESULTS NOTICE TO RECIPIENTS This presentation and any materials distributed in connection herewith (together, the Presentation ) have been prepared by Douglas GmbH
Presentation of FY 2017 Results. February 26 th, 2018
 Presentation of FY 2017 Results February 26 th, 2018 Gestamp 2018 Disclaimer This presentation has been prepared solely for use at this presentation of our results as of and for the quarter ended December
3M FY 2016/17 Financial results. 22 February
 3M FY 206/7 Financial results 22 February 207 0 Table of contents. Key Highlights 2. Financial Update Appendix Notice to recipients This presentation and any materials distributed in connection herewith
9M/Q FINANCIAL RESULTS
 9M/Q3 2017 FINANCIAL RESULTS SIPCHEM Q3 2017 EARNINGS CALL 31 OCTOBER 2017, 15:30 KSA, 12:30 UK, 08:30 EST DISCLAIMER Disclaimer and important information in relation to this presentation This presentation
Interim report July - September 2016
 Interim report July - September 2016 October 19 th, 2016 Mikael Ericson, CEO Erik Forsberg, CFO 2 Q3 2016 Highlights Continued good financial development All financial targets met: EPS growth, PD RoI and
KION Q3 UPDATE CALL Gordon Riske, CEO Thomas Toepfer, CFO Wiesbaden, 14 November 2013
 KION Q3 UPDATE CALL 2013 Gordon Riske, CEO Thomas Toepfer, CFO Wiesbaden, 14 November 2013 AGENDA 1 Highlights 2013 Gordon Riske 2 Financial Update Thomas Toepfer 3 Outlook Gordon Riske 14 November 2013
TomTom Q results. Harold Goddijn CEO Marina Wyatt CFO 30 October 2013
 TomTom Q3 2013 results Harold Goddijn CEO Marina Wyatt CFO 30 October 2013 Operational highlights Q3 2013 Consumer New generation of PNDs widely available in Europe Our GPS sports watches available in
H RESULTS PRESENTATION
 H1 2018 RESULTS PRESENTATION 03.09.2018 H1 2018 RESULTS PRESENTATION DISCLAIMER This presentation (the "Presentation") has been prepared and is issued by, and is the sole responsibility of Telepizza Group,
1Q 2018 Results Presentation
 1Q 2018 Results Presentation EXECUTIVE SUMMARY EUROCASH GROUP ORGANIC WHOLESALE SEGMENT GROWTH BETTER THAN MARKET BACK ON GROWTH TRACK GROSS MARGIN BACK ON TRACK AFTER WEAK 4Q 2017 HO COSTS OPTIMIZATION
KION UPDATE CALL Q Gordon Riske, CEO Thomas Toepfer, CFO Wiesbaden, 7 May 2015
 KION UPDATE CALL 2015 Gordon Riske, CEO Thomas Toepfer, CFO Wiesbaden, 7 May 2015 AGENDA 1 Highlights Gordon Riske 2 Market update Gordon Riske 3 Financial update Thomas Toepfer 4 Outlook Gordon Riske
Strategic Divestment of Product Verticals. December 14, 2017
 Strategic Divestment of Product Verticals December 14, 2017 Disclaimer Important notice The information contained in this presentation is intended solely for your information. Such information is subject
Q Results presentation
 Results presentation Summary Good sales development across all business areas Lower seasonal operating loss Improvements for Americas and Europe & Asia/Pacific Stable for Construction Continued improvement
sustainability leading the change towards a sustainable fashion future H&M GROUP CAPITAL MARKETS DAY 2018
 sustainability leading the change towards a sustainable fashion future Disclaimer THIS PRESENTATION IS NOT AN OFFER OR SOLICITATION OF AN OFFER TO BUY OR SELL SECURITIES. IT IS SOLELY FOR USE AT A CAPITAL
Q4 / FY 2017 RESULTS March 21 st, 2018
 Q4 / FY 2017 RESULTS March 21 st, 2018 1 Disclaimer This document has been prepared by HelloFresh SE (the Company and, together with its subsidiaries, the Group ). All material contained in this document
Q3 report 2018 Press and analyst presentation. 25 October, 2018 Per Strömberg, CEO Sven Lindskog, CFO
 Q3 report 2018 Press and analyst presentation 25 October, 2018 Per Strömberg, CEO Sven Lindskog, CFO In brief Improved EBIT Logistic costs weighing down profits High activity level continues 2 Improved
Company Presentation. 7 th February Delivery Hero AG. Company Presentation.
 Company Presentation 7 th February 2018 1 Our Clear Vision AMAZING FOOD Create an amazing takeaway experience AMAZING ORDERING AMAZING SERVICE 2 We Are an Online Food Ordering and Delivery Marketplace
Investor Presentation First Quarter 2016
 Investor Presentation First Quarter 2016 Control Group: 77% Float: 23% Market Cap: US$14.2 bn (1) LTM 1Q 16 Revenues (2) Countries Plants Routes Sales Centers POS Associates Brands Products US$13.6 Bn
2017 Third Quarter Results
 Samsonite International S.A. HKEX Stock Code: 1910 2017 Third Quarter Results November 13, 2017 Disclosure Statement Page 2 This presentation and the accompanying slides (the Presentation ) which have
Cloetta and LEAF to merge Creating a Nordic market leader. December 16, 2011
 Cloetta and LEAF to merge Creating a Nordic market leader December 16, 2011 Presenters Olof Svenfelt Lennart Bylock Bengt Baron Chairman of Cloetta Board member of Malfors Promotor, current majority shareholder
Opportunity Day Q118. The Stock Exchange of Thailand. 1 June COL Public Company Limited
 COL Public Company Limited 1 June 2018 Opportunity Day Q118 The Stock Exchange of Thailand Important Notice The information contained in this presentation is for information purposes only and does not
Second Quarter 2018 Earnings Results
 Second Quarter 2018 Earnings Results August 9, 2018 Disclaimer BY READING THIS PRESENTATION, YOU ARE DEEMED TO HAVE READ AND ACCEPTED THE STATEMENT BELOW. This presentation has been prepared by Nomad Foods
Raymond James Tech Conference. December 5, 2017
 Raymond James Tech Conference December 5, 2017 Forward-looking statements The following information contains forward-looking statements within the meaning of the Private Securities Litigation Reform Act
2018 Liberty Investor Meeting
 2018 Liberty Investor Meeting Steve Kaufer, CEO and President November 14, 2018 Forward-Looking Statements. Our presentation today, including the slides contained herein, contains "forward-looking statements"
Corral Q August 2017
 Corral Q2 2017 August 2017 Disclaimer This presentation has been prepared by Corral Petroleum Holdings AB (publ) and/or its subsidiaries and affiliates ( Corral ). The information contained in this presentation
Presentation Q3 Interim Report Stockholm, October 23, 2008
 Presentation Q3 Interim Report 2008 Stockholm, October 23, 2008 Agenda 1. Business Summary William Cooper (CEO) 2. Financial Summary Casper Seifert (CFO) 3. Summary and Outlook William Cooper (CEO) 4.
TomTom Q results. Harold Goddijn CEO Marina Wyatt CFO 22 July 2011
 TomTom Q2 2011 results Harold Goddijn CEO Marina Wyatt CFO 22 July 2011 Q2 summary Challenging trading conditions in Consumer Automotive, Licensing and Business Solutions on track Non-cash impairment charge
SMART STEEL. Q Results. Detlef Borghardt, CEO Dr. Matthias Heiden, CFO. August 14, 2018
 SMART STEEL Q2 218 Results Detlef Borghardt, CEO Dr. Matthias Heiden, CFO August 14, 218 Agenda Business Summary Guidance adjustment FY 218 Market update Regional trends: Status and profitability trend
3M/Q FINANCIAL RESULTS
 3M/Q1 2018 FINANCIAL RESULTS SIPCHEM Q1 2018 EARNINGS CALL 02 MAY 2018, 15:45 KSA, 01:45 UK, 08:45 EST DISCLAIMER Disclaimer and important information in relation to this presentation This presentation
Mr Green & Co AB. Interim Report January-June Per Norman CEO & Simon Falk CFO. 21 July 2017 conference call
 Mr Green & Co AB Interim Report January-June 2017 Per Norman CEO & Simon Falk CFO 21 July 2017 conference call Revenues +36.3% EBITDA margin 18.2% Customer deposits +34.4% Q217 vs Q216 2 Strong financial
Investor presentation, Interim report June 2018 August 2018 NOBINA AB. Nobina investor presentation, Q2 2018/19
 1 Investor presentation, Interim report June 2018 August 2018 NOBINA AB SECOND QUARTER WITH SOLID PERFORMANCE NET SALES EBIT EBT CASH FLOW SEK Millions 2,235 (2,169) SEK Millions 117 (106) SEK Millions
RECORD SALES, EBITA AND CASH FLOW ACCELERATED ORGANIC GROWTH TO 19 %
 RECORD SALES, EBITA AND CASH FLOW ACCELERATED ORGANIC GROWTH TO 19 % Bygghemma Group First AB (publ) 1 Today s presenters Mikael Olander President and CEO Martin Edblad CFO Bygghemma Group since 2012 CEO
Q Presentation Avida Holding AB. Johan Anstensrud, CEO Oslo, 31 th May 2017
 Q1 2017 Presentation Avida Holding AB Johan Anstensrud, CEO Oslo, 31 th May 2017 Disclaimer This Presentation has been produced by Avida Holding AB (the Company, Avida or Avida Holding ), solely for use
9M/Q FINANCIAL RESULTS
 9M/Q3 2018 FINANCIAL RESULTS SIPCHEM Q3 2018 EARNINGS CALL Date: Wednesday, October 24, 2018 Time: 03:30 PM (Saudi) 04:30 PM (Dubai) 01:30 PM (London) 08:30 PM (New York) DISCLAIMER Disclaimer and important
Nine Months Results January to September 2014
 Panalpina Group 21 October 2014 Nine Months Results January to September 2014 21 October 2014 2 Highlights and key figures Operating and financial review Outlook Appendix 21 October 2014 3 Highlights and
Scandi Standard (SCST SS) Q Presentation 5 November 2018
 Q Presentation 5 November 2018") Scandi Standard (SCST SS) Q3 2018 Presentation 5 November 2018 Revenue by category Chilled 55% Frozen 19% Ready to eat 18% Other 8% Revenue by channel Retail 68% Food service 15% Export 9% Industry 3%
Scandi Standard (SCST SS) Q3 2018 Presentation 5 November 2018 Revenue by category Chilled 55% Frozen 19% Ready to eat 18% Other 8% Revenue by channel Retail 68% Food service 15% Export 9% Industry 3%
Q3 17 Results November 2017
 Q3 17 Results November 2017 Key highlights Q3 17 Sales volumes: 5.8 million m 3 Gross profit: US$ 406 million EBITDA: US$ 180 million Operating cash flow: US$ 249 million Investment in infrastructure:
3Q 2Q 2016 RESULTS DISCUSSION
 3Q 2Q 2016 RESULTS DISCUSSION Disclaimer This presentation and the associated slides and discussion contain forward-looking statements. These statements are naturally subject to uncertainty and changes
SECOND QUARTER RESULTS August 2018 Ashley Milton, CFO
 SECOND QUARTER RESULTS 2018 9 August 2018 Ashley Milton, CFO Disclaimer THIS PRESENTATION IS NOT AN OFFER OR SOLICITATION OF AN OFFER TO BUY OR SELL SECURITIES IN THE UNITED STATES OF AMERICA OR IN ANY
EVRY ASA Q PRESENTATION CEO BJÖRN IVROTH CFO HENRIK SCHIBLER
 1 EVRY ASA Q3 2018 PRESENTATION CEO BJÖRN IVROTH CFO HENRIK SCHIBLER Agenda Group highlights Business update Financial highlights Business area performance Concluding remarks Q&A 2 Group highlights Q3
3Q 2017 Results Presentation
 3Q 2017 Results Presentation STRATEGIC OUTLOOK Evolution from Wholesale into Retail WHOLESALE + FRANCHISE TESTS IN RETAIL M&A IN RETAIL INTEGRATION STRONG RETAIL BRAND Independent Trade is still growing,
12M/Q FINANCIAL RESULTS
 12M/Q4 2017 FINANCIAL RESULTS SIPCHEM Q4 2017 EARNINGS CALL 06 FEBRUARY 2018, 15:30 KSA, 12:30 UK, 07:30 EST DISCLAIMER Disclaimer and important information in relation to this presentation This presentation
Creating a pan-nordic platform
 Creating a pan-nordic platform June 2018 Norway s leading discount variety retailer Important notice ABOUT THIS PRESENTATION By reading this company presentation (the Presentation ), or attending any meeting
Financial Results 1H August 2016
 Financial Results 1H 2016 August 2016 Disclaimer This presentation is being furnished to you solely for your information and may not be reproduced or redistributed to any other person. This presentation
Third Quarter 2017 Results Jan Jenisch, CEO Ron Wirahadiraksa, CFO. October 27, 2017 LafargeHolcim Ltd 2015
 Third Quarter 2017 Results Jan Jenisch, CEO Ron Wirahadiraksa, CFO October 27, 2017 LafargeHolcim Ltd 2015 01 Initial views Q3 2017 and Outlook Jan Jenisch, Chief Executive Officer 2017 LafargeHolcim 2
Investor Presentation 2016
 Investor Presentation 2016 Control Group: 76% Float: 24% Market Cap: US$11.4 bn (1) 2016 Revenues (2) Countries Plants Routes Sales Centers POS Associates Brands Products US$13.5 Bn 5 YR CAGR: 4.7% 22