Presentation of Addtech
|
|
|
- Martin Lewis
- 5 years ago
- Views:
Transcription

1 1 Presentation of Addtech
2 Addtech in brief A technology trading company Refining link between suppliers and customers Focus on Added Value in product Middle to low-sized volume From standard products to own-brand Some own manufacturing The Nordic region Other markets with unique offer Revenue above SEK 6,000m About 130 decentralised subsidiaries 2


3 Addtech - Business model & Focus B2B trading of technical products 50% 50% Value Adding Tech Provider Provides technical and economical value added 3

4 Strategies for profitable growth Profitable growth is achieved through continuous business and organisational development Market-leading positions Operating mobility Acquisitions 4


5 Year-end report 1 April March
 For comparable units +9 % Acquired growth +5 % Currency effects +1 % Net")
6 1 April March months 4 th quarter Net sales increased by 13 % to SEK 6,089m (5,403) For comparable units +2 % Acquired growth +11 % Currency effects -0 % Net sales increased by 15 % to SEK 1,678m (1,463) For comparable units +9 % Acquired growth +5 % Currency effects +1 % Net sales 6
 EBITa-margin 9.5 % (9.2) Operating profit increased by 24 % to SEK 137m (111) Operating margin 8.2 % (7.6) EBITa-margin 9.3 % (8.")
7 1 April March months 4 th quarter Operating profit increased by 15 % to SEK 501m (437) Operating margin 8.2 % (8.1) EBITa-margin 9.5 % (9.2) Operating profit increased by 24 % to SEK 137m (111) Operating margin 8.2 % (7.6) EBITa-margin 9.3 % (8.7) Operating profit 7

8 8 Net sales & Operating margin
9 1 April March 2014 During the first six months business conditions for the Group were stable on the whole, despite a relatively volatile underlying demand based on a fragmented market in terms of geography, customer segments and product segments During Q3 business conditions were more positive, but sales were weak due to a number of customers taking a cautious approach to purchasing before the end of the calendar year The postponed deliveries from Q3 took place as planned, and as a result Q4 showed very good organic growth in sales and earnings. Business conditions gradually became more stable during the financial year, although demand for production components from Nordic manufacturing companies, above all in the vehicle and engineering industries, remains hesitant. This particularly affects the Components and Industrial Solutions business areas, in which the Danish and Finnish markets experienced tougher market conditions, the Norwegian market was at a high level and the Swedish market recovered slightly during the year. The Group's companies that operate in markets outside the Nordics enjoyed very positive development. For the Life Science and Energy business areas, demand from, for example, Nordic healthcare and customers in the energy segment developed well. 9
10 1 April March 2014 Growth in sales and earnings in the Group during the financial year come from organic growth, implemented acquisitions and the positive impact on earnings of selective cost adjustments that have been made. Combined with our focus on working capital, this has resulted in good cash flow and a robust financial position, which creates good future opportunities. During the financial year five acquisitions made by the Group came into force, adding annual sales of about SEK 300 million. The Group announced two additional acquisitions that bring annual sales of a further SEK 45 million and that came into effect after the end of the financial year. 10


11 11 Customer segments 2013/2014

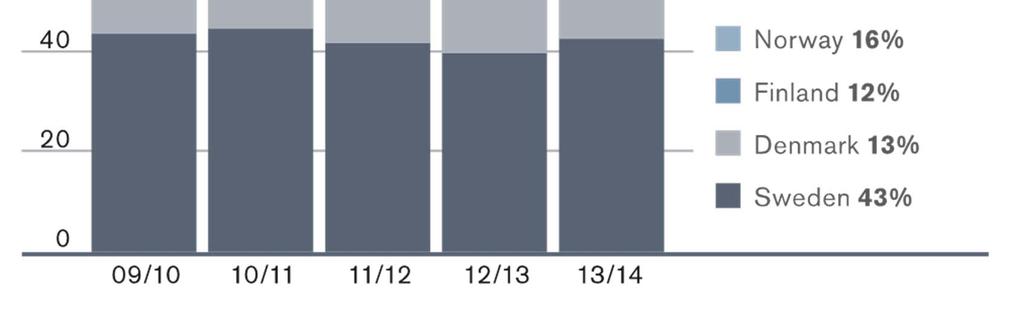
12 12 Net sales by geographical market


13 Addtech Components 12 months 4th quarter Net sales 1,554 1% 423 8% EBIT 96-2% 27 27% ROS 6.2% 6.4% 6.5% 5.6% All in all for the business area, demand for production components from Nordic manufacturing companies gradually became more stable during the financial year, but the variations between different customer segments and geographical areas remain Customers in, above all, the vehicle and engineering industry segments and in electronics production reduced their pace of production during the year. The most positive demand was seen in customer segments such as energy, oil and gas in Norway and from large machinery constructors who sell to other markets outside the vehicle and engineering industry segments. 13


14 Addtech Energy 12 months 4th quarter Net sales 1,975 25% % EBIT % 59 43% ROS 10.1% 9.7% 10.5% 9.2% Overall, demand for the business area was good during the year, with a favourable start and a strong end to the year, but with a weaker period in Q3 Demand for products for electrical power distribution and transmission was good throughout the year After a very high volume of deliveries in the transmissions segment, our customers announced slightly lower investment levels, which may affect the business area in the short term The business conditions for battery solutions in the Nordic markets improved during the year The market for products in electrical installation, which was weak during part of the financial year, showed signs of a greater willingness to invest during the final quarter. 14


15 Addtech Industrial Solutions 12 months 4th quarter Net sales 1,173 2% 318 8% EBIT 93 0% 30 9% ROS 7.9% 8.1% 9.3% 9.3% Following a relatively weak third quarter, demand in the latest quarter stood at a favourable level. Business conditions for the business area continue to differ extensively between different geographical markets and product areas. The business climate for products to the special vehicles industry has become more positive, but remains weaker in the mining segment. Demand from customers in forestry, paper and pulp improved in Sweden, but it was subdued in other markets. Sales were stable regarding electric motor solutions, products in polymer materials in the Danish market and machinery components and production equipment to industrial aftermarket customers. 15


16 Addtech Life Science 12 months 4th quarter Net sales 1,393 22% % EBIT % 25-8% ROS 9.0% 9.5% 6.7% 8.3% The business area enjoyed good growth in earnings during the financial year despite a, relatively speaking, weaker result in Q4. For the business area as a whole, demand continued to grow during the final quarter. Sales of diagnostic equipment and reagents to the Nordic healthcare sector were stable during the quarter, while they increased for measuring and analysis instruments to the Nordic process industry, especially in the marine segment. Demand for equipment and reagents to healthcare laboratories and research laboratories also continued to develop well. 16

17 Cash flow For the most recent 12-month period, cash flow per share was SEK
18 Key financial indicators (SEKm) 31 Mar Mar 13 Total equity (SEKm) 1,349 1,113 Equity per share, SEK Equity ratio, % Return on equity, % Return on capital employed, % Financial net debt (SEKm) of which pension liability of which other liabilites Financial net debt / EBITDA Net debt / equity ratio, times Interest coverage ratio, times Average number of employees 2,100 1,815 Number of employees at end of period 2,150 2,011 18
19 Income statement 3 months ending 12 months ending (SEKm) 31 Mar Mar Mar Mar 13 Net Sales 1,678 1,463 6,089 5,403 Cost of sales & op. expenses* -1,545-1,353-5,600-4,979 Other operating items Operating profit Financial income & expenses Profit after financial items Income tax expense Net profit Earnings per share, SEK * Op. expenses include depreciation and amortisation - of property, plant and equipment in amount of intangible assets in amounts of EBIT-margin, % EBITa-margin, %
20 Cash flow statement 3 months ending 12 months ending (SEKm) 31 Mar Mar Mar Mar 13 Profit after financial items Adj. for non cash items Income tax paid Changes in working capital Cash flow from operating activities Net investment in non-current assets Acquisitions and disposals Dividend paid Repurchase of own shares Other financing activities Period s cash flow
21 Balance sheet (SEKm) 31 Mar Mar 13 Goodwill Other intangible non-current assets Property, plant and equipment Non-current financial assets Inventories Current receivables 1, Cash and cash equivalents Total assets 3,465 3,062 Total equity 1,349 1,113 Interest-bearing provisions & liabilities Non-interest-bearing prov. & liabilities 1,270 1,114 Total equity & liabilities 3,465 3,062 21

22 22
Interim report Q1 Q2 Q3 Q4
 Interim report Q1 Q2 Q3 Q4 1 April 3 September 21 Read more at www.addtech.com INTERIM REPORT 1 APRIL 3 SEPTEMBER 21 (6 MONTHS) 1 April 3 September 21 (6 months) Revenue increased 15 percent, to SEK 2,35
Year-end report 1 APRIL MARCH 2016
 Year-end report 1 APRIL 2015-31 MARCH 2016 1 January 2016 31 March 2016 (3 months) Net sales in the fourth quarter rose by 59 percent to SEK 452.7 million (284.7), of which organic growth totalled 6 percent.
INTERIM REPORT 1 JANUARY 31 MARCH 2018
 INTERIM REPORT 1 JANUARY 31 MARCH 2018 Growth continues 1 JANUARY 31 MARCH 2018 (3 MONTHS) Net sales rose by 4 percent to SEK 597 million (576). EBITA rose by 7 percent to SEK 57 million (54), corresponding
Interim report 1 April 30 September 2006 (6 months)
") Value Adding Tech Provider Interim report April 3 September (6 months) Net revenues increased to,75 (,569). Operating income increased by 3 percent to 56 (9). During the second quarter net revenues increased
Value Adding Tech Provider Interim report April 3 September (6 months) Net revenues increased to,75 (,569). Operating income increased by 3 percent to 56 (9). During the second quarter net revenues increased
INTERIM REPORT 1 APRIL - 30 SEPTEMBER 2018
 T H E I N T E R I M P E R I O D Summary of the Group's development INTERIM REPORT 1 APRIL - 30 SEPTEMBER 2018 SECOND QUARTER (1 JULY - 30 SEPTEMBER 2018) Net sales increased by 24 percent and amounted
Read more at Annual Report 2009/2010
 Read more at www.addtech.com Annual Report 2009/2010 Table of Contents The Year in Brief 1 Overview 2 President and CEO Interview 4 Addtech in Brief 6 Administration Report 10 Financial Statements 21 Notes
Interim report 1 April 30 September 2008 (6 months)
") Value Adding Tech Provider Interim report 1 April 3 September (6 months) Revenue increased 13 percent, to MSEK 2,21 (1,955). Operating profit increased 9 percent, to MSEK 213 (195). During the second quarter,
Value Adding Tech Provider Interim report 1 April 3 September (6 months) Revenue increased 13 percent, to MSEK 2,21 (1,955). Operating profit increased 9 percent, to MSEK 213 (195). During the second quarter,
Financial Report 1 April March 2018
 Financial Report 1 April 2017-31 March Fourth quarter (1 January - 31 March ) Revenue amounted to 960 (968). EBITA totalled 53 (46), corresponding to an EBITA margin of 5.5 percent (4.8). Operating profit
Q1 Presentation April, 2011
 Q1 Presentation 2011 28 April, 2011 Disclaimer This presentation has been prepared by Duni AB (the Company ) solely for use at this investor presentation and is furnished to you solely for your information
2,150 EMPLOYEES 6,089 MILLION IN NET SALES ANNUAL REPORT 2013/2014 ADDTECH ADDS VALUE READ OUR ANNUAL REPORT 2013/2014 AT
 ANNUAL REPORT 2013/2014 2,150 EMPLOYEES ADDTECH ADDS VALUE 6,089 MILLION IN NET SALES READ OUR ANNUAL REPORT 2013/2014 AT WWW.ADDTECH.COM ENTREPRENEURSHIP IS ALL ABOUT THE RIGHT MINDSET JOHAN SJÖ, CEO
THE BERGMAN & BEVING GROUP
 THE BERGMAN & BEVING GROUP Interim report for the period April 1 September 3, Income after financial items increased by 78% to MSEK 282 (158). This result includes surplus funds from SPP in an amount of
INTERIM REPORT 1 JANUARY 30 JUNE 2018
 INTERIM REPORT 1 JANUARY 30 JUNE 2018 Continued favourable development 1 APRIL 30 JUNE 2018 (3 MONTHS) Net sales increased by 9 percent to SEK 622 million (572). EBITA increased by 9 percent to SEK 63
Q1 Presentation April, 2013
 Q1 Presentation 19 April, Disclaimer This presentation has been prepared by Duni AB (the Company ) solely for use at this investor presentation and is furnished to you solely for your information and may
Q2 Presentation July, 2011
 Q2 Presentation 2011 15 July, 2011 Disclaimer This presentation has been prepared by Duni AB (the Company ) solely for use at this investor presentation and is furnished to you solely for your information
Strong growth at Nolato Medical
 Nolato three-month interim report 2007, page 1 of 11 Nolato AB (publ) three-month interim report 2007 Strong growth at Nolato Medical First quarter 2007 in brief Sales totaled SEK 560 M (594) The acquisition
Q presentation. 10 May Nordic market leader in chicken products
 Q1 2016 presentation 10 May 2016 Nordic market leader in chicken products 0 Summary of Q1 2016 Strong growth in net sales, particularly in chilled products Continued strong performance in Sweden Substantial
INTERIM REPORT 3 MONTHS
 - B&B TOOLS provides the industrial and construction sectors in northern Europe with industrial consumables, industrial components and related services. The Group has annual revenue of approximately SEK
WA WallVision AB (publ), corp. no Interim report January 1, 2016 September 30, 2016 THIRD QUARTER: ORGANIC GROWTH IN CORE MARKETS
, corp. no Interim report January 1, 2016 September 30, 2016 THIRD QUARTER: ORGANIC GROWTH IN CORE MARKETS") All figures pertain to the Group unless otherwise stated. Comparisons in the interim report refer to the corresponding period in the 2015 fiscal year, unless otherwise stated. THIRD QUARTER: ORGANIC GROWTH
All figures pertain to the Group unless otherwise stated. Comparisons in the interim report refer to the corresponding period in the 2015 fiscal year, unless otherwise stated. THIRD QUARTER: ORGANIC GROWTH
ANNUAL REPORT 2016/2017
 ANNUAL REPORT 2016/2017 The year in brief SUCCESSFUL YEAR EXCEEDS FINANCIAL TARGETS CEO comment EFFICIENCY WORK AND ACQUISITIONS GAVE STRONG PROFIT GROWTH Net sales 7 178 MILLIONS ADDTECH IN BRIEF Addtech
Interim report Q First quarter 2017
 Interim report Q1 2017 First quarter 2017 Incoming orders rose 15% to SEK 702 million (610) Net sales rose 17% to SEK 671 million (574) Operating profit rose 28% to SEK 73 million (57) EBITA rose 25% to
Makes it easier to be professional. Q report presentation January 26, 2017
 Makes it easier to be professional Q4 2017 report presentation January 26, 2017 1 Q4 in brief Strong fourth quarter High activity level Organic sales growth of 11% Growth in all segments Adj. EBITA of
INTERIM REPORT JANUARY MARCH 2018
 24 April 2018 INTERIM REPORT JANUARY MARCH 2018 Reporting period January March Net sales increased by 10.4 per cent to SEK 2,674 (2,423) million. Organically, net sales decreased by 0.6 per cent EBITA*
Strong growth and increased earnings across all business areas
 Nolato AB three-month interim report 218, page 1 of 18 Nolato AB (publ) three-month interim report 218 Strong growth and increased earnings across all business areas First quarter of 218 in brief Sales
Makes it easier to be professional
 Makes it easier to be professional Handelsbanken Nordic Mid/small Cap Seminar June 8, 2017 President and CEO Johan Nilsson 2 2 Introduction One-Stop-Shop multi channel offering for professionals Branches
Earnings remain strong with solid return on capital
 Nolato AB nine-month interim report 213, page 1 of 15 Nolato AB (publ) nine-month interim report 213 Earnings remain strong with solid return on capital Third quarter of 213 in brief Sales rose by 12%
Strong quarter for the Nolato Group
 Nolato AB (publ) nine-month interim report 2007 Strong quarter for the Nolato Group Third quarter 2007 in brief Strong margin for Nolato Telecom and continued growth in sales for Nolato Medical Sales totaled
Q4 Presentation February, 2013
 Q4 Presentation 2012 14 February, 2013 Disclaimer This presentation has been prepared by Duni AB (the Company ) solely for use at this investor presentation and is furnished to you solely for your information
Year-end report January - December 2015
 Year-end report January - December 1 October - 1) Revenue increased 5 per cent to SEK 1,447 M (1,373). Excluding the acquisition of Opus Equipment, revenue increased 3 per cent. Adjusted for currency effects
Q MÅRTEN ANDERSSON, CEO MATTIAS BJÖRK, CFO AUGUST 17, 2017
 Q2 2017 MÅRTEN ANDERSSON, CEO MATTIAS BJÖRK, CFO AUGUST 17, 2017 FINANCIAL DEVELOPMENT IN Q2 2017. Net sales SEK 872m (927) EBITA SEK 99m (117) Operating cash flow SEK 89m (132) Q2 2 A WEAK QUARTER WITH
Jan-March Jan-March 12-months rolling. Jan-Dec SEK m
 Instalco Interim report January - March Continued healthy growth and good profitability January March Net sales increased by SEK 45.2 million to SEK 689 (474) million. Organic growth was 9.3 percent. Adjusted
Q presentation. 19 November 2015
 Q3 2015 presentation 19 November 2015 1 Today s presenters Axel Hjärne Chief Executive Officer Gert Sköld Chief Financial Officer 2 Eltel in brief Q3 2015 business performance Q3 2015 financials Market
BUSINESS REVIEW Q1/2018 / CRAMO PLC Q1
 BUSINESS REVIEW /2018 / CRAMO PLC 1 BUSINESS REVIEW /2018 / CRAMO PLC STRONG FIRST QUARTER FOR BOTH DIVISIONS - KBS INFRA INCLUDED FROM 1 ST OF MARCH JANUARY MARCH 2018 Sales EUR 175.3 (162.9) million,
Alfa Laval AB (publ) Interim report January 1 March 31, 2005
 Interim report January 1 March 31, 2005") Alfa Laval AB (publ) Interim report January 1 March 31, 2005 "Orders received during the first quarter 2005 increased with five percent, excluding exchange rate variations. Alfa Laval further strengthened
Alfa Laval AB (publ) Interim report January 1 March 31, 2005 "Orders received during the first quarter 2005 increased with five percent, excluding exchange rate variations. Alfa Laval further strengthened
Q1 Q Q3 Q EUR million Jan-Mar 2018 Jan-Mar 2017 Change, % EUR million Jan-Dec 2017
 Stockholm, Sweden, 4 May Eltel Group Interim report January March January March Group net sales decreased 10.5% to EUR 266.6 million (297.8), mainly as a result of divestments and on-going discontinuation
Strong online sales and improved margins
 FIRST QUARTER SEPTEMBER 1, 2016 NOVEMBER 30, 2016 Strong online sales and improved margins Interim Report September November 2016 First quarter Net sales for the quarter increased 7.5 per cent to SEK 2,284
A solid quarter and best year ever
 YEAR-END REPORT, January December 2018 Helsingborg, 12 February 2019 A solid quarter and best year ever Fourth quarter of 2018 Consolidated net sales increased by 24 percent to SEK 692 m (558), of which
Interim report. January - March First quarter January - March 2015
 Interim report January - March 2015 April 28, 2015 First quarter January - March 2015 Group net sales in the first quarter 2015 amounted to 144.2 MSEK (113.7), an increase by 26.8 percent compared to the
Eng US. 9 February Q4 Presentation 2017
 Eng US 9 February 2018 Q4 Presentation 2017 Eng US Disclaimer This presentation has been prepared by Duni AB (the Company ) solely for use at this investor presentation and is furnished to you solely for
Year in brief. Contents
 Annual Report 2013 Year in brief Order intake rose 7% to SEK 9,014 million (8,444). Net sales rose 5% to 8,831 million (8,384). Operating profit before amortisation of intangible non-current assets attributable
Good earnings improvement
 Interim report January-March 218 Good earnings improvement Net sales for the first quarter of 218 rose 3 percent to SEK 8,577 M (8,298). Organic sales increased 4 percent. Excluding project deliveries,
Interim report 1 January 31 March 2018 Actic Group AB
 Q1 Interim report 1 January 31 March Actic Group AB Efficiency enhancements and acquisitions strengthen results INTERIM REPORT 1 JANUARY 31 MARCH ACTIC GROUP AB 1 Interim report 1 January 31 March First
Proffice grows on a stagnating market
 Proffice grows on a stagnating market Q1 2012 year-on-year comparison Net sales increased 9 per cent to SEK 1,200 million (1,096) EBITA and operating profit declined 13 per cent to SEK 40 million (46)
Year end report Jan Dec February, 2019
 Year end report Jan Dec 2018 6 February, 2019 2 3 Who is Henrik Hjalmarsson? Born: 1976 Previous positions: SVP Inwido Sweden-Norway (2017-2019), CEO Findus Nordic (2016-2017), CEO Findus Sweden and Denmark
Interim report. January June Mattias Björk, CFO. Mårten Andersson, CEO. 17 August 2018
 Q2 Interim report January June Mårten Andersson, CEO Mattias Björk, CFO 17 August Financial development in Q2 Net sales SEK 1,428m (872) EBITA SEK 86m (99) 1600 1400 1200 1000 800 600 400 200 0 160 140
Continued margin improvements (All figures in brackets refer to the corresponding period in 2009)
") Continued margin improvements (All figures in brackets refer to the corresponding period in 2009) Sales for the third quarter amounted to SEK 3,228 million (3,568). Organic growth was negative 1 per cent.
Continued margin improvements (All figures in brackets refer to the corresponding period in 2009) Sales for the third quarter amounted to SEK 3,228 million (3,568). Organic growth was negative 1 per cent.
Interim Report Q3 2013
 Interim Report Q3 Q3 A CHALLENGING QUARTER ADDNODE GROUP CAN DO BETTER Net sales totaled SEK 301.4 (291.3) M, up 3 percent. EBITA amounted to SEK 14.4 (27.1) M, and EBITA-margin of 4.8 (9.3) percent. 1)
Interim second quarter report 2018
 Interim second quarter report 2018 Press release 19 July 2018 Second quarter 2018 Net sales increased by 18% to MSEK 8,056 (6,818). Organic growth was 8% (8). Operating profit (EBIT) increased by 24% to
Q4 Presentation February, 2012
 Q4 Presentation 2011 15 February, 2012 Disclaimer This presentation has been prepared by Duni AB (the Company ) solely for use at this investor presentation and is furnished to you solely for your information
Interim report. January September Mårten Andersson, CEO Mattias Björk, CFO 6 November 2018
 Q3 Interim report January September Mårten Andersson, CEO Mattias Björk, CFO 6 November Financial development in Q3 Net sales SEK 1,470m (1 224) EBITA SEK 123m (96) 1600 1400 1200 1000 800 600 400 200
Continued earnings improvement
 Interim report April-June Continued earnings improvement Net sales for the second quarter of rose 6 percent to SEK 8,786 M (8,265). Organic sales increased 2 percent. Excluding project deliveries, the
RECORD-BREAKING FOURTH QUARTER SALES AND EBITA AS MARKET CONDITIONS RETURN TO NORMAL
 RECORD-BREAKING FOURTH QUARTER SALES AND EBITA AS MARKET CONDITIONS RETURN TO NORMAL Bygghemma Group First AB (publ) 1 Today s presenters Mikael Olander President and CEO Martin Edblad CFO Bygghemma Group
Interim Report for First Quarter 2015
 Interim Report for First Quarter First quarter The quarter began with weak order intake, which gradually improved. Order intake was 10 percent lower than in the strong first quarter of Sales volumes were
Year-end report 1 Jan 31 Dec 2013
 INDUTRADE YEAR-END REPORT JANUARY DECEMBER 2013 Year-end report 1 Jan 31 Dec 2013 1 JANUARY 31 DECEMBER 2013 Order intake rose 7% to SEK 9,014 million (8,444). For comparable units the increase was 2%.
First Quarter 2017 April 19, qlirogroup.com
 First Quarter 2017 April 19, 2017 BUSINESS UPDATE Marcus Lindqvist, CEO 2 Increased Gross Profit and Credit Market Licence Highlights Strategy Focus 1. E-commerce gross profit increased 15 per cent to
Report Third quarter evry.com
 Report Third quarter 2012 evry.com About EVRY EVRY is one of the leading IT companies in the Nordic countries, with a strong local and regional presence in 50 Nordic towns and cities. Through its knowledge,
Q Martin Ödman CEO
 Q1 2014 Martin Ödman CEO The first quarter in brief The total income in the quarter increased by 3 % compared with the same period last year» Taking into account the currency effects Adjusted for onetime
4th quarter. Year Continuing operations (NOK in millions) Actual Actual Growth Actual Actual Growth Actual
 Actual Actual Growth Actual Actual Growth Actual") 2 4th quarter Year Year Continuing operations 2017 2016 2017 2016 2016 (NOK in millions) Actual Actual Growth Actual Actual Growth Actual Revenue 2 809 2 120 32,5 % 9 346 7 855 19,0 % 7 855 EBITDA 615
2 4th quarter Year Year Continuing operations 2017 2016 2017 2016 2016 (NOK in millions) Actual Actual Growth Actual Actual Growth Actual Revenue 2 809 2 120 32,5 % 9 346 7 855 19,0 % 7 855 EBITDA 615
Interim report January March 2018
 Interim report January March 218 Strong growth and stable margin First quarter 218 Net sales rose by percent to SEK 945 million (815). Organic growth was 9 percent. Order intake was in line with net sales.
Third Quarter 2016 Presentation. 11 November, 2016
 Third Quarter 2016 Presentation 11 November, 2016 Henrik Borelius, CEO Tomas Björksiöö, CFO 2 Financial summary of Q3: Continued stable development Net sales SEK 2.6bn (2.5), growth 5%, adjusted growth
Growth and better earnings
 Interim report and year-end report Growth and better earnings Fourth quarter Net sales for the fourth quarter of rose 4 percent to SEK 7,78 M (7,434). Organic sales increased 7 percent. Excluding project
Interim report Third quarter 2018
 Interim report Third quarter 2018 Press release 26 October 2018 Third quarter 2018 Net sales increased by 15% to MSEK 7,458 (6,492). Organic growth was 7% (10). Operating profit (EBIT) was MSEK 524 (510).
Func Food Group Financial Release / Q1 2018
 Func Food Group Financial Release / Q1 2018 Func Food Group Financial Release / Q1 2018 Func Food Group / Q1 2018 3 FUNC FOOD GROUP IN BRIEF Func Food Group ( FFG ) is a Nordic wellness company, which
Financial statement for fourth quarter and the full year 2004
 Financial statement for fourth quarter and the full year 24 THE LINDAB GROUP OPERATING PROFIT INCREASED FROM SEK 35 MILLION TO SEK 374 MILLION CASH FLOW AMOUNTED TO SEK 269 MILLION ORGANIC GROWTH AT 7.4
Strong earnings and high margin
 Nolato AB nine-month interim report 214, page 1 of 15 Nolato AB (publ) nine-month interim report 214 Strong earnings and high margin Third quarter of 214 in brief Sales stood at SEK 1,95 million (1,119)
Q1 January 1 31 March May 2016
 Q1 January 1 31 March 2016 19 May 2016 Humana at a glance Humana highlights Clear focus on full responsibility 1 Leading Nordic care company founded in 2001 with four strong business areas Focus on full
Strong cash flow significant growth for Nolato Medical
 Nolato year-end report 2006, page 1 of 12 Nolato AB (publ) year-end report 2006 Strong cash flow significant growth for Nolato Medical Fourth quarter 2006 in brief Sales totaled SEK 603 M (613) EBITA excluding
Very strong license sales
 Interim Report JANUARY MARCH 214 Very strong license sales License revenue for January-March increased with 27 percent to SEK 53.4 (42.) million Sales for January-March increased with 9 percent to SEK
Very strong quarter for Medical Solutions
 Nolato AB nine-month interim report 218, page 1 of 21 Nolato AB (publ) nine-month interim report 218 Very strong quarter for Medical Solutions Third quarter of 218 in brief Sales increased to SEK 1,98
Positive development for all business areas
 Nolato AB three-month interim report 2012, page 1 of 14 Nolato AB (publ) three-month interim report 2012 Positive development for all business areas First quarter of 2012 in brief Sales increased by 10%
Interim first quarter report 2018
 Interim first quarter report 2018 Press release 27 April 2018 First quarter 2018 Net sales increased by 9% to MSEK 7,161 (6,568). Organic growth, which was negatively affected by the Easter effect* compared
Q4 YEAR-END REPORT SEPTEMBER 1, 2017 AUGUST 31, 2018
 Q4 YEAR-END REPORT SEPTEMBER 1, 2017 AUGUST 31, 2018 Interim Report September 2017 August 2018 Higher service content strengthening profitability Fourth quarter Net sales rose 11.6 per cent to SEK 2,524
Viking Assistance Group AS. Quarterly Report 3Q17 July September 2017
 Viking Assistance Group AS Quarterly Report 3Q17 July September 2017 THIRD QUARTER 2017 SUMMARY Group revenues of MNOK 179,0 Group EBITDA of MNOK 12,6 Solid assistance margins during the quarter Higher
Ework commences year on-track
 Interim report Q1 2018 Ework commences year on-track First Quarter 2018 compared to Net sales increased by 10% to SEK 2,623 M (2,389). EBIT was down by 18% to SEK 22.5 M (27.4). Order intake fell by 5%
Candyking Q1 report Flexibilitet
 Candyking Q1 report 2014 Flexibilitet First quarter 2014 Candyking s business is highly seasonal with Easter representing the strongest sales period during the year for our main markets Sweden and Norway.
INFRATEK GROUP AS Third quarter 2015
 INFRATEK GROUP AS Third quarter 2015 Highlights third quarter Operating revenue of NOK 641.1 million (NOK 702.5 million) Third-quarter operating profit of NOK 46.4 million (NOK 40.9 million) Operating
Q Presentation 1
 Q2 2009 Presentation 1 Disclaimer This presentation has been prepared by Duni AB (the Company ) solely for use at this investor presentation and is furnished to you solely for your information and may
Year-end report Jan-Dec February, 2018
 1 Year-end report Jan-Dec 2017 1 February, 2018 Executive summary on development We follow our strategic plan Good sales growth continues Supply chain back on track Efficiency improvements according to
hms networks First quarter Last twelve months INTERIM REPORT 2017 JANUARY - MARCH
 hms networks INTERIM REPORT JANUARY - MARCH Last twelve months Net sales for the last twelve months amounted to SEK 1 030 m (732) corresponding to a 37 % increase in local currencies. The revaluation of
VBG GROUP INTERIM REPORT Q3JANUARY SEPTEMBER 2018
 VBG GROUP INTERIM REPORT JANUARY SEPTEMBER The VBG Group is an international industrial group with some 1,6 employees in 18 countries. The Parent Company VBG Group AB is a long-term owner that provides
NYNAS Interim report 1 january 30 June 2014
 NYNAS Interim report 1 january 30 June 2014 2 Interim report 1 january 30 June 2014Q2 Nynas AB (Publ.), corporate re. no 556029-2509, parent company for Nynas. Nynas is a leading international group specialised
Record earnings despite challenges
 Interim report and year-end report Record earnings despite challenges Fourth quarter Net sales for the fourth quarter of rose 8 percent to SEK 8,342 M (7,78). Organic sales increased 2 percent. Excluding
SEK 155 million (87).
.") Year-end report 1 Jan 31 Dec 2011 1 JANUARY 31 DECEMBER 2011 Net sales for the year rose 19% to SEKK 7,994 million (6,745). The T increasee for comparable units was 10% %. Operating profit before amortisation
Year-end report 1 Jan 31 Dec 2011 1 JANUARY 31 DECEMBER 2011 Net sales for the year rose 19% to SEKK 7,994 million (6,745). The T increasee for comparable units was 10% %. Operating profit before amortisation
Strong second quarter with earnings growth
 INTERIM REPORT, January June 2018 Helsingborg, 16 August 2018 Strong second quarter with earnings growth Second quarter of 2018 Consolidated net sales increased by 22 percent to SEK 736 m (603), of which
Knowit AB Interim Report
 ... Knowit AB Interim Report January march 2013... Highlights... Continued weak market Results and margin on par with the fourth quarter 2012 Strong growth in the public sector, but weaker in Finance and
Interim Report January March 2017
 Interim Report January March 2017 First quarter 2017 Net sales increased by 4 per cent in the first quarter, to SEK 1,930 (1,859) million. Organic growth excluding foreign exchange effects was 1 per cent.
SEK M Q Q Change, % 9M M 2017 Change, % Net sales 8,300 7, ,663 23,873 7 Organic sales, %
 Interim report July September A solid quarter Net sales for the third quarter of rose 14 percent to SEK 8,3 M (7,31). Organic sales increased 4 percent. Excluding project deliveries, the corresponding
Strong online performance and increased margins
 Q3 THIRD QUARTER MARCH 1, 2016 MAY 31, 2016 Strong online performance and increased margins Summary of third quarter of 20 Third quarter Net sales for the quarter rose 3.6 per cent to SEK 1,989 million
P R E S S R E L E A S E
 P R E S S R E L E A S E from ASSA ABLOY AB (publ) November 13 2000 No. 19/00 INTERIM REPORT JANUARY-SEPTEMBER 2000 Sales increased by 29% to SEK 9,747 M (7,532) Income before tax increased by 42% to SEK
Interim report 1 January 31 March 2017 Actic Group AB
 Q1 Interim report 1 January 31 March Actic Group AB Continued growth and strengthened position INTERIM REPORT 1 JANUARY 31 MARCH ACTIC GROUP AB 1 Interim report 1 January 31 March First quarter January
Interim Report January - March 2015
 Interim Report January - March 2015 The period January - March 2015* Net sales increased by 23% in the period to SEK 1,848 (1,508) m. Adjusted EBITA improved by SEK 19 m, and amounted to SEK 100 (81) m.
INTERIM REPORT JANUARY MARCH 2012
 INTERIM REPORT JANUARY MARCH RECOVERY DESPITE UNCHANGED MARKET CONDITIONS FIRST QUARTER Sales revenues increased by 8 percent to SEK 192.4 million (178.9) The operating result amounted to SEK 5.0 million
Interim report Q First quarter 2018
 Interim report 2018 First quarter 2018 Incoming orders rose 11% to SEK 780 million (702) Net sales rose % to SEK 757 million (671) Operating profit rose 11% to SEK 81 million (73) EBITA rose 10% to SEK
2 ND QUARTER 2017 RESULTS ANNOUNCEMENT
 2 ND QUARTER 2017 RESULTS ANNOUNCEMENT TOMRA SYSTEMS ASA 2 nd Quarter Results 19.07.2017 HIGHLIGHTS FROM THE QUARTER Revenues Gross margin Operating expenses EBITA Cashflow TOMRA Collection TOMRA Sorting
Year-end report 2017 January - December YEAR-END REPORT 2017 OCTOBER DECEMBER 2017 JANUARY DECEMBER 2017
 Year-end report 2017 January - December Troax Group AB (publ) Hillerstorp 12th of February, 2018 YEAR-END REPORT 2017 OCTOBER DECEMBER 2017 Order intake increased by 17 per cent to 38,4 (32,8) MEUR. Adjusted
Interim announcement 1st to 3rd quarter 2015
 Interim announcement 1st to 3rd quarter 2015 Danfoss at a glance Danfoss engineers technologies that enable the world of tomorrow to do more with less. We meet the growing need for infrastructure, food
Interim Review January 1 June 30, 2016
 Interim Review January 1 June 30, 2016 2 Figures in brackets refer to the corresponding period in 2015, unless otherwise stated. The Process Automation Systems (PAS) business was divested on April 1, 2015.
Q2 INTERIM REPORT DECEMBER 1, 2017 FEBRUARY 28, 2018
 Q2 INTERIM REPORT DECEMBER 1, 2017 FEBRUARY 28, 2018 Interim Report December 2017 February 2018 Continued margin improvement and robust performance in SMB Second quarter Net sales rose 8.8 per cent to
Half-year report January-June 2018 Published on July 18, 2018
 Half-year report January-June 2018 Published on July 18, 2018 Second quarter 2018 Increased sales and higher result Sales increased 7 per cent to 3,461 MSEK (3,230). Operating profit increased 9 per cent
Second quarter Yet another strong quarter!
 Second quarter 2007 Yet another strong quarter! During the second quarter 2007 we had another record quarter with the highest ever operating result as well as operating margin. Orders received increased
Interim fourth quarter and Year-End Report 2017
 Ahlsell's Year-End Report January December 2017 Interim fourth quarter and Year-End Report 2017 Press release 26 January 2018 Fourth quarter 2017 Net sales increased by 10 percent to SEK 7,606 (6,902)