VOLVO CAR GROUP results presentation January December 2016
|
|
|
- Louisa Lawrence
- 5 years ago
- Views:
Transcription

1 VOLVO CAR GROUP results presentation January December Håkan Samuelsson, president & CEO Hans oscarsson, senior vice president & CFO
.")
2 DISCLAIMER By accepting this document, the person to whom it is provided (the Recipient ) agrees to be bound by the following obligations and limitations. This document has been prepared and issued by Volvo Car AB (together with its subsidiaries, Volvo Cars ). The information contained in this document is derived from sources that have not been independently verified. Except in the case of fraudulent misrepresentation, no responsibility or liability is accepted by Volvo Cars or by any of its respective officers, employees, affiliates or agents in relation to the accuracy, completeness or sufficiency of any information contained herein or any other written or oral information made available by Volvo Cars in connection therewith or any data which any such information generates, or for any loss whatsoever arising from or in connection with the use of or reliance on this document and any such liability is expressly disclaimed. Analyses and opinions contained herein may be based on assumptions that, if altered, can change the analyses or opinions expressed. This document speaks as of the date hereof and in providing this document, Volvo Cars gives no undertaking and is under no obligation to provide the Recipient with access to any additional information or to update this document or to correct any inaccuracies in it which may become apparent. Volvo Cars past performance is not necessarily indicative of future results and nothing contained herein shall constitute any representation or warranty as to future performance of Volvo Cars or any security, credit, currency, rate or other market or economic measure. Nor does this document constitute a recommendation with respect to any securities. 2

3 performance 11 BN 534,000 ebit 180 BN Net revenue 6.1% Ebit margin 3rd consecutive year of record sales 6,5 BN Operating and investing cash flow +3,000 Employees CURRENCY: SEK
4 Retail sales US +18.1% Turnaround ConfirmeD Global growth 6.2% EUROPE +2.7% Profitable Growth China +11.5% Regained momentum 4

5 Operations 90 Series completed Torslanda Ramp up S90 daqing CMA Luqiao Charleston plant

6 Capital markets Private Placement Sek 5 bn two bonds Sek 8 bn Two ratings

7 Finance
8 Overview of key financial developments Retail sales (units) Net revenue (SEKbn) +6% 503, , , % 180,672 EBIT (SEKbn) Net income (SEKbn) +66% 11, % 7,460 6, % EBIT margin 6.1% EBIT margin 4,476 7
9 Financial statements Income statement Income statement msek Net Revenue 180, ,043 Cost of Sales -143, ,238 Gross Income 35,805 38,805 EBIT 11,014 6,620 Net Income 7,460 4,476 Cash flow statement msek Operating activities 26,861 22,576 Investing activities -20,346-15,342 Cash flow from operating and investing activities 6,515 7,234 Financing activities 5,792 1,445 Total cash flow 12,307 8,679 msek Balance sheet Intangible assets, Property, plant & equipment etc. Inventories, Accounts receivable, Cash & cash equivalents etc. 82,075 68,317 79,338 64,000 Total assets 161, ,317 Equity 43,310 34,635 Long term liabilities to credit institutions and provisions for pensions etc. Short term liabilities to credit institutions, Accounts payable and short term provisions etc. 41,979 30,473 76,124 67,209 Total Equity & Liabilities 161, ,317 9
10 Income Statement Net revenue strong growth MSEK +10% 11,810-3, ,672 8, ,043 Volume Sales Mix Exchange & Other 10
11 Income Statement Revenue by Carline and Market Revenue by carline 23% V Revenue by market Western Europe 36% XC 64% 13% S Other markets 17% 13% Sweden 17% US 18% China 11
12 Income Statement ebit significant improvement MSEK +66% 2,255 5,240-3,101 11,014 6, % EBIT margin 6.1% EBIT margin Volume Sales Mix Exchange, Cost & Other 12
13 Financial statements Cash flow Statement Income statement msek Net Revenue 180, ,043 Cost of Sales -143, ,238 Gross Income 35,805 38,805 EBIT 11,014 6,620 Net Income 7,460 4,476 Cash flow statement msek Operating activities 26,861 22,576 Investing activities -20,346-15,342 Cash flow from operating and investing activities 6,515 7,234 Financing activities 5,792 1,445 Total cash flow 12,307 8,679 msek Balance sheet Intangible assets, Property, plant & equipment etc. Inventories, Accounts receivable, Cash & cash equivalents etc. 82,075 68,317 79,338 64,000 Total assets 161, ,317 Equity 43,310 34,635 Long term liabilities to credit institutions and provisions for pensions etc. Short term liabilities to credit institutions, Accounts payable and short term provisions etc. 41,979 30,473 76,124 67,209 Total Equity & Liabilities 161, ,317 13
14 Cash Flow Statement Cash Flow MSEK Free cash flow 6,500 MSEK RCF Mkt sct Cash Liquidity EBITDA Working capital Provisions Other items* Investments Financing Exchange on cash Liquidity *Adjusted for interests and other items 14
15 Cash Flow Statement Working Capital and CCC days Change in Working capital (MSEK) 4,500 YTD CCC* days 3-4 4, Inventory 730 Receivables Payables WC Inventory -6 Receivables Payables *CCC = Cash Conversion Cycle 15
16 Financial statements balance sheet Income statement msek Net Revenue 180, ,043 Cost of Sales -143, ,238 Gross Income 35,805 38,805 EBIT 11,014 6,620 Net Income 7,460 4,476 Cash flow statement msek Operating activities 26,861 22,576 Investing activities -20,346-15,342 Cash flow from operating and investing activities 6,515 7,234 Financing activities 5,792 1,445 Total cash flow 12,307 8,679 msek Balance sheet Intangible assets, Property, plant & equipment etc. Inventories, Accounts receivable, Cash & cash equivalents etc. 82,075 68,317 79,338 64,000 Total assets 161, ,317 Equity 43,310 34,635 Long term liabilities to credit institutions and provisions for pensions etc. Short term liabilities to credit institutions, Accounts payable and short term provisions etc. 41,979 30,473 76,124 67,209 Total Equity & Liabilities 161, ,317 16
17 Balance Sheet Investments Investments (BNSEK) 13,5% 13,4% 11,4% % Revenue Intangible investments Non capitalised R&D Tangible investments
18 Balance Sheet Liquidity & debt structure as of December 31, MSEK 49,728 6,355 4,738 25,306 18,951 Net cash position of SEK19bn 10.5% of net revenue 24,422 38,635 Liquidity 7,699 2,813 13,910 Debt Undrawn Revolving Credit Facility (RCF) Marketable Securities Cash & Cash Equivalents Bonds Short-term Debt Long-term Debt 18
19 Balance Sheet Amortisation schedule MSEK 43,373 Liquidity Loans Bonds 6,737 2,813 3,266 3,609 4,766 1,961 4,777 3,
20 Transformation continues Roll out of new cars and continued growth Commercialisation of new technologies 20

21 Autonomous Driving Software Zenuity Hardware Uber People Drive me 21

22 electrification All models in Twin engine variant Pure electric car M electrified cars by

23 Digital Experience & Connectivity Service Mobility solutions Per Mile new business unit Per month Care BY Volvo New Chief digital Officer Atif Rafiq Development Centre Mountain view, California 23
24 Outlook 2017 New volume and revenue record foreseen Continued industrial transformation New XC60 New XC40 Maintained strong profit level 90 years anniversary 24
25 Q&A 25
26 26

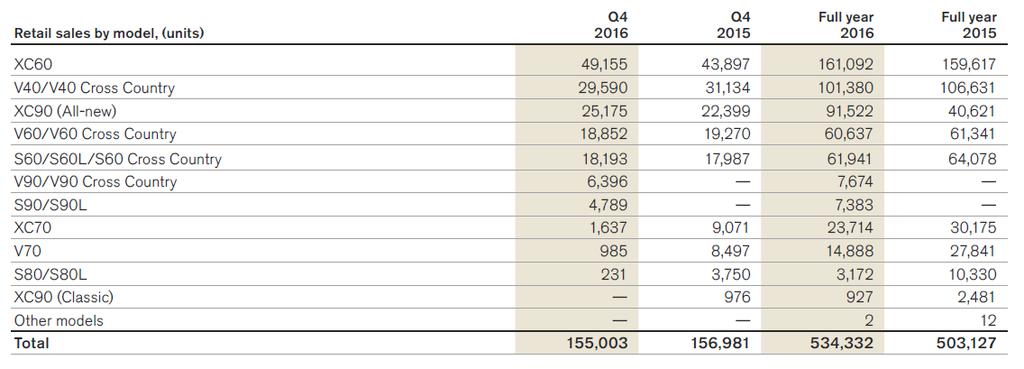
27 Appendix 1: Retail sales 27
28 Appendix 2: Key figures extended version Key figures Q4 Q4 Full year Full year Full year vs Full year Retail sales (units) 155, , , , % Net revenue (MSEK) 55,940 52, , , % Research and development expenses (MSEK) -2,038-2,484-9,374-8, % Operating income, EBIT (MSEK) 3,355 3,684 11,014 6,620 4,394 MSEK Net income (MSEK) 2,349 2,938 7,460 4,476 3,018 MSEK EBITDA (MSEK) 6,035 6,201 21,541 16,019 5,522 MSEK Cash flow from operating and investing activities (MSEK) 8,769 9,476 6,515 7, MSEK EBIT margin (%) bps EBITDA margin (%) bps Capex & R&D spend (MSEK) 17,665 14, % Capex & R&D spend against net revenue (%) bps Equity ratio (%) bps Net debt/net cash (net cash if negative) (MSEK) -18,873-7,721-11,152 28

29 Appendix 3: Definitions of performance measures Performance measures disclosed in the presentation are those that are deemed to give the most true and fair, as well as relevant view of Volvo Car Group s financial performance for a reader of the presentation. 29
30 Appendix 4: Reconciliation tables of performance measures 30
31 31
VOLVO CAR GROUP results presentation Third quarter and first nine months 2018
 VOLVO CAR GROUP results presentation Third quarter and first nine months 2018 Nils Mösko, vice president & Head of investor relations Patrik Tolf, Deputy CFO & head of Group Finance DISCLAIMER By accepting
VOLVO CAR GROUP results presentation January March 2018
 VOLVO CAR GROUP results presentation January March 2018 Patrik Tolf, Deputy CFO & head of Group Finance Nils Mösko, vice president & Head of investor relations DISCLAIMER By accepting this document, the
Volvo Car GROUP interim report
 Volvo Car GROUP interim report QUARTER ONE Volvo Car ab (556810-8988) INTERIM report JANUARY-MARCH Gothenburg, APRIL 25 TH, QUARTER ONE Volvo Cars retail sales at 120,591 (107,721) units Net revenue at
Volvo Car GROUP Interim report THIRD quarter and first nine months 2017
 Volvo Car GROUP Interim report THIRD quarter and first nine VOLVO CAR AB GROUP (PUBL.) (556810 8988) INTERIM REPORT THIRD QUARTER AND FIRST NINE MONTHS, GOTHENBURG OCTOBER 26 TH THIRD QUARTER Retail sales
Volvo Car GROUP interim report Second Quarter 2016
 INTERIM REPORT SECOND QUARTER Volvo Car GROUP interim report Second Quarter i OF 24 VOLVO CAR AB (PUBL.) (556810 8988) VOLVO CAR GROUP INTERIM REPORT SECOND QUARTER, INTERIM GOTHENBURG REPORT JULY SECOND
Volvo Car GROUP Interim report FIRST quarter 2018
 Volvo Car GROUP Interim report FIRST quarter VOLVO CAR AB GROUP (PUBL.) (556810 8988) INTERIM REPORT FIRST QUARTER, GOTHENBURG APRIL 26 TH FIRST QUARTER Retail sales increased by 14.1 per cent to 147,407
CONSOLIDATED INCOME STATEMENTS
 CONSOLIDATED INCOME STATEMENTS Net revenue 3 210,912 180,902 Cost of sales 4-164,254 142,220 Gross income 46,658 38,682 Research and development expenses 4, 16-10,187 10,174 Selling expenses 4-15,266 11,992
Volvo Car GROUP Interim report FOURTH quarter and full year 2017
 Volvo Car GROUP Interim report FOURTH quarter and full year VOLVO CAR AB GROUP (PUBL.) (556810 8988) INTERIM REPORT FOURTH QUARTER AND FULL YEAR, GOTHENBURG FEBRUARY 7 TH 2018 FOURTH QUARTER Retail sales
2017 Full Year Results Presentation 16 April 2018
 2017 Full Year Results Presentation 16 April 2018 Disclaimer This information has been prepared solely for the purpose of assisting the recipient (the Recipient ) in starting to conduct its own independent
Volvo Car GROUP Interim report second quarter and first six months 2018
 Volvo Car GROUP Interim report second quarter and first six VOLVO CAR AB GROUP (PUBL.) (556810 8988) INTERIM REPORT SECOND QUARTER AND FIRST SIX MONTHS, GOTHENBURG JULY 18 TH q2/h1 SECOND QUARTER Retail
Volvo Car GROUP interim report Second half year Report & Full year report 2015
 Volvo Car ab (556810-8988) Second half year report & full year report Gothenburg, February 18 TH, 2016 Volvo Car GROUP interim report Second half year Report & report H2/FY JULY - DECEMBER Volvo Cars retail
Q4 Presentation February, 2013
 Q4 Presentation 2012 14 February, 2013 Disclaimer This presentation has been prepared by Duni AB (the Company ) solely for use at this investor presentation and is furnished to you solely for your information
Hero Acquisitions Limited (subsidiary of HSS Hire Group plc) 9M FY15 Results
 9M FY15 Results") Hero Acquisitions Limited (subsidiary of HSS Hire Group plc) 9M FY5 Results November 205 Agenda John Gill, CEO: Introduction Steve Trowbridge, CFO: 9M Results John Gill, CEO: Summary Q&A Introduction 0.7%
Hero Acquisitions Limited (subsidiary of HSS Hire Group plc) 9M FY5 Results November 205 Agenda John Gill, CEO: Introduction Steve Trowbridge, CFO: 9M Results John Gill, CEO: Summary Q&A Introduction 0.7%
Presentation of FY 2017 Results. February 26 th, 2018
 Presentation of FY 2017 Results February 26 th, 2018 Gestamp 2018 Disclaimer This presentation has been prepared solely for use at this presentation of our results as of and for the quarter ended December
Q Results. Lars Brorsen (CEO) Christoph Hobo (CFO) November 22, 2018
 Christoph Hobo (CFO) November 22, 2018") Q3 2018 Results Lars Brorsen (CEO) Christoph Hobo (CFO) November 22, 2018 Agenda 1. Highlights Q3 2018 2. Market outlook 3. Detailed results review 4. Company outlook 5. Q&A Appendix 1 Business summary
Q3 2018 Results Lars Brorsen (CEO) Christoph Hobo (CFO) November 22, 2018 Agenda 1. Highlights Q3 2018 2. Market outlook 3. Detailed results review 4. Company outlook 5. Q&A Appendix 1 Business summary
Q2 Presentation July, 2011
 Q2 Presentation 2011 15 July, 2011 Disclaimer This presentation has been prepared by Duni AB (the Company ) solely for use at this investor presentation and is furnished to you solely for your information
Sandvik. Record-high order intake in the quarter. Interim report on first quarter Sandvik first quarter 2012
 Record-high order intake in the quarter 1 first quarter 2012 Quarterly highlights Record-high order intake, 28,894 MSEK Overall strong demand Strong demand for Mining and Machining Solutions Stable demand
Q3 FY2010 Financial Highlights
 Disclaimer The information in this document has not been independently verified and no representation or warranty, express or implied, is made as to, and no reliance should be placed on, the fairness,
Q1 Presentation April, 2011
 Q1 Presentation 2011 28 April, 2011 Disclaimer This presentation has been prepared by Duni AB (the Company ) solely for use at this investor presentation and is furnished to you solely for your information
Sandvik. Good progress towards a more efficient Sandvik. Interim report on fourth quarter Sandvik fourth quarter 2013
 Good progress towards a more efficient 1 fourth quarter 2013 Full-year highlights Strategy execution Supply Chain optimization initiative launched Continued strong progress at Materials Technology Significant
Q Presentation 1
 Q2 2009 Presentation 1 Disclaimer This presentation has been prepared by Duni AB (the Company ) solely for use at this investor presentation and is furnished to you solely for your information and may
TomTom Q results. Harold Goddijn - CEO & Marina Wyatt - CFO 18 February 2011
 TomTom Q4 2010 results Harold Goddijn - CEO & Marina Wyatt - CFO 18 February 2011 Financial highlights Content & Services revenue grew by 16% to 98 million Automotive revenue grew by 52% to 55 million
Sandvik. Continued strong execution, but a more cautious market. Interim report on third quarter Sandvik third quarter 2012
 Continued strong execution, but a more cautious market 1 Quarterly highlights Continued strong execution Record strong cash flow 3,979 MSEK Turnaround plans continue to deliver EBIT 3,325 MSEK, 14.2% ROCE
Hero Acquisitions Ltd
 Hero Acquisitions Ltd (subsidiary of HSS Hire Group plc) FY17 Results APRIL 5 th 2018 Important notice By reading or reviewing this presentation, you agree to be bound by the following limitations: This
Financial Highlights (1)
") Disclaimer The information in this document has not been independently verified and no representation or warranty, expressed or implied, is made as to, and no reliance should be placed on, the fairness,
Disclaimer The information in this document has not been independently verified and no representation or warranty, expressed or implied, is made as to, and no reliance should be placed on, the fairness,
2018 First Quarter Results Presentation. 29 May 2018
 2018 First Quarter Results Presentation 29 May 2018 Disclaimer This information has been prepared solely for the purpose of assisting the recipient (the Recipient ) in starting to conduct its own independent
2013 IR PRESENTATION albasmelter.com
 2013 IR PRESENTATION Disclaimer This document has been prepared and issued by and is the sole responsibility of Aluminium Bahrain B.S.C. (the Company ). The document is being supplied to you solely for
Q4 Presentation February, 2012
 Q4 Presentation 2011 15 February, 2012 Disclaimer This presentation has been prepared by Duni AB (the Company ) solely for use at this investor presentation and is furnished to you solely for your information
Corral Q August 2017
 Corral Q2 2017 August 2017 Disclaimer This presentation has been prepared by Corral Petroleum Holdings AB (publ) and/or its subsidiaries and affiliates ( Corral ). The information contained in this presentation
2015 Twelve Months Results
 2015 Twelve Months Results Ended December 31, 2015 May 13th, 2016 Disclaimer This document and any related presentations have been prepared by, and the information contained herein (unless otherwise indicated),
NOT FOR PUBLICATION, DISTRIBUTION OR RELEASE IN OR INTO THE UNITED STATES OF AMERICA, CANADA, JAPAN OR AUSTRALIA
 NOT FOR PUBLICATION, DISTRIBUTION OR RELEASE IN OR INTO THE UNITED STATES OF AMERICA, CANADA, JAPAN OR AUSTRALIA This announcement is an advertisement and not a prospectus and not an offer of securities
EVRY ASA Q PRESENTATION CEO BJÖRN IVROTH CFO HENRIK SCHIBLER
 1 EVRY ASA Q3 2018 PRESENTATION CEO BJÖRN IVROTH CFO HENRIK SCHIBLER Agenda Group highlights Business update Financial highlights Business area performance Concluding remarks Q&A 2 Group highlights Q3
STRABAG SE JANUARY JUNE 2014 RESULTS 29 AUGUST 2014
 STRABAG SE JANUARY JUNE 2014 RESULTS 29 AUGUST 2014 DISCLAIMER This presentation is made by STRABAG SE (the "Company") solely for use at investor meetings and is furnished to you solely for your information.
FY 2017 FINANCIAL RESULTS. March 1 st, 2018
 FY 2017 FINANCIAL RESULTS March 1 st, 2018 FY 2017 Results 1. Highlights 2. FY Financial Performance Analysis 3. Appendix Verallia FY 2017 Financial Results 01/03/2018 2 2017 HIGHLIGHTS A very good financial
Q Results presentation
 Q1 2016 Results presentation 12 May 2016 1 Disclaimer This presentation (the "Presentation") has been prepared and is issued by, and is the sole responsibility of Telepizza Group, S.A. ( Telepizza" or
2016 Full Year Results Presentation 4th April 2017
 2016 Full Year Results Presentation 4th April 2017 Disclaimer This information has been prepared solely for the purpose of assisting the recipient (the Recipient ) in starting to conduct its own independent
FOURTH QUARTER March, 2018
 FOURTH QUARTER 2017 20 March, 2018 Presenters Petter Holland CEO Gunilla Spongh CFO 2 Disclaimer This presentation has been prepared by Corral Petroleum Holdings AB (publ) and/or its subsidiaries and affiliates
BE GROUP JANUARY MARCH Roger Johansson, President and CEO Torbjörn Clementz, CFO and Executive Vice President. Slide 1
 BE GROUP INTERIM REPORT JANUARY MARCH 2012 Roger Johansson, President and CEO Torbjörn Clementz, CFO and Executive Vice President Slide 1 Q1 Lower prices affect Q1-earnings Financial Highlights Net sales
Year end report. January-December st of January 2018 Mikael Ericson, President and CEO Erik Forsberg, CFO
 Year end report January-December 2017 31 st of January 2018 Mikael Ericson, President and CEO Erik Forsberg, CFO Agenda 1. Highlights for the fourth quarter and FY 2017 2. Key messages from Capital Markets
25 October Q Revenues. Gilles Petit, CEO Arnaud Louet, CFO
 Q3 2016 Revenues Gilles Petit, CEO Arnaud Louet, CFO Q3 2016 Revenues FORWARD LOOKING STATEMENTS This presentation contains certain statements that constitute "forward-looking statements", including but
Results presentation 1Q18. 3 May 2018
 Results presentation 1Q18 3 May 2018 Disclaimer This presentation (the "Presentation") has been prepared and is issued by, and is the sole responsibility of Euskaltel, S.A. ("Euskaltel" or "the Company").
YEAR END RESULTS 31 MARCH Russell Down, Chief Executive Chris Morgan, Group Finance Director
 YEAR END RESULTS 31 MARCH 2018 Russell Down, Chief Executive Chris Morgan, Group Finance Director Customer service strategy improving performance Revenue (excluding disposals) 371.6m 6.4% FY17: 349.1m
Sandvik. Tentative market. Interim report on second quarter Sandvik second quarter 2013
 Tentative market 1 Quarterly highlights Stable but tentative market Unchanged market conditions for Sandvik Machining Solutions, Sandvik Materials Technology and Sandvik Venture Weaker demand for Sandvik
CORRAL PETROLEUM HOLDINGS AB Q November
 CORRAL PETROLEUM HOLDINGS AB Q3 2018 November 28 2018 Presenters Petter Holland CEO Peder Zetterberg CFO (acting) 2 Disclaimer This presentation has been prepared by Corral Petroleum Holdings AB (publ)
EVRY ASA Q4/FY 2017 PRESENTATION. CEO Björn Ivroth CFO Henrik Schibler
 EVRY ASA Q4/FY 2017 PRESENTATION CEO Björn Ivroth CFO Henrik Schibler Agenda Q4/ Preliminary FY 2017 presentation Group highlights Business update & trends Financial highlights Business area performance
Interim Report Q3/2018 October 26, Magnus Welander, CEO Lennart Mauritzson, CFO
 Interim Report Q3/2018 October 26, 2018 Magnus Welander, CEO Lennart Mauritzson, CFO Q3/2018 Solid quarter with significant launches for future growth Net sales of SEK 1,561m (1,385) +12.7% (+3.8% excluding
Q3 Investor Call. September 2016
 Q3 Investor Call September 2016 Disclaimer This presentation has been prepared by Corral Petroleum Holdings AB (publ) and/or its subsidiaries and affiliates ( Corral ). The information contained in this
Q1 Presentation April, 2013
 Q1 Presentation 19 April, Disclaimer This presentation has been prepared by Duni AB (the Company ) solely for use at this investor presentation and is furnished to you solely for your information and may
NOBINA AB Investor presentation, Interim report March 2018 May 2018
 1 NOBINA AB Investor presentation, Interim report March 2018 May 2018 FINANCIAL OVERVIEW ¹ NET SALES EBIT EBT CASH FLOW 2,361 (2,205) 104 (95) 72 (58) -74 (-60) FINANCIAL HIGHLIGHTS Net sales grew 7.1%
First Half 2018 Results
 Nortegas Energía Distribución, S.A.U. First Half 2018 Results August 2018 Disclaimer The materials in this document are provided for information purposes only and is not in particular intended to confer
Creating a pan-nordic platform
 Creating a pan-nordic platform June 2018 Norway s leading discount variety retailer Important notice ABOUT THIS PRESENTATION By reading this company presentation (the Presentation ), or attending any meeting
Results presentation 1H July 2018
 Results presentation 1H18 27 July 2018 Disclaimer This presentation (the "Presentation") has been prepared and is issued by, and is the sole responsibility of Euskaltel, S.A. ("Euskaltel" or "the Company").
TI Fluid Systems plc Results Presentation for TI Fluid Systems plc 20 March 2018
 2017 Results Presentation for 20 March 2018 Disclaimer This presentation contains certain forward-looking statements with respect to the financial condition, results of operations and business of (the
EVRY ASA Q PRESENTATION CEO BJÖRN IVROTH CFO HENRIK SCHIBLER
 1 EVRY ASA Q1 2018 PRESENTATION CEO BJÖRN IVROTH CFO HENRIK SCHIBLER Agenda Group highlights Business update Financial highlights Business area performance Targets and Concluding remarks Q&A 2 Group highlights
16 May M FY 2017/18 FINANCIAL RESULTS
 16 May 2018 6M FY 2017/18 FINANCIAL RESULTS NOTICE TO RECIPIENTS This presentation and any materials distributed in connection herewith (together, the Presentation ) have been prepared by Douglas GmbH
JLT Interim report January September 2017
 JLT Interim report January September Order intake: MSEK 83.5 (94.6) Revenues: MSEK 85.7 (92.2) Gross margin: 44.2 percent (41.9) Operating profit: MSEK 8.0 (8.6) Profit after tax: MSEK 5.9 (6.9) A statement
2017 Interim Results. Continuing Execution of Our Strategy. 3 August 2017
 2017 Interim Results Continuing Execution of Our Strategy 3 August 2017 0 Disclaimer THIS PRESENTATION IS NOT FOR RELEASE, PUBLICATION OR DISTRIBUTION, IN WHOLE OR IN PART, IN OR INTO THE UNITED STATES
Aluminium for the world
 Q1 2013 IR PRESENTATION Disclaimer This document has been prepared and issued by and is the sole responsibility of Aluminium Bahrain B.S.C. (the Company ). The document is being supplied to you solely
Q RESULTS May 14th, 2018
 Q1 2018 RESULTS May 14th, 2018 1 Disclaimer This document has been prepared by HelloFresh SE (the Company and, together with its subsidiaries, the Group ). All material contained in this document and information
Eng US. 14 July 2017
 Eng US 14 July 2017 Presentation 2017 Eng US Disclaimer This presentation has been prepared by Duni AB (the Company ) solely for use at this investor presentation and is furnished to you solely for your
For personal use only
 Investor Presentation Half Year Results to 31 December 2016 24 February 2017 PETER CAUGHEY, CEO & MANAGING DIRECTOR 1 Agenda Overview Financials Business conditions, strategy and outlook 2 Overview 1H17
Eng US. 9 February Q4 Presentation 2017
 Eng US 9 February 2018 Q4 Presentation 2017 Eng US Disclaimer This presentation has been prepared by Duni AB (the Company ) solely for use at this investor presentation and is furnished to you solely for
SECOND QUARTER RESULTS August 2018 Ashley Milton, CFO
 SECOND QUARTER RESULTS 2018 9 August 2018 Ashley Milton, CFO Disclaimer THIS PRESENTATION IS NOT AN OFFER OR SOLICITATION OF AN OFFER TO BUY OR SELL SECURITIES IN THE UNITED STATES OF AMERICA OR IN ANY
Results First Quarter 2012/13
 Results First Quarter 2012/13 Investor Call Mannheim, 27 th June 2012 Dr. Michael Majerus CFO Disclaimer 2012 PHOENIX Pharmahandel GmbH & Co KG This document has been prepared by PHOENIX Pharmahandel GmbH
British American Tobacco Debt Investor Update. London, 7 March 2013
 British American Tobacco Debt Investor Update London, 7 March 2013 1 Disclaimer The information contained in this presentation has not been independently verified and no representation or warranty, express
Q4 AND FY 2015 RESULTS. Harold Goddijn CEO Taco Titulaer CFO 9 February 2016
 Q4 AND FY 2015 RESULTS Harold Goddijn CEO Taco Titulaer CFO 9 February 2016 CONSUMER OPERATIONAL HIGHLIGHTS Within Drive, we maintained our leading market position and continued to strengthen our navigation-based
INVESTOR RELATIONS PRESENTATION
 INVESTOR RELATIONS PRESENTATION Q3 2015 DISCLAIMER This document has been prepared and issued by and is the sole responsibility of Aluminium Bahrain B.S.C. (the Company ). The document is being supplied
Q Presentation.
 Q4 Presentation www.duni.com 1 Disclaimer This presentation has been prepared by Duni AB (the Company ) solely for use at this investor presentation and is furnished to you solely for your information
Q presentation. 10 May Nordic market leader in chicken products
 Q1 2016 presentation 10 May 2016 Nordic market leader in chicken products 0 Summary of Q1 2016 Strong growth in net sales, particularly in chilled products Continued strong performance in Sweden Substantial
Q results. Analyst & investor presentation. November 21, 2017
 Q3 2017 results Analyst & investor presentation November 21, 2017 Q3 2017 Development at a Glance: Fully on Track 18 new units opened year to date (Q3 6 openings) and pipeline fully secured Strong growth
new business seize the potential H&M GROUP CAPITAL MARKETS DAY 2018
 new business seize the potential H&M GROUP CAPITAL MARKETS DAY 2018 Disclaimer THIS PRESENTATION IS NOT AN OFFER OR SOLICITATION OF AN OFFER TO BUY OR SELL SECURITIES. IT IS SOLELY FOR USE AT A CAPITAL
August 8, Conduent Q Earnings Results
 August 8, 2018 Conduent Q2 2018 Earnings Results Cautionary Statements Forward-Looking Statements This report contains forward-looking statements, as defined in the Private Securities Litigation Reform
Corral Q May 2017
 Corral Q1 2017 May 2017 Disclaimer This presentation has been prepared by Corral Petroleum Holdings AB (publ) and/or its subsidiaries and affiliates ( Corral ). The information contained in this presentation
Second Quarter 2017 Earnings Conference Call August 2, 2017
 Philip Mezey President and Chief Executive Officer Joan Hooper Senior Vice President and Chief Financial Officer Barbara Doyle Vice President, Investor Relations Second Quarter 2017 Earnings Conference
Investor Conference Call
 Investor Conference Call FY/Q4 2014 Results February 26, 2015 / Marijn Dekkers, CEO Disclaimer This presentation may contain forward-looking statements based on current assumptions and forecasts made by
Magseis ASA Q th August Expanding operational footprint
 Magseis ASA Q2 2018 16 th August 2018 Expanding operational footprint Disclaimer This presentation (the Presentation") has been prepared by Magseis ASA (the Company or Magseis ). The Presentation contains
Interim report July - September 2016
 Interim report July - September 2016 October 19 th, 2016 Mikael Ericson, CEO Erik Forsberg, CFO 2 Q3 2016 Highlights Continued good financial development All financial targets met: EPS growth, PD RoI and
Year End Report 2017 February 13, Magnus Welander, CEO Lennart Mauritzson, CFO
 Year End Report 2017 Magnus Welander, CEO Lennart Mauritzson, CFO 2017/Q4 Continued good performance in smallest quarter of the year Net sales of SEK 1,006m (983) +2.3% (+6.5% excluding currency effects)
2017 AGM Presentation Amendment
 ASX Announcement 2017 AGM Presentation Amendment MELBOURNE, Australia, 8 November 2017 Aconex Limited (ASX: ACX), provider of the #1 global platform connecting teams on construction and engineering projects,
9M 2018 Conference Call
 9M 2018 Conference Call November 13, 2018 Disclaimer This document has been prepared by Datalogic S.p.A. (the "Company") for use during meetings with investors and financial analysts and is solely for
Q Interim Results Presentation
 Riservato & Confidenziale Q1 2017 Interim Results Presentation June 1st, 2017 Authorised and regulated by the Financial Conduit Authority Disclaimer THIS PRESENTATION IS NOT, NOR SHALL BE CONSTRUED AS,
Q3 Report 2006 Johan Molin President & CEO
 Q3 Report 2006 Johan Molin President & CEO Financial Highlights Q3 Continued high growth pace High stable demand in Europe and North America Fargo developing very well Sales SEK 7 736 M +10% +8% organic,
Trimble Second Quarter 2018 Results Summary
 Trimble Second Quarter 2018 Results Summary Forward-looking statements Certain statements made in this presentation and any subsequent Q&A period are forward-looking statements, within the meaning of Section
Results of the 1 st quarter PHOENIX group 2018/19
 Investor call Results of the 1 st quarter PHOENIX group 2018/19 Helmut Fischer, CFO Mannheim, 26 June 2018 Disclaimer 2018 PHOENIX Pharma SE / PHOENIX PharmahandelGmbH & Co KG This document has been prepared
Q3 Fiscal Year 2018 Investor Presentation Financial Results Conference Call
 February Sept 6, 2018 2017 Q3 Fiscal Year 2018 Investor Presentation Financial Results Conference Call Mark D. Morelli President and Chief Executive Officer Gregory P. Rustowicz Vice President Finance
Third Quarter 2016 Presentation. 11 November, 2016
 Third Quarter 2016 Presentation 11 November, 2016 Henrik Borelius, CEO Tomas Björksiöö, CFO 2 Financial summary of Q3: Continued stable development Net sales SEK 2.6bn (2.5), growth 5%, adjusted growth
BE GROUP INTERIM REPORT JANUARY JUNE
 BE GROUP INTERIM REPORT JANUARY JUNE 211 Roger Johansson, President & CEO Torbjörn Clementz, CFO & Executive Vice President Slide 1 Q2 A quarter with continued growth Financial Highlights Net sales increase
RESULTS PRESENTATION. For the 3 months to 30 June 2017
 RESULTS PRESENTATION For the 3 months to 30 June 2017 NOTICE The information contained in this document has not been independently verified. No representation or warranty, express or implied, is made as
SmarTone Telecommunications Holdings Limited
 SmarTone Telecommunications Holdings Limited FY15 Annual Results Presentation For the year ended 30 June 2015 Stephen Chau Interim CEO 1 September 2015 1 Disclaimer It is not the intention to provide,
February 21, Conduent Q4 & FY 2017 Earnings Results
 February 21, 2018 Conduent Q4 & FY 2017 Earnings Results Cautionary Statements Forward-Looking Statements This report contains forward-looking statements that involve risks and uncertainties. These statements
INTERIM REPORT JANUARY SEPTEMBER OCTOBER 2017
 INTERIM REPORT JANUARY SEPTEMBER 2017 26 OCTOBER 2017 EBITA before acquisition costs (MSEK) LTM ONE TARGET: TO INCREASE PROFITS EVERY YEAR 1998 1999 2000 2001 2002 2003 2004 2005 2006 2007 2008 2009 2010
Investor presentation, Interim report June 2018 August 2018 NOBINA AB. Nobina investor presentation, Q2 2018/19
 1 Investor presentation, Interim report June 2018 August 2018 NOBINA AB SECOND QUARTER WITH SOLID PERFORMANCE NET SALES EBIT EBT CASH FLOW SEK Millions 2,235 (2,169) SEK Millions 117 (106) SEK Millions
FY 2017 Third Quarter Earnings Call
 FY 2017 Third Quarter Earnings Call July 27, 2017 Improving the experience of a world in motion Forward Looking Statement Adient has made statements in this document that are forward-looking and, therefore,
Q2 report. Richard Hausmann. Gustaf Salford. November 30, President and CEO CFO
 Q2 report November 30, 2017 Richard Hausmann President and CEO Gustaf Salford CFO Important information This presentation includes forward-looking statements including, but not limited to, statements relating
Interim Report Q2/2018 July 19, Magnus Welander, CEO Lennart Mauritzson, CFO
 Interim Report Q2/2018 July 19, 2018 Magnus Welander, CEO Lennart Mauritzson, CFO 2018/Q2 Strong performance in Europe Net sales of SEK 2,155m (1,955) +10.2% (+7.0% excluding currency effects) Region Europe
Martin Lindqvist, President & CEO Marco Wirén, CFO February 11, 2011
 Results for the fourth quarter 2010 Martin Lindqvist, President & CEO Marco Wirén, CFO February 11, 2011 Forward-looking statements The presentation and the materials constituting it contain certain statements
Eng US. Q1 Presentation April, 2015
 Eng US Presentation 2015 24 April, 2015 Eng US Disclaimer This presentation has been prepared by Duni AB (the Company ) solely for use at this investor presentation and is furnished to you solely for your
Vattenfall Q3 results 2009
 Vattenfall Q3 results 2009 Presentations by Lars G. Josefsson, CEO and Dag Andresen, CFO Agenda CEO Lars G. Josefsson: CFO Dag Andresen: Financial highlights Generation volumes Electricity price development
FIRST QUARTER June 4, 2018
 FIRST QUARTER 2018 June 4, 2018 Presenters Petter Holland CEO Gunilla Spongh CFO 2 Disclaimer This presentation has been prepared by Corral Petroleum Holdings AB (publ) and/or its subsidiaries and affiliates
STRABAG SE JANUARY MARCH 2018 RESULTS
 STRABAG SE JANUARY MARCH 2018 RESULTS 30 MAY 2018 DISCLAIMER This presentation is made by STRABAG SE (the "Company") solely for use at investor meetings and is furnished to you solely for your information.