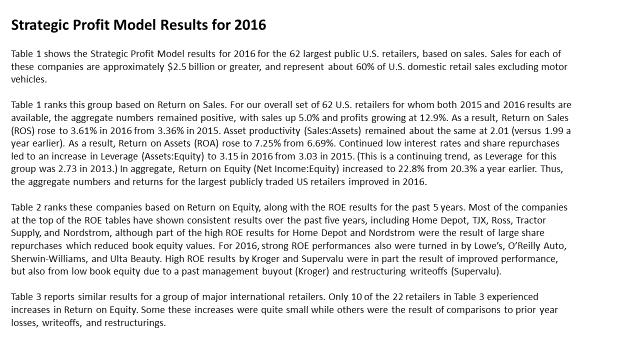
TABLE 1 STRATEGIC PROFIT MODELS FOR SELECTED RETAILERS, 2016 (Ranked by Return on Sales)
|
|
|
- Ophelia Cooper
- 5 years ago
- Views:
Transcription
1
2 TABLE 1 STRATEGIC PROFIT MODELS FOR SELECTED RETAILERS, 2016 (Ranked by Sales) Retailer Name Ticker Asset Financial Net (millions) Turnover '16 Assets '16 Leverage '16 Worth '16 ebay Inc EBAY $ 8, % % % O'Reilly Automotive Inc ORLY $ 8, % % % AutoZone Inc AZO $ 10, % % NA NA Liberty Interactive QVC.A $ 10, % % % Tiffany & Co. TIF $ 4, % % % Sherwin-Williams Company SHW $ 11, % % % L Brands Inc LB $ 12, % % NA NA Ross Stores, Inc. ROST $ 12, % % % Foot Locker Inc FL $ 7, % % % Ulta Beauty ULTA $ 4, % % % Home Depot, Inc. HD $ 94, % % % Signet Jewelers Ltd SIG $ 6, % % % TJX Companies TJX $ 33, % % % Tractor Supply TSCO $ 6, % % % Urban Outfitters URBN $ 3, % % % Williams-Sonoma, Inc. WSM $ 5, % % % Publix Super Mkts, Inc. PUSH $ 33, % % % American Eagle Outfitters AEO $ 3, % % % Dollar General Corporation DG $ 21, % % % Bed Bath & Beyond, Inc. BBBY $ 12, % % % Supervalu SVU $ 12, % % % Advance Auto Parts Inc AAP $ 9, % % % Office Depot Inc ODP $ 11, % % % Lowe's Companies Inc. LOW $ 65, % % % Gap, Inc. GPS $ 15, % % % Dollar Tree Stores, Inc. DLTR $ 20, % % % GameStop Corp Class A GME $ 8, % % % Target Corp TGT $ 69, % % % Chico's FAS, Inc. CHS $ 2, % % % Dick's Sporting Goods, Inc. DKS $ 7, % % % Walgreens Boot Alliance WBA $ 117, % % % HSN, Inc. HSNI $ 3, % % % Whole Foods Market, Inc. WFM $ 15, % % % Best Buy Co Inc BBY $ 39, % % % CVS Caremark Corp CVS $ 177, % % % Kohl's Corp KSS $ 18, % % % Big Lots, Inc. BIG $ 5, % % % Wal-Mart Stores Inc WMT $ 485, % % % Weis Markets, Inc. WMK $ 3, % % % Casey's General Stores, Inc. CASY $ 6, % % % Dillards, Inc. DDS $ 6, % % % Caleres Inc. CAL $ 2, % % % Macy's Inc M $ 25, % % % Nordstrom, Inc. JWN $ 14, % % % Netflix, Inc. NFLX $ 8, % % % Sysco Corporation SYY $ 55, % % % Costco Wholesale Corporation COST $ 118, % % % Amazon.com Inc AMZN $ 135, % % % Kroger Co KR $ 115, % % % United Natural Foods, Inc. UNFI $ 8, % % % Ingles Markets, Inc. Class A IMKTA $ 3, % % % Tailored Brands TLRD $ 3, % % NA NA Spartan Stores, Inc. SPTN $ 7, % % % Barnes & Noble, Inc. BKS $ 3, % % % Abercrombie & Fitch ANF $ 3, % % % Rite Aid Corporation RAD $ 32, % % % J.C. Penney Co Inc JCP $ 12, % % %
3 Ascena Retail Group, Inc. ASNA $ 6, % % % Bon-Ton Stores Inc BONT $ 2, % % NA NA Rent-A-Center, Inc. RCII $ 2, % % % Staples, Inc. SPLS $ 18, % % % Sears Holdings Corporation SHLD $ 22, % % NA NA
4 2016 STRATEGIC PROFIT MODELS FOR SELECTED RETAILERS, (Ranked by Equity) Retailer Name Ticker (millions) Asset Turnover '16 Assets '16 Financial Leverage '16 Net Worth '16 '15 Net Worth'14 '13 '12 Home Depot, Inc. HD $ 94, % % % % 72.18% 43.00% 25.51% Supervalu SVU $ 12, % % % NA NA 23.85% % ebay Inc EBAY $ 8, % % % 26.23% 12.08% 12.08% 12.50% O'Reilly Automotive Inc ORLY $ 8, % % % 47.48% 41.86% 34.09% 27.75% HSN, Inc. HSNI $ 3, % % % % 30.38% 33.64% 25.77% Sherwin-Williams Company SHW $ 11, % % % % 86.81% 42.41% 37.32% TJX Companies TJX $ 33, % % % 52.88% 53.16% 50.53% 51.99% Lowe's Companies Inc. LOW $ 65, % % % 33.26% 28.43% 19.29% 14.14% Sysco Corporation SYY $ 55, % % % 27.30% 13.04% 17.68% 19.11% Nordstrom, Inc. JWN $ 14, % % % 68.89% 30.16% 35.29% 38.42% Ross Stores, Inc. ROST $ 12, % % % 41.29% 43.09% 41.71% 44.49% Tractor Supply TSCO $ 6, % % % 29.46% 30.92% 26.32% 26.93% Kroger Co KR $ 115, % % % 29.90% 31.93% 28.21% 35.58% Ulta Beauty ULTA $ 4, % % % 22.18% 23.01% 20.24% 21.98% Best Buy Co Inc BBY $ 39, % % % 20.49% 18.40% % % Bed Bath & Beyond, Inc. BBBY $ 12, % % % 32.88% 34.89% 25.94% 25.42% Target Corp TGT $ 69, % % % 25.96% -6.44% 12.14% 18.11% Foot Locker Inc FL $ 7, % % % 21.19% 22.80% 17.19% 16.70% Williams-Sonoma, Inc. WSM $ 5, % % % 25.88% 25.31% 22.21% 19.55% Big Lots, Inc. BIG $ 5, % % % 19.83% 17.73% 13.76% 23.35% Gap, Inc. GPS $ 15, % % % 36.15% 37.81% 41.80% 39.22% Dollar General Corporation DG $ 21, % % % 21.66% 19.74% 18.97% 19.10% Costco Wholesale Corporation COST $ 118, % % % 22.39% 16.73% 18.82% 18.82% Liberty Interactive QVCA $ 10, % % % 12.80% 13.45% 7.22% 20.23% American Eagle Outfitters AEO $ 3, % % % 20.74% 11.58% 7.12% 19.00% Wal-Mart Stores Inc WMT $ 485, % % % 18.24% 19.03% 21.01% 22.27% Signet Jewelers Ltd SIG $ 6, % % % 15.29% 14.48% 14.36% 15.45% Dollar Tree Stores, Inc. DLTR $ 20, % % % 6.41% 17.42% 50.97% 37.13% Urban Outfitters URBN $ 3, % % % 19.74% 17.09% 16.67% 17.50% Publix Super Mkts, Inc. PUSH $ 33, % % % 15.85% 15.35% 20.94% 17.09% Advance Auto Parts Inc AAP $ 9, % % % 19.24% 25.16% 25.84% 31.97% Whole Foods Market, Inc. WFM $ 15, % % % 14.22% 15.92% 14.21% 12.23% GameStop Corp Class A GME $ 8, % % % 19.36% 19.30% 15.73% % Chico's FAS, Inc. CHS $ 2, % % % 0.30% 3.07% 7.25% 16.47% Casey's General Stores, Inc. CASY $ 6, % % % 20.86% 21.94% 18.61% 18.26% Dick's Sporting Goods, Inc. DKS $ 7, % % % 18.47% 19.54% 19.92% 18.27% Tiffany & Co. TIF $ 4, % % % 15.93% 15.66% 6.67% 16.01% CVS Caremark Corp CVS $ 177, % % % 14.08% 12.23% 12.10% 10.28% Macy's Inc M $ 25, % % % 25.22% 26.40% 23.78% 22.06% Walgreens Boots Alliance WBA $ 117, % % % 13.67% 13.68% 12.59% 12.59% Amazon.com Inc AMZN $ 135, % % % 4.45% -2.24% 2.81% -0.48% Kohl's Corp KSS $ 18, % % % 12.26% 12.80% 14.87% 16.30% Caleres Inc. CAL $ 2, % % % 13.55% 15.71% 7.97% 6.35% Dillards, Inc. DDS $ 6, % % % 15.01% 16.09% 16.21% 17.00% Weis Markets, Inc. WMK $ 3, % % % 6.80% 6.41% 8.51% 10.31% United Natural Foods, Inc. UNFI $ 8, % % % 10.01% 10.05% 9.73% 9.73% Netflix, Inc. NFLX $ 8, % % % 5.51% 14.32% 8.40% 2.28% Spartan Stores, Inc. SPTN $ 7, % % % 7.93% 7.49% 8.04% 8.04% Abercrombie & Fitch Company Class A ANF $ 3, % % % 2.76% -0.07% 3.12% 13.03% Ascena Retail Group, Inc. ASNA $ 6, % % % % % 7.68% 9.70% Tailored Brands TLRD $ 3, % % % NA 2.99% 8.30% 11.95% Rent-A-Center, Inc. RCII $ 2, % % % % 7.27% 9.53% 12.45% Staples, Inc. SPLS $ 18, % % % 7.05% 0.96% 10.11% -3.43% AutoZone Inc AZO $ 10, % % NA NA NA NA NA NA L Brands Inc LB $ 12, % % NA NA NA NA % 74.19% Barnes & Noble, Inc. BKS $ 3, % % NA NA -4.04% 2.52% -7.18% % Bon-Ton Stores Inc BONT $ 2, % % NA NA % % -2.34% % Ingles Markets, Inc. Class A IMKTA $ 3, % % NA NA 13.85% 15.68% -5.36% 9.40% J.C. Penney Co Inc JCP $ 12, % % NA NA % % % % Office Depot Inc ODP $ 11, % % NA NA 0.50% % -0.97% % Rite Aid Corporation RAD $ 32, % % NA NA 28.47% NA % -4.47% Sears Holdings Corporation SHLD $ 22, % % NA NA NA NA % % NOTE: NA indicates unable to calculate Financial Leverage or Equity due to negative book value equity. Negative book value equity can arise from share repurchases or from accumulated losses or writeoffs.
5 TABLE 3 STRATEGIC PROFIT MODELS FOR SELECTED INTERNATIONAL RETAILERS, 2016 (Ranked by Equity) Company Name Country Ticker Retail Segment Base (millions; home Currency currency) Exchange Rate (millions; USD equiv.) Asset Turnover '16 Assets '16 Financial Leverage '16 Net Worth '16 Net Worth '15 FONCIERE EURIS FRA EURS Food EUR 36, , % % % % DAIRY FARM INTL HOLDINGS LTD BMU DFILF Food USD 11, , % % % 30.9% HENNES & MAURITZ SWE HMRZF Apparel SEK 192, , % % % 36.0% INDITEX ESP ITX Apparel EUR 23, , % % % 25.2% WOOLWORTHS LIMITED AUS WOW Food AUD 55, , % % % -14.6% DIXONS CARPHONE PLC GBR DC Broadline GBP 10, , % % % % WESFARMERS LTD AUS WES Food AUD 68, , % % % 1.8% JARDINE MATHESON HLDGS LTD BMU J36 Specialty USD 37, , % % % 9.0% METRO AG DEU MEO Food EUR 58, , % % % 13.0% KINGFISHER PLC GBR KGF Specialty GBP 11, , % % % 9.2% FAST RETAILING JPY 9983 Apparel JPY 1,786, , % % % 14.2% GEORGE WESTON CAN WN Food CAD 47, , % % % 6.9% MORRISON (WM) SUPERMARKETS GBR MRW Food GBP 16, , % % % -21.2% KERING FRA KER Specialty EUR 12, , % % % 6.4% CARREFOUR SUPERMARCHE SA FRA CA Food EUR 78, , % % % 10.2% SAINSBURY (J) PLC GBR SBRY Food GBP 26, , % % % 7.4% AHOLD DELHAIZE NLD AD Food EUR 49, , % % % 15.2% TAKASHIMAYA CO LTD JPN 8233 Food JPY 923, , % % % 6.0% SEVEN & I HOLDINGS CO LTD JPN 3382 Food JPY 5,835, , % % % 6.8% MARKS & SPENCER GROUP PLC GBR MKS Food GBP 10, , % % % 11.8% AEON CO LTD JPN 8267 Food JPY 8,210, , % % % 0.5% TESCO PLC GBR TSCO Food GBP 55, , % % % 1.6% MIGROS TICARET AS TUR MGROS Broadline TRY 11, , % % % -71.9%
STRATEGIC PROFIT MODEL RESULTS FOR SELECTED RETAILERS FY2016
 STRATEGIC PROFIT MODEL RESULTS FOR SELECTED RETAILERS FY2016 These results were compiled by Professors John S. Strong and Lawrence J. Ring, with the assistance of Sherry Xue Zhang, MBA 2018. Raymond A.
STRATEGIC PROFIT MODEL RESULTS FOR SELECTED RETAILERS FY2015
 STRATEGIC PROFIT MODEL RESULTS FOR SELECTED RETAILERS FY These results were compiled by Professors John S. Strong and Lawrence J. Ring, with the assistance of Samantha Pham, MBA 2017. Raymond A. Mason
The Bespoke Death By Amazon Indices
 The Bespoke Death By Amazon Indices On the following pages, we update the performance figures for the Bespoke Death By Amazon Indices. We include performance updates for both our standard Death By Amazon
RETAIL SALES & PERFORMANCE
 RETAIL SALES & PERFORMANCE Executive Search For The Retail World P: 530.432.1966 www.retailsearchgroup.com RETAIL MONTHLY RESULTS May 2017 June 2017 May 2017 Total Sales (000) Change vs May 2016 May 2017
RETAIL SALES & PERFORMANCE
 RETAIL SALES & PERFORMANCE Executive Search For The Retail World P: 530.432.1966 www.retailsearchgroup.com RETAIL MONTHLY RESULTS April 2018 May 2018 March 2018 Total Change vs Sales (000) March 2017 March
RETAIL SALES & PERFORMANCE
 RETAIL SALES & PERFORMANCE Executive Search For The Retail World P: 530.432.1966 www.retailsearchgroup.com RETAIL MONTHLY RESULTS December 2017 December 2017 Change vs December 2016 December 2017 change
RETAIL SALES & PERFORMANCE
 RETAIL SALES & PERFORMANCE Executive Search For The Retail World P: 530.432.1966 www.retailsearchgroup.com RETAIL MONTHLY RESULTS September 2018 October 2018 Sept 2018 Total Sales (000) Change vs Sept
RETAIL SALES & PERFORMANCE
 RETAIL SALES & PERFORMANCE Executive Search For The Retail World P: 530.432.1966 www.retailsearchgroup.com RETAIL MONTHLY RESULTS December 2015 December 2015 Change vs December 2014 December 2015 change
STORE SALES & PERFORMANCE
 STORE SALES & PERFORMANCE Executive Search For The Retail World 426 Sutton Way, Suite 108 Grass Valley, CA 95945 P: 530.432.1966 www.retailsearchgroup.com February 2015 RETAIL MONTHLY RESULTS March 2015
Generated on August 29, 2017 at 3:51 PM (UTC) Same-Store Sales Latest Fiscal Year
 Same-Store Sales Latest Fiscal Year") Generated on August 29, 2017 at 3:51 PM (UTC) Same-Store Sales Latest Fiscal Year Company 2016 2015 2014 2013 2012 2011 6 年复合增长率 Kate Spade & Co. 9.10% 12.60% 24.00% 28.20% 29.50% 68.90% 427.14% Michael
Generated on August 29, 2017 at 3:51 PM (UTC) Same-Store Sales Latest Fiscal Year Company 2016 2015 2014 2013 2012 2011 6 年复合增长率 Kate Spade & Co. 9.10% 12.60% 24.00% 28.20% 29.50% 68.90% 427.14% Michael
12 th Annual. Retail & Apparel Board Index
 12 th Annual Retail & Apparel Board Index retail & apparel board index 2016 A header (section title) (remove when section header present) about Spencer Stuart s global Retail, Apparel & Luxury Goods Practice
Yardeni Research, Inc.
 thinking outside the box Table Of Contents Table Of Contents S&P Retailers: Consumer Discretionary 1 S&P Retailers: Consumer Staples S&P // Retailers YTD - Retail: US vs. Europe, Yearly Percent Change
13 th Annual. Retail & Apparel Board Index. Retail & Apparel board index
 13 th Annual Retail & Apparel Board Index Retail & Apparel board index 2017 1 header (section title) (remove when section header present) About Spencer Stuart s Global Retail, Apparel & Luxury Goods Practice
Industry Observations June 30, Retail Industry
 Industry Observations June 30, 2018 Retail Industry Select Retail Public Company Industry Data (USD in millions, except per share data) Market Data Operating Data Forward Estimates Company Name Ticker
S&P 500 Industry Briefing: Consumer Discretionary Retail Industry Group
 S&P Industry Briefing: Consumer Discretionary Retail Industry Group November, 18 Dr. Ed Yardeni 16-972-7683 eyardeni@ Joe Abbott 732-497-6 jabbott@ Please visit our sites at www. blog. thinking outside
Market Capitalization $23.6 Billion
 BUY HOLD SELL A+ A A- B+ B B- C+ C C- D+ D D- E+ E E- F HOLD December 10, 2017 HOLD RATING SINCE 06/16/2017 BUSINESS DESCRIPTION The Kroger Co., together with its subsidiaries, operates as a retailer in
Market Capitalization $11.8 Billion. Weekly Price: (US$) SMA (50) SMA (100) 1 Year 2 Years
 SMA (50) SMA (100) 1 Year 2 Years") BUY HOLD SELL A+ A A- B+ B B- C+ C C- D+ D D- E+ E E- F Annual Dividend Rate BUSINESS DESCRIPTION Etablissements Delhaize Freres et Cie `Le Lion' (Groupe Delhaize) Societe Anonyme, together with its subsidiaries,
BUY HOLD SELL A+ A A- B+ B B- C+ C C- D+ D D- E+ E E- F Annual Dividend Rate BUSINESS DESCRIPTION Etablissements Delhaize Freres et Cie `Le Lion' (Groupe Delhaize) Societe Anonyme, together with its subsidiaries,
Market Capitalization $69.7 Billion. Weekly Price: (US$) SMA (50) SMA (100) 1 Year 2 Years
 SMA (50) SMA (100) 1 Year 2 Years") BUY HOLD SELL A+ A A- B+ B B- C+ C C- D+ D D- E+ E E- F Annual Dividend Rate BUSINESS DESCRIPTION Walgreens Boots Alliance, Inc. operates as a pharmacy-led health and wellbeing company. It operates through
BUY HOLD SELL A+ A A- B+ B B- C+ C C- D+ D D- E+ E E- F Annual Dividend Rate BUSINESS DESCRIPTION Walgreens Boots Alliance, Inc. operates as a pharmacy-led health and wellbeing company. It operates through
TECHNOLOGY INNOVATION AND DISRUPTION
 2018 Global Market Outlook Press Briefing TECHNOLOGY INNOVATION AND DISRUPTION Ken Allen Portfolio Manager November 14, 2017 FOR 2018 GLOBAL MARKET OUTLOOK PRESS BRIEFING. PROVIDED TO DESIGNATED MEMBERS
Market Capitalization $69.4 Billion. Weekly Price: (US$) SMA (50) SMA (100) 1 Year 2 Years
 SMA (50) SMA (100) 1 Year 2 Years") BUY HOLD SELL A+ A A- B+ B B- C+ C C- D+ D D- E+ E E- F Annual Dividend Rate BUSINESS DESCRIPTION Lowe's Companies, Inc. operates as a home improvement company in the United States, Canada, and Mexico.
BUY HOLD SELL A+ A A- B+ B B- C+ C C- D+ D D- E+ E E- F Annual Dividend Rate BUSINESS DESCRIPTION Lowe's Companies, Inc. operates as a home improvement company in the United States, Canada, and Mexico.
Specialty Retail & Department Stores Guide to Retail Softlines: January 2016 Edition
 INDUSTRY OVERVIEW Specialty Retail & Department Stores 125% 76% 75% BULL M O R G A N S T A N L E Y R E S E A R C H North America Retail, Specialty Retail, Department Stores, & Off- Price Kimberly Greenberger
CONSUMER DISCRETIONARY
 CONSUMER DISCRETIONARY A REPORT BY: ADAM ASHBROOK & ROBERT AURAND Sector Analysis Consumer Discretionary Encompasses industries that are most sensitive to economic cycles Broken into two main segments
Market Capitalization $3.0 Billion. Weekly Price: (US$) SMA (50) SMA (100) 1 Year 2 Years
 SMA (50) SMA (100) 1 Year 2 Years") BUY HOLD SELL A+ A A- B+ B B- C+ C C- D+ D D- E+ E E- F Annual Dividend Rate BUSINESS DESCRIPTION Ollie's Bargain Outlet Holdings, Inc. operates as a retailer of brand name merchandise. STOCK PERFORMANCE
BUY HOLD SELL A+ A A- B+ B B- C+ C C- D+ D D- E+ E E- F Annual Dividend Rate BUSINESS DESCRIPTION Ollie's Bargain Outlet Holdings, Inc. operates as a retailer of brand name merchandise. STOCK PERFORMANCE
Multichannel Retail Broadlines, Hardlines & ecommerce Primer
 Multichannel Retail Broadlines, Hardlines & ecommerce Primer Greg Melich, CFA Head of Multichannel Retail Greg.Melich@moffettnathanson.com (212) 519-0020 General Merchandise & Auto Michael Montani, CFA
Market Capitalization $507.9 Million
 BUY HOLD SELL A+ A A- B+ B B- C+ C C- D+ D D- E+ E E- F Annual Dividend Rate $ BUY SDAQ: WI BUY RATING SINCE 11/30/2010 TARGET PRICE $174.43 WI BUSINESS DESCRIPTION Winmark Corporation operates as a franchisor
Industry Observations June 30, Internet and Multiline Retail Industry
 Industry Observations June 30, 2017 Internet and Multiline Retail Industry Select Internet and Multiline Retail Industry Public Company Industry Data (USD in millions, except per share data) Company Name
Credit Rating Report CALKAIN RESEARCH
 RESEARCH Credit Rating Report Semi-Annual Update April 2018 CALKAIN RESEARCH 12930 Worldgate Dr Suite 150 Herndon, VA 20170 703.787.4714 calkain.com Rated Tenants Tenant Name Stock S&P S&P Symbol 2 1 Outlook
For personal use only
 15 February 2012 The Manager Company Announcements Office ASX Limited Level 4, Exchange Centre 20 Bridge Street SYDNEY NSW 2000 Westfield Group Level 30 85 Castlereagh Street Sydney NSW 2000 GPO Box 4004
CREDIT RATING REPORT Semi-Annual Update October 2017
 Semi-Annual Update October 2017 CALKAIN 12930 Worldgate Drive Suite 150 Herndon, VA 20170 (703) 787-4714 Rated Tenants TENANT NAME C-STORES STOCK SYMBOL 1 S&P 2 S&P OUTLOOK MOODY'S MOODY'S OUTLOOK 7-Eleven
Research. Credit Rating Report. Semi-Annual Update September 2018
 Research Credit Rating Report Semi-Annual Update September 2018 CALKAIN RESEARCH 12930 Worldgate Dr Suite 150 Herndon, VA 20170 703.787.4714 calkain.com SEPTEMBER 2018 Credit Rating Report Rated Tenants
Industry Observations September 30, Internet and Multiline Retail Industry
 Industry Observations September 30, 2018 Internet and Multiline Retail Industry Select Internet and Multiline Retail Industry Public Company Industry Data (USD in millions, except per share data) Company
Commercial Real Estate Overview: Current and Future Environment. October 3, Presentation by: David Oakes, CFA Chief Financial Officer DDR Corp.
 Commercial Real Estate Overview: Current and Future Environment October 3, 2012 Presentation by: David Oakes, CFA Chief Financial Officer DDR Corp. Safe Harbor DDR considers portions of the information
SAMPLE. Analyst's Notes. Argus Recommendations
 Report created Nov 5, 2010 Page 1 OF 8 Based in Menomonee Falls, Wisconsin, Kohl's Corp. will operate 1,089 department stores by the end of September 2010. The company's stores cater to middle-income customers
PERLES Linked to US Tax Plan Basket Issued by UBS AG, London Branch
 PERLES Linked to US Tax Plan Basket Issued by UBS AG, London Branch Cash settled SVSP Product Type: Tracker Certificates (1300) This Product does not represent a participation in any of the collective
Powered by Artificial Intelligence OUT
 Powered by Artificial Intelligence SUMMARY OF CHANGES IN OUT Square Inc Valeant Pharmaceuticals Intern Kite Pharma Inc Target Corp Oracle Corp Ionis Pharmaceuticals Inc Blackstone Group LP/The Lam Research
Economic Outlook 2016
 Strategic Intelligence Presenters: Presenter: Michael Blackburn Dennis Cantalupo Michael Blackburn Economic Outlook 2016 February 4, 2016 U.S. Economy in 2015 The Good: - After weak Q1, down 2.1%, GDP
Detailed Stock Report
 Updated March 8, 2013 ROSS STORES INCORPORATED (-O) Retailers / Other Specialty Retailers / Apparel Retailers Description The Average Score combines the quantitative analysis of six widely-used investment
$17B MSF 95.5%
 INVESTOR UPDATE SAFE HARBOR DDR considers portions of the information in this presentation to be forward-looking statements within the meaning of Section 27A of the Securities Act of 1933 and Section 21E
S&P Global Ratings Outlook on U.S. Retail Sector Credit Quality. June 15, 2017
 S&P Global Ratings Outlook on U.S. Retail Sector Credit Quality June 15, 2017 Our view of the U.S. Retail landscape Macro Consumer remains very value focused since the financial crisis Wage growth has
Retailing Financial Strategy
 3 ways to increase the value of money turnover model Financial objectives and the strategic profit model ROI model Gross margin return on investment Monitoring retail performance Direct product profitability
RESEARCH. CREDIT RATING REPORT Semi-Annual Update April 2017 CALKAIN Worldgate Drive Suite 150 Herndon, VA (703) CALKAIN.
 CALKAIN.") Semi-Annual Update April 2017 CALKAIN 12930 Worldgate Drive Suite 150 Herndon, VA 20170 (703) 787-4714 Rated Tenants TENANT NAME STOCK SYMBOL 1 S&P 2 S&P OUTLOOK MOODY'S MOODY'S OUTLOOK C-STORES 7 Eleven
Semi-Annual Update April 2017 CALKAIN 12930 Worldgate Drive Suite 150 Herndon, VA 20170 (703) 787-4714 Rated Tenants TENANT NAME STOCK SYMBOL 1 S&P 2 S&P OUTLOOK MOODY'S MOODY'S OUTLOOK C-STORES 7 Eleven
First Trust AlphaDEX TM U.S. Consumer Discretionary Sector Index ETF
 First Trust AlphaDEX TM U.S. Consumer Discretionary Sector Index ETF Annual Management Report of Fund Performance December 31, 2015 blank (Page intentionally left blank) ANNUAL MANAGEMENT REPORT OF FUND
Market Capitalization $3.0 Billion. Weekly Price: (US$) SMA (50) SMA (100) 1 Year 2 Years
 SMA (50) SMA (100) 1 Year 2 Years") BUY HOLD SELL A+ A A- B+ B B- C+ C C- D+ D D- E+ E E- F Annual Dividend Rate BUSINESS DESCRIPTION Bed Bath & Beyond Inc., together with its subsidiaries, operates a chain of retail stores. STOCK PERFORMANCE
BUY HOLD SELL A+ A A- B+ B B- C+ C C- D+ D D- E+ E E- F Annual Dividend Rate BUSINESS DESCRIPTION Bed Bath & Beyond Inc., together with its subsidiaries, operates a chain of retail stores. STOCK PERFORMANCE
Attached is the Westfield Corporation Supplemental Information for the year ended 31 December 2017.
 22 February 2018 The Manager Company Announcements Office ASX Limited Level 4, Exchange Centre 20 Bridge Street SYDNEY NSW 2000 Westfield Corporation Level 29 85 Castlereagh Street Sydney NSW 2000 GPO
Performing Strategic Analysis
 Dollar General Corp. David L. and Elsie M. Dodd Professor of Finance Columbia Business School Heilbrunn Center for Graham & Dodd Investment Value Investing EMBA October, 2017 October 2017 Performing Strategic
- S&P 500: Consumer Cyclicals -
 9 1 13 9 3 3 #1 CONSUMER CYCLICALS PRICE INDEX /31 199 199 199 1999 1 AUTOMOBILES F GM - S&P : Consumer Cyclicals - /31 HOUSEHOLD FURNISHINGS & APPLIANCES LEG MYG WHR /31 199 199 199 1999 1 PUBLISHING
Kohls Corp. (KSS) KSS SELECTED FINANCIALS Motiwala Capital LLC Page 1. Company Description:
 KSS SELECTED FINANCIALS Motiwala Capital LLC Page 1. Company Description:") Kohls Corp. (KSS) July 2, 2012 Price: $45.4 Diluted Shares Out: 240 million Market Cap: $10,900 million Net Cash: -$1,100 million (April 2012) EV: $12,000 million (estimated) KSS SELECTED FINANCIALS 2002
Kohls Corp. (KSS) July 2, 2012 Price: $45.4 Diluted Shares Out: 240 million Market Cap: $10,900 million Net Cash: -$1,100 million (April 2012) EV: $12,000 million (estimated) KSS SELECTED FINANCIALS 2002
Assume that you have just been charged with the responsibility for evaluating the divisional cost of capital for each of the business segments.
 PROBLEM SET: Cost of Capital Exercise 1. BUD [10] In 2006, Annheuser-Busch Companies Inc. (BUD), engaged in the production and distribution of beer worldwide, operates through four business segments: Domestic
Net-Leased Portfolio 6 DST
 Net-Leased Portfolio 6 DST ExchangeRight Net-Leased Portfolio 6 DST is a portfolio of single-tenant, long-term net-leased retail assets that are 100% leased to Advance Auto Parts, AutoZone, CVS/pharmacy,
AVA Investment Analytics Mike Stathis Chief Investment Strategist. [Analysis of 60 Stocks with High Short Interest]
![AVA Investment Analytics Mike Stathis Chief Investment Strategist. [Analysis of 60 Stocks with High Short Interest]](/thumbs/94/121062434.jpg "AVA Investment Analytics Mike Stathis Chief Investment Strategist. [Analysis of 60 Stocks with High Short Interest]") 2012 AVA Investment Analytics www.avaresearch.com Mike Stathis Chief Investment Strategist [Analysis of 60 Stocks with High Short Interest] Analysis of 60 Stocks with High Short Interest (as a percentage
2012 AVA Investment Analytics www.avaresearch.com Mike Stathis Chief Investment Strategist [Analysis of 60 Stocks with High Short Interest] Analysis of 60 Stocks with High Short Interest (as a percentage
SAB 74 DISCLOSURE ANALYSIS FOR LEASE ACCOUNTING
 SAB 74 DISCLOSURE ANALYSIS FOR LEASE ACCOUNTING Top 100 US Public Companies Ranked By Leasing Obligations ASC 842 LEASE ACCOUNTING STANDARDS TABLE OF CONTENTS Executive Summary... 3 SAB 74 Disclosures...
Last Price Day Change Open Price Day Range 52-Week Range Proj. Yield Market Cap Volume Avg Vol. Forward P/E P/B P/S P/CF
 Page 1 of 5 Morningstar Analyst Rating. Last Price Day Change Open Price Day Range 52-Week Range Proj. Yield Market Cap Volume Avg Vol. Forward P/E P/B P/S P/CF $ 83.76 ]2.11 2.58 % $ 82.16 81.74-83.90
Nasdaq AlphaDEX Large Cap Growth Index
 Nasdaq AlphaDEX Large Cap Growth Index The NASDAQ AlphaDEX US Index Family employs the AlphaDEX stock selection methodology to select stocks from the Nasdaq US Select Index Family and the Nasdaq US Select
An Overview of Retailing Industry in the World A Study
 Original Research Paper Management An Overview of Retailing Industry in the World A Study Dr. Dipakkumar Vitthalbhai Patel ABSTRACT Associate Professor, Faculty of Business Administration, Dharmsinh Desai
Publisher Audience Insights Report. A Sample of Report Data Delivered to Publisher Partners 2014
 Publisher Audience Insights Report A Sample of Report Data Delivered to Publisher Partners 2014 About CivicScience s Publisher Reporting A Typical Publisher Audience Insight Report includes: Brand indexes
Trade Summary. Entry Exit Return. No. Reporting Days No. Executed Trades Avg. Trade Duration Avg. Return / Trade Max Return Min Return
 Trade Summary Futures, stocks, and spot currency trading have large potential rewards, but also large potential risk. You must be aware of the risks and be willing to accept them in order to invest in
Get Started Workshop. How to Start Trading and Investing in the Stock Market
 Get Started Workshop How to Start Trading and Investing in the Stock Market Legal By attending this workshop, you are agreeing to the following: You understand and acknowledge that Simply Put, LLC is not
Retail Bankruptcy Prediction
 American Journal of Economics and Business Administration 5 (1): 29-46, 2013 ISSN: 1945-5488 2013 Science Publication doi:10.3844/ajebasp.2013.29.46 Published Online 5 (1) 2013 (http://www.thescipub.com/ajeba.toc)
Shares Description Value
 First Trust Nasdaq Bank ETF (FTXO) Portfolio of Investments COMMON STOCKS - 99.9% Banks - 98.3% 1,708,951 Bank of America Corp.... $ 50,448,234 417,486 Bank of The Ozarks... 20,227,197 974,123 BB&T Corp....
Last Price Day Change Open Price Day Range 52-Week Range Proj. Yield Market Cap Volume Avg Vol. Forward P/E P/B P/S P/CF
 Page 1 of 5 Morningstar Analyst Rating. Last Price Day Change Open Price Day Range 52-Week Range Proj. Yield Market Cap Volume Avg Vol. Forward P/E P/B P/S P/CF $ 50.69 ]1.67 3.41 % $ 49.19 48.87-50.88
Performance-Based Restricted Stock Unit Terms and Conditions Amended and Restated 2009 Omnibus Incentive Compensation Plan
 2017-2019 Performance-Based Restricted Stock Unit Terms and Conditions Amended and Restated 2009 Omnibus Incentive Compensation Plan 1. Grant of Performance-Based Restricted Stock Units. Subject to and
Corporate Finance. Week 3 Financial Statement Analysis II
 Corporate Finance 1-1 Week 3 Financial Statement Analysis II 1-1 Asset Efficiency or Turnover Measures 1-2 A first broad measure of efficiency is asset turnover: Sales Asset Turnover = Total Assets Fixed
The 100 Largest U.S Corporations, 2010
 The 100 Largest U.S s, 2010 ('10) ('10) 3M 97 $26,662,000,000 $39,086,960 72 10 11 2 Bermuda 1 Luxembourg 3 Singapore 4 Switzerland 2 Abbott Laboratories 69 $35,166,700,000 $73,593,104 289 121 71 35 Bahamas
First Trust AlphaDEX TM U.S. Consumer Discretionary Sector Index ETF
 First Trust AlphaDEX TM U.S. Consumer Discretionary Sector Index ETF Interim Management Report of Fund Performance June 30, 2017 blank (Page intentionally left blank) INTERIM MANAGEMENT REPORT OF FUND
Analyst Report Student Managed Fund
 Analyst Report 2017-2018 Student Managed Fund Mark Kugler and Alec Pisanelli 16 April 2018 1 Table of Contents Recommendation Overview 3 Costco Corporation Overview 4 Business Description 4 Corporate Strategy
Liberty Interactive (LINTA) The Liberty Family s Forgotten Child. Patrick Brennan, CFA
 The Liberty Family s Forgotten Child. Patrick Brennan, CFA") Liberty Interactive (LINTA) The Liberty Family s Forgotten Child Patrick Brennan, CFA Liberty Interactive What exactly is LINTA? Why is QVC model superior to other retailers? Another f#!$ tracking stock?
Liberty Interactive (LINTA) The Liberty Family s Forgotten Child Patrick Brennan, CFA Liberty Interactive What exactly is LINTA? Why is QVC model superior to other retailers? Another f#!$ tracking stock?
Powered by Artificial Intelligence OUT
 Powered by Artificial Intelligence SUMMARY OF CHANGES IN OUT Goldman Sachs Group Inc/The Ulta Beauty Inc Incyte Corp salesforce.com Inc TESARO Inc Nordstrom Inc Marathon Oil Corp ebay Inc Macy s Inc Adobe
Powered by Artificial Intelligence
 Powered by Artificial Intelligence SUMMARY OF CHANGES IN salesforce.com Inc Lululemon Athletica Inc Home Depot Inc/The Target Corp Cisco Systems Inc Palo Alto Networks Inc Nutanix Inc Splunk Inc Nordstrom
BUZ NYSE ARCA. Powered by Artificial Intelligence. BUZZ US SENTIMENT LEADERS ETF July 2018 Monthly Index Rebalance OUT SUMMARY OF CHANGES
 Powered by Artificial Intelligence SUMMARY OF CHANGES IN BlackBerry Ltd KeyCorp TE Connectivity Ltd Biogen Inc Oracle Corp PepsiCo Inc Citigroup Inc Walgreens Boots Alliance Inc Darden Restaurants Inc
XRT SPDR S&P Retail ETF
 SPDR S&P Retail ETF ETF.com segment: Equity: U.S. Retail Competing ETFs: PMR, FTXD Related ETF Channels: Sectors, U.S., Smart-Beta ETFs, Equity, Equal-Weighted, Retail, North America, Consumer Discretionary,
Investor Presentation January 2011
 Investor Presentation FORWARD LOOKING STATEMENTS This presentation contains forward-looking statements. These forward-looking statements are subject to a number of factors that could cause actual results
SUMMARY. Risk Level *
 January 29, 2015 Kohl s Corporation Current Recommendation SUMMARY DATA NEUTRAL Prior Recommendation Underperform Date of Last Change 07/22/2013 Current Price (01/28/15) $60.80 Target Price $64.00 52-Week
FREDERIC W. COOK & CO., INC. FVT FAIR VALUE TRANSFER. Alternative Approach to Measuring Aggregate Long-Term Incentive Grant Values
 FREDERIC W. COOK & CO., INC. FVT FAIR VALUE TRANSFER Alternative Approach to Measuring Aggregate Long-Term Incentive Grant Values FEBRUARY 2005 INTRODUCTION Long-term incentive (LTI) compensation programs
Anno accademico
 Anno accademico 2018-2019 Corso di Laurea Magistrale in Economia Aziendale Curriculum amministrazione e governance delle aziende (ex DM 270) PRINCIPLES OF BUSINESS VALUATION Valuing a Changing Perimeter
First Trust Nasdaq Bank ETF (FTXO) Portfolio of Investments June 30, 2018 (Unaudited)
 Portfolio of Investments June 30, 2018 (Unaudited)") First Trust Nasdaq Bank ETF (FTXO) COMMON STOCKS 99.8% Banks 98.3% 776,313 Associated Banc-Corp. $ 21,193,345 737,824 Bank of America Corp. 20,799,259 450,702 Bank OZK 20,299,618 2,567,080 BankUnited,
First Trust Nasdaq Bank ETF (FTXO) COMMON STOCKS 99.8% Banks 98.3% 776,313 Associated Banc-Corp. $ 21,193,345 737,824 Bank of America Corp. 20,799,259 450,702 Bank OZK 20,299,618 2,567,080 BankUnited,
The Equity Observer Weekly Review August 31, Eric J. Weigel
 The Equity Observer Weekly Review August 31, 2018 Eric J. Weigel Top Equity Markets The US keeps plowing ahead, China is dragging down Emerging Markets TOP EQUITY MARKETS 2018 2017 2016 2015 2014 2013
BUZ NYSE ARCA. Powered by Artificial Intelligence. BUZZ US SENTIMENT LEADERS ETF June 2018 Monthly Index Rebalance OUT SUMMARY OF CHANGES
 Z US SENTIMENT LEADERS ETF Powered by Artificial Intelligence SUMMARY OF CHANGES IN salesforce.com Inc Palo Alto Networks Inc Sprint Corp Costco Wholesale Corp Macy s Inc Target Corp NIKE Inc Splunk Inc
General retail. abc. General retail. Sector sales. Paul Rossington* Analyst HSBC Bank plc
 Paul Rossington* Analyst HSBC Bank plc +44 20 7991 6734 paul.rossington@hsbcib.com Sector sales Lynn Raphael Sector sales HSBC Bank plc +44 20 7991 1331 lynn.raphael@hsbcib.com David Harrington Sector
The Equity Observer Weekly Review March 10, Eric J. Weigel
 The Equity Observer Weekly Review March 10, 2019 Eric J. Weigel % % Equity markets have had a great start to the year Equity markets have staged a remarkable recovery after a dismal Q4 but last week was
Fund for Investment in Commercial Real-Estate in the U.S. JUNE 2010 Investors Presentation
 Fund for Investment in Commercial Real-Estate in the U.S. JUNE 2010 Investors Presentation U.S. Investment Analysis History has presented us with a rare window of opportunity, occurring only once in decades,
Executive Compensation Compensation Discussion and Analysis
 Executive Compensation Compensation Discussion and Analysis This CDA describes the objectives and the role of the Compensation Committee and discusses the philosophy upon which the Compensation Committee
CIF Stock Recommendation Report (Spring 2013)
") Date: February 13, 2013 Analyst Name: Alyssa Wood CIF Stock Recommendation Report (Spring 2013) Company Name and Ticker: Urban Outfitters (URBN) Section (A) Summary Recommendation Buy: Yes Target Price:
Date: February 13, 2013 Analyst Name: Alyssa Wood CIF Stock Recommendation Report (Spring 2013) Company Name and Ticker: Urban Outfitters (URBN) Section (A) Summary Recommendation Buy: Yes Target Price:
THOMSON REUTERS MARKET WEEK
 THOMSON REUTERS MARKET WEEK Volume V Issue 37 September 15, 2008 Economics & Fixed Income Bottom Line Contribution by IFR Markets Almost as soon as the ink began rolling on a GSE conservatorship plan,
RR1- Page 478 of 518. Attachment RBH-RR-4 Page 14 of 14 Docket No
 Attachment RBH-RR-4 Page 14 of 14 Market Risk Premium Calculation 141 151 [61 [71 181 191 Line Market Estimated Long-Term Weighted No. Company Ticker Capitalization Weight in Index Dividend Yield Growth
Benchmark. Base salary 2012 Base salary 2013 Base salary 2014
 Remuneration Annual Report 2014 57 s remuneration policy is prepared in accordance with the Dutch Corporate Governance Code and was adopted at the General Meeting of Shareholders on April 17, 2013. Remuneration
Growth Story On Track; Near-Term Momentum Seems Sustainable
 March 30, 2016 Ulta Salon Cosmetics and Fragrance Inc Growth Story On Track; Near-Term Momentum Seems Sustainable Industry View In-Line Stock Rating Equal-weight Price Target $205.00 Investor meetings
INTENSIVE PROCESSES OF RETAIL INTERNATIONALIZATION
 856 Ishak Mešić INTENSIVE PROCESSES OF RETAIL INTERNATIONALIZATION Ph. D. Ishak Mešić University of Zenica - Faculty of Economics ABSTRACT Integration and globalization of world market have resulted in
BUZZ NEXTGEN AI SERIES INDICES US Sentiment Leaders - September 2017 Monthly Index Rebalance. Powered by Artificial Intelligence OUT
 Powered by Artificial Intelligence SUMMARY OF CHANGES IN OUT Ulta Beauty Inc Netflix Inc Lowe s Cos Inc Intuitive Surgical Inc Oracle Corp Priceline Group Inc/The Best Buy Co Inc CenturyLink Inc Incyte
Analyst's Notes. Argus Recommendations
 Report created Sep 22, 2017 Page 1 OF 7 Bed Bath & Beyond Inc. is a leading seller of products for the home, including sheets, pillows, blankets and window treatments. Fiscal 2017 sales were $12.2 billion.
The Coe Report. Intraday Bulletin. Near-term Market View
 The Coe Report Intraday Bulletin 12.21pm EDT 15 May 2013 www.investorsintelligence.com Near-term Market View The rally continues, although our initial target for the S&P 500 of 1678, as discussed in the
FYI Items for October 21, 2014
 FYI Items for October 21, 2014 The following items are for Council s information. To jump to the supporting documents, click on the corresponding item name. Item Description Page 1. August 2014 Tax Collection
FREDERIC W. COOK & CO., INC. FVT FAIR VALUE TRANSFER. Alternative Approach to Determining Aggregate Long-Term Incentive Grant Sizes
 FREDERIC W. COOK & CO., INC. FVT FAIR VALUE TRANSFER Alternative Approach to Determining Aggregate Long-Term Incentive Grant Sizes NOVEMBER 2006 FREDERIC W. COOK & CO., INC. FVT FAIR VALUE TRANSFER Alternative
BUZZ US SENTIMENT LEADERS ETF Quarterly Scorecard NYSE ARCA. Powered by Artificial Intelligence. Quarterly Scorecard 4 th Quarter 2017 what s INSIDE
 BUZZ US SENTIMENT LEADERS ETF Quarterly Scorecard BUZ NYSE ARCA Powered by Artificial Intelligence ETF Stats Ticker: BUZ Underlying Index: BUZZ Listing Exchange: NYSE Arca CUSIP: 00162Q 494 Fund Inception:
B400 Hall of Fame. Introducing INDEX. Introducing the Barron s 400 Index Hall of Fame
 B400 Hall of Fame Introducing the Barron s 400 Index Hall of Fame February 2016 The Barron s 400 Index, or B400, was jointly developed by Barron s, MarketGrader and Dow Jones Indexes and introduced on
BUZZ US SENTIMENT LEADERS ETF INSIGHTS November Powered by Artificial Intelligence BUZ
 Z US SENTIMENT LEADERS ETF INSIGHTS November 2017 NYSE ARCA Powered by Artificial Intelligence Key TAKEAWAYS The Z US Sentiment Leaders ETF () returned 1.99% for the month of November. Despite trailing
Remuneration. Bill McEwan Chairman of the Remuneration Committee of the Supervisory Board
 Ahold Delhaize Annual Report 2017 101 Bill McEwan Chairman of the Committee of the Supervisory Board Dear shareholder, I am pleased to present our 2017 report. As one of the world s leading food retail
Sam s Club. Jefferies 2013 Global Consumer Conference. Michael Dastugue, Chief Financial Officer of Sam s Club
 Sam s Club Jefferies 2013 Global Consumer Conference Michael Dastugue, Chief Financial Officer of Sam s Club Wal-Mart Stores, Wal-Mart Inc. Stores, (NYSE: Inc. WMT) (NYSE: WMT) Forward-looking statement
CHAPTER 3 ACCRUAL ACCOUNTING CONCEPTS
 CHAPTER 3 ACCRUAL ACCOUNTING CONCEPTS CLASS DISCUSSION QUESTIONS 1. Google and Wal-Mart use the accrual basis of accounting. Generally accepted accounting principles (GAAP) require all but very small businesses