Texas Workforce Commission: Employment Forecast
|
|
|
- Adrian Scott
- 6 years ago
- Views:
Transcription
1 Texas Workforce Commission: Employment Forecast RDA Global March 17, 2010
2 Texas Workforce Commission: Employment Forecast RDA Global March 17, 2010
3 Texas Local Workforce Development Area (LWDA) The Texas Workforce Commission (TWC) reports employment statistics for 28 Local Workforce Development Areas (LWDA) in the State of Texas. The location of these LWDAs is indicated in the following slide. This report summarizes RDA Global s forecasts for employment in each of these 28 LWDAs. In addition the report summarizes these forecasts by 2-digit industry break-downs.
 Capital Area 15) Rural Capital 16) Brazos Valley 17) Deep East Texas 18) South East Texas 19) Golden Crescent 20) Alamo 21) South Texas 22) Coastal Bend 23) Lower Rio Grande Valley 24)")
4 1) Panhandle 2) South Plains 3) North Texas 4) North Central 5) Tarrant County 6) Dallas 7) North East 8) East Texas 9) West Central 10) Upper Rio Grande 11) Permian Basin 12) Concho Valley 13) Heart of Texas 14) Capital Area 15) Rural Capital 16) Brazos Valley 17) Deep East Texas 18) South East Texas 19) Golden Crescent 20) Alamo 21) South Texas 22) Coastal Bend 23) Lower Rio Grande Valley 24) Cameron County 25) Texoma 26) Central Texas 27) Middle Rio Grande 28) Gulf Coast
5 Texas Industries and Employment The largest sectors of the Texas economy are, in declining size: Health Care, Retail, Education and Accommodation and Food. Many of these industry segments experienced weak or negative job growth in 2009 but generally industry sectors in Texas performed better than was the case for the nation as a whole. And while the job growth recovery in the Texas industry sectors is forecast to be relatively moderate over the next couple of years, it will be more robust than is the case for the U.S. economy as a whole. Growth in public administration will create 30,000 jobs in reflecting continued growth in public sector expenditures.
6 Texas Employment by Industry Sector Accommodation and Food Administration and Waste Arts Construction Education ,000 1, Employment (Thousands) ,000 1, ,000 1,500 Finance Health Care Information Management Enterprise Manufacturing Mining Other Services Professional Public Administration Real Estate ,000 1,500 Retail Transportation Unclassified Utilities Wholesale
7 Texas and USA Employment Growth by Industry Accommodation and Food Administration and Waste Arts Construction Education Finance Health Care Information Management Enterprise Manufacturing Annual Growth Mining Other Services Professional Public Administration Real Estate Retail Transportation Utilities Wholesale year RDA Texas Forecast RDA USA Forecast
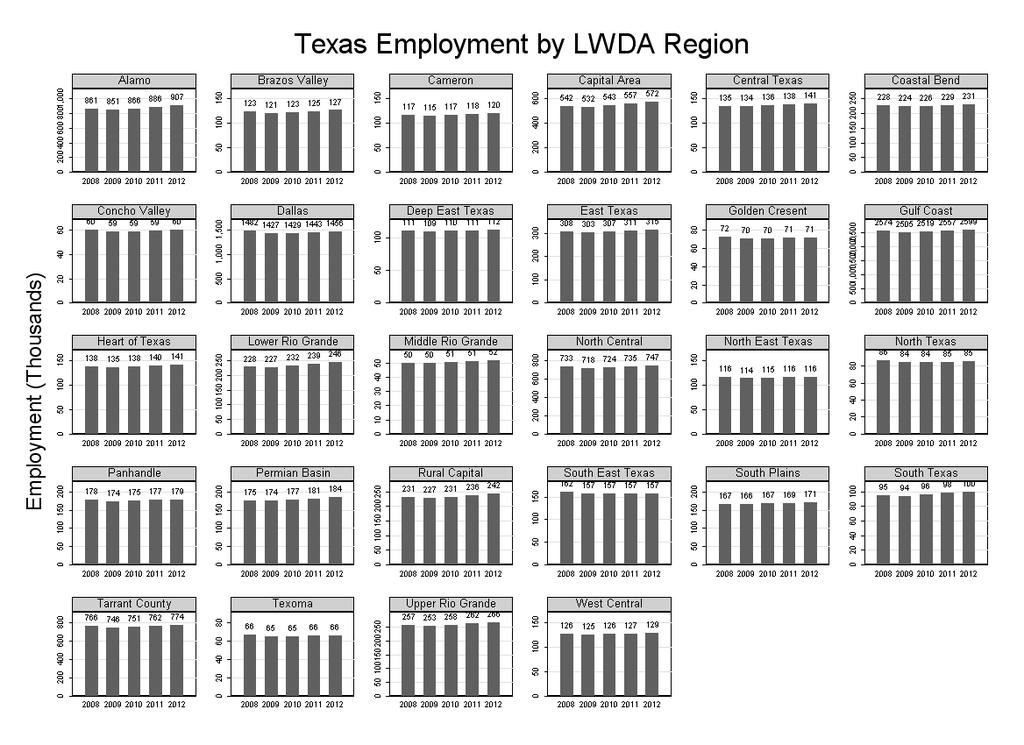
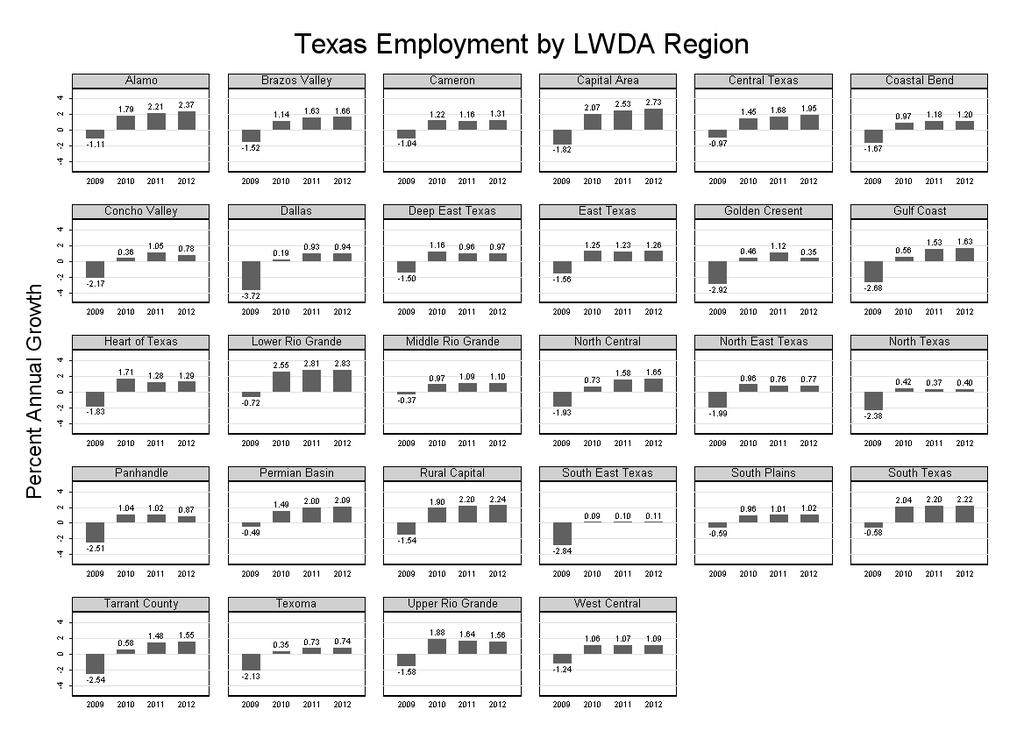
8 Employment in the Local Workforce Development Areas Gulf Coast, Dallas, Alamo, Tarrant County and North Central are the five largest LWDAs in terms of employment. Virtually all of the LWDAs experienced employment decline in And most of the LWDAs will experience a moderate recovery in employment growth over the period. There are though some LWDAs that will experience very anemic growth during this period: Golden Cresent, North Texas, North East Texas, South East Texas, Texoma, Concho Valley, and Dallas.
9
10
11
12 Texas Employment Trends Employment in the 28 Texas LWDAs totaled 10.2 million in RDA Global estimates that employment declined by 2.2 percent in 2009 to just under 10 million. In 2010 we expect employment to grow by about 1 percent bringing the employment numbers just over 10 million. In 2011 and 2012 we are forecasting annual employment growth of about 1.5 percent which will bring total employment to about 10.4 million.
13 Employment (Thousands) 0 2,000 4,000 6,000 8,000 10,000 10,192 Texas Employment Forecast 9, ,060 10,212 10, Annual Percent Change Year RDA Global 2009
14 Texas Jobs: 2012 and Growth (1000s)
15 Texas Jobs: 2012 and Growth (Positives) In 2012, the four largest industry segments in terms of employment are: Health Care, Education, Retail, and Accommodation and Food Three of these will experience significant job creation over the period: Health Care (122,000 new jobs); Education (60,000); and Accommodation (80,000). Retail will provide 1.2 million jobs in 2012 but this is essentially the same level the sector was at in Growth in public administration will create 30,000 jobs in reflecting continued growth in public sector expenditures.
16 Texas Jobs: The Largest Job Gains LWDA Name Employment Industry New Jobs Percent Change Gulf Coast 282,450 Health Care 29,355 12% Gulf Coast 229,370 Accommodation and Food 19,492 9% Dallas 161,055 Health Care 17,728 12% Alamo 136,550 Health Care 15,730 13% Alamo 108,041 Accommodation and Food 15,006 16% Gulf Coast 202,628 Professional 14,795 8% Gulf Coast 261,773 Education 13, % Forth Worth 89,526 Health Care 10,614 13% Austin/Travis 62,258 Accommodation and Food 9,795 19% North Central 80,739 Health Care 9,520 13% Gulf lfcoast 84,637 Public Administration i ti 7,578 10% Lower Rio Grande 60,867 Health Care 6,987 13% Forth Worth 77,014 Accommodation and Food 6,697 10% North Central 104,125 Education 5,767 6% Dallas 106,027 Education 5,759 6% Austin/Travis 58,850 Health Care 5,519 10% Austin/Travis 55,378 Professional 5,497 11% Alamo 93,164 Education 5,197 6% North Central 71,848 Accommodation and Food 4,293 6% Gulf Coast 129,761 Transportation 4,216 3% Forth Worth 70,819 Education 4,004 6% Austin/Travis 51,922 Public Administration 3,481 7% North Central 99,828 Retail 3,238 3% Alamo 53,833 Finance 2,249 4% Austin/Travis 55,655 Retail 2,206 4%
17 Health Care: The Largest Job Creating Sector in Texas In the U.S. 10 of the 20 fastest growing occupations are healthcare related Nation-wide healthcare is expected to generate 3.2 million new wage and salary jobs between 2008 and 2018, more than any other industry, largely in response to rapid growth in the elderly population. In 2012 it will be the largest employer in the state, employing 1.3 million people Between 2008 and 2012 the sector will create 122,000 jobs in Texas which represents about one-third of all new jobs created during this period.
18 Accommodation and Food: Slower but Strong Growth Recently this sector has had greater than average employment growth in the state. Reduced disposable income will slow this growth. Nevertheless in period it will create 78,000 jobs; and increase of 9 percent over this four year period.
19 Education: Tracking National Trends Employment in the U.S. education sector is expected to grow by about 1.2 percent annually over the next ten years according to the Bureau of Labor Statistics. Driving this growth is increasing student enrolments at all levels of education. Given Texas demographics, which tend to be younger than the national average, this student enrolment growth will be higher in the state. In Texas we expect annual growth in education employment of about 1.4 percent for the period. By 2012 this will be the second largest employer in Texas employing 1.1 million people and it will add about 63,000 jobs over the 2008 and 2012 period.
20 Public Administration: Counter-cyclical Local Government Government employment tends to grow during periods of economic contraction and have no reason to expect otherwise in this recession period and in the post-recession period of high unemployment Much of the growth will take place at local government levels. Annual growth in government employment will be about 1.8 percent during this four year period, creating about 31,000 jobs.
21 Texas Jobs: 2012 and Growth (Negatives) Manufacturing continues its secular decline in the period the sector will shed approximately 100,000 jobs in this period. Construction and the Management and Waste sectors will also experience significant job loss partially a fallout of problems in both consumer and commercial real estate markets.
22 Texas Jobs: The Largest Job Losses LWDA Region Employment Industry Lost Jobs Gulf Coast 210,734 Manufacturing 34,688 Gulf Coast 190,916 Construction 20,859 Dallas 113,198 Manufacturing 20,156 Forth Worth 76,484 Manufacturing 10,671 Dallas 77,657 Construction 8,819 Dallas 115,933 Professional 8,394 North Central 65,345 Manufacturing 7,484 Forth Worth 83,742 Retail 7,137 Dallas 127,779 Administration and Waste 6,947 Gulf Coast 174,921 Administration and Waste 5,937 Gulf Coast 266,365 Retail 5,334 Dallas 103,114 Wholesale 3,454 Alamo 53,682 Construction 3,426 Gulf Coast 137,183 Wholesale 3,290 Dallas 134,750 Retail 3,246 Alamo 58,848 Administration and Waste 1,997 Forth Worth 55,282 Administration and Waste 1,876 Gulf Coast 90,307 Mining 1,202 Dallas 106,503 Finance 765
23 Manufacturing: Decline will Continue Manufacturing activity in Texas will stabilize and experience moderate improvement in the period. Manufacturing employment will not recover to the same extent the numbers employed in manufacturing will continue to decline in the period. Continued global competition in the manufacturing sector (and a recently appreciating U.S. dollar) will put pressure on Texas exports it will also mean that larger firms will continue the trend of out sourcing jobs off-shore. Small and medium size manufacturing firms are an important source of job creation these small and medium size firms have been particularly negatively affected by the recent financial crisis that has resulted in a significant reduction in bank lending to small and medium size firms.
24 Construction: Significant Decline During the period , employment in construction will decline by approximately 60,000 jobs. Employment in construction declined significantly in 2009 and we do not expect any significant growth in the construction sector in
25 Dallas Jobs: 2012 and Growth Mediocre job growth over Of its six largest employment sectors, only 1 (Health Care) shows robust growth while a second (Accommodation and Food) will just barely have positive growth. The other four of its six largest employment sectors all show declining employment in three cases quite substantial (Manufacturing, Professional, and Administration and Waste). And some of its smaller employment sectors like wholesale, construction, and other services will experience relatively large employment losses.
26 Dallas Job Growth
27 Dallas Jobs: 2012 and Growth (1000s)
28 Tarrant County Jobs: 2012 and Growth Mixed employment situation for Two of its four largest employment sectors Health Care and Accommodation and Food will turn in robust growth over this period The other two of its four largest employment sectors will experience significant employment declines Manufacturing and Retail.
29 Tarrant County Job Growth:
30 Tarrant County Jobs: 2012 and Growth (1000s)
31 Gulf Coast Jobs: 2012 and Growth Moderately positive employment situation for Two of the large employment sectors Manufacturing and Construction will see significant job losses during the period. This is counter-balanced though by quite strong performance in four sectors: Health Care, Professional, Education, and Accommodation and Food.
32 Gulf Coast Jobs Growth
33 Gulf Coast Jobs: 2012 and Growth (1000s)
34 Capital Area Jobs: 2012 and Growth Strong employment growth for All six of the top employment sectors in the Capital Area are forecast to turn in quite robust growth rates over the period. Employment will grow by around 10 percent (or higher) in Health Care, Accommodation and Food, and Professional. There is declining employment in some sectors, such as Manufacturing, but the rate of decline is less than in other parts of the state.
35 Capital Area Job Growth
36 Capital Area Jobs: 2012 and Growth (1000s)
37 North East Texas Jobs: 2012 and Growth Stable employment growth for The North East region s largest employment sector is Manufacturing which is expected to shed about 1,600 jobs in the period. Three of the largest employment sectors Health Care, Education, and Public Administration will generate about 2,200 jobs over the period. Construction and Transportation will loose about 700 jobs.
38 North East Job Growth
39 North East Jobs: 2012 and Growth (1000s)
40 Alamo Jobs: 2012 and Growth Positive employment situation for Most employment sectors in the Alamo Region will either experience growth or no change in employment over the period. The exceptions are Construction and and Administration and Waste but even here the job losses will be less significant than in many other regions of the state. And on the positive side, some of the region s largest employers Accommodation and Food and Health Care will experience significant employment growth.
41 Alamo Job Growth
42 Alamo Jobs: 2012 and Growth (1000s)
43 Brazos Valley Jobs: 2012 and Growth Slow growth in employment for With the exception of Manufacturing and Administration and Waste, the employment sectors in the Brazos Region with be stable or generate weak rates of employment growth. The overall best performing sector will be Accommodation and Food with about 10 percent growth for the period. The other sectors that do experience growth will have rates of growth that are relatively anemic.
44 Brazos Valley Job Growth
45 Brazos Valley Jobs: 2012 and Growth (1000s)
46 Coastal Bend Jobs: 2012 and Growth Mixed employment situation for Moderate levels of growth in some of the region s largest employment sectors: Health Care, Accommodation and Food, and Education. But also moderately high levels of job losses in Manufacturing, Construction, Retail and Mining.
47 Coastal Bend Job Growth
48 Coastal Bend Jobs: 2012 and Growth (1000s)
49 Cameron Jobs: 2012 and Growth Slow growth in employment for Moderate levels of growth in the region s largest five employment sectors: Health Care, Accommodation and Food, Education, Public Administration, and Retail. But Manufacturing experiences significant employment loss and Construction and Administration and Waste will see moderate job losses over the period.
50 Cameron Job Growth
51 Cameron Jobs: 2012 and Growth (1000s)
52 Central Texas Jobs: 2012 and Growth Stable growth in employment for Moderate levels of growth in the region s largest five employment sectors: Health Care, Accommodation and Food, Education, Public Administration, and Retail. But Manufacturing, Construction and Administration and Waste will see moderate job losses over the period.
53 Central Texas Job Growth
54 Central Texas Jobs: 2012 and Growth (1000s)
55 Deep East Texas Jobs: 2012 and Growth Declining growth in employment for Most employment sectors in the region are losing jobs or experiencing no change in employment in some cases like Manufacturing the job losses are significant. There are sectors that will experience job growth Health Care, Education, Accommodation and Food, and Public Administration but the growth will be relatively anemic compared to other regions of the state.
56 Deep East Texas Job Growth
57 Deep East Texas Jobs: 2012 and Growth (1000s)
58 Golden Cresent Jobs: 2012 and Growth Declining growth in employment for The Golden Cresent region will experience significant job loss in Manufacturing, Construction and Mining sectors that rank amongst the region s largest employers. There are sectors that will experience job growth Health Care, Education, Accommodation and Food, and Public Administration but the growth will be relatively anemic compared to other regions of the state.
59 Golden Cresent Job Growth
60 Golden Cresent Jobs: 2012 and Growth (1000s)
61 Lower Rio Grande Jobs: 2012 and Growth Solid growth in employment for The Lower Rio Grande region will experience significant job growth in two of its largest employment categories: Health Care and Education 12,000 jobs will be created over the period. Moreover, the region will experience job losses in only two sectors, Manufacturing and Construction but the job losses are relatively limited compared to other regions in the state.
62 Lower Rio Grande Job Growth
63 Lower Rio Grande Jobs: 2012 and Growth (1000s)
64 Middle Rio Grande Jobs: 2012 and Growth Stable growth in employment for There will be growth in the larger employment sectors of the Middle Rio Grande region Health Care and Public Administration will turn in reasonably good performance, creating about 12,000 jobs. The Retail sector which is one of the largest sectors in the region will just barely avoid loosing jobs. And Manufacturing will take a reasonably big hit, loosing 4,000 jobs over the period.
65 Middle Rio Grande Job Growth
66 Middle Rio Grande Jobs:2012 and Growth (1000)
67 South East Texas Jobs: 2012 and Growth Significant declines in employment for Virtually all of the employment sectors in South East Texas will experience job losses during this period. South East Texas will experience significant declines in its largest employment sectors; in particular loosing 2,800 jobs in Manufacturing and Construction. The region is also expected to loose about 500 jobs in Retail and Health Care. The only minor bright spot is Accommodation and Food that will create 200 jobs.
68 South East Texas Job Growth
69 South East Texas Jobs: 2012 and Growth (1000s)
70 South Texas Jobs: 2012 and Growth Strong growth in employment for ,300 jobs will be created in the region s two largest sectors: Education and Health Care. Manufacturing and Construction are not major employers in South Texas and will account for less than 500 lost jobs during the period. The nine largest employment sectors in the region will experience solid growth during the period Retail is an exception where growth is anemic
71 South Texas Job Growth
72 South Texas Jobs: 2012 and Growth (1000s)
73 Texoma Jobs: 2012 and Growth Stable employment for Texoma will see no employment growth over the period. The two largest employment sectors in Texoma Education and Health Care will create just over 1,000 jobs, a rate of job creation lower than in other regions of the state. 1,000 jobs will be lost in Manufacturing and Construction a rate on par with that of other regions in the state The remaining sectors of the Texoma economy will see very most changes in their employment levels
74 Texoma Job Growth
75 Texoma Jobs: 2012 and Growth (1000s)
76 Concho Valley Jobs: 2012 and Growth Stable employment for Concho Valley will loose 1,000 jobs in Manufacturing and Construction over the period. This will be counter-balanced by approximately 1,000 new jobs in Health Care and Accommodation and Food. The remaining sectors of the Concho Valley economy will see very modest changes in their employment levels
77 Concho Valley Job Growth
78 Concho Valley Jobs: 2012 and Growth (1000s)
79 East Texas Jobs: 2012 and Growth Stable employment growth for East Texas two largest employment sectors Health Care and Education will generate 6,500 jobs over the period. The region will loose about just over 4,000 jobs in Manufacturing and Construction. Most of the other sectors of East Texas will generate positive employment growth over the period.
80 East Texas Job Growth
81 East Texas Jobs: 2012 and Growth (1000s)
82 Heart of Texas Jobs: 2012 and Growth Stable employment growth for The Heart of Texas region s two largest employment sectors Health Care and Education will generate 2,600 jobs over the period. Accommodation and Food and Public Administration will create about 1,500 jobs. Construction and Manufacturing are the only two sectors to experience significant job losses about 1,300 jobs.
83 Heart of Texas Job Growth
84 Heart of Texas Jobs: 2012 and Growth (1000s)
85 North Central Jobs: 2012 and Growth Stable employment growth for The four largest employment sectors of North Central Health Care, Education, Retail, and Accommodation and Food will generate 25,000 jobs over the period. Finance and Public Administration will create about 4,000 jobs. Construction, Manufacturing and Administration and Waste will loose about 1,400 jobs.
86 North Central Job Growth
87 North Central Jobs: 2012 and Growth (1000s)
88 North Texas Jobs: 2012 and Growth Declining employment for In the period, North Texas will loose a total of 1,200 jobs in two of its largest employers: Retail and Manufacturing. Most other sectors of the economy will experience moderate job loss.
89 North Texas Job Growth
90 North Texas Jobs: 2012 and Growth (1000s)
91 Panhandle Jobs: 2012 and Growth Stable employment for The largest employment sectors of the Panhandle will for the most part create jobs during the period: Health Care, Retail, Education, Accommodation and Food, and Public Administration will generate about 3,200 jobs. Manufacturing and Construction will shed a total of 3,000 jobs. In some of the smaller sectors such Art, Wholesale and Finance there will be moderate numbers of jobs created.
92 Panhandle Job Growth
93 Panhandle Jobs: 2012 and Growth (1000s)
94 Permian Basin Jobs: 2012 and Growth Moderate employment growth for The five largest employment sectors of the Permian Basin will experience positive employment growth (6,500 jobs) during the period: Mining, Health Care, Retail, Accommodation and Food, and Education. Job losses will be confined essentially to Manufacturing and Construction (a loss of 1,200 jobs). The other sectors of the economy will experience moderate employment growth.
95 Permian Basin Job Growth
96 Permian Basin Jobs: 2012 and Growth (1000s)
97 Rural Capital Jobs: 2012 and Growth Strong employment growth for The four largest employment sectors of the Rural Capital will experience strong employment growth (10,000 jobs) during the period: Health Care, Retail, Accommodation and Food, and Education. Job losses will be confined essentially to Manufacturing, Construction and Administration and Waste (a loss of 3,000 jobs). The other sectors of the economy will experience moderate employment growth.
98 Rural Capital Job Growth
99 Rural Capital Jobs: 2012 and Growth (1000s)
100 South Plains Jobs: 2012 and Growth Moderate employment growth for Three of the five largest employment sectors of the South Plains will experience employment growth (3,400 jobs) during the period: Health Care, Accommodation and Food, and Education. Job losses will be confined essentially to Manufacturing, Construction and Retail (a loss of 1,500 jobs). The other sectors of the economy will experience moderate employment growth.
101 South Plains Job Growth
102 South Plains Jobs: 2012 and Growth (1000s)
103 Upper Rio Grande Jobs: 2012 and Growth Moderate employment growth for The top three employment sectors of the Upper Rio Grande region will experience employment growth (6,500 jobs) during the period: Health Care, Retail, and Accommodation and Food. Job losses will be confined essentially to Manufacturing, Construction and Administration and Waste (a loss of 2,500 jobs). Another 3,500 jobs will be created in Pubic Administration, Transportation, Education, and Professional.
104 Upper Rio Grande Job Growth
105 Upper Rio Grande Jobs: 2012 and Growth (1000s)
106 West Central Jobs: 2012 and Growth Stable employment for The top four employment sectors of the West Central region will experience employment growth (3,500 jobs) during the period: Education, Health Care, Retail, and Accommodation and Food. Significant job losses will be confined essentially to Manufacturing, Construction and Administration and Waste (a loss of 1,700 jobs). On balance the other sectors of the economy will generate a small net drop in jobs.
107 West Central Job Growth
108 West Central Jobs: 2012 and Growth (1000s)
109 Appendix: NAIC Industry Definitions
110 NAIC Industry Definitions: Accommodation and Food The Accommodation and Food Services sector comprises establishments providing customers with lodging and/or preparing meals, snacks, and beverages for immediate consumption. The sector includes both accommodation and food services establishments because the two activities are often combined at the same establishment.
111 NAIC Industry Definitions: Administration and Waste The Administrative and Support and Waste Management and Remediation Services sector comprises establishments performing routine support activities for the day-to-day operations of other organizations. These essential activities are often undertaken in-house by establishments in many sectors of the economy. The establishments in this sector specialize in one or more of these support activities and provide these services to clients in a variety of industries and, in some cases, to households. Activities performed include: office administration, hiring and placing of personnel, document preparation and similar clerical services, solicitation, collection, security and surveillance services, cleaning, and waste disposal services.
112 NAIC Industry Definitions: Arts The Arts, Entertainment, and Recreation sector includes a wide range of establishments that operate facilities or provide services to meet varied cultural, entertainment, and recreational interests of their patrons. This sector comprises (1) establishments that are involved in producing, promoting, or participating in live performances, events, or exhibits intended for public viewing; (2) establishments that preserve and exhibit objects and sites of historical, cultural, or educational interest; and (3) establishments that operate facilities or provide services that enable patrons to participate in recreational activities or pursue amusement, hobby, and leisure-time interests.
113 NAIC Industry Definitions: Construction The construction sector comprises establishments primarily engaged in the construction of buildings or engineering projects (e.g., highways and utility systems). Establishments primarily engaged in the preparation of sites for new construction and establishments primarily engaged in subdividing land for sale as building sites also are included in this sector.
114 NAIC Industry Definitions: Education The Educational Services sector comprises establishments that provide instruction and training in a wide variety of subjects. This instruction and training is provided by specialized establishments, such as schools, colleges, universities, and training centers. These establishments may be privately owned and operated for profit or not for profit, or they may be publicly owned and operated. They may also offer food and/or accommodation services to their students.
115 NAIC Industry Definitions: Finance The Finance and Insurance sector comprises establishments primarily engaged in financial transactions (transactions involving the creation, liquidation, or change in ownership of financial assets) and/or in facilitating financial transactions. Three principal types of activities are identified: 1. Raising funds by taking deposits and/or issuing securities and, in the process, incurring liabilities. Establishments engaged in this activity use raised funds to acquire financial assets by making loans and/or purchasing securities. Putting themselves at risk, they channel funds from lenders to borrowers and transform or repackage the funds with respect to maturity, scale, and risk. This activity is known as financial intermediation.
116 NAIC Industry Definitions: Finance (continued) 2. Pooling of risk by underwriting insurance and annuities. Establishments engaged in this activity collect fees, insurance premiums, or annuity considerations; build up reserves; invest those reserves; and make contractual payments. Fees are based on the expected incidence of the insured risk and the expected return on investment. 3. Providing specialized services facilitating or supporting financial intermediation, insurance, and employee benefit programs.
117 NAIC Industry Definitions: Health Care The Health Care and Social Assistance sector comprises establishments providing health care and social assistance for individuals. The sector includes both health care and social assistance because it is sometimes difficult to distinguish between the boundaries of these two activities. The industries in this sector are arranged on a continuum starting with those establishments providing medical care exclusively, continuing with those providing health care and social assistance, and finally finishing with those providing only social assistance. The services provided by establishments in this sector are delivered by trained professionals. All industries in the sector share this commonality of process, namely, labor inputs of health practitioners or social workers with the requisite expertise. Many of the industries in the sector are defined based on the educational degree held by the practitioners included in the industry.
118 NAIC Industry Definitions: Information The Information sector comprises establishments engaged in the following processes: (a) producing and distributing information and cultural products, (b) providing the means to transmit or distribute these products as well as data or communications, and (c) processing data.
119 NAIC Industry Definitions: Management Enterprise The Management of Companies and Enterprises sector comprises (1) establishments that hold the securities of (or other equity interests in) companies and enterprises for the purpose of owning a controlling interest or influencing management decisions or (2) establishments (except government establishments) that administer, oversee, and manage establishments of the company or enterprise and that normally undertake the strategic or organizational planning and decisionmaking role of the company or enterprise. Establishments that administer, oversee, and manage may hold the securities of the company or enterprise.
120 NAIC Industry Definitions: Manufacturing Establishments in the Manufacturing sector are often described as plants, factories, or mills and characteristically use power-driven machines and materials-handling equipment. However, establishments that transform materials or substances into new products by hand or in the workers home and those engaged in selling to the general public products made on the same premises from which they are sold, such as bakeries, candy stores, and custom tailors, may also be included in this sector. Manufacturing establishments may process materials or may contract with other establishments to process their materials for them. Both types of establishments are included in manufacturing.
121 NAIC Industry Definitions: Mining The Mining, Quarrying, and Oil and Gas Extraction sector distinguishes two basic activities: mine operation and mining support activities. Mine operation includes establishments operating mines, quarries, or oil and gas wells on their own account or for others on a contract or fee basis. Mining support activities include establishments that perform exploration (except geophysical surveying) and/or other mining services on a contract or fee basis (except mine site preparation and construction of oil/gas pipelines).
122 NAIC Industry Definitions: Other Services The Other Services (except Public Administration) sector comprises establishments engaged in providing services not specifically provided for elsewhere in the classification system. Establishments in this sector are primarily engaged in activities, such as equipment and machinery repairing, promoting or administering religious activities, grant making, advocacy, and providing dry-cleaning and laundry services, personal care services, death care services, pet care services, photofinishing services, temporary parking services, and dating services.
123 NAIC Industry Definitions: Professionals The Professional, Scientific, and Technical Services sector comprises establishments that specialize in performing professional, scientific, and technical activities for others. These activities require a high degree of expertise and training. The establishments in this sector specialize according to expertise and provide these services to clients in a variety of industries and, in some cases, to households. Activities performed include: legal advice and representation; accounting, bookkeeping, and payroll services; architectural, engineering, and specialized design services; computer services; consulting services; research services; advertising services; photographic services; translation and interpretation services; veterinary services; and other professional, scientific, and technical
124 NAIC Industry Definitions: Public Administration The Public Administration sector consists of establishments of federal, state, and local government agencies that administer, oversee, and manage public programs and have executive, legislative, or judicial authority over other institutions within a given area. These agencies also set policy, create laws, adjudicate civil and criminal legal cases, provide for public safety and for national defense. In general, government establishments in the Public Administration sector oversee governmental programs and activities that are not performed by private establishments. Establishments in this sector typically are engaged in the organization and financing of the production of public goods and services, most of which are provided for free or at prices that are not economically significant.
125 NAIC Industry Definitions: Real Estate The Real Estate and Rental and Leasing sector comprises establishments primarily engaged in renting, leasing, or otherwise allowing the use of tangible or intangible assets, and establishments providing related services. The major portion of this sector comprises establishments that rent, lease, or otherwise allow the use of their own assets by others. The assets may be tangible, as is the case of real estate and equipment, or intangible, as is the case with patents and trademarks.
126 NAIC Industry Definitions: Retail The Retail Trade sector comprises establishments engaged in retailing merchandise, generally without transformation, and rendering services incidental to the sale of merchandise. The retailing process is the final step in the distribution of merchandise; retailers are, therefore, organized to sell merchandise in small quantities to the general public.
127 NAIC Industry Definitions: Transportation The Transportation and Warehousing sector includes industries providing transportation of passengers and cargo, warehousing and storage for goods, scenic and sightseeing transportation, and support activities related to modes of transportation. Establishments in these industries use transportation equipment or transportation related facilities as a productive asset. The type of equipment depends on the mode of transportation. The modes of transportation are air, rail, water, road, and pipeline.
128 NAIC Industry Definitions: Unclassified This code, not part of the official NAICS, is used in the Statistics of U.S. Businesses to designate those establishments were NAICS classification information is not available
129 NAIC Industry Definitions: Utilities The Utilities sector comprises establishments engaged in the provision of the following utility services: electric power, natural gas, steam supply, water supply, and sewage removal. Within this sector, the specific activities associated with the utility services provided vary by utility: electric power includes generation, transmission, and distribution; natural gas includes distribution; steam supply includes provision and/or distribution; water supply includes treatment and distribution; and sewage removal includes collection, treatment, and disposal of waste through sewer systems and sewage treatment facilities.
130 NAIC Industry Definitions: Wholesale The Wholesale Trade sector comprises establishments engaged in wholesaling merchandise, generally without transformation, and rendering services incidental to the sale of merchandise. The merchandise described in this sector includes the outputs of agriculture, mining, manufacturing, and certain information industries, such as publishing. The wholesaling process is an intermediate step in the distribution of merchandise. Wholesalers are organized to sell or arrange the purchase or sale of (a) goods for resale (i.e., goods sold to other wholesalers or retailers), (b) capital or durable nonconsumer goods, and (c) raw and intermediate materials and supplies used in production.
ARROYO VERDUGO OPERATIONAL IMPROVEMENTS
 ARROYO VERDUGO OPERATIONAL IMPROVEMENTS Project Description The Los Angeles County Metropolitan Transportation Authority (Metro) plans highway operational improvements in the Arroyo Verdugo subregion in
DOMINGUEZ OIL FIELD REDEVELOPMENT: EXPLORATION AND PRODUCTION ECONOMIC IMPACT ANALYSIS. Los Angeles County Economic Development Corporation
 DOMINGUEZ OIL FIELD REDEVELOPMENT: EXPLORATION AND PRODUCTION ECONOMIC IMPACT ANALYSIS Los Angeles County Economic Development Corporation 2011 Los Angeles County Economic Development Corporation This
Sault Ste. Marie Economic Development Corporation
 DRAFT: FEB. 22, 2016 Sault Ste. Marie Economic Development Corporation An Analysis of Sault Ste. Marie GDP / Employment by Sector 1 29 TABLE OF CONTENTS I. Key Notes to Reader and Definitions II. Introduction
Nevada Imposes a New Commerce Tax on Businesses
 July 2015 SALT WATCH Nevada Imposes a New Commerce Tax on Businesses Nevada imposes a new commerce tax on businesses with Nevada gross revenue exceeding $4 million and creates nexus rebuttable presumptions
Project RIO: Exit Cohort
 AUTOMATED FOLLOW-UP SYSTEM 2010 Report Project RIO: 2006-2007 Exit Cohort Hiwot Berhane and Jesse Sampson Contact: jesse.sampson@twc.state.tx.us Re-Integration of Offenders: Project RIO Project RIO is
Overview of the Standard Occupational Classification and Coding Structure
 Overview of the Standard Occupational Classification and Coding Structure The occupations in the SOC (Standard Occupational Classification system) are classified at four levels of aggregation to suit the
Funding Distribution Amounts for the Smallest LWDA. AEL Professional
 Summary of FY 2019/PY 2018 Planning Estimates (1) Planning Estimates Associated Funds Distributed Additional with Planning Estimates Federal Workforce Innovation and Opportunity Act (WIOA) Planning Estimates
SNAP Employment & Training: Exit Cohort Five-Year Longitudinal Study
 AUTOMATED FOLLOW-UP SYSTEM 2010 Report SNAP Employment & Training: 2004-2005 Exit Cohort Five-Year Longitudinal Study Hiwot Berhane and Jesse Sampson Contact: jesse.sampson@twc.state.tx.us SNAP Employment
HOUSTON-THE WOODLANDS-SUGAR LAND METROPOLITAN STATISTICAL AREA (H-W-S MSA) Visit our website at
 Visit our website at") Labor Market Information DECEMBER 2015 Employment Data HOUSTON-THE WOODLANDS-SUGAR LAND METROPOLITAN STATISTICAL AREA () Visit our website at www.wrksolutions.com The Houston-The Woodlands-Sugar Land Metropolitan
Labor Market Information DECEMBER 2015 Employment Data HOUSTON-THE WOODLANDS-SUGAR LAND METROPOLITAN STATISTICAL AREA () Visit our website at www.wrksolutions.com The Houston-The Woodlands-Sugar Land Metropolitan
Services sector: slow start to 2019 as sales drop
 January 2019 Media Contact: Tony Melville, Australian Industry Group. 0419 190 347 Services sector: slow start to 2019 as sales drop The Australian Industry Group Australian Performance of Services Index
Services activity bounces in November
 November 2018 Media Contact: Tony Melville, Australian Industry Group. 0419 190 347 Services activity bounces in November The Australian Industry Group Australian Performance of Services Index (Australian
Services sector slows down as year ends
 December 2018 Media Contact: Tony Melville, Australian Industry Group. 0419 190 347 Services sector slows down as year ends The Australian Industry Group Australian Performance of Services Index (Australian
Kansas Department of Revenue Office of Policy and Research State Sales Tax Collections by NAICS
 January-10 February-10 March-10 April-10 111 Crop Production $ 26,331.97 $ 26,393.05 $ 69,200.44 $ 281,670.88 112 Animal Production $ 6,594.84 $ 6,705.43 $ 17,973.29 $ 8,190.77 114 Fishing, Hunting and
Nonemployer Statistics An Indicator of Virginia s Gig Economy
 Nonemployer Statistics An Indicator of Virginia s Gig Economy By Ann Lang, Senior Economist Ann.Lang@vec.virginia.gov Author s Note: This article attempts to provide an indication of Virginia s gig economy
SOUTHBOROUGH EMPLOYMENT REPORT
 2014 MERC PUBLICATION SOUTHBOROUGH EMPLOYMENT REPORT By Maureen Dunne, M.B.A. With assistance of MERC interns: Kristen Hoffman, Intern III Thierry Aka, Intern II Prepared for Southborough Economic Development
REGIONAL ECONOMIC OUTLOOK
 REGIONAL ECONOMIC OUTLOOK Industry Analysis Long-term trends Projected Growth NKY/Cincinnati specifics Education Degrees Conferred Projected Growth Degree and Workforce projections Long-term Trends -
MARYLAND DEPARTMENT OF LABOR, LICENSING AND REGULATION Office of Workforce Information and Performance 1100 North Eutaw Street Baltimore, MD 21201
 AND PAYROLLS "Check Out Our Web Site: www.dllr.state.md.us/lmi/index.htm" MARYLAND DEPARTMENT LABOR, LICENSING AND REGULATION Office of Workforce Information and Performance 1100 North Eutaw Street Baltimore,
FRIENDSWOOD PLANNING & ZONING COMMISSION AGENDA ITEM FORM
 Staff FRIENDSWOOD PLANNING & ZONING COMMISSION AGENDA ITEM FORM Subject: Review of the Permitted Use Table Current Ordinance/Requirement: Appendix C - Zoning Ordinance Section 7. Schedule of District Regulations
Yukon Bureau of Statistics
 Yukon Bureau of Statistics 9 # $ > 0 - + 6 & ± 8 < 3 π 7 5 9 ^ Highlights: Gross Domestic Product (GDP) by Industry at Basic Prices 0 Yukon s real GDP for 0 was $,8.5 million (in chained (007) dollars);
Yukon Bureau of Statistics
 Yukon Bureau of Statistics 9 # $ > 0 - + 6 & ± 8 < π 7 5 9 ^ Highlights: Gross Domestic Product (GDP) by Industry at Basic Prices 0 Yukon s real GDP for 0 was $,08.7 million (in chained (007) dollars);
Veterans in Texas: A Demographic Study
 s in Texas: A Demographic Study Texas Workforce Investment Council December 2012 The Mission of the Texas Workforce Investment Council Assisting the Governor and the Legislature with strategic planning
Workforce Investment Act: Exiters Five-year Longitudinal Study
 AUTOMATED FOLLOW-UP SYSTEM 2010 Report Workforce Investment Act: 2004-2005 Exiters Five-year Longitudinal Study Hiwot Berhane and Jesse Sampson Contact: jesse.sampson@twc.state.tx.us Texas Workforce Solutions
Report on Ward 3. Prepared by the Burlington Economic Development Corporation
 Report on Ward 3 Prepared by the Burlington Economic Development Corporation Contents 1. Business Composition Data... 1 2. Labour Force Data... 3 3. Consumer Spending Data... 5 4. Demographic Data... 6
Sole Proprietorship Returns, 2004
 by Kevin Pierce and Michael Parisi F or Tax Year 2004, there were approximately 20.6 million individual income tax returns that reported nonfarm sole proprietorship activity. Nearly every sole proprietor
Metropolitan Chicago Region Overview of the Economy
 June 2013 Overview of the Economy This report is issued by The Workforce Boards of Metropolitan Chicago (WBMC) for the purpose of sharing economic and workforce development information for the metropolitan
June 9, Economic Overview Billings, MT MSA
 June 9, 2016 Economic Overview Billings, MT MSA DEMOGRAPHIC PROFILE... 3 EMPLOYMENT TRENDS... 5 UNEMPLOYMENT RATE... 5 WAGE TRENDS... 6 COST OF LIVING INDEX... 6 INDUSTRY SNAPSHOT... 7 OCCUPATION SNAPSHOT...
Kansas Department of Revenue Office of Policy and Research State Sales Tax Collections by NAICS Calendar Year 2007 January-07.
 January-07 February-07 March-07 April-07 11 Agriculture, Forestry, Fishing and Hunting 111 Crop Production $ 112 Animal Production $ 114 Fishing, Hunting and Trapping $ 115 Agriculture and Forestry Support
GROSS DOMESTIC PRODUCT, THIRD QUARTER OF 2018 (PRELIMINARY DATA)
") GROSS DOMESTIC PRODUCT, THIRD QUARTER OF 2018 (PRELIMINARY DATA) In the third quarter of 2018 Gross Domestic Product (GDP) 1 at current prices amounts to 29 822 million BGN. In Euro terms GDP is 15 248
GROSS DOMESTIC PRODUCT, THIRD QUARTER OF 2018 (PRELIMINARY DATA) In the third quarter of 2018 Gross Domestic Product (GDP) 1 at current prices amounts to 29 822 million BGN. In Euro terms GDP is 15 248
Workforce Investment Act: Exiters Three-year Longitudinal Study
 AUTOMATED FOLLOW-UP SYSTEM 2010 Report Workforce Investment Act: 2006-2007 Exiters Three-year Longitudinal Study Hiwot Berhane and Jesse Sampson Contact: jesse.sampson@twc.state.tx.us Texas Workforce Solutions
Industry Employment Projections. Overview of Employment Growth. Ashley Leach, Economist. 1 Projected Employment Growth by Substate Area
 2016-2026 Industry Employment Projections Ashley Leach, Economist The New Mexico Department of Workforce Solutions (NMDWS) Economic Research and Analysis Bureau (ER&A) produces long-term industry and occupational
Economic Overview Long Island
 Report created on October 20, 2015 Economic Overview Long Island Created using: Contact: Lisa.Montiel@suny.edu DEMOGRAPHIC PROFILE...3 EMPLOYMENT TRENDS...5 UNEMPLOYMENT RATE...5 WAGE TRENDS...6 COST OF
Oregon s Payroll Employment Dropped by 6,400 in February While the Unemployment Rate Held Steady at 8.8 Percent
 FOR IMMEDIATE RELEASE: March 20, 2012 PRESS CONFERENCE PRESENTER: Nick Beleiciks, State Employment Economist CONTACT INFORMATION: David Cooke, Economist (503) 947 1272 Oregon s Payroll Employment Dropped
Yukon Bureau of Statistics
 Yukon Bureau of Statistics 9 # $ > 0 - + 6 & ± 8 < 3 π 7 5 9 ^ Yukon GDP by Industry 008 Total Yukon GDP by Industry, 008... $,44,600,000 Growth Rate from 007 to 008...4.3% The Gross Domestic Product of
Economic Benefits of the Proposed Casa Diablo Geothermal Power Plant, Wahlstrom & Associates 2012
 Appendix G Comment Letters ATTACHMENT G2 Economic Benefits of the Proposed Casa Diablo Geothermal Power Plant, Wahlstrom & Associates 2012 This exhibit contains an economic benefit report provided by the
2016 Labor Market Profile
 2016 Labor Market Profile Prepared by The Tyler Economic Development Council Tyler Area Sponsor June 2016 The ability to demonstrate a regions availability of talented workers has become a vital tool
The Economic Impact of Short-Term Rentals In the State of Texas 2018 Update
 The Economic Impact of Short-Term Rentals In the State of Texas 2018 Update Prepared by TXP, Inc. 1310 South 1st Street, Suite 105 Austin, Texas 78704 (512) 328-8300 www.txp.com Overview The popularity
SPECIAL RELEASE Annual Survey of Philippine Business and Industry (Total Employment of 20 and Over- Final Results) National Capital Region
 National Capital Region") Number: 2015-04 Date Released: June 15, 2015 REPUBLIC OF THE PHILIPPINES PHILIPPINE STATISTICS AUTHORITY NATIONAL CAPITAL REGION SPECIAL RELEASE 2010 Annual Survey of Philippine Business and Industry (
Number: 2015-04 Date Released: June 15, 2015 REPUBLIC OF THE PHILIPPINES PHILIPPINE STATISTICS AUTHORITY NATIONAL CAPITAL REGION SPECIAL RELEASE 2010 Annual Survey of Philippine Business and Industry (
EMPLOYEE TENURE IN 2014
 For release 10:00 a.m. (EDT) Thursday, September 18, 2014 USDL-14-1714 Technical information: (202) 691-6378 cpsinfo@bls.gov www.bls.gov/cps Media contact: (202) 691-5902 PressOffice@bls.gov EMPLOYEE TENURE
GROSS DOMESTIC PRODUCT, FIRST QUARTER OF 2018 (PRELIMINARY DATA)
") GROSS DOMESTIC PRODUCT, FIRST QUARTER OF 2018 (PRELIMINARY DATA) In the first quarter of 2018 Gross Domestic Product (GDP) 1 at current prices amounts to 21 479 million BGN. In Euro terms GDP is 10 982
GROSS DOMESTIC PRODUCT, FIRST QUARTER OF 2018 (PRELIMINARY DATA) In the first quarter of 2018 Gross Domestic Product (GDP) 1 at current prices amounts to 21 479 million BGN. In Euro terms GDP is 10 982
2015 Marquette County
 2015 Marquette County Economic Data Booklet LAKE SUPERIOR COMMUNITY PARTNERSHIP Business Development Department July 2016 The Lake Superior Community Partnership is the Marquette County region s leading
GROSS DOMESTIC PRODUCT FOR THE FIRST QUARTER OF 2014 (PRELIMINARY DATA)
") GROSS DOMESTIC PRODUCT FOR THE FIRST QUARTER OF 2014 (PRELIMINARY DATA) In the first quarter of 2014 GDP at current prices amounts to 16 097 Million Levs. In Euro terms GDP is 8 230 Million Euro or 1 136
GROSS DOMESTIC PRODUCT FOR THE FIRST QUARTER OF 2014 (PRELIMINARY DATA) In the first quarter of 2014 GDP at current prices amounts to 16 097 Million Levs. In Euro terms GDP is 8 230 Million Euro or 1 136
Economic Overview New York
 Report created on October 20, 2015 Economic Overview Created using: Contact: Lisa.Montiel@suny.edu DEMOGRAPHIC PROFILE...3 EMPLOYMENT TRENDS...5 UNEMPLOYMENT RATE...5 WAGE TRENDS...6 COST OF LIVING INDEX...6
GROSS DOMESTIC PRODUCT, SECOND QUARTER OF 2014 (PRELIMINARY DATA)
") GROSS DOMESTIC PRODUCT, SECOND QUARTER OF 2014 (PRELIMINARY DATA) In the second quarter of 2014 GDP at current prices amounts to 19 517 million BGN. In Euro terms GDP is 9 979 million Euro or 1 379 euro
GROSS DOMESTIC PRODUCT, SECOND QUARTER OF 2014 (PRELIMINARY DATA) In the second quarter of 2014 GDP at current prices amounts to 19 517 million BGN. In Euro terms GDP is 9 979 million Euro or 1 379 euro
Employment Situation: Ohio and U.S. (Seasonally Adjusted) 20,000 15,000 10,000 5,000 -5,000. In This Issue
 20,000 15,000 10,000 5,000 -5,000. In This Issue") Civilian Labor Force Ohio s unemployment rate was 4.8 percent in November 217, down from 5.1 percent in October 217. The number of unemployed in Ohio in November was 279,, down 17, from 296, in October.
Civilian Labor Force Ohio s unemployment rate was 4.8 percent in November 217, down from 5.1 percent in October 217. The number of unemployed in Ohio in November was 279,, down 17, from 296, in October.
Economic Overview Mohawk Valley
 Report created on August 29, 2017 Economic Overview Mohawk Valley Contact: Lisa.Montiel@suny.edu DEMOGRAPHIC PROFILE... 3 EMPLOYMENT TRENDS... 5 UNEMPLOYMENT RATE... 5 WAGE TRENDS... 6 COST OF LIVING INDEX...
Trade Adjustment Assistance: Exit Cohort Study
 AUTOMATED FOLLOW-UP SYSTEM 2010 Report Trade Adjustment Assistance: 2008-2009 Exit Cohort Study Hiwot Berhane and Jesse Sampson Contact: jesse.sampson@twc.state.tx.us TAA is a program to afford time for
South Baldwin County, Alabama (Gulf Shores, Orange Beach, Bon Secour, Elberta, and Foley) Are You Diversified?
 Are You Diversified?") South Baldwin County, Alabama (Gulf Shores, Orange Beach, Bon Secour, Elberta, and Foley) Are You Diversified? By: Henry B. Burdg Director, Auburn Technical Assistance Center (ATAC), Auburn University
South Baldwin County, Alabama (Gulf Shores, Orange Beach, Bon Secour, Elberta, and Foley) Are You Diversified? By: Henry B. Burdg Director, Auburn Technical Assistance Center (ATAC), Auburn University
Oregon s Unemployment Rate Was Unchanged at 8.4 Percent in February, as Payroll Employment Grew by 6,800. Millions
 NEWS 875 Union Street NE Salem, Oregon 97311 PH: 503.947.1394 TTY-TDD 711 www.qualityinfo.org FOR IMMEDIATE RELEASE: March 19, 2013 PRESS CONFERENCE PRESENTER: Nick Beleiciks, State Employment Economist
NMI at 60.3% Business Activity Index at 64.9% New Orders Index at 63.8% Employment Index at 59.6%
 FOR RELEASE: 10:00 A.M. ET August 5, 2015 Contact: Kristina Cahill Report On Business Analyst ISM, ROB/Research Tempe, Arizona 800/888-6276, Ext. 3015 E-mail: kcahill@instituteforsupplymanagement.org DO
Year Projection
 LABOR FORCE CHARACTERISTICS Civilian Labor Force 2007 2008 2009 2010 2011 2012 2013 Q1 Unemployment Rate (for month & year use most recent information available and seasonally adjusted annual average 3.8
2016 Marquette County
 2016 Marquette County Economic Data Booklet LAKE SUPERIOR COMMUNITY PARTNERSHIP Business Development Department July 2017 The Lake Superior Community Partnership is the Marquette County region s leading
Economic Overview City of Tyler, TX. January 8, 2018
 Economic Overview City of Tyler, TX January 8, 2018 DEMOGRAPHIC PROFILE...3 EMPLOYMENT TRENDS...5 WAGE TRENDS...5 COST OF LIVING INDEX...6 INDUSTRY SNAPSHOT...7 OCCUPATION SNAPSHOT...9 INDUSTRY CLUSTERS...
GROSS DOMESTIC PRODUCT, SECOND QUARTER OF 2017 (PRELIMINARY DATA)
") GROSS DOMESTIC PRODUCT, SECOND QUARTER OF 2017 (PRELIMINARY DATA) In the second quarter of 2017 Gross Domestic Product (GDP) 1 at current prices amounts to 24 149 million BGN. In Euro terms GDP is 12 347
GROSS DOMESTIC PRODUCT, SECOND QUARTER OF 2017 (PRELIMINARY DATA) In the second quarter of 2017 Gross Domestic Product (GDP) 1 at current prices amounts to 24 149 million BGN. In Euro terms GDP is 12 347
Washington State Employment Security Department Labor Market and Economic Analysis Branch. Released: March Washington State Employment Security
 Washington State Employment Security Department Labor Market and Economic Analysis Branch Released: Washington State Employment Security 2003 Employee Benefits Survey Released: Prepared by Carolyn Cummins,
Economic Overview Long Island
 Report created on August 29, 2017 Economic Overview Long Island Contact: Lisa.Montiel@suny.edu DEMOGRAPHIC PROFILE... 3 EMPLOYMENT TRENDS... 5 UNEMPLOYMENT RATE... 5 WAGE TRENDS... 6 COST OF LIVING INDEX...
2015 A Record Year for Indiana Tourism. Methodology, Metrics and Evaluation
 2015 A Record Year for Indiana Tourism Methodology, Metrics and Evaluation Table of Contents 2015 Indiana Tourism Highlights Background & Methodology 2014 2015 Indiana Tourism Performance 2015 Tourism
Special Feature Service Sector
 Special Feature Service Sector D iscussions of economic performance tend to focus primarily on the goods sector. This is because output of the goods sector is tangible and more easily measured. Despite
Economic Overview Western New York
 Report created on August 29, 2017 Economic Overview Western New Contact: Lisa.Montiel@suny.edu DEMOGRAPHIC PROFILE... 3 EMPLOYMENT TRENDS... 5 UNEMPLOYMENT RATE... 5 WAGE TRENDS... 6 COST OF LIVING INDEX...
Oregon s Unemployment Rate Was Essentially Unchanged at 8.4 Percent in January, as Payroll Employment Grew by 4,200. Millions
 NEWS 875 Union Street NE Salem, Oregon 97311 PH: 503.947.1394 TTY-TDD 711 www.qualityinfo.org FOR IMMEDIATE RELEASE: March 5, 2013 PRESS CONFERENCE PRESENTER: Nick Beleiciks, State Employment Economist
GROSS DOMESTIC PRODUCT, FIRST QUARTER OF 2017 (PRELIMINARY DATA)
") GROSS DOMESTIC PRODUCT, FIRST QUARTER OF 2017 (PRELIMINARY DATA) In the first quarter of 2017 GDP at current prices amounts to 20 066 million BGN. In Euro terms GDP is 10 260 million Euro or 1 445 euro
GROSS DOMESTIC PRODUCT, FIRST QUARTER OF 2017 (PRELIMINARY DATA) In the first quarter of 2017 GDP at current prices amounts to 20 066 million BGN. In Euro terms GDP is 10 260 million Euro or 1 445 euro
Impact of Riverboat Gambling on the Business Climate in Lake County, Indiana
 Impact of Riverboat Gambling on the Business Climate in Lake County, Indiana Authors: Seth B. Payton Laura Littlepage Center for Urban Policy and the Environment Indiana University-Purdue University Indianapolis
Nevada Closes Out 2017 on a Strong Note; Unemployment Down Throughout the State
 DECEMBER SUB-STATE PRESS RELEASE January 23 rd, 2018 Nevada Closes Out 2017 on a Strong Note; Unemployment Down Throughout the State Statement from Bill Anderson, Chief Economist, Department of Employment,
State of California January 22, 2010 EMPLOYMENT DEVELOPMENT DEPARTMENT S. Bascom Ave. (408) Campbell, CA 95008
 Campbell, CA 95008") State of California EMPLOYMENT DEVELOPMENT DEPARTMENT Contact: Janice Shriver 2450 S. Bascom Ave. (408) 558-0689 Campbell, CA 95008 OAKLAND-FREMONT-HAYWARD METROPOLITAN DIVISION (MD) (ALAMEDA AND CONTRA
State of California EMPLOYMENT DEVELOPMENT DEPARTMENT Contact: Janice Shriver 2450 S. Bascom Ave. (408) 558-0689 Campbell, CA 95008 OAKLAND-FREMONT-HAYWARD METROPOLITAN DIVISION (MD) (ALAMEDA AND CONTRA
An Economy at Risk: Our Vulnerable Coast and Its Importance to the Texas Economy December 2006
 An Economy at Risk: Our Vulnerable Coast and Its Importance to the Texas Economy December 2006 A study commissioned by IIAT Executive Summary Independent Insurance Agents of Texas (IIAT) commissioned the
Economic Overview Fairfax / Falls Church. October 23, 2017
 Economic Overview Fairfax / Falls Church October 23, 2017 DEMOGRAPHIC PROFILE... 3 EMPLOYMENT TRENDS... 5 UNEMPLOYMENT RATE... 5 WAGE TRENDS... 6 COST OF LIVING INDEX... 6 INDUSTRY SNAPSHOT... 7 OCCUPATION
The Economic Impact Of Travel on Massachusetts Counties 2015
 The Economic Impact Of Travel on Massachusetts Counties 2015 A Study Prepared for the Massachusetts Office of Travel and Tourism By the Research Department of the U.S. Travel Association Washington, D.C.
Economic Overview 45-Minute Commute From Airport Park. June 6, 2017
 Economic Overview 45-Minute Commute From Airport Park June 6, 2017 DEMOGRAPHIC PROFILE... 3 EMPLOYMENT TRENDS... 5 WAGE TRENDS... 5 COST OF LIVING INDEX... 6 INDUSTRY SNAPSHOT... 7 OCCUPATION SNAPSHOT...
ECONOMIC OVERVIEW DuPage County, Illinois
 ECONOMIC OVERVIEW DuPage County, Illinois DEMOGRAPHIC PROFILE... 3 EMPLOYMENT TRENDS... 5 UNEMPLOYMENT RATE... 5 WAGE TRENDS... 6 COST OF LIVING INDEX... 7 INDUSTRY SNAPSHOT... 8 OCCUPATION SNAPSHOT...
Economic Overview Capital District
 August 29, 2017 Economic Overview Capital District Contact: Lisa.Montiel@suny.edu DEMOGRAPHIC PROFILE... 3 EMPLOYMENT TRENDS... 5 UNEMPLOYMENT RATE... 5 WAGE TRENDS... 6 COST OF LIVING INDEX... 6 INDUSTRY
Economic Overview Prince William/Manassas. October 23, 2017
 Economic Overview Prince William/Manassas October 23, 2017 DEMOGRAPHIC PROFILE... 3 EMPLOYMENT TRENDS... 5 UNEMPLOYMENT RATE... 5 WAGE TRENDS... 6 COST OF LIVING INDEX... 6 INDUSTRY SNAPSHOT... 7 OCCUPATION
DEMOGRAPHIC PROFILE...3 EMPLOYMENT TRENDS...5 UNEMPLOYMENT RATE...5 WAGE TRENDS...6 COST OF LIVING INDEX...6 INDUSTRY SNAPSHOT...7
 March 14, 2017 DEMOGRAPHIC PROFILE...3 EMPLOYMENT TRENDS...5 UNEMPLOYMENT RATE...5 WAGE TRENDS...6 COST OF LIVING INDEX...6 INDUSTRY SNAPSHOT...7 OCCUPATION SNAPSHOT...9 INDUSTRY CLUSTERS... 12 EDUCATION
Economic Overview Monterey County, California. July 22, 2016
 Economic Overview Monterey July 22, 2016 DEMOGRAPHIC PROFILE... 3 EMPLOYMENT TRENDS... 5 UNEMPLOYMENT RATE... 5 WAGE TRENDS... 6 COST OF LIVING INDEX... 6 INDUSTRY SNAPSHOT... 7 OCCUPATION SNAPSHOT...
Nevada Commerce Tax Narrative. Prepared by Commerce Tax Division
 Nevada Commerce Tax Narrative Prepared by Commerce Tax Division Commerce Tax Highlights Annual tax on business entities engaged in business in Nevada Each business entity engaged in business in Nevada
Highlands and Islands Enterprise. Location Profile Keith December 2011
 Highlands and Islands Enterprise Location Profile Keith December 2011 Mickledore Ltd. Unit 2 Chapel House Barn Pillmoss Lane Lower Whitley Cheshire WA4 4DW Tel: 01925 837679 Tel: 07747 085400 Email: contact@regionaldevelopment.co.uk
Minnesota Energy Industry
 Energy Industry Jobs Q3 2000 Q3 2001 Q3 2002 Q3 2003 Q3 2004 Q3 2005 Q3 2006 Q3 2007 Q3 2008 Q3 2009 Q3 2010 Q3 2011 Q3 Q3 Q3 Q3 Q3 2016 Minnesota Energy Consortium April 13, 2017 Cameron Macht DEED Labor
Alaska s Non-Petroleum Corporate Income Tax. Trends in Collections by Sector and Revised Corporate Income Tax Forecast Model
 Alaska s Non-Petroleum Corporate Income Tax Trends in Collections by Sector and Revised Corporate Income Tax Forecast Model Prepared for 2007 FTA Revenue Estimation Conference September 2007 Dan Stickel,
A Labor Market Information Publication FOURTH QUARTER 2002
 A Labor Market Information Publication FOURTH QUARTER THE IOWA LABOR MARKET IN : AN ELUSIVE RECOVERY IN GENERAL, ECONOMIC CONDITIONS SHOWED SOME IMPROVEMENT IN, but the recovery that was expected to take
January 2014 Non-Manufacturing ISM Report On Business
 FOR RELEASE: February 5, 2014 Contact: Kristina Cahill Report On Business Analyst ISM, ROB Media Relations Tempe, Arizona 800/888-6276, Ext. 3015 E-mail: kcahill@ism.ws January 2014 Non-Manufacturing ISM
APPENDIX I Employer Sample Frame
 APPENDIX I Employer Sample Frame Table AI-1: Geopolitical Units (/City) Within Sample Regions 1 7 Region 1 Region 2 Region 3 Region 4 Region 5 Region 6 Region 7 Southeast Southwest East Central West Central
Economic Overview Loudoun County, Virginia. October 23, 2017
 Economic Overview October 23, 2017 DEMOGRAPHIC PROFILE... 3 EMPLOYMENT TRENDS... 5 UNEMPLOYMENT RATE... 5 WAGE TRENDS... 6 COST OF LIVING INDEX... 6 INDUSTRY SNAPSHOT... 7 OCCUPATION SNAPSHOT... 9 INDUSTRY
GROSS DOMESTIC PRODUCT FOR THE THIRD QUARTER OF 2013
 GROSS DOMESTIC PRODUCT FOR THE THIRD QUARTER OF 2013 In the third quarter of 2013 GDP at current prices amounts to 21 590 million BGN. In Euro terms GDP is 11 039 million euro or 1 519 euro per person.
October 28, Economic Overview Yellowstone County, Montana
 October 28, 2016 Economic Overview Yellowstone DEMOGRAPHIC PROFILE...3 EMPLOYMENT TRENDS...5 UNEMPLOYMENT RATE...5 WAGE TRENDS...6 COST OF LIVING INDEX...6 INDUSTRY SNAPSHOT...7 OCCUPATION SNAPSHOT...9
Richmond Community Schools
 2017 Study Prepared by: Carl H. Baxmeyer, AICP, REFP Senior Planner Wightman & Associates, Inc. 2303 Pipestone Road Benton Harbor, MI 49022 cbaxmeyer@wightman-assoc.com Phone: (269) 487-9699 [direct]
CEDS Economic Base Analysis. Franklin County
 CEDS Economic Base Analysis for Franklin County August 26, 2014 Prepared By: 120 West Ave, Suite 303 Saratoga Springs, NY 12866 518.899.2608 Table of Contents Executive Summary... 1 Introduction... 3 Demographic
Michigan Economic Development Corporation
 Michigan Economic Development Corporation 300 N. Washington Square, Lower Level Lansing, Michigan 48913 888.522.0103 Economy Overview MEDC Region 2 Northwest Michigan Economic Modeling Specialists International
GROSS DOMESTIC PRODUCT FOR THE THIRD QUARTER OF 2012
 GROSS DOMESTIC PRODUCT FOR THE THIRD QUARTER OF 2012 In the third quarter of 2012 GDP at current prices amounted to 21 734 Million Levs. In Euro terms GDP was 11 112 Million Euro or 1 522 Euro per person.
Employment Situation: Ohio and U.S. (Seasonally Adjusted) 25,000 20,000 15,000 10,000 5,000. In This Issue
 25,000 20,000 15,000 10,000 5,000. In This Issue") Civilian Labor Force Ohio s unemployment rate was 4.5 percent in June 218, up from 4.3 percent in May. The number of unemployed in Ohio in June was 259,, up 9, from 25, in May. The number of unemployed
Civilian Labor Force Ohio s unemployment rate was 4.5 percent in June 218, up from 4.3 percent in May. The number of unemployed in Ohio in June was 259,, up 9, from 25, in May. The number of unemployed
Michigan Economic Development Corporation
 Michigan Economic Development Corporation 300 N. Washington Square, Lower Level Lansing, Michigan 48913 888.522.0103 Economy Overview MEDC Region 5 East Central Michigan Economic Modeling Specialists International
Economic Overview Marlboro County Labor Shed. June 29, 2016
 Economic Overview Marlboro County Labor June 29, 2016 DEMOGRAPHIC PROFILE...3 EMPLOYMENT TRENDS...5 UNEMPLOYMENT RATE...5 WAGE TRENDS...6 COST OF LIVING INDEX...6 INDUSTRY SNAPSHOT...7 OCCUPATION SNAPSHOT...9
Economic Overview York County, South Carolina. February 14, 2018
 Economic Overview York County, February 14, 2018 DEMOGRAPHIC PROFILE... 3 EMPLOYMENT TRENDS... 5 UNEMPLOYMENT RATE... 5 WAGE TRENDS... 6 COST OF LIVING INDEX... 6 INDUSTRY SNAPSHOT... 7 OCCUPATION SNAPSHOT...
Economic Overview Plant City Region. April 5, 2017
 Economic Overview Plant City Region April 5, 2017 DEMOGRAPHIC PROFILE... 3 EMPLOYMENT TRENDS... 5 WAGE TRENDS... 5 COST OF LIVING INDEX... 6 INDUSTRY SNAPSHOT... 7 OCCUPATION SNAPSHOT... 9 INDUSTRY CLUSTERS...
GROSS DOMESTIC PRODUCT, THIRD QUARTER OF 2015 (PRELIMINARY DATA)
") GROSS DOMESTC PRODUCT, THRD QUARTER OF 2015 (PRELMNARY DATA) GDP at current prices is 23 490 million BGN in the third quarter of 2015. n Euro terms GDP is 12 010 million Euro or 1 671 euro per capita.
GROSS DOMESTC PRODUCT, THRD QUARTER OF 2015 (PRELMNARY DATA) GDP at current prices is 23 490 million BGN in the third quarter of 2015. n Euro terms GDP is 12 010 million Euro or 1 671 euro per capita.
40) Other financial intermediation n.e.c. (PKD Z), 41) Activities auxiliary to financial intermediation n.e.c. (PKD
 Other financial intermediation n.e.c. (PKD Z), 41) Activities auxiliary to financial intermediation n.e.c. (PKD") As required under Art. 402.2 of the Commercial Companies Code and in connection with item 14 of the agenda, the Company s Management Board publishes the existing and proposed wording of selected provisions
As required under Art. 402.2 of the Commercial Companies Code and in connection with item 14 of the agenda, the Company s Management Board publishes the existing and proposed wording of selected provisions
Alberta led all Provinces in Economic Growth in 2014
 ECONOMIC COMMENTARY Alberta led all Provinces in Economic Growth in 2014 December 9, 2015 Highlights: Alberta led all provinces in economic growth in 2014 as Alberta s real gross domestic product rose
An Economic Impact Analysis of a Proposed Downtown Centre for the City of Moncton
 An Economic Impact Analysis of a Proposed Downtown Centre for the City of Moncton May 2013 Pierre-Marcel Desjardins, Economist Ce document est disponible en français EXECUTIVE SUMMARY The present report
Chart 1 Development of real GDP by quarters (year-on-year growth in %)
") A T E C 1 14 12 1 8 4 2-2 -4 I -9-12 -15 8/29B volume 17, Development of the real economy in the first quarter of 29 Viera Kollárová, Helena Solčánska Národná banka Slovenska The indicators of Slovakia
A T E C 1 14 12 1 8 4 2-2 -4 I -9-12 -15 8/29B volume 17, Development of the real economy in the first quarter of 29 Viera Kollárová, Helena Solčánska Národná banka Slovenska The indicators of Slovakia
THE GRAND AVENUE PLAN: AN ECONOMIC IMPACT ANALYSIS FINAL REPORT ECONOMIC AND POLICY ANALYSIS GROUP Los Angeles County Economic Development Corporation
 THE GRAND AVENUE PLAN: AN ECONOMIC IMPACT ANALYSIS FINAL REPORT ECONOMIC AND POLICY ANALYSIS GROUP Los Angeles County Economic Development Corporation Los Angeles County Economic Development Corporation
Delaware Annual Economic Report 2008
 Delaware Annual Economic Report 2008 written by George Sharpley, Ph.D. Labor Market Economist Office of Occupational and Labor Market Information Delaware Department of Labor 30 June 2009 2 Delaware Annual
Nevada County Population Projections 2010 to 2030 October 2010
 Nevada County Projections 2010 to 2030 October 2010 Prepared By: The Nevada State Demographer s Office Jeff Hardcastle, AICP NV State Demographer University of NV Reno MS/032 Reno, NV 89557 (775) 784-6353
Sears Tower 233 S Wacker Dr. Nielsen Business-Facts
 PCensus for MapInfo Page 1 PCensus for MapInfo Page -1 Table of Contents... 1 Businesses by Major Sectors... 2 Businesses by 3-digit... 4 2015 Business Summary - Occupation... 7 Retail Business Summary...