4 5 Disclosures about market risk. 36 Group organizational structure. 39 Key transactions and events in Recent developments
|
|
|
- Benjamin Parsons
- 6 years ago
- Views:
Transcription

1
2
3 Table of Contents Management report Company overview Business overview 4 5 Disclosures about market risk 36 Group organizational structure 39 Key transactions and events in Recent developments 43 Corporate governance 44 Luxembourg takeover law disclosure 80 Additional information 82 Chief executive officer and chief financial officer s responsibility statement 85 Consolidated financial statements for the year ended December 31, Consolidated statements of operations 87 Consolidated statements of other comprehensive income 88 Consolidated statements of financial position 89 Consolidated statements of changes in equity 90 Consolidated statements of cash flows 91 Notes to the consolidated financial statements 93 Report of the réviseur d entreprises agréé - consolidated financial statements 197 Annual report of ArcelorMittal parent company for the year ended December 31, Management report 203 Chief executive officer and chief financial officer s responsibility statement 204 Financial statements of ArcelorMittal parent company for the year ended December 31, Statements of financial position 206 Statements of operations 207 Statements of other comprehensive income 207 Statements of changes in equity 208 Statements of cash flows 209 Notes to the financial statements 210 Report of the réviseur d entreprises agréé financial statements 253 Risks related to the global economy and the mining and steel industry 258 Mining 276
4 4 Management report Company overview History and development of the Company ArcelorMittal is the world s leading integrated steel and mining company. Since the creation of ArcelorMittal in 2006 (through the combination of Mittal Steel Company N.V. and Arcelor) and continuing through 2008, ArcelorMittal has pursued a disciplined growth strategy, with transactions in Argentina, Australia, Austria, Brazil, Canada, Costa Rica, China, Estonia, France, Germany, Italy, Mexico, Poland, Russia, Slovakia, South Africa, Sweden, Turkey, the United Kingdom, Uruguay, United Arab Emirates, the United States and Venezuela. Beginning in the latter part of 2008, ArcelorMittal largely suspended mergers and acquisitions activity in light of the deteriorating economic and market environment, and sharply curtailed its investment activities, with the exception of the acquisition (along with a partner) of Baffinland in Since September 2011, ArcelorMittal has been undergoing a deleveraging process to reduce its indebtedness including numerous divestments of non-core assets (see note 2.3 to the consolidated financial statements for the divestments made in 2015 and 2016). Despite ArcelorMittal s overall strategy of deleveraging, the Company completed an acquisition through a 50/50 joint venture partnership of Calvert in In 2017, the Company continued to take some strategic investment initiatives, including the signing of a purchase agreement for Votorantim S.A.'s long business and of a lease and obligation to purchase agreement with the Italian Government for Ilva S.p.A. ArcelorMittal's success is built on its core values of sustainability, quality and leadership and the entrepreneurial boldness that has empowered its emergence as the first truly global steel and mining company. Acknowledging that a combination of structural issues and macroeconomic conditions will continue to challenge returns in its sector, the Company has adapted its footprint to the new demand realities, redoubled its efforts to control costs and repositioned its operations with a view toward outperforming its competitors. ArcelorMittal s research and development capability is strong and includes several major research centers as well as strong academic partnerships with universities and other scientific bodies. Against this backdrop, ArcelorMittal's strategy is to leverage four distinctive attributes that will enable it to capture leading positions in the most attractive areas of the steel industry s value chain, from mining at one end to distribution and firststage processing at the other: global scale and scope; superior technical capabilities; a diverse portfolio of steel and related businesses, one of which is mining; and financial capabilities. Geography: ArcelorMittal is the largest steel producer in the Americas, Africa and Europe and is the fifth largest steel producer in the CIS region. ArcelorMittal has steel-making operations in 18 countries on four continents, including 47 integrated and mini-mill steel-making facilities. As of December 31, 2017, ArcelorMittal had approximately 197,000 employees. ArcelorMittal s steel-making operations have a high degree of geographic diversification. Approximately 37% of its crude steel is produced in the Americas, approximately 46% is produced in Europe and approximately 16% is produced in other countries, such as Kazakhstan, South Africa and Ukraine. In addition, ArcelorMittal s sales of steel products are spread over both developed and developing markets, which have different consumption characteristics. ArcelorMittal s mining operations, present in North and South America, Africa, Europe and the CIS region, are integrated with its global steel-making facilities and are important producers of iron ore and coal in their own right. Products: ArcelorMittal produces a broad range of highquality finished and semi-finished steel products ( semis ). Specifically, ArcelorMittal produces flat steel products, including sheet and plate, and long steel products, including bars, rods and structural shapes. In addition, ArcelorMittal produces pipes and tubes for various applications. ArcelorMittal sells its steel products primarily in local markets and through its centralized marketing organization to a diverse range of customers in approximately 160 countries including the automotive, appliance, engineering, construction and machinery industries. The Company also produces various types of mining products including iron ore lump, fines, concentrate and sinter feed, as well as coking, PCI and thermal coal. As a global steel producer, the Company is able to meet the needs of different markets. Steel consumption and product requirements clearly differ between developed markets and developing markets. Steel consumption in developed economies is weighted towards flat products and a higher value-added mix, while developing markets utilize a higher proportion of long products and commodity grades. To meet these diverse needs, the Company maintains a high degree of product diversification and seeks opportunities to increase the proportion of higher value-added products in its product mix. Automotive focus: ArcelorMittal has a leading market share in its core markets in the automotive steel business and is a leader in the fast-growing advanced high strength steels segment. ArcelorMittal is the first steel company in the world to embed its own engineers within an automotive customer to provide engineering support. The Company begins working with original equipment manufacturers ( OEMs ) as early as five years before a vehicle reaches the showroom, to provide generic steel solutions, co-engineering and help with the industrialization of the project. In November 2016, ArcelorMittal introduced a new generation of advanced high strength steels, including new press hardenable steels and
5 Management report martensitic steels. Together, these new steel grades aim to help automakers further reduce body-in-white weight to improve fuel economy without compromising vehicle safety or performance. In November 2017, ArcelorMittal launched the second generation of its icare electrical steels. icare steel grades play a central role in the construction of electric motors. Mining Value Chain: ArcelorMittal has a significant portfolio of raw material and mining assets, as well as certain strategic long-term contracts with external suppliers. In 2017, approximately 50% of ArcelorMittal s iron-ore requirements and approximately 13% of its PCI and coal requirements were supplied from its own mines. The Company currently has iron ore mining activities in Brazil, Bosnia, Canada, Kazakhstan, Liberia, Mexico, Ukraine and the United States. The Company currently has coal mining activities in Kazakhstan and the United States. In addition, ArcelorMittal produces substantial amounts of direct reduced iron, or DRI, which is a scrap substitute used in its mini-mill facilities to supplement external metallics purchases. ArcelorMittal is also a significant producer of coke, which is produced from metallurgical coal and is a critical raw material for steel-making, satisfying 94% of its coke needs through its own production facilities. ArcelorMittal s facilities have good access to shipping facilities, including through ArcelorMittal s own 16 deepwater port facilities and linked railway sidings. ArcelorMittal has its own downstream steel distribution business, primarily run through its Europe segment. It also provides value-added and customized steel solutions through additional processing activities to meet specific customer requirements. Cautionary statement regarding forward-looking statements This annual report and the documents incorporated by reference in this annual report contain forward-looking statements based on estimates and assumptions. This annual report contains forward-looking statements within the meaning of the Private Securities Litigation Reform Act of Forward-looking statements include, among other things, statements concerning the business, future financial condition, results of operations and prospects of ArcelorMittal, including its subsidiaries. These statements usually contain the words believes, plans, expects, anticipates, intends, estimates or other similar expressions. For each of these statements, you should be aware that forward-looking statements involve known and unknown risks and uncertainties. Although it is believed that the expectations reflected in these forward-looking statements are reasonable, there is no assurance that the actual results or developments anticipated will be realized or, even if realized, that they will have the expected effects 5 on the business, financial condition, results of operations or prospects of ArcelorMittal. These forward-looking statements speak only as of the date on which the statements were made, and no obligation has been undertaken to publicly update or revise any forwardlooking statements made in this annual report or elsewhere as a result of new information, future events or otherwise, except as required by applicable laws and regulations. A detailed discussion of principal risks and uncertainties which may cause actual results and events to differ materially from such forward-looking statements is included in the section titled Risk related to the global economy and the mining and steel industry. The Company undertakes no obligation to update or revise publicly any forward-looking statements whether because of new information, future events, or otherwise, except as required by securities and other applicable laws. Corporate and other information ArcelorMittal is a public limited liability company (société anonyme) that was incorporated for an unlimited period under the laws of the Grand Duchy of Luxembourg on June 8, ArcelorMittal is registered at the R.C.S. Luxembourg under number B The mailing address and telephone number of ArcelorMittal s registered office are: ArcelorMittal 24-26, Boulevard d Avranches L-1160 Luxembourg Grand Duchy of Luxembourg Telephone: ArcelorMittal s agent for U.S. federal securities law purposes is: ArcelorMittal USA LLC 1 South Dearborn Street, 19th floor Chicago, Illinois United States of America Telephone: Internet site ArcelorMittal maintains an Internet site at Information contained on or otherwise accessible through this Internet site is not a part of this annual report. All references in this annual report to this Internet site are inactive textual references to this URL and are for information only. Business overview The following discussion and analysis should be read in conjunction with ArcelorMittal s consolidated financial
6 6 Management report statements and related notes for the year ended December 31, 2017 included in this annual report. Key factors affecting results of operations The steel industry, and the iron ore and coal mining industries, which provide its principal raw materials, have historically been highly cyclical. They are significantly affected by general economic conditions, consumption trends as well as by worldwide production capacity and fluctuations in international steel trade and tariffs. In particular, this is due to the cyclical nature of the automotive, construction, machinery and equipment and transportation industries that are the principal consumers of steel. A telling example of the industry cyclicality was the sharp downturn in 2008/2009, after several strong years, as a result of the global economic crisis. Weakness in North American and European markets has a significant impact on ArcelorMittal s results, with these markets together accounting for over 60% of ArcelorMittal's deliveries in The onset of the eurozone crisis caused underlying European steel demand to weaken in 2012 and, coupled with significant destocking, apparent steel demand fell by over 10%. Since then, deliveries have increased in each of the past five years, but 2017 demand remains around 20% below 2007 peak levels. Imports into the European Union ( EU ) have also risen more strongly than demand, growing over 85% over the past five years, meaning domestic European deliveries have hardly grown, impacting the ability of ArcelorMittal to serve one of its largest markets. Underlying steel demand in North America increased strongly post-crisis, but apparent demand has been impacted by inventory movements, with high inventory levels resulting in stockists purchasing over six million fewer tonnes in 2015, as compared to 2014, as they sought to reduce inventory levels as steel prices declined. Although underlying steel demand continued to rise in 2015, apparent demand declined significantly, negatively impacting the Company s deliveries and profitability. Apparent demand in the United States declined further in 2016 as inventories continued to decrease and demand for Oil and Country Tubular Goods ( OCTG ) was still very weak. The situation began to improve during the fourth quarter of 2016 and in 2017, with apparent steel demand growing year-on-year and with prices recovering. Apparent steel demand grew over 6% in 2017, due mainly to growth in pipes and tubes, demand for which was up over 80% year-on-year compared to only 2% growth in flat and a slight decline in longs. Demand dynamics in China have also substantially affected the global steel business. After growing strongly since 2000, Chinese steel demand started to decline in 2015 because of weaker real estate sector construction and machinery production. This decline in domestic demand led to a surge in Chinese steel exports, which more than doubled between 2012 and 2015, increasing by over 56 million tonnes to 112 million tonnes in This increase in Chinese exports was greater than the growth in world ex-china steel demand over the same period, and had the effect of curtailing domestic production in countries outside of China. Although Chinese exports continued to rise during the first half of 2016, up 10% year-on-year, a rebound in domestic demand and the beginning of a capacity reduction plan in China led to a decline in exports, which declined by 14% year-on-year in the second half of 2016 and by 3% for the year as whole. While most exports were directed to Asia, and exports to the U.S. were reduced due to the impact of anti-dumping trade cases, a declining but still significant proportion were being directed toward ArcelorMittal s core European markets in In particular, Chinese exports in 2015 were being sold at prices below cost (CISA reported CISA mills losing an accumulated RMB 65 billion ($10 billion) in 2015), negatively impacting prices and therefore margins in many regions. Chinese producers continued to accumulate losses until April 2016 when domestic and export prices rose sharply as domestic demand surprised producers on the upside, increasing capacity utilization. During the second half of 2016, demand continued to support higher capacity utilization and an improved domestic spread of steel prices over raw material costs, which translated into higher export prices. The increased utilization trend continued in 2017, with demand increasing around 3.5% year-on-year and with significant induction furnace capacity eliminated, supporting higher spread of steel prices over raw material costs and lower Chinese exports. Unlike many commodities, steel is not completely fungible due to wide differences in its shape, chemical composition, quality, specifications and application, all of which affect sales prices. Accordingly, there is still limited exchange trading and uniform pricing of steel, whereas there is increasing trading of steel raw materials, particularly iron ore. Commodity spot prices can vary, which causes sale prices from exports to fluctuate as a function of the worldwide balance of supply and demand at the time sales are made. ArcelorMittal s sales are made based on shorter-term purchase orders as well as some longer-term contracts to certain industrial customers, particularly in the automotive industry. Steel price surcharges are often implemented on steel sold pursuant to long-term contracts to recover increases in input costs. However, spot market steel, iron ore and coal prices and short-term contracts are more driven by market conditions. One of the principal factors affecting the Company s operating profitability is the relationship between raw material prices and steel selling prices. Profitability depends in part on the extent to which steel selling prices exceed raw material prices, and specifically the extent to which changes in raw material prices are passed through to customers in steel selling prices. Complicating factors include the extent of the time lag between (a) the raw material price change and the steel selling price change and (b) the date of the
7 Management report raw material purchase and of the actual sale of the steel product in which the raw material was used (average cost basis). In recent periods, steel selling prices have tended to react quickly to changes in raw material prices, due in part to the tendency of distributors to increase purchases of steel products early in a rising cycle of raw material prices and to hold back from purchasing as raw material prices decline. With respect to (b), as average cost basis is used to determine the cost of the raw materials incorporated, inventories must first be worked through before a decrease in raw material prices translates into decreased operating costs. In some of ArcelorMittal s segments, in particular Europe and NAFTA, there are several months between raw material purchases and sales of steel products incorporating those materials. Although this lag has been reduced recently by changes to the timing of pricing adjustments in iron ore contracts, it cannot be eliminated and exposes these segments margins to changes in steel selling prices in the interim (known as a price-cost squeeze ). In addition, decreases in steel prices may outstrip decreases in raw material costs in absolute terms, as has occurred numerous times over the past few years, for example in the second quarter of 2013 and fourth quarters of 2015 and The Company s operating profitability has been particularly sensitive to fluctuations in raw material prices, which have become more volatile since the iron ore industry moved away from annual benchmark pricing to quarterly pricing in Volatility on steel margins aside, the results of the Company s mining segment (which sells externally as well as internally) are also directly impacted by iron ore prices, which decreased significantly in 2015, ending the year at $40/t and averaging only $56/t. Iron ore prices rebounded from $40/t during December 2015 to an average of $52/t in the first half of 2016, increasing to an average of $64/t during the second half of the year. The upward trend continued into the first quarter of 2017 with average of $86, and then fluctuated between $60-70/t during most of the rest of the year, leading to an annual average of $71/t. The price has picked up again at the end of 2017 and continued into January with approximately $76/t as the monthly average, supported by a strong seasonal restocking and high utilization of Chinese steel mills. If iron ore prices were to decline from current levels due (among other things) to weaker global demand and in particular Chinese demand and steel mill utilization rates, this would negatively impact ArcelorMittal s revenues and profitability. Economic environment[1] Global GDP growth is estimated to have picked up to 3% in 2017, the best year since 2011 and up from 2.4% in 2016 and 2.5% in The upturn is broad-based, with growth increasing in more than half of the world s economies. Three quarters of the acceleration in global growth was driven by a rebound in global investment growth, which was aided by increasing profits, improved business sentiment and favorable financing costs. 7 [1] GDP and industrial production data and estimates sourced from Oxford Economics January 17, Growth in the United States had slowed markedly in 2016, to 1.5%, from 2.6% in 2015, held back by weak exports, a continued drawdown in inventories, and a deceleration in private investment. Growth in the United States accelerated in 2017 to an estimated 2.3%, supported by private investment. The recovery reflected increasing profits, a weakening dollar, robust external demand and a diminished drag from capacity adjustments in the energy sector. Despite headlines from the major hurricane landfalls in September 2017, actual economic activity disruption was limited. Private consumption continued to grow at a robust pace despite modest real income gains and moderate wage growth, as the personal savings rate fell further. Households income expectations continued to recover following a prolonged period of weakness. With diminishing labor market slack and the economy moving closer to full employment, the U.S. Federal Reserve continued to normalize monetary policy in 2017 despite inflation running below target. Notably on the U.S. administration s policy, while corporate and personal income tax cuts were successfully legislated at the end of 2017, other policy initiatives in the areas of health care and infrastructure have made limited progress and the outcome of renegotiations of the North American Free Trade Agreement (NAFTA) remains uncertain. Growth in the United States had slowed markedly in 2016, to 1.5%, from 2.6% in 2015, held back by weak exports, a continued drawdown in inventories, and a deceleration in private investment. The EU GDP growth slowed from 2.1% in 2015 to 1.8% in 2016, as both domestic demand and exports lost momentum. Growth in the eurozone gained substantial momentum in 2017, reaching an estimated 2.4%. The improvements in the eurozone were broad-based and seen across most member countries. They were helped by policy stimulus and strengthening global demand. Private sector credit continued to respond to the loose monetary policy of the European Central Bank, with both domestic demand and import registering robust growth. Overall, the unemployment rate reached its lowest level since 2009, and labor shortages became increasingly prevalent in some countries. However, wage growth remained subdued and inflation continued to stay below the ECB s target. Growth in China is estimated to have increased to 6.9% in 2017 from 6.7% in 2016 and 6.9% in 2015, when growth had decelerated compared to 7.3% in This is the first pick-up in growth since 2010 and was driven by stronger net external trade. Domestically, investment growth slowed in 2017 but consumption remained robust. Domestic rebalancing continued in 2017, with drivers of activity shifting away from state-led investment. China s trade flows recovered markedly in 2017, partly reflecting strengthening foreign demand and increasing commodity imports amid
8 8 Management report tightly enforced production cuts. Consumer price inflation increased steadily throughout the year but remained below target, while producer price inflation was stable, supporting a recovery of industrial profits. House price growth continued to slow, reflecting tighter regulations in larger cities. Despite further monetary and regulatory tightening in 2017, the total stock of non-financial sector debt, at about 260% of GDP, continued to expand on a year-on-year basis. On the external side, foreign exchange reserves recovered in 2017, aided by a moderation of net capital outflows even as the current account surplus continued to narrow. The renminbi reversed some of its previous nominal appreciation in the second half of the year following the removal of reserve requirements for foreign currency trading. The year of 2017 was notable for both Brazil and Russia as they emerged from recession. Growth in Brazil rebounded to an estimated 1.1% in 2017 following two years of contraction, reflecting a recovery of domestic demand supported by easier monetary conditions and improved confidence. In Russia, activity in 2017 was stronger than previously expected, with growth reaching an estimated 1.9% compared to -0.2% in 2016, in response to higher oil prices, banking sector support, targeted fiscal stimulus, and reduced external imbalances amid exchange rate flexibility. Global industrial production (IP) growth reached 3.7% in 2017 up from 1.5% in IP in Organization for Economic Co-operation and Development ( OECD ) countries accelerated to 2.6% in 2017 compared to 0.3% in Global apparent steel consumption ( ASC ) grew robustly in 2017 for the first time since 2014, compared to growth of just over 1% in 2016 and a decline of 2.4% year-on-year in Growth in 2017 reflected increases in demand in China and developed markets, and there were rebounds in some large emerging markets, notably Brazil and Russia, from declines in 2016 and Overall, 2017 global ASC is estimated to have grown over 3% as Chinese demand was stronger than anticipated, growing approximately 3.5%, supported by the strength of machinery output and a better than expected real estate market. Elsewhere, world-exchina ASC grew around 2.7% year-on-year, as growth returned to NAFTA (5%), CIS (4%) and Latin America (5%) after declining in Almost all regions grew, albeit more slowly including the EU (almost 2%), developed Asia (1%) and Middle East (1.5%). The U.S. had a rebound in growth in 2017, up 6% year-on-year, but this was almost entirely due to more than 60% growth in pipe and tube demand. Demand in world ex-china improved throughout 2017, with ASC growth under 1% year-on-year during the first half of the year increasing to an estimated 4% year-on-year during the second half of billion tonnes as output fell in every major steel producing market, except India. World ex-china growth which had fallen by 3.6% year-on-year in 2015, rose by 0.4% in 2016 due to higher output from developing countries such as India (+7.2% year-on-year), Ukraine (+5.4%) and Turkey (+5.2%), partially offset by lower output from South America (-8.4%), EU28 (-2.5%) and developed Asia (-0.6%). According to the World Steel Association, production in China, the world s largest steel producer, declined in 2016 by 2.1% to under 0.8 billion tonnes. However, World Steel Association figures do not include a significant production at induction furnaces and the Company believes Chinese steel production grew, supported by increasing domestic demand helped by government stimulus and an improvement in the real estate market. Global crude steel output picked-up significantly in 2017 to a record 1.69 billion tonnes, up 5.4% from This reflects accelerating growth, from 4.6% year-on-year in the first half of 2017 to 5.9% year-on-year in the second half of 2017, in line with a strengthening global economy and rising momentum in trade. Solid production growth throughout the year was supported by higher output in the largest steel producing countries (China, U.S. and EU28), while Turkey, Canada, Brazil all recorded double-digit growth of over 10% year-on-year. U.S. output exemplified the global pattern of a stronger second half of 2017, growing 6.6% year-on-year compared to 1.6% year-on-year in the first half of On the other hand, European steel production rose consistently by around 4% through the year on the back of strong domestic growth across EU28, bringing production to million tonnes, a three-year high after declines of 1.9% in 2015 and 2.5% in Elsewhere, Turkish steel production rose 13.1% year-on-year to a record 37.5 million tonnes continuing a recovery since falling to a low of 31.5 million tonnes in Indian production rose a further 6.2% in 2017 to a record 101 million tonnes. Even developed Asia (Japan, South Korea and Taiwan) output rose 5% year-onyear in 2017, to over 199 million tonnes, the highest since The only region to experience no growth year-on-year was the CIS, which held flat at 102 thousand tonnes in 2017 compared to This was because Ukrainian steel production declined by 6.2% in the year primarily due to the impact of a raw materials blockade, offsetting minor annual production growth of 1.3% in Russia and 3.8% in Kazakhstan. Overall, world ex-china production growth accelerated to 6% year-on-year in second half of 2017 as it continued its rebound from a record low of 760 thousand tonnes in 2015, ultimately ending 2017 up 5% year-on-year at 860 thousand tonnes. Steel production[2] After reaching a peak of over 1.67 billion tonnes in 2014, world crude steel production declined by 3% in 2015 to 1.62 [2] Annual Global production data is for all 95 countries for which production data is published by the World steel. The first and second half of 2017 data includes only countries (67 in total but accounting for around 99% of global steel production) where data is
9 Management report collected monthly and excludes countries for which data is collected annually According to World Steel, Chinese steel output rose over 5.7% year-on-year in 2017, mainly in response to rising domestic demand as opposed to exports, which fell by 31% year-on-year. However, these numbers do not include significant production from induction furnaces that was not recorded officially in Induction furnaces were closed in 2017 and production has been switched to mills that fully disclose production. Crude steel production is estimated to be broadly stable year-on-year, when this induction furnace production is considered. Steel prices Flat products Steel prices for flat products in Europe were relatively stable during the first quarter of 2015 compared to 2014 fourth quarter averages, despite continuous erosion of raw material costs. A balanced market, low interest rates and steady demand for durables, coupled with the weak euro, helped improve the steel market in the first quarter of In Northern Europe as well as in Southern Europe, the price for hot rolled coil ( HRC ) improved slightly during the first quarter of Economic conditions remained good in Europe during the second quarter of 2015, with strong bookings in industry and auto; however, steel prices weakened consistently during the second quarter of 2015 due mainly to pressure from imports. Aggressive domestic offers at the beginning of the third quarter of 2015, coupled with low-priced imports from Turkey, Russia and China, kept prices in Europe under pressure, and HRC spot prices dropped approximately 27/t quarter-on-quarter in Northern Europe and 37/t in Southern Europe. Eurozone consumer confidence dropped to a nine-month low in October 2015, while the gap in the offer price for steel in Northern Europe compared to Southern Europe continued to feed expectations for price declines. HRC spot prices further weakened during the fourth quarter of 2015 in both Northern Europe and Southern Europe. Steel prices for flat products in Europe improved during the first quarter of 2016 compared to December 2015 levels. In Northern Europe, the price for HRC improved in the first quarter of 2016, with a similar trend in Southern Europe. The second quarter of 2016 saw a sharp increase in international steel prices, led by China, driving an average increase of approximately 84/t quarter-on-quarter in the North and 97/t in the South. The average HRC prices for the first half of 2016 were at 371/t in Northern Europe and 351/t in Southern Europe compared to the first half of 2015, in which average HRC prices were 405/t in the North and 394/t in the South. Steel prices continued to increase in the third quarter and fourth quarter of Steel prices for flat products in Europe were stable in Southern Europe and on a slight upward trend in Northern Europe during the first quarter of 2017 compared to December Prices of HRC increased in Northern Europe by 69/t quarter-on-quarter and in Southern Europe by 63/t quarter-on -quarter. Prices weakened in the second quarter of 2017 with an average price decline of 47/t in Europe. The average HRC prices for the first half of 2017 were at 545/t in Northern Europe and 513/t in Southern Europe compared to the first half of 2016 as described above. Prices bottomed out in July 2017, thus the downtrend reversed during August and September In the third quarter of 2017, spot HRC prices in Northern Europe remained 5/t below the second quarter 2017 average, and in Southern Europe there was an average increase of 9/t quarter-on-quarter. There was little fluctuation in prices in the fourth quarter of 2017, with a quarter-on-quarter improvement of 22/t in Northern Europe and 11/t in Southern Europe. HRC prices during the second half of 2017 increased 65/t in Northern Europe and 67/t in Southern Europe compared to the second half of In the United States, 2015 began with a positive economic outlook, with consumer confidence in February at its highest since 2007, despite negative sentiment in the oil and gas sector. The steel market was nevertheless challenging, with high inventories and buyers cautious in placing orders. The strong U.S. dollar continued to encourage imports during first quarter of 2015, with South Korea, Japan, Germany and Australia quickly taking over volumes upon the termination of the suspension agreement with Russia in December Domestic prices gave in, especially during February and March, following Scrap #1 Busheling drop from $369 per gross tonne ( /GT ) in January to $255/GT in March of The second quarter of 2015 started weak, with scrap price rollover into April and HRC bottoming at $ /t. Auto, appliances and construction had some momentum in May, allowing for price firmness. Scrap #1 Busheling gained $30 from April to June to an average of $266/GT for the second quarter of 2015, supporting HRC price improvement. Despite the consumer confidence index increasing by 10.5 points in August 2015 from 91.0 in July 2015, and steel consumption being sustained by strong sales in auto, prices started weakening again during the third quarter, especially lacking support from the declining Scrap #1 Busheling which decreased an average of $13/GT in the third quarter of 2015 and was as low as $229/GT in September Spot HRC prices thus fell. Demand for both scrap and finished steel during the fourth quarter remained slow and only for immediate sale, especially outside the auto sector. Thus, Scrap #1 Busheling trading levels dropped to $ /GT, pushing HRC spot price down approximately $70/t in average. In the United States, spot HRC prices increased during the first quarter of The second quarter of 2016 had a
10 10 Management report strong start and continued to strengthen for a quarter-onquarter improvement of approximately $184/t. The average HRC price for the first half of 2016 in the United States was $547/t as compared to an average of $541/t in the first half of The spot HRC prices in the United States started to decrease in July 2016 and continued this downward trend until October During the third quarter of 2016, the HRC price increased an average of $11/t quarter-on-quarter. The spot HRC prices in the United States reached a low at an average range of $ /t in October 2016, but then sharply increased toward the end of the year. In the fourth quarter of 2016, the spot HRC price in the United States decreased approximately $64/t quarter-on-quarter. The average spot HRC price in the second half of 2016 in the United States was $618/t compared to an average of $467/t in the second half of In the United States, spot HRC prices increased during the first quarter of 2017 by an average of $106/t quarter-onquarter. Price levels improved sharply during January, had stability during February and peaked at $725/t by end of March, to reach their highest average level since September During the second quarter of 2017, HRC spot prices decreased $11/t quarter-on-quarter, with progressive declines until the first week of June 2017, but were followed by a price pickup, sustained by declining inventories and improved international market sentiment. The average HRC price in the United States during the first half of 2017 was $688/t compared to the first half of 2016 at $547/t. The HRC spot price slightly improved in July and August, and stabilized towards end of the third quarter of 2017, increasing $4/t quarter-on-quarter. Slight declines were recorded during October, but prices picked up during November and December to reach $704/t by the end of The average prices during the fourth quarter of 2017 decreased $2/t quarter-on-quarter. Overall, in the second half of 2017 prices averaged at $686/t, representing a $68/t increase compared to the second half of In China, after its weakest annual growth in 24 years in 2014, 2015 started with uncertainty, due to a change in the export rebate policy as of January 1, 2015 (discouraging exports and adding more pressure on the domestic market), and the government s efforts to implement anti-pollution regulation, expected to significantly impact producers costs and capacity cuts. Despite the Central Bank s cut of the reserve requirement ratio by 0.5% to boost growth, the steel market activity remained depressed in the first quarter of 2015 and continued to be weak into the second quarter, especially entering the rainy season. Production was however sustained by exports surging again from March 2015 onward. Domestic prices continued an accelerated decline, with spot HRC down during the first and second quarters of Market sentiment stayed weak during the third quarter of 2015, with prices declining month by month. Demand continued to shrink in the fourth quarter of 2015, as the cold season approached and inventories were monitored to stay low. HRC domestic prices thus saw a drop in their quarterly average. In China, average spot HRC prices increased during the first quarter of 2016 compared to the fourth quarter of Beginning in March 2016, the imported 62% Fe iron ore price significantly increased, starting with an increase of approximately $10 per dry metric tonne unit ( /dmt ) occurring in one single day, after billet prices in Tangshan had surged by about $55/t. This increase then spread across other steel products, which improved by $40-50/t. The main drivers for these increases were linked to steel mills potentially bringing forward production ahead of enforced production cuts during Tangshan s scheduled hosting of an international horticultural exposition (from April 29 to October 16, 2016), and a strong rebound by the stock market following the central bank s announcement of a cut in the reserve requirement ratio by 0.5%. This resulted in a significant price increase, which reached a peak in China in April 2016, when the spot HRC price averaged $380/t, VAT excluded. Domestic prices declined in the last two months of the second quarter of 2016 although the quarterly average remained higher than the first quarter. The average spot HRC price for the first half of 2016 in China was $317/t, VAT excluded as compared to $344/t, VAT excluded in the first half of Spot HRC prices in China decreased $4/t quarter-on-quarter in the third quarter of Prices improved throughout the fourth quarter of 2016, reaching an average of $465/t, VAT excluded in December with an improvement of $74/t quarter-on-quarter. The average spot HRC price for the second half of 2016 in China was $385/t, VAT excluded compared to $260/t, VAT excluded in the second half of In China, spot HRC prices increased during the first quarter of 2017, compared to the average levels of the fourth quarter of 2016, fluctuating on an upward trend until the first part of February 2017, but deteriorating afterwards, in line with raw material basket cost decline. Domestic HRC prices increased during the first quarter of 2017 by an average of $35/t quarter-on-quarter. Prices continued to slide, hitting a bottom level of $374/t, VAT excluded by mid-may, followed however by a rapid recovery to $439/t, VAT excluded average in June, supported by a new upward trend in raw materials cost, positive market sentiment and local mill interest to ramp up production and maximize profits. HRC spot prices decreased in the second quarter of 2017 on average by $62/t quarter-on-quarter. In the first half 2017, HRC domestic prices in China averaged $427/t, VAT excluded, compared to $317/t, VAT excluded, during the first half of HRC spot prices in China continued their steady increase in the beginning of September and increased for the third quarter of 2017 by $113/t quarter-onquarter. The price increases slowed down during the fourth quarter of 2017 with an increase of $29/t quarter-on-quarter. HRC spot prices in China averaged $523/t, VAT excluded in
11 Management report the second half of 2017, an increase of $138/t, VAT excluded from the second half of The following table presents the spot HRC average price range per tonne in Northern and Southern Europe, the United States and China on a quarterly basis from 2015 to Flat products Northern Europe Southern Europe United States China Source: Steel Business Briefing (SBB) Spot HRC average price per tonne Spot HRC average price per tonne Spot HRC average price per tonne Spot HRC average price per tonne, VAT excluded Q $578 $359 Q $505 $328 Q $505 $268 Q $430 $251 Q $456 $282 Q $639 $353 Q $650 $348 Q $586 $423 Q $694 $458 Q $682 $396 Q $687 $509 Q $685 $538 Long products In Europe, there was good demand for long products in January and February 2015, and a slight increase in scrap price gave support for improvement on commodity pricing, despite pressure from Russia and Ukraine in Eastern Europe. Buyers were more hesitant towards the end of the first quarter of 2015 as the scrap price weakened. However, there was progressive improvement in medium sections prices from January to March (an increase of 7/t) Rebar prices, on the other hand, were impacted strongly by the scrap fluctuation, and declined by 10/t during the first quarter The European Central Bank s lending survey at the beginning of the second quarter of 2015 sustained a take-off for construction investments, thus solid demand continued. In addition, with scrap prices picking up, further price gains were achieved both for medium sections and rebar. Price trends reversed starting in the third quarter of 2015, as pressure on scrap from the international market resulted in a drop in the scrap E3 price, impacting commodity offers. The situation continued into the fourth quarter of 2015, when further scrap deterioration pushed medium sections and rebar prices down. During the first quarter of 2016, long steel products saw a quarter-on-quarter price decline in Europe for both medium sections and rebar. This downward trend reversed during the second quarter of The average medium sections 11 price for the first half of 2016 in Europe was 481/t compared to 521/t for the first half of The average rebar price in Europe for the first half of 2016 was 404/t compared to 420/t for the first half of Long steel product prices weakened again during the third quarter of 2016 for both medium sections and rebar. Prices reached a low in October 2016, and started recovering through year end, reaching an average of 511/t and 454/t in December 2016 for medium sections and rebar, respectively, although the quarterly average prices remained down quarter-onquarter. The average medium sections price in Europe for the second half of 2016 was 499/t compared to 498/t for the second half of The average rebar price in Europe for the second half of 2016 was 432/t compared to 389/t for the second half of Long steel product prices increased in Europe in the beginning of the first quarter of 2017, followed by a decline in mid-february, but with a recovery by the end of March. Prices then weakened during the second quarter of 2017 for both medium sections and rebars, but seemed to bottom out by the end of June with a quarter on quarter decline of 15/t and 22/t, respectively. The average price for medium sections in Europe during the first half of 2017 was 508/t compared to 481/t in the first half of The average rebar price in Europe during the first half of 2017 was 452/t compared to 404/t in the first half of Prices for long steel products were on a steady upward trend toward the end of the year. Medium sections prices increased 29/t quarter-on-quarter, while rebar prices increased 28/t quarter-on-quarter. During the fourth quarter of 2017, medium sections prices further increased 58/t quarter-onquarter, while rebar prices increased 84/t quarter-onquarter. Overall, during the second half of 2017 prices for long products were up 59/t for medium sections and 79/t for rebars compared to the second half of In 2015, scrap prices globally re-aligned following a year of anomalously high levels. Prices of scrap HMS 1&2 of USA origin imported into Turkey dropped substantially during the first two months of 2015 from $311/t CFR in January to $248/t CFR in February. This was followed by an unexpected price improvement starting in March 2015, on the back of tight supply, to a peak of $286/t in May Export prices for Turkish rebar fluctuated alongside scrap dropping from $493/t FOB in January 2015 to $436/t FOB in March 2015, and reversing to a peak of $454/t FOB in May The spread of Turkey FOB rebar prices over scrap declined by approximately $20/t during the period, partly compensated by the Turkish lira s depreciation. Turkish imported scrap had significant price declines during the third and the fourth quarters of 2015, as raw material costs continued to deteriorate and international price pressure increased. Scrap HMS 1&2 fell to as low as $204/t CFR Turkey by September and $180/t CFR Turkey in October, followed by a slight improvement towards the end of 2015 (to $188/t average in December). Lack of support from
12 12 Management report scrap, as well as weaker billet prices (due to severe Chinese competition), coupled with weak demand, impacted rebar prices, which dropped during the third quarter and even further in the fourth quarter of In Turkey, even though the average first quarter 2016 price of imported scrap HMS 1&2 at $194/t CFR showed a small improvement of about $6/t against the average of the fourth quarter 2015, the average price of March 2016 at $218/t CFR represented a month-on-month increase of about $40/ t. The Turkish rebar export price followed a similar trend. The March 2016 export price of Turkish rebar increased $44/t month-on-month. This upward trend continued during the first two months of the second quarter of 2016 with the export rebar price from Turkey reaching an average range of $ /t FOB in April, and $ /t FOB in May. In June 2016, rebar prices reduced to an average range of $ /t FOB Turkey. The average rebar export price from Turkey in the first half of 2016 was $388/t FOB compared to the first half of 2015, which was at $451/t FOB. The third quarter of 2016 average export price for Turkish rebar decreased followed by improvements in the fourth quarter. The average rebar export price for the second half of 2016 from Turkey was $394/t FOB as compared to $361/t FOB for the second half of In the first quarter of 2017, imported scrap HMS 1&2 in Turkey improved by $18/t compared to the fourth quarter of 2016 average of $275/t CFR. Rebar export prices followed closely the evolution of Turkey imported Scrap HMS 1&2, declining in the beginning of 2017 from $430/t FOB in December 2016 to close to an average of $390/t FOB by the end of January 2017, and continued fluctuating towards the end of March However, Turkish rebar export prices increased during the first quarter of 2017 by $14/t quarter-on quarter. The price fluctuation continued during the second quarter of 2017, but with an uptick towards the end of June with an overall increase of $4/t over the previous quarter. The average price in the first half of 2017 for rebar exported from Turkey was $425/t FOB compared to $388/t FOB in the first half of From July through the end of 2017, the Turkey rebar FOB price has been fluctuating on an upward trend, closely following HMS 1&2 Turkey CFR price evolution. After hitting a three-year high of $550/t FOB in the beginning of September 2017, rebar prices declined to $508/t FOB by October. This drove an increase in the average price range during the third quarter of 2017 by $80/t quarter-on-quarter. Toward the end of 2017, the Turkey rebar FOB export price reached $570/t, and further improved the quarterly average price by $20/t for the fourth quarter of The average Turkey rebar export price was $517/t FOB in the second half of 2017, an increase of $123/t compared to the average of the second half of Long products Europe medium sections Europe rebar Turkish rebar Source: Steel Business Briefing (SBB) Spot average price per tonne Spot average price per tonne Spot average price per tonne Q $458 Q $444 Q $388 Q $334 Q $335 Q $442 Q $379 Q $409 Q $424 Q $427 Q $507 Q $527 Current and anticipated trends in steel production and prices Steel output declined in most major steel producing regions during the first half of 2016 but the second half of 2016 saw steel production volumes grow year-on-year in both China and the rest of the world as underlying demand improved and destocking waned. In China, in 2017 ArcelorMittal believes steel production has been broadly stable (despite the increase in official figures) and the Company expects this trend to continue in 2018 due to a combination of stable domestic demand and only marginally weaker exports. The Chinese HRC spread (difference between raw material costs and finished steel prices) in 2017 increased from approximately $150/t in the first half of 2017 to $250/t in the second half supported by an elevated crude steel utilization rate mainly due to a structural steel capacity cut and the winter heating season policy which temporarily restricted steel supply. The high spread has continued into January 2018 and with inventory levels low and ArcelorMittal expecting stable demand, spreads should remain healthy during Led by a significant increase in pipe and tube demand, U.S. ASC increased around 6% in 2017, which combined with imports relatively stable at a high level, allowed domestic production to increase as some capacity came back online. As ASC is expected to increase again in 2018, the Company anticipates a further commensurate increase in steel production. In the EU, steel demand continues to grow slowly but imports have taken a larger share of demand over the past couple of years. However, mills output has improved in 2017 as underlying demand from steel consuming industries continues to increase and import growth slows due to recent trade protection, particularly flat
13 Management report products. ArcelorMittal expects further but slower growth in steel production in 2018 in EU28. Overall, ArcelorMittal expects world ex-china ASC growth to pick-up in 2018 due to strengthening demand growth in South American and developing Asian markets, coupled with continued but slightly slower growth in developed markets. Together with further capacity cuts in China and stable demand will lead to an improvement in utilization and support the spread of steel prices over raw material costs. Raw materials The primary raw material inputs for a steelmaker are iron ore, coking coal, solid fuels, metallics (e.g., scrap), alloys, electricity, natural gas and base metals. ArcelorMittal is exposed to price volatility in each of these raw materials with respect to its purchases in the spot market and under its long-term supply contracts. In the longer term, demand for raw materials is expected to continue to correlate closely with the steel market, with prices fluctuating according to supply and demand dynamics. Since most of the minerals used in the steel-making process are finite resources, they may also rise in response to any perceived scarcity of remaining accessible supplies, combined with the evolution of the pipeline of new exploration projects to replace depleted resources. The spot markets for iron ore and coking coal were in a downward price trend in 2015 and until the beginning of In 2015, the downward trend gained momentum with a slower growth rate in China, recession in developing economies such as Brazil and Russia, and continued robust seaborne supply from major miners. In 2015, iron ore and coking coal prices decreased by 42.7% and 22.7% year-onyear respectively (Metal Bulletin 2015 vs. 2014). Throughout 2016, raw material prices became increasingly volatile and impacted by short-term changes in sentiment, mainly related to Chinese market demand sentiment for crude steel and how the government might deal with excess steelmaking capacity. Iron ore and coking coal prices increased by 5.2% and 58.2% year-on-year respectively in 2016 (Metal Bulletin 2016 vs. 2015). The increase in the average reference iron ore and hard coking coal price continued in 2017 also supported by the impact of induction furnaces capacities closures since Iron ore and coking coal prices increased by 22.3% and 31.5% year-onyear respectively (Metal Bulletin 2017 vs. 2016). As for pricing mechanisms, since 2012, quarterly and monthly pricing systems have been the main type of contract pricing mechanisms, but spot purchases also appear to have gained a greater share as steelmakers have developed strategies to benefit from increasing spot market liquidity and volatility. In 2015, 2016 and 2017, the trend for using shorter-term pricing cycles continued. Pricing is generally linked to market price indexes and uses a variety 13 of mechanisms, including current spot prices and average prices over specified periods. Therefore, there may not be a direct correlation between market reference prices and actual selling prices in various regions at a given time. Iron ore The downward trend of iron ore spot prices persisted throughout 2015, with quarterly averages spot prices of $62.50 per tonne in the first quarter of 2015, $58.50 per tonne in the second quarter, $54.90 per tonne in the third quarter and $46.70 per tonne in the fourth quarter (Delivered to China, Metal Bulletin index, 62% Fe). This downward trend was due to continued structural oversupply, resilience of high cost mines (in China and seaborne), lower mining costs at major supply regions (supported by currency depreciation, e.g. in Australia and Brazil), lower fuel and freight costs as well as bearish sentiment about Chinese steel demand. In this context of oversupply, the Samarco tailings ponds dam collapse in November 2015 resulted in a halt of operations (a 30 million tonne pellet capacity producer); however, it did not affect the plummeting iron ore price trend, which continued decreasing through the end of Iron ore prices bottomed out during the first quarter of 2016, after reaching $39.50 per tonne (Delivered to China Metal Bulletin Index 62% Fe) on January 13, 2016 and averaging $48.70 per tonne for first quarter of During the second quarter of 2016, the average price was $55.50 per tonne and the period was marked by high volatility, with a peak at $70.50 per tonne on April 21, 2016 and a low of $48.18 per tonne on June 2, For the third quarter of 2016, the average was $58.40 per tonne with a slight downward trend throughout September. During the fourth quarter of 2016, it increased from a minimum of $55.86 per tonne on October 4, 2016 and reached a maximum of $83.58 per tonne on December 12, 2016, the average for the fourth quarter was of $70.50 per tonne and was marked by high volatility and bullish market sentiment driven by higher steel prices as well as closure announcements by the Chinese authorities in steelmaking based on obsolete induction furnaces using mostly scrap as raw materials. Iron ore prices recovered to $85.60 per tonne in the first quarter of 2017 following strong demand for steel after the Chinese New Year. The average price for the second quarter of 2017 decreased to $62.90 per tonne; this downward trend was influenced by increased inventory levels at Chinese ports. In the third quarter of 2017, the average price increased to $71.20 per tonne driven by bullish sentiment in the steel market reflected in strong steel PMIs for China. During the fourth quarter of 2017, the price varied from a minimum of $58.52 per tonne on October 31, 2017 and a maximum of $76.36 per tonne on December 22, 2017 with the average for the fourth quarter at $65.50 per tonne and was marked by high volatility driven by environmental regulation announcements by the Chinese
14 14 Management report authorities to constrain emissions and steel production during the winter period. ArcelorMittal has continued to leverage its diversified supply portfolio and global footprint, as well as mitigating the effect of consolidation among supply sources in 2016, mainly due to the absence of Samarco in the seaborne market. Coking coal The coking coal spot market and quarterly contracts settlements were negatively affected in 2015 by the combined effects of strong Australian coking coal production performance, a mild wet season in Australia and weaker seaborne demand from China. Moreover, in the same period there was an increase of seaborne supply from new regions, notably Russia and Mozambique, as well as productivity improvement and cost reductions at major producers also supported by depreciated local currencies and lower diesel prices. This downward trend prevailed despite some supply closures, e.g. major seaborne suppliers of coking coal from Australia, the United States, and Canada announced the closure of their least cost efficient mines in order to adjust to weaker seaborne demand and to remain cost competitive. These supply closures were more than offset by lower Chinese imports, throughout At the same time, an increased share of imports from Australia at the expense of other seaborne suppliers, mainly from the U.S. and bearish market price forecasts, combined with successive loss-making quarters partially originated from high debt service obligations (following past acquisitions), forced several U.S. coal producers, to file chapter 11 bankruptcy in 2015 in order to restructure their finances and operations. The first half of 2015 experienced sharp spot price and contract reference price reductions, with a widening gap in the second quarter between both references (spot indexes and quarterly contract settlement), as quarterly contract references settled at $117 per tonne (FOB Australia) and $ per tonne for the first and second quarters of 2015, respectively. Spot prices for such quarters averaged $ per tonne and $89.60 per tonne, respectively (Metal Bulletin FOB Australia Premium Hard Coking Coal index). In the third quarter of 2015, premium coking coal spot prices reached a low of $84.60 per tonne (average spot price FOB Australia) while contract settlement for the same quarter was at $93 per tonne (FOB Australia). Contract settlement further reduced in the fourth quarter of 2015, where contract prices settled at $89 per tonne (FOB Australia), while spot prices were trading in the range of $ per tonne (December 1 through 31, 2015). In 2016, the spot price (Metal Bulletin Premium Hard Coking Coal FOB Australia index) traded on average at $78.90 per tonne in the first quarter with the contract price settling at $81 per tonne for the same quarter; then the second quarter of 2016 had a contract settlement fixed at $84 per tonne with the spot average for that quarter at $90.40 per tonne while the third quarter had a contract price settled at $92.50 per tonne and the spot index traded between $90.20 and $94.80 per tonne for the first 15 days but averaged $ per tonne for the third quarter. During the fourth quarter of 2016, the spot price reached a maximum of $ per tonne on November 11, 2016 and decreased through the closing of the year to $231 per tonne on December 30, 2016, the average spot price for the fourth quarter of 2016 was $ per tonne with quarterly contract prices settled at $200 per tonne. The highly volatile spot index over the second half of 2016 was influenced by the Chinese domestic supply reduction (originating from weather/logistic issues combined with regulations issued by the Chinese government on lower mining working days, from an annual rate of 330 days per year to a lower rate at 276 days, with temporary relief as described above) as well as several maintenance and mining operational issues in Australian coking coal mines during that period. Consequently, the premium HCC FOB Australia quarterly contract price was settled at $200 per tonne for the fourth quarter of 2016 and at $285 per tonne for the first quarter of In the first quarter of 2017, the spot prices (Metal Bulletin Premium Hard Coking Coal FOB Australia index) have sharply dropped from $/t in December 2016 (monthly average) to $ per tonne in March 2017 (monthly average) with the average spot price for the first quarter of $ per tonne. The temporary relief of the Chinese working days restriction and fully recovered supply from Australia, as well as expected additional seaborne supply from North America have allowed such a sharp drop of prices by the end of the first quarter of At the beginning of the second quarter of 2017, the cyclone Debbie unexpectedly hit Australia causing supply disruptions and spot prices spikes. The upward trend of April up to $300 per tonne on April 18, 2017 and a monthly average of $ per tonne was followed by the downward trend in May and June as the Australia miningrail-port system recovered earlier than expected from the cyclone disruption. The spot price decreased through the second quarter to $175 per tonne in May (monthly average) and $145 per tonne in June 2017 (monthly average), the average spot price for the second quarter of 2017 was $ per tonne. For the second quarter 2017, a new index-based methodology was adopted for the premium HCC FOB Australia quarterly contract price between some Japanese steel makers and Australian HCC suppliers. In the third quarter of 2017, the average spot price (Metal Bulletin Premium Hard Coking Coal FOB Australia index) increased to $ per tonne driven by bullish sentiment in the steel market and strong steel PMIs for China. In the fourth quarter, supported by the port congestion in Australia, the price further increased to $ per tonne.
15 Management report 15 ArcelorMittal has continued to leverage its full supply chain and diversified supply portfolio as well as contractual terms flexibility to mitigate regional supply disruptions and also mitigate part of the market price volatility. was 4.6% lower than in 2015 when the average price was $218/t) to an average of $269/t for the full year of On the export market, East Coast FOB average prices increased by $55/t, from $225/t in 2016 to $280/t in Scrap Ferro alloys and base metals Both Eurofer and German Wirtschaftsvereinigung ( WV ) indexes were discontinued as of January 1, The German suppliers index ( BDSV ) is now used and converted into Delivered at Place ( DAP ), in order to be comparable with historical figures. Ferro alloys During 2017, in Europe, the German suppliers index BDSV for the reference grade E3 (old thick scrap) rebounded from the 2016 price of 195/t to an average of 259/t in 2017 supported by better European demand for scrap and price recovery in the international market ( 217/t in 2015). In December 2017, European E3 reached 286/ t. During 2017, the European E3 price was $25/t higher on average than the US HMS1 Mid West Price in 2017, versus $8/t higher in European export prices for scrap grade HMS 80:20 also increased by $60/t, moving up from an average of $216/t in 2016 (Rotterdam FOB) to an average of $276/t in Turkey remained the main scrap buying country in the international market in 2017, with approximately 69% of its steel production based on the EAF process, with the other 31% through the blast furnace route. In 2016, the ratios were 66% and 34%, and in 2015 they were 65% and 35%. Steel production increased in Turkey in the first eleven months of 2017 by 12.7% as compared to 2016, while we had had a previous change of 5.2% in 2016 as compared to There was a significant reduction of imported billets which dropped by 50.1% in 2017 as compared to 2016, after an incremental increase of 1.4% in 2016 as compared to As a consequence, Turkish scrap import volumes reached 17.1 million tonnes in the first ten months of 2017 representing an increase of 20.7% compared to the same period in 2016, where scrap imports amounted to 14.2 Mt which had been an increment of 7.2% compared to the same period in Supported by the rebound in steel production, the average Index scrap prices for HMS 80:20 US origin increased from $236/t in 2016 to $303/t in 2017 (CFR Turkey), and the average Index scrap prices for HMS 80:20 EU origin increased from $228/t to $294/t (CFR Turkey) during the same period. The Index scrap price for HMS 80:20 EU origin was at $362/t in December During 2016, Turkish scrap import prices decreased by 2.6% compared to 2015 (from $234/t in 2015 to $228/t in 2016: MB HMS 1&2 80:20 CFR Turkey, North European origin). In the domestic US market, average scrap prices increased by 29% to $61/t for the full year of 2017 as compared to the full year of The Midwest Index for HMS 1 increased from an average of $208/t for the full year of 2016 (which The underlying price driver for manganese alloys is the price of manganese ore which was at the level of $5.97 per dry metric tonne unit ( dmtu ) (for 44% lump ore) on Cost, Insurance and Freight ( CIF ) China for 2017, representing a 39% increase from $4.30 per dmtu in 2016 ($3.11 per dmtu in 2015) mainly due to sustained demand of manganese ore from China, reflecting appetite showed by manganese alloys producers. The prices of high carbon ferro manganese increased by 49% from $960/t in 2016 to $1,428/t in 2017 ($937/t in 2015). Prices of silicon manganese increased by 35% from $992/t in 2016 to $1,343/t in 2017 ($1,009/t for 2015). Similarly, prices for medium carbon ferro manganese increased in 2017 by 39% to $1,910/t as compared to $1,376/t in 2016 ($1,465/t for 2015). Base metals Base metals used by ArcelorMittal are zinc, tin and aluminum for coating, aluminum for deoxidization of liquid steel and nickel for producing stainless or special steels. ArcelorMittal partially hedges its exposure to its base metal inputs in accordance with its risk management policies. The average price of zinc for 2017 was $2,896/t, representing an increase of 38% as compared to the 2016 average of $2,095/t (the 2015 average was $1,928/t). The low for 2017 was $2,435/t on June 7, 2017 and the high was $3,370/t on October 4, The global zinc metal market was in a deficit of 401,000 tonnes in the first 10 months of 2017 (production vs. usage), as compared to 277,000 tonnes of deficit during the same period in Stocks registered at the London Metal Exchange ( LME ) warehouses stood at 182,050 tonnes as of December 31, 2017, representing a 57% decrease compared to December 31, 2016 when registered stocks stood at 427,850 tonnes (464,400 tonnes in 2015). The average price of tin for 2017 was $20,098/t, representing a 12% increase compared to the 2016 average of $18,006/t (the 2015 average was $16,070/t). The average price of aluminum for 2017 was $1,968/t, representing a 23% increase compared to the 2016 average of $1,605/t (the 2015 average was $1,661/t). The average price of nickel for 2017 was $10,407/t, representing an 8% increase compared to the 2016 average of $9,609/t (the 2015 average was $11,834/t).
16 16 Management report Energy market After the sharp decrease observed in 2014 when Brent price went from 110 USD/barrel ("bbl") to 50 USD/bbl, some volatility remained with prices ranging between a top mid 2015 at 66 USD/bbl and a down below 30USD/bbl early 2016, but in essence the oil market was stabilizing between 45 and 55 USD/bbl until mid The decrease in the cost of certain commodities pushed natural gas prices down between 2015 and 2017, even though 2017 rebounded as described further below. After the exceptional 2016 year where prices dropped very significantly in the first part of the year (on natural gas and electricity), following the very bearish trend of other commodities (oil and coal), the situation reversed late in 2016 and offered a more challenging 2017 with increases year-on-year in most of the areas where the Company consumes energy. Among commodities influencing energy prices in 2017, coal has seen a significant price increase (see "Raw materials"). The coal price increase has pushed demand for gas up as combined-cycle power plants, which are powered by gas, started to become more cost effective than coal power plants in some areas, and resulted in sustained higher gas prices, especially during the second half of the year. On November 30, 2016, an agreement among OPEC and 13 non-opec countries was reached to reduce oil production by 1.8 million barrels per day, effective on January 1, 2017 for six months. It was further extended on May 24, 2017 for nine months and again on November 30, 2017 until the end of Combined with a sustained oil production from the U.S., this measure led to a Brent price level between $45/barrel ("bbl") and $57/bbl in the first three quarters of 2017, in line with prices observed in the second half of However, instability in Iran and sustained Asian demand contributed to a large price increase in the last quarter of 2017, with oil closing the year at $67/bbl, just before reaching a 4 year high above $70/bbl in January Natural gas Overall, natural gas demand remains strong. Demand has been increasing moderately, driven by GDP growth and by some regional increase in natural gas usage for electricity production, while supply has continued to increase significantly mainly due the development of liquefied natural gas ("LNG"), especially in Australia and in the U.S. (2017 Worldwide LNG exports have reached 407 billion of cubic meters ("bcm"), i.e. an increase of 9.9% as compared to 2016). Natural gas is priced regionally. While prices in Europe were historically linked with oil prices, continuous spot market development and increasing liquidity are now prevailing in almost all countries except in poorly integrated markets (e.g., Spain and Portugal) or markets in transition from a tariff based system (e.g., Poland). The U.S. initiated its first LNG shipments to Europe in 2016 and exports to Europe between 2016 and 2017 increased by six times, with LNG flows from the U.S. to Spain and Italy surpassing 1 bcm in A definitive movement towards a more liquid and integrated market could be experienced in the coming years, further reducing the gap between Northern and Southern European prices. In 2017, further production cuts in the Netherlands (Groningen) and storage capacity reduction in the UK (heavy maintenance at the Rough facility) have put some pressure on the supply side for the European markets and contributed to a price increase. These developments, coupled with significant tension in the French nuclear production observed mostly since September 2017, have pushed an increase in natural gas demand and further elevated pressurized gas prices. In addition, several events affecting the transport of gas (explosion at the Baumgarten site in Austria in December 2017, stoppage of the Forties pipeline, which brings oil and gas to the UK from the North Sea, in December 2017 to solve a leakage issue) put additional tension in the market and sustained high price levels at the end of Elsewhere, the premium related to the risk of gas flow disruption between Ukraine and Russia has declined. In addition, Ukraine continues to buy gas from Western Europe in order to fulfill its storage requirement to cover domestic consumption and guarantee stable gas transit to Europe during winter. Overall, 2017 TTF Month-Ahead prices (prices for gas traded on a virtual trading platform located in the Netherlands to be delivered in the next calendar month) averaged at 17/MWh, which is more than 20% higher than the 2016 average of 13.93/MWh but still below 2015 when prices settled at 20.30/MWh on average. In 2017, gas production in the United States remained strong at a level of 90 billion cubic feet per day. In North America, natural gas prices trade independently of oil prices and are set by spot and future contracts, traded on the NYMEX exchange or over-the-counter. U.S. steam coal continues to be challenged as a power producing fuel. Gas power plants first took the lead in the generation mix in 2016, which continued in 2017 with around 32% of electricity produced out of gas and 32% from coal. This trend should accelerate as the U.S. had around 12 GW of gas-fired power plants in construction in 2017, and more than 20 GW are expected to be either under construction or subject to regulatory approval in Projects to build liquefaction facilities for export to Europe or Asia also continue to be developed, with production having started in early The number of U.S. gas rigs has increased significantly compared to 2016 levels (172 rigs on average in 2017 as compared to 101 in 2016, or 71% increase).
17 Management report In 2017, Henry Hub Month Ahead prices (prices for gas traded on a U.S. virtual trading platform, for delivery in the next calendar month) increased by 27% vs to an average of $3.08 /MMBtu. The benchmark Asian price index (JKM) price curve kept the same trend as observed in 2016; winter prices spiked well above European prices (TTF) and therefore closed the arbitrage window between Europe and Asia. For example, during the 2016/2017 winter, JKM prices reached more than 30/MWh while TTF was traded around 18-20/MWh for the same period, mostly because of peak demand in Asia. More broadly, starting in March 2017 until the end of September, the JKM price was almost constantly 1.50/MWh above the TTF price and therefore could justify LNG arrivals to Europe. Winter 2017/2018 started similar to the prior winter, with very high demand in Asia (especially as China faces very low temperatures so far) with a strong increase of JKM price and high premium against European market prices. Elsewhere, prices are set on an oil derivative or bilateral basis, depending on local market conditions. International oil prices are dominated by global supply and demand conditions and are also influenced by geopolitical factors. Electricity Electricity price trends tend to be determined by regional factors: The general commodity bearish mood brought the electricity price below 30/MWh at the end of 2015 in most of the Western countries, representing a drop between 5 and 8/MWh or an approximate 20% price reduction since November At the end of the first quarter of 2016, prices began to increase due to pressure on the commodity market (especially regarding coal, power), as well as physical storage and production constraints (gas storage technical constraints, reduction of gas production in Groningen gas fields in the Netherlands and low nuclear availability in Belgium, Germany and France). In North America, natural gas prices went up by 27% between 2016 and 2017 from $2.42/MWh to $3.08/MWh (average of Henry Hub month ahead quotations), while electricity remained flat at around $30/MWh. Recent cold waves in the northwest part of the U.S. have pushed electricity prices upwards with some days around $300/ MWh, which might influence 2018 significantly. Along with the prices of natural gas and coal, electricity prices were on the rise in 2017 as compared to 2016 in all major European markets. In addition, tension in French nuclear production put additional pressure on regional 2016/2017 winter prices. New political administrations in France and in the Netherlands in favor of a floor price for CO2 have also pushed prices up, with a bullish impact on electricity prices. As a result, German spot electricity prices increased by 18% year-on-year, to 34.2/MWh in Renewable generation remains high, mitigating the situation overall. Forward calendar year 2018 electricity prices have strongly increased in all European market places at year end: from 35 to 44.20/MWh in Belgium (+26%), from to 44/ MWh in France (+20%) and from 29 to 34.2/MWh in Germany (+18%). This strong price increase at the end of the year was mainly due to the fuel price increase and to a difficult restart of the French nuclear fleet for the winter period. Ocean freight[3] World economic growth and a resulting increase in seaborne trade helped ocean freight prices increase in 2017 compared to the same period in The Baltic Dry Index increased by 70% year-on-year and averaged 1,145 points in 2017 (2016: 673 points, 2015: 718 points). The growth was primarily due to an increase in iron ore, coal and grain cargoes into China. On the supply side, Bulk Carrier demolition activity slowed considerably in 2017 as freight prices increased but the orders for new ships also slowed to a nine-year low hence net fleet growth has started to slow. Furthermore, port congestion in the fourth quarter of 2017 helped to limit the availability of ships available to trade. The Capesize sector averaged $15,129/day in 2017 (compared to $7,388/day in 2016; 2015 averaged $8,127/ day). The Panamax sector averaged $9,766/day (compared to $5,562/day in 2016; 2015 averaged $5,561/day). Impact of exchange rate movements In 2015, the currency landscape was reshaped. Supported by a robust labor market and resilient growth figures, the strength of the U.S. dollar was confirmed in December 2015 by the first rate increase by the U.S. Federal Reserve ("Fed") after a seven year period of a zero interest rate policy. The situation in the U.S. contrasted strongly with the eurozone, where the European Central Bank s (the ECB ) quantitative easing program increased in intensity throughout the year. This, alongside disappointing data on production activity and inflation, put pressure on the euro, which started the year at 1.21 and ended the year at 1.09 against the U.S. dollar. [3] Sources: Clarksons Research Year-end report 2017, Clarkson Shipping Intelligence Network, Baltic Index
18 18 Management report In 2016, the outcome of the Brexit referendum triggered a move toward safety trades that prompted U.S. dollar strength, supporting the trend towards lower interest rates in the G10 countries. This risk-off climate was confirmed later with the U.S. presidential campaign; however, a sharp reversal of the market sentiment followed Donald Trump s election, triggered by the expectation of an ambitious fiscal and investment program. As a consequence, the euro depreciated against the U.S. dollar to at the end of 2016 from at the start of the year, further driven by the reduction of the monthly asset purchase program from the European Central Bank. In 2017, the fluctuations on the foreign exchange markets were broadly driven by the activity of central banks that started to reduce their accommodative monetary policies, including the Fed, which increased rates three times during the year. The less accommodative policies adopted by the European Central Bank ( ECB ), Bank of Canada ( BoC ) and Bank of England ( BoE ) were already anticipated by the markets and their respective currencies strengthened even before the banks' monetary decisions. The euro strengthened significantly against the U.S. dollar, from at the beginning of 2017 to at the end of the year. Elsewhere in Europe, the currency floor of the Czech koruna was removed on April 6, 2017, in line with ECB guidance, and as a result the Czech koruna strengthened from against the U.S. dollar to eventually reach against the U.S. dollar on December 31, The Czech economy maintained good momentum with solid growth, above-target inflation and a constant appreciation of the Czech koruna. In Poland, the national central bank maintained a largely neutral tone on the actual rate outlook and the Polish zloty strengthened at the end of 2017 to 3.48 compared to 4.18 at the beginning of In Canada, the BoC increased rates in two consecutive meetings during 2017 (July and September) from 0.5% to 1.0%. As a result, the Canadian dollar strengthened and reached its strongest level of 2017 on September 8, In 2017, the Canadian dollar strengthened against the U.S. dollar from 1.35 at the beginning of the year to 1.25 at the end of December During the first half of 2017, the Mexican peso was volatile and strengthened from at the beginning of 2017 to at end of June However, following a shift in the market's expectations of the Fed's policy implementations and a noticeable deterioration in the NAFTA renegotiation, the Mexican peso finished the year at against the U.S. dollar. In Brazil, the economic recovery and inflation expectations were in line with the Central Bank of Brazil s expectations. After an anticipated 75 bps rate reduction on October 25, 2017, the Central Bank of Brazil reduced the rates again by 50 bps on December 6, 2017, taking the benchmark Selic rate down to 7% from 14% in This highlighted the uncertainty about Brazil s gradual economic recovery. As a consequence, the Brazilian real weakened from 3.26 to 3.31 against the U.S. dollar in In South Africa, the political backdrop remained uncertain against tensions in the ANC (African National Congress). A motion to force President Jacob Zuma to step down failed at the Parliament in August 2017, despite a secret ballot. The South African rand weakened from in January 2017 to in November 2017, and then strengthened against the U.S. dollar driven by the election of Cyril Ramaphosa as the President of the ANC, to finish 2017 at In Ukraine, the country's recent return to the capital markets in September 2017 (afforded by the extraordinarily favorable external environment) helped ease financing pressures and alleviate immediate debt servicing concerns. However, the environment remained clouded with lackluster economic performance, languishing structural reforms and IMF lending on hold. The Ukrainian hryvnia strengthened from in January 2017 to in August 2017, and then weakened against the U.S dollar to 28.07, the highest level during the year. The Kazakhstani tenge finished 2017 close to its opening level (332.3 in December 2017 as compared to in January 2017). It reached its strongest level of in May 2017 and was on a weakening trend against the U.S. dollar in the second half of 2017 to its weakest point of in early October On February 17, 2016, the Venezuelan government devalued its currency by changing the official rate of the bolivar fuerte from 6.3 to 10 per U.S. dollar. It also announced the elimination of the SICAD rate and starting February 18, 2016, the SIMADI rate (renamed DICOM) was allowed to float freely at a rate of approximately 203 bolivar fuerte per U.S. dollar. The DICOM rate was originally set at 206 bolivars per U.S. dollar on March 10, 2016, before falling to 674 bolivars per U.S. dollar at December 31, The DICOM rate continued to weaken during 2017 to 3,345 bolivars per U.S. dollar on August 31, 2017, when the Venezuelan government temporarily suspended the sale of U.S. dollars through its DICOM auction system. Effective January 30, 2018, the Venezuelan government eliminated the DIPRO rate and reopened the auction on February 5, 2018 at the new DICOM rate of 30,987 bolivars per euro (25,000 bolivars per U.S. dollar). See note to the consolidated financial statements for further information. Because a substantial portion of ArcelorMittal s assets, liabilities, sales and earnings are denominated in currencies other than the U.S. dollar (its reporting currency), ArcelorMittal has exposure to fluctuations in the values of these currencies relative to the U.S. dollar. These currency
19 Management report fluctuations, especially the fluctuation of the U.S. dollar relative to the euro, as well as fluctuations in the currencies of the other countries in which ArcelorMittal has significant operations and sales, can have a material impact on its results of operations. In order to minimize its currency exposure, ArcelorMittal enters into hedging transactions to lock-in a set exchange rate, as per its risk management policies. Trade and import competition Europe[4] A slowdown in global steel consumption coupled with excess capacity in China led to increased finished steel shipments into Europe in 2015, with import penetration rising to over 16%. Although underlying steel demand remained healthy during 2016, import penetration increased to 18% as third country imports into Europe rose by approximately 10% year-on-year. This continued a trend of imports growing more strongly than domestic demand. Between 2012 and 2016, Apparent Steel Consumption ( ASC ) increased by 12% while over the same period, finished steel imports increased by over 80%, taking market share from domestic producers. This import trend continued in 2017 as imports into Europe rose by around 6% year-on-year, to almost 29 million tonnes, with a particularly high level of imports in the first half of Despite a year-on-year decline in the second half of 2017, import penetration rose to a new record high of almost 19%. Traditionally, imports into Europe have come from CIS countries, China, Turkey and developed Asia, accounting for roughly 75% of imports over the past five years. The share of CIS imports has fallen from 30% in 2016 to 24% in 2017 as imports declined by around 15% year-on-year. The share of Chinese origin imports also continued to fall from their peak of 29% in 2015 to 14% in 2017, due to a 37% fall in imports in However, declines in Chinese and CIS imports have been more than offset by increased imports from traditional exporters such as East Asia and Turkey, who each have around a 15% import share, as well as nontraditional importers like India. South Korean imports rose by 30% in 2017, Turkish and Indian imports rose by over 50% and 100% year-on-year respectively. Overall, the market share of traditional exporters (CIS countries, China, Turkey and developed Asia) has fallen to 67% in 2017, from 74% in United States[5] Finished steel imports peaked in 2014 at over 30 million tonnes, declining significantly to below 24 million tonnes in 2016 or an import penetration of 26%. However, steel import penetration rose in 2017 to almost 28% as imports rose by 8% compared to only a 6% year-on-year increase in ASC. The increase in finished steel imports was due to pipe and tube imports rebounding sharply by over 80% year-on-year due to a revival in the U.S. shale oil and gas industry. This was partially offset by imports of flats and longs which together fell by 2% year-on-year. Imports of semi-finished steel products also rose strongly, up by 28% year-on-year during Steel import penetration had risen to average over 28% between 2014 and 2016 compared to the 23% average between 2007 and 2013 driven by healthy domestic demand, restocking activity and attractive prices in the U.S. relative to international markets. Total imports into the U.S. (including semis) grew by 25% in the first half of 2017 but eased to 8% year-on-year in the second half of the year. Almost three quarters of US imports originate from other NAFTA countries (Canada and Mexico), developed Asia, Brazil and EU28. Imports from other NAFTA countries (Canada and Mexico) rose by 13% yearon-year and accounted for 25% of total imports. U.S. imports from outside NAFTA also rose, up 16% year-onyear, led by Russia (up 53%) and Brazil (up 18%). Nontraditional importers, such as India and Thailand raised imports significantly by 90% and 192% year-on-year respectively. Despite trade measures against Italy and China, imports from Italy increased by 25% year-on-year and Chinese imports were broadly stable. Although, Turkey s contribution to U.S. imports has more than doubled in four years to around 8% in 2017, imports fell by 10% in 2017, due to a 40% decline in exports in the second-half of the year. [4] Source: Eurostat trade data to November 2017, estimates for December [5] Source: U.S. Department of Commerce, customs census data up to November 2017 and import licenses for December 2017.
20 20 Management report Consolidation in the steel and mining industries Prior to 2017, consolidation transactions had decreased significantly in terms of number and value in the context of economic uncertainties in developed economies combined with a slowdown in emerging markets. However, in an effort to reduce the worldwide structural overcapacity, some key consolidation steps were undertaken in 2017, specifically in China and in Europe. Steel industry consolidation in China has remained slow since As a key initiative of the Chinese central government s five-year plan issued in March 2011, the concentration process of the steel industry was expected to reduce overcapacity, rationalize steel production based on obsolete technology, improve energy efficiency, achieve environmental targets and strengthen the bargaining position of Chinese steel companies in price negotiations for iron ore. However, that initiative is yet to produce significant tangible results. In 2015, China dropped its target objective for the top ten Chinese steel producers to account for 60% of national production and for at least two producers to reach 100 million tonne capacity in the next few years. A new industry consolidation plan published by China aims at simplifying approval procedures and facilitating acquisition financing for firms in sectors like steel. In late 2016, Baosteel Group and Wuhan Iron and Steel Group completed their merger, creating Baowu Steel Group with an annual production capacity of around 60 million tonnes, also making it the world's second largest steelmaker. In addition, in Europe, 2017 has been a landmark year for the consolidation of the steel industry with two major transactions announced. In September, Thyssenkrupp and Tata Steel agreed to combine their European steel operations in a 50/50 joint venture, creating Europe's second-largest steel company. The new company will be called ThyssenKrupp Tata Steel and is expected to be up and running in late 2018 following further negotiations and subject to regulatory approvals. On June 28, 2017, the consortium formed by ArcelorMittal and Marcegaglia signed a lease and obligation to purchase agreement with the Italian Government for Ilva, Europe s largest single steel site and only integrated steelmaker in Italy with its main production facility based in Taranto. Ilva also has significant steel finishing capacity in Taranto, Novi Ligure and Genova. The closing of the transaction is subject to certain conditions precedent, including receipt of antitrust approvals. Further future consolidation should allow the steel industry to perform more consistently through industry cycles by achieving greater efficiencies and economies of scale, and improve bargaining power with customers and, crucially, suppliers, who tend to have higher levels of consolidation. Critical accounting policies and use of judgments and estimates Management s discussion and analysis of ArcelorMittal s operational results and financial condition is based on ArcelorMittal s consolidated financial statements, which have been prepared in accordance with IFRS. The preparation of financial statements in conformity with IFRS recognition and measurement principles and, in particular, making the critical accounting judgments highlighted below require the use of estimates and assumptions that affect the reported amounts of assets, liabilities, revenues and expenses. Management reviews its estimates on an ongoing basis using currently available information. Changes in facts and circumstances or obtaining new information or more experience may result in revised estimates, and actual results could differ from those estimates. An overview of ArcelorMittal's critical accounting policies under which significant judgments, estimates and assumptions are made may be found in note 1.2 to the consolidated financial statements. Key indicators The following discussion and analysis should be read in conjunction with ArcelorMittal s consolidated financial statements included in this annual report. ArcelorMittal reports its operations in five reportable segments: NAFTA, Brazil, Europe, ACIS and Mining. The key performance indicators that ArcelorMittal s management uses to analyze operations are sales, average steel selling prices, crude steel production, steel shipments, iron ore and coal production and operating income. Management s analysis of liquidity and capital resources is driven by net cash provided by operating activities.
21 Management report 21 Years ended December 31, 2017, 2016 and 2015 Sales, operating income, crude steel production, steel shipments, average steel selling prices and mining production The following tables provide a summary of ArcelorMittal s performance by reportable segment for the year ended December 31, 2017, 2016 and 2015: Sales for the year ended December 31,1 Segment Operating income (loss) for the year ended December 31, (in $ millions) (in $ millions) (in $ millions) (in $ millions) (in $ millions) (in $ millions) 17,997 15,806 17,293 1,185 2,002 7,755 6,223 8, NAFTA Brazil (705) ,208 29,272 31,893 2,359 1,270 ACIS 7,621 5,885 6, (624) Mining (3,522) Europe 4,033 3,114 3, Others and eliminations (4,935) (3,509) (3,626) (306) (302) Total 68,679 56,791 63, , (109) 4,161 (4,161) Amounts are prior to inter-segment eliminations (except for total) and sales include non-steel sales. Others and eliminations to segment operating income reflects certain adjustments made to operating income of the segments to reflect corporate costs, income from non-steel operations (e.g. energy, logistics and shipping services) and the elimination of stock margins between segments. See table below (in $ millions) Adjustments to segment operating income and other 1 Year ended December 31, (in $ millions) (in $ millions) (199) (71) (10) Financial activities (23) (17) (20) Shipping and logistics (16) (97) (84) (41) (94) 31 (27) (23) (26) (306) (302) (109) Corporate and shared services Intragroup stock margin eliminations 2 Depreciation and impairment Total adjustments to segment operating income and other Includes primarily staff and other holding costs and results from shared service activities. In 2015, Corporate and shared services includes the sale of corporate assets. In 2017, fourth quarter iron ore prices decreased as compared to the fourth quarter of 2016 leading to lower stock margin eliminations. In 2016, as compared to 2015, margins increased mainly as a result of the recovery of iron ore prices and cost reductions leading to an increase in intragroup margin eliminations. Sales ArcelorMittal had sales of $68.7 billion for the year ended December 31, 2017, representing a 20.9% increase from sales of $56.8 billion for the year ended December 31, 2016, primarily due to a 20.4% increase in the average steel selling prices, a 1.6% increase in steel shipments, 22.3% higher seaborne iron ore reference prices and 6.1% higher marketable iron ore shipments. In the first half of 2017, sales were $33.3 billion increasing from sales of $28.1 billion in the first half of 2016, primarily due to 23% higher average steel selling prices and 43% higher seaborne iron ore reference prices. In the second half of 2017, sales of $35.3 billion represented a 23.4% increase as compared to sales of $28.7 billion in the second half of 2016, primarily driven by a 17.5% increase in average steel selling prices, a 5.8% increase in steel shipments and 6% increase in seaborne iron ore reference prices. ArcelorMittal had sales of $56.8 billion for the year ended December 31, 2016, representing a 10.7% decrease from sales of $63.6 billion for the year ended December 31, 2015, primarily due to lower average steel selling prices which were down 9.0% and lower marketable iron ore shipments which decreased by 16.6%, partially offset by higher seaborne iron ore reference prices by 5.1%. Steel shipments for the year ended December 31, 2016 remained stable as compared to shipments for the year ended December 31, In the first half of 2016, sales of $28.1 billion decreased 17.2% from sales of $34.0 billion in the first half of 2015, primarily due to 17% lower average steel selling prices, 14% lower seaborne iron ore reference prices and a 13% decrease in marketable iron ore shipments. In the second half of 2016, sales of $28.7 billion represented a 3.1% decrease as compared to sales of $29.6 billion in the second half of 2015, primarily driven by a decrease of 1.1% in steel shipments. Cost of sales Cost of sales consists primarily of purchases of raw materials necessary for steel-making (iron ore, coke and coking coal, scrap and alloys), electricity, repair and maintenance costs, as well as direct labor costs, depreciation and impairment. Cost of sales for the year ended December 31, 2017 was $60.9 billion as compared to
22 22 Management report $50.4 billion for the year ended December 31, 2016, primarily due to a 22.3% increase the iron ore, and a 31.5% increase in coal reference prices and impairment charges of $206 million related to a downward revision of cash flow projections across all steel facilities in South Africa partially offset by cost optimization efforts as part of the Action 2020 plan. Selling, general and administrative expenses ( SG&A ) were $2.4 billion for the year ended December 31, 2017 compared to $2.2 billion for the year ended December 31, SG&A as a percentage of sales decreased for the year ended December 31, 2017 (3.4%) as compared to 2016 (3.9%). Cost of sales for the year ended December 31, 2016 was $50.4 billion as compared to $65.2 billion for the year ended December 31, Cost of sales for the year ended December 31, 2016 was positively affected by decreased input costs, cost optimization efforts as part of the Action 2020 plan and a one-time gain of $832 million on employee benefits following the signing of the new U.S. labor contract, partially offset by impairments in the ACIS segment for $156 million mainly related to the Vanderbijlpark plant in South Africa and $49 million impairment charge related to the held for sale classification of the ArcelorMittal Zaragoza facility in Spain. Cost of sales for the year ended December 31, 2015 was negatively affected by an increase in impairment on tangible and intangible assets for $4.8 billion partially offset by a decrease in depreciation and foreign exchange impacts due to the appreciation of the U.S. dollar against the major currencies. SG&A was $2.2 billion for the year ended December 31, 2016 compared to $2.5 billion for the year ended December 31, SG&A as a percentage of sales remained stable for the year ended December 31, 2016 (3.9%) as compared to 2015 (4.0%). Operating income or loss ArcelorMittal s operating income for the year ended December 31, 2017 was $5.4 billion as compared with an operating income of $4.2 billion for the year ended December 31, 2016 and was impacted by impairment charges of $206 million related to a downward revision of cash flow projections in South Africa. Operating income in 2016 was positively affected by a one-time gain partially offset by impairments as described below. ArcelorMittal s operating income for the year ended December 31, 2016 was $4.2 billion as compared with an operating loss of $4.2 billion for the year ended December 31, Operating income was positively affected by a one-time gain of $832 million on employee benefits following the signing of the new U.S. labor contract and partially offset by an impairment charge of $49 million related to the held for sale classification of the ArcelorMittal Zaragoza facility in Spain and an impairment charge of $156 million mainly related to the Vanderbijlpark plant in South Africa. Operating loss in 2015 was negatively affected by impairment charges of $4.8 billion as described below and $1.4 billion charges mainly related to the inventory losses following the rapid decline of international steel prices. Operating loss in 2015 was negatively affected by impairment charges of $4.8 billion including $0.9 billion with respect to the Mining segment goodwill and $3.9 billion related to tangible and intangible assets, of which $2.5 billion was in respect of iron ore mining operations at ArcelorMittal Liberia ($1.4 billion), Las Truchas in Mexico ($0.2 billion), ArcelorMittal Serra Azul in Brazil ($0.2 billion) and coal mining operations at ArcelorMittal Princeton in the United States ($0.7 billion) mainly due to a downward revision of cash flow projections relating to the expected persistence of a lower iron ore and coking coal price outlook. Shipments and average steel selling price ArcelorMittal had steel shipments of 85.2 million tonnes for the year ended December 31, 2017 as compared to steel shipments of 83.9 million tonnes for the year ended December 31, 2016, primarily due to increases in NAFTA (2.6%), Brazil (0.8%) and Europe (1.7%) offset in part by decline in ACIS (1.3%). Steel shipments declined 2.4% to 42.5 million tonnes in the first half of 2017 compared to 43.6 million tonnes for the first half of 2016 while steel shipments increased 5.8% to 42.7 million tonnes in the second half of 2017 compared to 40.4 million tonnes for the second half of ArcelorMittal had steel shipments of 83.9 million tonnes for the year ended December 31, 2016 decreased marginally as compared to steel shipments of 84.6 million tonnes for the year ended December 31, 2015, primarily due to declines in Brazil (6.8%) and Europe (1.1%), partially offset by increases in ACIS (6.3%). Average steel selling price increased by 20.4% for the year ended December 31, 2017 as compared to the year ended December 31, Average steel selling price in the first half of 2017 increased by 23.1% as compared to the first half of 2016 and increased by 17.5% in the second half of 2017 as compared to the second half of Average steel selling price decreased by 9.0% for the year ended December 31, 2016 as compared to the year ended December 31, Average steel selling price in the first half of 2016 decreased by 17% as compared to the first half of 2015 and increased by 0.5% in the second half of 2016 as compared to the second half of 2015.
23 Management report NAFTA (in millions of USD unless otherwise shown) Sales 23 Performance for the year ended December 31, ,997 15,806 17,293 Depreciation Impairments 526 1,185 2,002 Crude steel production (thousand tonnes) 23,480 22,208 22,795 Steel shipments (thousand tonnes) 21,834 21,281 21, Operating income / (loss) Average steel selling price (USD/tonne) Sales Sales in the NAFTA segment were $18.0 billion for the year ended December 31, 2017, representing a 13.9% increase as compared to Sales increased primarily as a result of the increase in average steel selling prices by 10.3% and a 2.6% increase in steel shipments. Average steel selling prices increased 14.2% during the first half of 2017 as compared to the first half of 2016 and 6.4% during the second half of 2017 as compared to the second half of Sales in the NAFTA segment were $15.8 billion for the year ended December 31, 2016, representing an 8.6% decrease as compared to Sales decreased primarily as a result of the decrease in average steel selling prices by 8.2%, while steel shipments remained stable. Average selling prices decreased 15% during the first half of 2016 as compared to the first half of 2015 and 0.5% during the second half of 2016 as compared to the second half of Spot prices began improving in the second quarter of 2016 which positively impacted sales in the second half of 2016 due to lead times and lagged pricing. Operating income or loss Operating income for the NAFTA segment was $1.2 billion for the year ended December 31, 2017 as compared to operating income of $2.0 billion for the year ended December 31, 2016, affected by a negative price-cost effect for long products partially offset by a positive price-cost effect for flat products and gains from the Action 2020 program. Additionally, operating income for the year ended December 31, 2016 was positively affected by a one-time $832 million gain on employee benefits following the signing of the new U.S. labor contract. Operating income for the NAFTA segment was $2.0 billion for the year ended December 31, 2016 as compared to an operating loss of $0.7 billion for the year ended December 31, Operating income was positively affected by lower input costs, the improved performance of Calvert and a onetime $832 million gain on employee benefits following the signing of the new U.S. labor contract. (705) Operating loss for the NAFTA segment was $705 million for the year ended December 31, 2015 including impairment charges of $526 million, of which $231 million related to the intended sale of the Long carbon facilities in the United States (ArcelorMittal Laplace, Steelton and Vinton) and $276 million with respect to the Indiana Harbor East and West facilities (United States) in connection with deployment of the asset optimization programs. Operating loss was also negatively affected by inventory related losses amounting to $0.5 billion following the rapid decline of steel prices. Crude steel production, steel shipments and average steel selling price Crude steel production increased 5.7% for the year ended December 31, 2017 as compared to the year ended December 31, 2016 driven by improved operational performance. Crude steel production decreased 2.6% for the year ended December 31, 2016 as compared to the year ended December 31, 2015, primarily due to the closure of Georgetown (U.S.), idling of the steel shop of Indiana Harbor Long Carbon operations (U.S.) and the divestment of LaPlace and Vinton U.S. Long Carbon facilities. Steel shipments increased 2.6% for the year ended December 31, 2017 as compared to the year ended December 31, 2016 in line with improved demand. Shipments were 11 million tonnes for the first half of 2017, an increase of 1.1% from 10.9 million tonnes in the first half of 2016 which included shipments from LaPlace and Vinton which were sold in April Shipments increased 4.1% to 10.8 million tonnes in the second half of 2017 as compared to 10.4 million tonnes in the second half of Total steel shipments remained flat for the year ended December 31, 2016 as compared to the year ended December 31, Shipments were 10.9 million tonnes in the first half of 2016, a decrease of 2% from the same period in 2015, primarily due to the divestment, idling and closure of the U.S. Long Carbon facilities mentioned above, while shipments in the second half of the year were
24 24 Management report 10.4 million tonnes, an increase of 1.7% as compared to the same period in Average steel selling prices increased 10.3% for the year ended December 31, 2017 as compared to the year ended December 31, 2016 in line with international prices. Average steel selling prices increased 14% for the first half of 2017 as compared to the first half of 2016 and 6.4% for the second half of 2017 as compared to the second half of Brazil (in millions of USD unless otherwise shown) Sales Depreciation Impairments Average steel selling price decreased 8.2% for the year ended December 31, 2016 as compared to the year ended December 31, Average steel selling price decreased 15% in the first half of 2016 as compared to the same period in 2015 and by 0.5% in the second half of 2016 as compared to the same period in Spot prices began improving in the second quarter of 2016 which positively impacted sales in the second half of 2016 due to lead times and the lag. Performance for the year ended December 31, ,755 6,223 8, Crude steel production (thousand tonnes) 11,210 11,133 11,612 Steel shipments (thousand tonnes) 10,840 10,753 11, Operating income / (loss) Average steel selling price (USD/tonne) Sales In the Brazil segment, sales increased 24.6% to $7.8 billion for the year ended December 31, 2017 as compared to the year ended December 31, 2016, primarily due to 24.5% higher average steel selling prices. Average steel selling prices increased 34% during the first half of 2017 as compared to the first half of 2016 and 16.6% during the second half of 2017 as compared to the second half of In the Brazil segment, sales decreased 26.8% to $6.2 billion for the year ended December 31, 2016 as compared to the year ended December 31, 2015, primarily due to 17.2% lower average steel selling prices following the depreciation of the Venezuelan Bolivar and the Argentinean peso, a decrease in steel shipments by 6.8% and unfavorable sales mix for long products in Brazil. Operating income or loss Operating income for the Brazil segment for the year ended December 31, 2017 was $697 million, an increase of 13.5% as compared to the year ended December 31, 2016, primarily driven by positive price-cost effect and gains from the Action 2020 program. Operating income for the Brazil segment for the year ended December 31, 2016 was $614 million, a decrease of 2.3% as compared to the year ended December 31, While operating income for the year ended December 31, 2015 was negatively affected by inventory related charges of $91 million following the rapid decline of steel prices and an impairment of $176 million related to the idled ArcelorMittal Point Lisas (Trinadad and Tobago) facility, operating income for the year ended December 31, 2016 was negatively affected by lower shipments and lower average steel selling prices for the reasons described below as well as continued currency devaluation which impacted the tubular operations in Venezuela. Crude steel production, steel shipments and average steel selling price Crude steel production increased marginally to 11.2 million tonnes for the year ended December 31, 2017 as compared to the year ended December 31, 2016 with increases in flat production offset by long production due to a scheduled reline at Monlevade. Crude steel production decreased by 4.1% to 11.1 million tonnes for the year ended December 31, 2016 as compared to the year ended December 31, 2015 as a result of weaker demand and the idling of the Trinidad and Tobago facility. Steel shipments remained stable for the year ended December 31, 2017 and 2016 at 10.8 million tonnes. Steel shipments reached 10.8 million tonnes for the year ended December 31, 2016, decreased 6.8% as compared to steel shipments for the year ended December 31, 2015, primarily driven by weaker demand and the idling of the Trinidad and Tobago facility mentioned above. Average steel selling prices increased 24.5% for the year ended December 31, 2017 as compared to the year ended December 31, 2016 in line with international prices.
25 Management report 25 Average steel selling prices decreased 17.2% for the year ended December 31, 2016 as compared to the year ended December 31, 2015, primarily due to depreciation of the Venezuelan Bolivar and an unfavorable sales mix for long products in Brazil. Europe (in millions of USD unless otherwise shown) Sales Depreciation Impairments Performance for the year ended December 31, ,208 29,272 31,893 1,201 1,184 1, ,359 1, Crude steel production (thousand tonnes) 43,768 42,635 43,853 Steel shipments (thousand tonnes) 40,941 40,247 40, Operating income / (loss) Average steel selling price (USD/tonne) Sales Sales in the Europe segment were $36.2 billion for the year ended December 31, 2017, representing a 23.7% increase as compared to sales of $29.3 billion for the year ended December 31, 2016, primarily due to a 23.5% increase in average steel selling prices and a 1.7% increase in steel shipments. Average steel selling prices increased 23.3% during the first half of 2017 as compared to the first half of 2016 and 23.1% during the second half of 2017 as compared to the second half of Sales in the Europe segment were $29.3 billion for the year ended December 31, 2016, representing an 8.2% decrease as compared to sales of $31.9 billion for the year ended December 31, 2015, primarily due to 6.7% lower average steel selling prices. Average selling prices decreased 12.6% during the first half of 2016 as compared to the first half of 2015 and increased 0.3% during the second half of 2016 as compared to the second half of Spot prices began improving in the second quarter of 2016 which positively impacted sales in the second half of 2016 due to lead times and lagged pricing. Operating income or loss Operating income for the Europe segment for the year ended December 31, 2017 increased to $2.4 billion as compared to $1.3 billion for the year ended December 31, 2016, primarily due to higher steel shipments in the flat business, positive price-cost effect in the flat business and gains from the Action 2020 program, partially offset by lower steel shipments and negative price-cost effect in the long business. Operating income for the Europe segment for the year ended December 31, 2016 increased to $1.3 billion as compared to $0.2 billion for the year ended December 31, Operating income for the year ended December 31, 2016 was positively affected by cost efficiency improvements and a gain of $96 million following an agreement in France to cap the annual indexation of the IRUS pension plan until 2026 and to pay a lump sum amount to cover the indexation obligation for subsequent years. These positive effects were partially offset by lower average steel selling prices and steel shipments as well as a $49 million impairment charge related to the held for sale classification of the ArcelorMittal Zaragoza facility in Spain. Crude steel production, steel shipments and average steel selling price Crude steel production for the Europe segment increased 2.7% to 43.8 million tonnes for the year ended December 31, 2017 as compared to 42.6 million tonnes for the year ended December 31, 2016, reflecting better operational performance. Crude steel production for the Europe segment decreased 2.8% to 42.6 million tonnes for the year ended December 31, 2016 as compared to 43.9 million tonnes for the year ended December 31, 2015, primarily due to production outages in the Fos plant (France), the disposal of ArcelorMittal Zaragoza during the third quarter of 2016 and the idling of the Sestao and the Zumarraga facilities in Spain. Steel shipments were 40.9 million tonnes for the year ended December 31, 2017, a 1.7% increase from steel shipments for the year ended December 31, In the first half of 2017, steel shipments decreased 3.1% to 20.7 million tonnes, from 21.3 million tonnes in the first half of 2016, due to weaknesses in long market demand while steel shipments in the second half of 2017 increased 7.1% as compared to the second half of The decrease in shipments in the first half of 2017 includes the effect of the disposal of ArcelorMittal Zaragoza and the idling of Zumarraga. Steel shipments were 40.2 million tonnes for the year ended December 31, 2016, a marginal decrease of 1.1% from steel shipments for the year ended December 31, 2015 primarily due to production outages in the Fos plant
26 26 Management report (France) and the disposal of ArcelorMittal Zaragoza during the third quarter of 2016 and the idling of Zumarraga. Average steel selling prices increased 23.5% for the year ended December 31, 2017 as compared to the year ended December 31, 2016 in line with higher international prices. Average steel selling prices decreased 6.7% for the year ended December 31, 2016 as compared to the year ended ACIS (in millions of USD unless otherwise shown) December 31, Average selling prices decreased 12.6% during the first half of 2016, as compared to the first half of 2015 and increased 0.3% during the second half of 2016, as compared to the second half of Spot prices began improving in the second quarter of 2016 which positively impacted sales in the second half of 2016 due to lead times and lagged pricing. Performance for the year ended December 31, ,621 5,885 6,128 Depreciation Impairments Operating income / (loss) (624) Crude steel production (thousand tonnes) 14,678 14,792 14,219 Steel shipments (thousand tonnes) 13,094 13,271 12, Sales Average steel selling price (USD/tonne) Sales Sales in the ACIS segment were $7.6 billion for the year ended December 31, 2017, representing an increase of 29.5% as compared to the year ended December 31, 2016, primarily due to a 30.5% increase in average steel selling prices, partially offset by a 1.3% decrease in steel shipments. Average steel selling prices increased 36.9% while steel shipments decreased 4% in the first half of 2017 as compared to the first half of In the second half of 2017, average steel selling prices increased 24.7% and steel shipments increased 1.7% as compared to the second half of In the ACIS segment, sales were $5.9 billion for the year ended December 31, 2016, representing a decrease of 4.0% as compared to the year ended December 31, The decrease was primarily due to an 8.6% decrease in average selling price offset by a 6.3% increase in steel shipments. Sales in the first half of 2016 decreased 17.7% to $2.8 billion compared to the same period in 2015, while sales in the second half of the year were $3.1 billion, an increase of 12.9% from the same period in The decrease in the first half of 2016 is due to the decrease of the average selling price by 23.5% offset by an increase in steel shipments by 9%. The increase in the second half of 2016 is due to the increase of 10.0% in average selling prices and an increase of 3.7% in steel shipments. Operating income or loss Operating income for the ACIS segment for the year ended December 31, 2017 was $508 million as compared to $211 million for the year ended December 31, 2016, increasing primarily driven by a positive price-cost effect in the CIS business including gains from the Action 2020 program, partially offset by negative price-cost effect in ArcelorMittal South Africa and impairment charges of $206 million related to a downward revision of cash flow projections across all steel facilities in ArcelorMittal South Africa. Operating income for the ACIS segment for the year ended December 31, 2016 was $211 million, compared to operating loss of $624 million for the year ended December 31, Operating income for the year ended December 31, 2016 was positively affected by better cost performance and offset by the $156 million impairments mainly related to the Vanderbijlpark plant in South Africa. Operating income for the year ended December 31, 2015 was negatively impacted by impairments and inventory related charges of $294 million and $239 million, respectively Crude steel production, steel shipments and average steel selling price Crude steel production for the ACIS segment decreased marginally by 0.8% to 14.7 million tonnes for the year ended December 31, 2017, from 14.8 million tonnes for the year ended December 31, Crude steel production for the ACIS segment increased 4.0% for the year ended December 31, 2016 as compared to 2015, primarily driven by better operational performance in Kazakhstan and Ukraine. Production in both CIS plants benefited from improved operational stability and production in South Africa marginally decreased due to the mini reline at the Saldanha plant and the closure of the Vereeniging melt shop. Steel shipments for the year ended December 31, 2017 decreased by 1.3% to 13.1 million tonnes as compared to 13.3 million tonnes for the year ended December 31, 2016.
27 Management report 27 Steel shipments reached 13.3 million tonnes for the year ended December 31, 2016, representing an increase of 6.3% compared to the year ended December 31, The increase was driven by the CIS entities due to better operational performance. Average steel selling prices increased 30.5% for the year ended December 31, 2017 as compared to the year ended December 31, 2016 in line with international prices. Average steel selling prices increased 36.9% and 24.7% in the first and second half of 2017, respectively as compared to the same periods in Average steel selling prices decreased 8.6% for the year ended December 31, 2016 as compared to the year ended December 31, 2015; this decrease affected all three units (Ukraine, Kazakhstan and South Africa). Average steel selling prices in the first half of 2016 decreased 23% and increased 10% in the second half of 2016 as compared with the same periods in 2015, primarily driven by the international prices. Mining (in millions of USD unless otherwise shown) Sales Note Performance for the year ended December 31, ,033 3,114 3,387 Depreciation Impairments 3, (3,522) Operating income / (loss) , Own iron ore production (million tonnes) Iron ore shipped externally and internally at market price (million tonnes) Iron ore shipment - cost plus basis (million tonnes) Own coal production (million tonnes) Coal shipped externally and internally at market price (million tonnes) Coal shipment - cost plus basis (million tonnes) , There are three categories of sales: (1) External sales : mined product sold to third parties at market price; (2) Market-priced tonnes : internal sales of mined product to ArcelorMittal facilities reported at prevailing market prices; (3) Cost-plus tonnes : internal sales of mined product to ArcelorMittal facilities on a costplus basis. The determinant of whether internal sales are reported at market price or reported at cost-plus is whether or not the raw material could practically be sold to third parties (i.e., there is a potential market for the product and logistics exist to access that market). Market-priced tonnes represent amounts of iron ore and coal from ArcelorMittal mines that could practically be sold to third parties. Market-priced tonnes that are transferred from the Mining segment to the Company s steel producing segments are reported at the prevailing market price. Shipments of raw materials that do not constitute market-priced tonnes are transferred internally on a cost-plus basis. Iron ore production (million metric tonnes) Note 1 Year ended December 31, Type Product 2017 Open pit Concentrate, lump, fines and pellets Open pit Lump and fines Open pit Own mines North America 2 South America Europe Concentrate and lump Africa Open pit / Underground Fines Asia, CIS & Other Open pit / Underground Concentrate, lump, fines and sinter feed Total own iron ore production Strategic long-term contracts - iron ore North America 3 Open pit Pellets Africa 4 Open pit Lump and fines Total strategic long-term contracts - iron ore Total Total of all finished production of fines, concentrate, pellets and lumps. Includes own mines and share of production from Hibbing (United States, 62.30%) and Peña (Mexico, 50%). Consists of a long-term supply contract with Cliffs Natural Resources which expired in the first quarter of The production for year ended 2015 includes purchases under strategic agreements with Sishen Iron Ore Company (Proprietary) Limited s ( SIOC ) Kumba and Thabazimbi mines (South Africa). On November 6, 2015, ArcelorMittal announced that an agreement had been reached with SIOC to amend the pricing mechanism terms of the current iron ore supply agreement related to Kumba from a cost-based price to an Export Parity Price ( EPP ) with effect from October 1, The EPP is calculated on the basis of the Platts 62% Fe CFR China Fines Index (the Index price ) and, at certain price levels, ArcelorMittal receives a discounted price. As a result of this amendment, the contract related to Kumba was no longer considered as a strategic contract in 2016.
28 28 Management report Note Coal production (million metric tonnes) 2017 Year ended December 31, Own mines North America Asia, CIS & Other Total own coal production Strategic long-term contracts - coal North America Total strategic long-term contracts - coal Total 1. 1 Includes strategic agreement - prices on a fixed price basis. Sales Sales in the Mining segment were $4.0 billion for the year ended December 31, 2017, representing an increase of 29.5% as compared to the year ended December 31, Sales were 45.1% higher at $2.0 billion for the first and second half of 2017, respectively as compared to the same periods in In the Mining segment, sales were $3.1 billion for the year ended December 31, 2016, representing a decrease of 8.1% as compared to the year ended December 31, Sales in the first half of 2016 were $1.4 billion, a decrease of 18% compared to the same period in 2015, while sales in the second half of 2016 were $1.7 billion, an increase of 2.4% from the same period in Sales to external customers were $985 million for the year ended December 31, 2017, representing an increase of 26.1% as compared to the year ended December 31, 2016, primarily due to the increase in prices. Iron ore shipments were 57.9 million tonnes for the year ended December 31, 2017, representing an increase of 3.5% as compared to the year ended December 31, 2016, primarily due to the restart of Volcan in Mexico that delivered 1.7 million tonnes in Iron ore shipments to external parties were 11.8 million tonnes for the year ended December 31, 2017 as compared to 12.3 million tonnes for the year ended December 31, Coal shipments were 6.3 million tonnes for the year ended December 31, 2017 as compared with 6.8 million tonnes for the year ended December 31, Shipments in 2016 were higher from Princeton in the U.S. from liquidation of inventory. Sales to external customers were $781 million for the year ended December 31, 2016, representing a decrease of 5.2% compared to the year ended December 31, Iron ore shipments were 55.9 million tonnes for the year ended December 31, 2016, representing a decrease of 10.4% as compared to 62.4 million tonnes for the year ended December 31, The decrease is primarily due to lower shipments in Mexico, Ukraine, Liberia and Canada. Iron ore shipments to external parties were 12.3 million tonnes for the year ended December 31, 2016 as compared to 13.7 million tonnes for the year ended December 31, Coal shipments were 6.8 million tonnes for the year ended December 31, 2016 as compared with 6.0 million tonnes for the year ended December 31, The increase is primarily due to higher shipments of Princeton. The average reference iron ore price was $71.39 per tonne in 2017, $58.36 per tonne in 2016 and $55.54 per tonne in 2015 (delivered to China, normalized to Qingdao and 62% Fe US $ per tonne, Metal Bulletin) and the average reference price for hard coking coal increased to $ per tonne in 2017, $ per tonne in 2016 and $90.05 per tonne in 2015 (Premium HCC FOB Aus, Metal Bulletin). The increase in the average reference hard coking coal price, following the 2015 declines accelerated in the second half of 2016 and continued significant increases in However, there may not be a direct correlation between reference prices and actual selling prices in various regions at a given time. Operating income or loss Operating income for the Mining segment was $991 million for the year ended December 31, 2017 as compared to $366 million for the year ended December 31, 2016, primarily driven by higher shipments and the increases in the iron ore and coal reference prices. Operating income for the Mining segment for the year ended December 31, 2016 was $366 million, compared to an operating loss of $3.5 billion for the year ended December 31, Operating income for the year ended December 31, 2016 was positively affected by improved cost performance, a decrease in depreciation following the impairments recognized in 2015 and higher average iron ore and coal reference prices. Operating loss in 2015 was negatively impacted by the decrease in seaborne iron ore and coking coal market prices and included impairment charges of $3.4 billion.
29 Management report Production ArcelorMittal had own iron ore production of 57.4 million tonnes for the year ended December 31, 2017, an increase of 4.0% compared to the year ended December 31, 2016, primarily attributed to an increase in production in Mexico (following the restart of the Volcan mine in 2017) and Canada. Liberia production was 2 million tonnes for the year. ArcelorMittal had own iron ore production of 55.2 million tonnes for the year ended December 31, 2016, a decrease of 12.1% compared to the year ended December 31, The decrease in iron ore production is primarily due to lower production in Liberia, Mexico, Ukraine and Canada. With the Company s ongoing focus on its most competitive iron ore operations: Liberia production was being maintained at approximately 2 million tonnes per year and the Volcan mine in Mexico was suspended in October 2015 (2 million tonnes annual impact, restarted in 2017) and iron ore production in Ukraine decreased to reflect a revised mine plan following a delay in accessing new tailings disposal land (approximately 1 million tonnes impact). ArcelorMittal had own coking coal production of 6.3 million tonnes for the year ended December 31, 2017, an increase of 0.9% compared to the year ended December 31, ArcelorMittal had own coking coal production of 6.3 million tonnes for the year ended December 31, 2016, an increase of 1.8% compared to the year ended December 31, The increase in coking coal production was primarily due to higher production in Princeton. Income or loss from investments in associates, joint ventures and other investments ArcelorMittal recorded income of $448 million from investments in associates, joint ventures and other investments for the year ended December 31, 2017, as compared to $615 million for the year ended December 31, 2016 and includes a $133 million gain from disposal of ArcelorMittal USA's 21% stake in the Empire Iron Mining Partnership and improved performance of Calvert and Chinese investees, offset in part by a loss on dilution of the Company's stake in China Oriental and the recycling of cumulative foreign exchange translation losses to the consolidated statement of operations following the disposal of the Company's 50% stake in Kalagadi ($187 million). ArcelorMittal recorded income of $615 million from investments in associates, joint ventures and other investments for the year ended December 31, 2016, as compared with a loss of $502 million for the year ended December 31, The income for the year ended December 31, 2016 was primarily due to the gain on disposal of stakes in Gestamp for $329 million and Hunan Valin for $74 million as well as improved performance of the Calvert joint venture, Chinese and Spanish investees offset 29 in part by impairments of the primary steel making assets at China Oriental. Financing costs-net Financing costs-net include net interest expense, revaluation of financial instruments, net foreign exchange income/expense (i.e., the net effects of transactions in a foreign currency other than the functional currency of a subsidiary) and other net financing costs (which mainly include bank fees, accretion of defined benefit obligations and other long-term liabilities). Net financing costs were lower at $0.9 billion for the year ended December 31, 2017 as compared to $2.1 billion for the year ended December 31, Net interest expense (interest expense less interest income) was lower at $0.8 billion for the year ended December 31, 2017 as compared to $1.1 billion for the year ended December 31, 2016, driven by debt reduction including early bond repayments. Foreign exchange gains were $546 million as compared to a loss of $3 million for the years ended December 31, 2017 and 2016, respectively. The foreign exchange gains were primarily due to the impact of the USD depreciation on euro denominated deferred tax assets, partially offset by foreign exchange losses on euro denominated debt. The USD depreciated 13.8% against the euro in Other net financing costs (including expenses related to True Sale of Receivables, bank fees, interest on pensions and fair value adjustments of the call option of the mandatorily convertible bond and derivative instruments) was $0.6 billion for the year ended December 31, 2017 compared to $0.9 billion for the year ended December 31, 2016, and included $0.8 billion mark-to-market gains on derivatives (primarily the call option of the mandatory convertible bond following the market price increase in the underlying shares), mark-to-market losses relating to a derivative embedded in a pellet supply agreement in the U.S. (due to a payment based on the evolution of the price of steel in the United States domestic steel market) of $0.3 billion, $0.4 billion for premium expense on the early redemption of bonds and an expense of $92 million relating to the extension of the mandatory convertible bond. Net financing costs were lower for the year ended December 31, 2016, at $2.1 billion, a 28.1% decrease compared to $2.9 billion for the year ended December 31, Net interest expense was $1.1 billion for the year ended December 31, 2016, a decrease of 12.8% compared to $1.3 billion the year ended December 31, 2015, primarily due to lower average cost resulting from debt repaid during the year. Foreign exchange losses decreased to $3 million for the year ended December 31, 2016, as compared to $697 million the year ended December 31, 2015, primarily due to the stabilization of currencies in 2016 as compared to 2015.
30 30 Management report Other net financing costs were stable at $0.9 billion for the year ended December 31, 2016 and the year ended December 31, Other net financing costs were negatively affected by premiums and fees of $0.4 billion relating to early redeemed bonds in 2016 and $0.1 billion non-cash expense in connection with the issuance of shares in the context of a B-BBEE transaction in South Africa, partially offset by the fair value adjustment for the mandatory convertible bonds for $0.2 billion. derecognition of deferred tax assets in Luxembourg related to revised expectations of the deferred tax assets recoverability in U.S. dollar terms, and $0.6 billion decrease following the change in tax rate in Luxembourg. The income tax expense in 2015 included $0.4 billion derecognition of deferred tax assets stemming mainly from lower future taxable results forecasts in some jurisdictions. For additional information related to ArcelorMittal s income taxes, see note 9 to ArcelorMittal s consolidated financial statements. Income tax expense (benefit) ArcelorMittal s consolidated income tax expense (benefit) is affected by the income tax laws and regulations in effect in the various countries in which it operates and the pre-tax results of its subsidiaries in each of these countries, which can change from year to year. ArcelorMittal operates in jurisdictions, mainly in Eastern Europe and Asia, which have a structurally lower corporate income tax rate than the statutory tax rate as enacted in Luxembourg (26.01%), as well as in jurisdictions, mainly in Western Europe, Brazil and Mexico, which have a structurally higher corporate income tax rate. ArcelorMittal recorded an income tax expense of $0.4 billion for the year ended December 31, 2017 as compared to $1.0 billion for the year ended December 31, The tax expense for the year ended December 31, 2016 included a derecognition of deferred tax assets for $0.7 billion in Luxembourg as further described below, while in 2017 a deferred tax asset of $0.3 billion was recorded in Luxembourg following increased expectation of future profits. ArcelorMittal recorded an income tax expense of $1.0 billion for the year ended December 31, 2016 as compared to an income tax expense of $0.9 billion for the year ended December 31, The deferred tax expense in 2016 included $0.8 billion due to increased projections of future taxable income in Luxembourg, $0.7 billion impact from the United States Statutory income tax (98) 2017 Statutory income tax rate 21.00% The statutory income tax expense (benefit) and the statutory income tax rates of the countries that most significantly resulted in the tax expense (benefit) at statutory rate for each of the years ended December 31, 2017, 2016 and 2015 are as set forth below: Statutory income tax Statutory income tax rate 35.00% Statutory income tax (863) 2015 Statutory income tax rate 35.00% Argentina % % % France % % (32) 34.43% Brazil % % (48) 34.00% Belgium % % % Germany % (37) 30.30% (43) 30.30% (4) 25.00% (47) 25.00% (146) 25.00% Spain Luxembourg 1, % % (613) 29.22% Mexico (18) 30.00% % (55) 30.00% South Africa (115) 28.00% (96) 28.00% (199) 28.00% % % % Canada Kazakhstan % % (48) 20.00% (21) 19.00% % % Poland % % % Romania (7) 16.00% (11) 16.00% (10) 16.00% Ukraine % % % Trinidad & Tobago 25.00% % (83) 25.00% Liberia (18) 25.00% % (388) 25.00% United Kingdom (1) 17.00% % % Switzerland (67) 7.83% (13) 7.83% % Others (35) (65) (40) 1, (2,146) Czech Republic Total Note: The statutory tax rates are the (future) rates enacted or substantively enacted by the end of the respective period.
31 Management report Non-controlling interests Net income attributable to non-controlling interests was $7 million for the year ended December 31, 2017 as compared with a net loss attributable to non-controlling interests of $45 million for the year ended December 31, Net income attributable to non-controlling interests for 2017 was primarily related to income generated by ArcelorMittal Mines and Infrastructure Canada and Belgo Bekaert Arames in Brazil partly offset by losses generated by ArcelorMittal South Africa. Net loss attributable to non-controlling interests was $45 million for the year ended December 31, 2016, as compared with net loss attributable to non-controlling interests of $477 million for the year ended December 31, Net loss attributable to non-controlling interests for 2016 was primarily related to losses generated by ArcelorMittal South Africa partially offset by income generated by ArcelorMittal Mines and Infrastructure Canada and Belgo Bekaert Arames in Brazil. Net loss attributable to equity holders of the parent ArcelorMittal s net income attributable to equity holders of the parent was $4.6 billion and $1.8 billion for the years ended December 31, 2017 and 2016, respectively and a net loss of $7.9 billion for the year ended December 31, 2015, for the reasons discussed above. Liquidity and capital resources ArcelorMittal s principal sources of liquidity are cash generated from its operations and its credit facilities at the corporate level. Because ArcelorMittal is a holding company, it is dependent upon the earnings and cash flows of, as well as dividends and distributions from, its operating subsidiaries to pay expenses and meet its debt service obligations. Significant cash or cash equivalent balances may be held from time to time at the Company s international operating subsidiaries, in particular those in France and in the United States, where the Company maintains cash management systems under which most of its cash and cash equivalents are centralized, and in Argentina, Brazil, Canada, Kazakhstan, Morocco, South Africa and Ukraine. Some of these operating subsidiaries have debt outstanding or are subject to acquisition agreements that impose restrictions on such operating subsidiaries ability to pay dividends, but such restrictions are not significant in the context of ArcelorMittal s overall liquidity. Repatriation of funds from operating subsidiaries may also be affected by tax and foreign exchange policies in place from time to time in the various countries where the Company operates, though none of these policies is currently significant in the context of ArcelorMittal s overall liquidity. 31 In management s opinion, ArcelorMittal s credit facilities are adequate for its present requirements. As of December 31, 2017, ArcelorMittal s cash and cash equivalents, including restricted cash of $212 million, amounted to $2.8 billion as compared to $2.6 billion as of December 31, In addition, ArcelorMittal had available borrowing capacity of $5.5 billion under its $5.5 billion revolving credit facility as of December 31, 2017 and As of December 31, 2017, ArcelorMittal s total debt, which includes long-term debt and short-term debt, was $12.9 billion, compared to $13.7 billion as of December 31, Net debt (defined as long-term debt ($10.1 billion) plus short-term debt ($2.8 billion), less cash and cash equivalents and restricted cash ($2.8 billion)) was $10.1 billion as of December 31, 2017, down from $11.1 billion at December 31, 2016, comprised of long-term debt ($11.8 billion) plus short-term debt ($1.9 billion), less cash and cash equivalents and restricted cash ($2.6 billion). Net debt decreased primarily due to cash provided by operating activities in excess of capital expenditure ($1.7 billion), offset in part by negative foreign exchange impacts on eurodenominated debt ($0.7 billion). Most of the external debt is borrowed by the parent company on an unsecured basis and bears interest at varying levels based on a combination of fixed and variable interest rates. Gearing (defined as net debt divided by total equity) at December 31, 2017 was 25% as compared to 34% at December 31, The margin applicable to ArcelorMittal s principal credit facilities ($5.5 billion revolving credit facility and certain other credit facilities) and the coupons on certain of its outstanding bonds are subject to adjustment in the event of a change in its long-term credit ratings. Downgrades that occurred in 2015 resulted in increased interest expense. On February 24, 2017, Moody s upgraded ArcelorMittal s credit rating to Ba1 and placed ArcelorMittal on stable outlook. On May 24, 2017, Standard & Poor s upgraded ArcelorMittal s credit rating to BB+ and placed it on stable outlook. On July 28, 2017, Fitch affirmed its credit rating of ArcelorMittal at BB+ and revised its outlook from stable to positive. On November 20, 2017, Standard & Poor's affirmed its credit rating of ArcelorMittal at BB+ and revised its outlook from stable to positive. On December 7, 2017, Moody's affirmed its credit rating of ArcelorMittal at Ba1 and revised its outlook from stable to positive. On February 1, 2018, Standard & Poor's upgraded ArcelorMittal's credit rating to BBB- with a stable outlook. These upgrades resulted in reduced interest expense, although the impact was marginal given the significant interest savings from debt reduction that occurred in 2017.
32 32 Management report ArcelorMittal s $5.5 billion revolving credit facility, which incorporates a first tranche of $2.3 billion maturing on December 21, 2019, and a second tranche of $3.2 billion maturing on December 21, 2021, contains restrictive covenants. Among other things, these covenants limit encumbrances on the assets of ArcelorMittal and its subsidiaries, the ability of ArcelorMittal s subsidiaries to incur debt and the ability of ArcelorMittal and its subsidiaries to dispose of assets in certain circumstances. The agreement also requires compliance with a financial covenant, as summarized below. ArcelorMittal s principal credit facilities set this ratio to 4.25 to 1. As of December 31, 2017, the Company was in compliance with the ratio. The Company must ensure that the ratio of Consolidated Total Net Borrowings (consolidated total borrowings less consolidated cash and cash equivalents) to Consolidated EBITDA (the consolidated net pre-taxation profits of the ArcelorMittal group for a Measurement Period, subject to certain adjustments as set out in the facility) does not, at the end of each Measurement Period (each period of 12 months ending on the last day of a financial half-year or a financial year of the Company), exceed a certain ratio, referred to by the Company as the Leverage ratio. As of December 31, 2017, ArcelorMittal had guaranteed $41 million of debt of its operating subsidiaries. ArcelorMittal s debt facilities have provisions whereby the acceleration of the debt of another borrower within the ArcelorMittal group could, under certain circumstances, lead to acceleration under such facilities. Type of indebtedness as of December 31, 2017 Bonds Long-term revolving credit lines Non-compliance with the covenants in the Company s borrowing agreements would entitle the lenders under such facilities to accelerate the Company s repayment obligations. The Company was in compliance with the financial covenants in the agreements related to all of its borrowings as of December 31, 2017 and December 31, The following table summarizes the repayment schedule of ArcelorMittal s outstanding indebtedness, which includes short-term and long-term debt, as of December 31, Repayment amounts per year (in billions of $) >2022 Total $0.9 $0.9 $1.9 $1.4 $1.5 $2.8 $9.4 - $2.3 billion tranche of $5.5 billion revolving credit facility - $3.2 billion tranche of $5.5 billion revolving credit facility Commercial paper $1.1 Other loans $0.8 $0.3 $0.2 $0.4 $0.2 $0.5 $2.4 Total gross debt $2.8 $1.2 $2.1 $1.8 $1.7 $3.3 $12.9 $1.1 The following table summarizes the amount of credit available as of December 31, 2017, under ArcelorMittal s $5.5 billion revolving credit facility: Drawn Available $2.3 billion tranche of $5.5 billion revolving credit facility Facility amount $2.3 $2.3 $3.2 billion tranche of $5.5 billion revolving credit facility $3.2 $3.2 Total committed lines $5.5 $5.5 Credit lines available The average debt maturity of the Company was 5.5 years as of December 31, 2017, as compared to 7 years as of December 31, Further information regarding ArcelorMittal s outstanding short-term and long-term indebtedness as of December 31, 2017, including the breakdown between fixed rate and variable rate debt, is set forth in note 6 to the consolidated financial statements. Further information regarding ArcelorMittal s use of financial instruments for hedging purposes is set forth in note 6 to the consolidated financial statements. Financings The principal financings of ArcelorMittal and its subsidiaries are summarized below by category. Further information regarding ArcelorMittal s short-term and long-term indebtedness is provided in note 6 to the consolidated financial statements. Principal credit facilities On December 21, 2016, ArcelorMittal signed an agreement for a $5.5 billion revolving credit facility (the "Facility"). This Facility amends and restates the $6 billion revolving credit facility dated April 30, The amended agreement incorporates a first tranche of $2.3 billion maturing on December 21, 2019, and a second tranche of $3.2 billion
33 Management report maturing on December 21, 2021, restoring the Facility to the original tenors of 3 years and 5 years. The Facility may be used for general corporate purposes. As of December 31, 2017, the $5.5 billion revolving credit facility was fully available. The Company makes drawdowns from and repayments on this facility in the framework of its cash management. On September 30, 2010, ArcelorMittal entered into the $500 million revolving multi-currency letter of credit facility (the Letter of Credit Facility ). The Letter of Credit Facility is used by the Company and its subsidiaries for the issuance of letters of credit and other instruments. The terms of the letters of credit and other instruments contain certain restrictions as to duration. The Letter of Credit Facility was amended on October 26, 2012, to reduce its amount to $450 million. On September 30, 2014, the Company refinanced its Letter of Credit Facility by entering into a $350 million revolving multi-currency letter of credit facility, which matures on September 30, capital markets transactions On December 28, 2017, ArcelorMittal redeemed $643.5 million (the remaining outstanding balance) of its $1.5 billion 6.125% Notes due June 1, 2018, for a total aggregate purchase price including accrued interest and premium on early repayment of $658 million, which was financed with existing cash and liquidity. On December 4, 2017, ArcelorMittal issued 500 million ($600 million) 0.95% Notes due January 17, 2023, under its wholesale Euro Medium Term Notes Programme. On November 17, 2017, at maturity, ArcelorMittal repaid the 540 million ($647 million) principal amount that remained outstanding, following the cash tender offers in April 2016, of its 1 billion 4.625% unsecured bonds. On October 16, 2017, pursuant to cash tender offers and financed with existing cash and liquidity, ArcelorMittal purchased: $441 million of its U.S. dollar denominated 6.250% Notes due February 25, 2022 (the USD 2022 Notes ) for a total aggregate purchase price (including premiums and accrued interest) of $510 million. Following this purchase, $659 million principal amount of the USD 2022 Notes remained outstanding. 33 aggregate purchase price (including premiums and accrued interest) of $464 million. Following this purchase, $1,117 million principal amount of the USD 2039 Notes remained outstanding. On April 3, 2017, ArcelorMittal redeemed all of its outstanding $1.5 billion 9.85% Notes due June 1, 2019, for a total aggregate purchase price including accrued interest and premium on early repayment of $1,040 million, which was financed with existing cash and liquidity. Mandatory convertible bond On December 14, 2017, the Company extended the conversion date for the $1 billion privately placed mandatory convertible bond (the MCB ) issued on December 28, 2009, by one of its wholly-owned Luxembourg subsidiaries. The MCB is mandatorily convertible into preferred shares of such subsidiary. The mandatory conversion date of the bond has been extended to January 29, The other main features of the MCB remain unchanged. The bond was privately placed with Credit Agricole Corporate and Investment Bank and is not listed. In connection with the extension of the conversion date of the MCB, ArcelorMittal also extended the maturities of the equity-linked notes in which the proceeds of the MCB issuances are invested. Commercial paper program ArcelorMittal has a commercial paper program enabling borrowings of up to 1 billion. As of December 31, 2017, the outstanding amount was $1,125 million, compared to $392 million as of December 31, Other loans and facilities On December 21, 2017, ArcelorMittal Kryvyi Rih entered into a $175 million loan agreement with the European Bank for Reconstruction and Development in order to support the upgrade of its production facilities, energy efficiency improvement and environmental impact reduction. The loan agreement also provides for an additional $175 million in loan facilities which are currently uncommitted. As of December 31, 2017, the facility remains fully available. On October 9, 2017, ArcelorMittal completed the offering of a 300 million ($360 million) variable rate loan in the German Schuldschein market. The proceeds of the issuance were used to repay or prepay existing indebtedness. $371 million of its U.S. dollar denominated 6.75% Notes due March 1, 2041 (the USD 2041 Notes ) for a total aggregate purchase price (including premiums and accrued interest) of $445 million. Following this purchase, $629 million principal amount of the USD 2041 Notes remained outstanding. On September 15, 2017, ArcelorMittal entered into an agreement for financing with a financial institution for net proceeds of CAD 936 million ($771 million) with repayment over several dates in 2017 and As of December 31, 2017, CAD 236 million ($188 million) was outstanding. $383 million of its U.S. dollar denominated 7.000% Notes due October 15, 2039 (the 2039 Notes ) for a total On May 25, 2017, ArcelorMittal South Africa signed a 4.5 billion South African rand revolving borrowing base finance facility maturing on May 25, Any borrowings under the
34 34 Management report facility are secured by certain eligible inventory and receivables, as well as certain other working capital and related assets of ArcelorMittal South Africa. The facility is used for general corporate purposes. The facility is not guaranteed by ArcelorMittal. As of December 31, 2017, 3.7 billion South African rand ($298 million) was drawn. In 2014, ArcelorMittal entered into certain short-term committed bilateral credit facilities. The facilities were extended in 2015, 2016 and As of December 31, 2017, the facilities, totaling approximately $0.8 billion, remain fully available. True sale of receivables ( TSR ) programs The Company has established a number of programs for sales without recourse of trade accounts receivable to various financial institutions (referred to as true sale of receivables ( TSR )). As of December 31, 2017, the total amount of trade accounts receivables sold amounted to $5,024 million. Through the TSR programs, certain operating subsidiaries of ArcelorMittal surrender the control, risks and benefits associated with the accounts receivable sold; therefore, the amount of receivables sold is recorded as a sale of financial assets and the balances are removed from the consolidated statements of financial position at the moment of sale. Earnings distribution On February 13, 2015, ArcelorMittal s Board of Directors announced a gross dividend payment of $0.20 per share. The dividend was approved by the shareholders at the annual general meeting of shareholders held on May 5, 2015, and the dividend was paid in full on June 15, On November 6, 2015, ArcelorMittal s Board of Directors proposed the suspension of the dividend for the financial year This proposal was approved by the shareholders at the annual general meeting held on May 4, The Company had indicated that a dividend will not be proposed until its leverage had further improved. ArcelorMittal held 2.0 million shares in treasury as of December 31, 2017, as compared to 2.4 million shares (corresponding to 7.2 million shares prior to the reverse stock split) as of December 31, As of December 31, 2017, the number of shares held by the Company in treasury represented approximately 0.19% of the Company s total issued share capital. On January 31, 2018, the Company announced that the Board has agreed on a new dividend policy which will be proposed to shareholders at the annual general meeting of shareholders in May Given the current de-leveraging focus, dividends will begin at $0.10/share in 2018 (paid from 2017 results). Once the Company achieves net debt at or below its $6 billion target, then the Company is committed to returning a portion of the amount of annual net cash provided by operating activities less capital expenditures to shareholders. Pension/OPEB liabilities The defined benefit liabilities for employee benefits decreased $0.6 billion to $7.5 billion as of December 31, 2017, as compared to $8.1 billion as of December 31, The decrease is mainly due to the increase of the return on plan assets and other actuarial assumptions, partially offset by an increase in the defined benefit obligation due to lower discount rates during For additional information with respect to the Company s pension plan and OPEB liabilities, including a breakdown by region and by type of plan, see note 7.2 to the consolidated financial statements. Sources and uses of cash Years ended December 31, 2017, 2016 and 2015 The following table presents a summary of cash flow of ArcelorMittal: Summary of cash flow (in $ millions) 2017 For the year ended December 31, ,563 2,708 2,151 Net cash used in investing activities (2,830) (1,143) (2,170) Net cash (used in) provided by financing activities (1,731) (2,926) Net cash provided by operating activities Net cash provided by operating activities For the year ended December 31, 2017, net cash provided by operating activities increased to $4.6 billion, as compared with $2.7 billion for the year ended December 31, The increase in net cash provided by operating activities is mainly due to an increase in operating income driven by the increase in average steel selling prices 395 partially offset by increases in the raw material costs and an investment in operating working capital of $1.88 billion which represents changes in cash flows for trade accounts receivable ($0.62 billion), inventories ($2.35 billion) and trade accounts payable and other ($1.09 billion). For the year ended December 31, 2016, net cash provided by operating activities increased to $2.7 billion, as
35 Management report compared with $2.2 billion for the year ended December 31, The increase in net cash provided by operating activities is mainly due to decreased costs, a decrease in interest paid following the debt repayments as discussed below, partially offset by an investment in operating working capital of $1.0 billion which represents changes in cash flows for trade accounts receivable ($0.4 billion), inventories ($2.1 billion) and trade accounts payable and other ($1.4 billion). Net cash used in investing activities Net cash used in investing activities was $2.8 billion for the year ended December 31, 2017 as compared to $1.1 billion for the year ended December 31, Capital expenditures increased to $2.8 billion for the year ended December 31, 2017 as compared to $2.4 billion for the year ended December 31, Net cash used in investing activities in 2016 was positively impacted by the proceeds described below. Cash from investing activities for the year ended December 31, 2017 included tangible asset disposals and proceeds from the disposal of U.S. long products Georgetown, the first installment of proceeds of $44 million from the disposal of ArcelorMittal USA s 21% stake in the Empire Iron Mining Partnership offset by $44 million cash consideration (net of cash acquired for $14 million and $5 million to be paid upon conclusion of certain business restructuring measures) for the acquisition of a 55.5% stake in Bekaert Sumaré and $110 million deposited in a restricted cash account in ArcelorMittal South Africa in connection with various environmental obligations and true sales of receivables programs. Net cash used in investing activities was $1.1 billion for the year ended December 31, 2016 as compared to $2.2 billion for the year ended December 31, This decrease was mainly related to cash inflows from other investing activities which includes $1.0 billion proceeds from the sale of ArcelorMittal s stake in Gestamp, $0.2 billion proceeds from the sale of ArcelorMittal s stake in Hunan Valin, $0.1 billion proceeds from the sale of ArcelorMittal Zaragoza and $0.1 billion proceeds from the sale of Long Carbon facilities in the U.S., LaPlace and Vinton. These cash inflows were offset by capital expenditures of $2.4 billion for the year ended December 31, 2016, a decrease from $2.7 billion for the year ended December 31, ArcelorMittal s major capital expenditures in the year ended December 31, 2017 included the following projects: the AM/ NS Calvert slab yard expansion, ArcelorMittal Dofasco's galvalume line, ArcelorMittal Poland's HSM extension and HDG capacity increase along with other ongoing projects. In 2018, capital expenditure is expected to be approximately $3.8 billion largely reflecting the Mexico HSM project and anticipated Ilva capital expenditures. See "Capital Expenditure projects" for more detail. 35 Net cash (used in) provided by financing activities Net cash used by financing activities was $1.7 billion for the year ended December 31, 2017, as compared to $2.9 billion in In 2016, net cash used by financing activities included $6.0 billion net payments/proceeds for short and long-term debt, partially offset by the $3.1 billion proceeds from the Company s equity offering, while for the year ended December 31, 2017, net payments/proceeds for short and long-term debt was $1.5 billion. For further details, see "Liquidity and capital resources" above. Net cash used by financing activities was $2.9 billion for the year ended December 31, 2016, as compared to net cash provided by financing activities of $0.4 billion in The increase in cash used in financing activities was primarily due to $6.0 billion net payments/proceeds for short and long-term debt, partially offset by the $3.1 billion proceeds from the Company s equity offering. Dividends paid to non-controlling shareholders in subsidiaries during the year ended December 31, 2017 was $141 million. Dividends paid during the year ended December 31, 2016 were $61 million. Dividends paid during the year ended December 31, 2015 were $0.4 billion, including $331 million paid to ArcelorMittal shareholders and $85 million paid to non-controlling shareholders in subsidiaries. Equity Equity attributable to the equity holders of the parent increased to $38.8 billion at December 31, 2017, as compared to $30.1 billion at December 31, 2016, primarily due to net income attributable to the equity holders of the parent of $4.6 billion, $2.6 billion foreign exchange gains and $1.2 billion in actuarial gains. See note 10 to ArcelorMittal s consolidated financial statements for the year ended December 31, Equity attributable to the equity holders of the parent increased to $30.1 billion at December 31, 2016, as compared to $25.3 billion at December 31, 2015, primarily due to net income attributable to the equity holders of the parent of $1.8 billion and the equity offering for $3.1 billion. See note 10 to ArcelorMittal s consolidated financial statements for the year ended December 31, Research and development, patents and licenses Costs relating to research and development, patents and licenses were not significant as a percentage of sales. Research and development costs expensed (and included in selling, general and administration expenses) in 2017, 2016 and 2015, amounted to $278 million, $239 million and $227 million, respectively.
36 36 Management report Trend information Disclosures about market risk All of the statements in this Trend Information section are subject to and qualified by the information set forth under the Cautionary Statement Regarding Forward-Looking Statements. See also "Key factors affecting results of operations". ArcelorMittal is exposed to a number of different market risks arising from its normal business activities. Market risk is the possibility that changes in raw materials prices, foreign currency exchange rates, interest rates, base metal prices (zinc, nickel, aluminum and tin) and energy prices (oil, natural gas and power) will adversely affect the value of ArcelorMittal s financial assets, liabilities or expected future cash flows. Outlook Market conditions are favorable. The demand environment remains positive (as evidenced by the continued high readings from the ArcelorMittal weighted PMI) and steel spreads remain healthy. Global apparent steel consumption ( ASC ) is estimated to have expanded by 3.2% in Based on the current economic outlook, ArcelorMittal expects global ASC to grow further in 2018 by between 1.5% and 2.5%. By region: ASC in U.S. is expected to grow 1.5% to 2.5% in 2018 (including pipes and tubes) (versus 1.3% in 2017) driven by demand in machinery and construction. In Europe, we expect underlying demand to continue to grow, supported by the strength of the machinery and construction end markets, and overall demand is expected to be 1.0% to 2.0% in 2018 (versus growth of 1.5% in 2017). In Brazil, ASC is expected to grow by 6.5% to 7.5% in 2018 (an acceleration of growth versus 4.6% in 2017), as the economy starts to turnaround with improved consumer confidence and pick up in long products as construction recovers. In the CIS, ASC is estimated to grow 2.0% to 3.0% in 2018 (a moderation of growth versus 5.4% in 2017). In China, ASC grew by 3.5% in 2017, higher than the Company's initial expectations. Overall demand is expected to remain close to this level in 2018 (between -0.5% and +0.5%), as the anticipated weakness in the real estate sector is expected to be offset in part by robust infrastructure and automotive end markets. Nevertheless, excluding China, ASC is expected to grow by approximately 3.0% to 4.0% in 2018 (versus +2.8% in 2017), which supports global ASC growth of 1.5% to 2.5% in 2018 (as compared to growth of approximately 3.2% in 2017). The Company expects cash needs of the business (consisting of capital expenditures, cash paid for interest and other cash payments primarily for taxes, and excluding for these purposes operating working capital), to increase in 2018 to approximately $5.6 billion from $4.4 billion in The expected increase in capital expenditures to $3.8 billion in 2018 from $2.8 billion in 2017 largely reflects the Mexico HSM project and anticipated Ilva capital expenditures as well as additional strategic projects (including further investment to enhance downstream optimization in Europe). Net interest is expected to decline to $0.6 billion from $0.8 billion in 2017 reflecting the benefits of liability management exercises completed in Other cash needs are expected to increase to $1.2 billion from $0.8 billion in 2017, primarily due to higher expected cash payments for taxes due to timing impacts. The fair value information presented below is based on the information available to management as of the date of the consolidated statements of financial position. Although ArcelorMittal is not aware of any factors that would significantly affect the estimated fair value amounts, such amounts have not been comprehensively revalued for purposes of this annual report since that date, and therefore, the current estimates of fair value may differ significantly from the amounts presented. The estimated fair values of certain financial instruments have been determined using available market information or other valuation methodologies that require considerable judgment in interpreting market data and developing estimates. See note 6 to ArcelorMittal s consolidated financial statements for quantitative information about risks relating to financial instruments, including financial instruments entered into pursuant to the Company s risk management policies. Risk management ArcelorMittal has implemented strict policies and procedures to manage and monitor financial market risks. Organizationally, supervisory functions are separated from operational functions, with proper segregation of duties. Financial market activities are overseen by the CFO, the Corporate Finance and Tax Committee and the CEO Office. All financial market risks are managed in accordance with the Treasury and Financial Risk Management Policy. These risks are managed centrally through Group Treasury by a group specializing in foreign exchange, interest rate, commodity, internal and external funding and cash and liquidity management. All financial market hedges are governed by ArcelorMittal s Treasury and Financial Risk Management Policy, which includes a delegated authority and approval framework, sets the boundaries for all hedge activities and dictates the required approvals for all Treasury activities. Hedging activity and limits are monitored on an ongoing basis. ArcelorMittal enters into transactions with numerous counterparties, mainly banks and financial institutions, as well as brokers, major energy producers and consumers. As part of its financial risk management activities, ArcelorMittal uses derivative instruments to manage its
37 Management report exposure to changes in interest rates, foreign exchange rates and commodities prices. These instruments are principally interest rate, currency and commodity swaps, spots and forwards. ArcelorMittal may also use futures and options contracts. Counterparty risk ArcelorMittal has established detailed counterparty limits to mitigate the risk of default by its counterparties. The limits restrict the exposure ArcelorMittal may have to any single counterparty. Counterparty limits are calculated taking into account a range of factors that govern the approval of all counterparties. The factors include an assessment of the counterparty s financial soundness and its ratings by the major rating agencies, which must be of a high quality. Counterparty limits are monitored on a periodic basis. All counterparties and their respective limits require the prior approval of the Corporate Finance and Tax Committee. Standard agreements, such as those published by the International Swaps and Derivatives Association, Inc. (ISDA) are negotiated with all ArcelorMittal trading counterparties. Currency exposure ArcelorMittal seeks to manage each of its entities exposure to its operating currency. For currency exposure generated by activities, the conversion and hedging of revenues and costs in foreign currencies is typically performed using currency transactions on the spot market and forward market. For some of its business segments, ArcelorMittal hedges future cash flows. Because a substantial portion of ArcelorMittal s assets, liabilities, sales and earnings are denominated in currencies other than the U.S. dollar (its reporting currency), Currency In 2017 Argentine peso Bosnia and Herzegovina convertible mark Chinese renminbi Euro Moroccan dirham Swiss franc Other 37 ArcelorMittal has exposure to fluctuations in the values of these currencies relative to the U.S. dollar. These currency fluctuations, especially the fluctuation of the value of the U.S. dollar relative to the euro, the Canadian dollar, Brazilian real, South African rand, Kazakh tenge and Ukrainian hryvnia, as well as fluctuations in the currencies of the other countries in which ArcelorMittal has significant operations and/or sales, could have a material impact on its results of operations. ArcelorMittal faces transaction risk, where its businesses generate sales in one currency but incur costs relating to that revenue in a different currency. For example, ArcelorMittal s non-u.s. subsidiaries may purchase raw materials, including iron ore and coking coal, in U.S. dollars, but may sell finished steel products in other currencies. Consequently, an appreciation of the U.S. dollar will increase the cost of raw materials, thereby negatively impacting the Company s operating margins, unless the Company is able to pass along the higher cost in the form of higher selling prices. ArcelorMittal faces foreign currency translation risk, which arises when ArcelorMittal translates the financial statements of its subsidiaries, denominated in currencies other than the U.S. dollar for inclusion in ArcelorMittal s consolidated financial statements. The tables below illustrate the impact of an appreciation and a depreciation of the U.S. dollar of 10% against the euro, on the conversion of the net debt of ArcelorMittal into U.S. dollars as of December 31, 2017 and December 31, The impact on net debt denominated in a currency different than the euro, is computed based on historical data of how such currency would move against the U.S. dollar when the U.S. dollar appreciates/depreciates 10% against the euro. A positive sign means an increase in the net debt. Impact on net debt translation of a 10% appreciation of the U.S. dollar against the euro in $ equivalent (in millions) (6) Impact on net debt translation of a 10% depreciation of the U.S. dollar against the euro in $ equivalent (in millions) 5 2 (3) (8) 9 (597) (4) (6) 7 2 (1)
38 38 Management report Impact on net debt translation of a 10% appreciation of the U.S. dollar against the euro in $ equivalent (in millions) 2 Impact on net debt translation of a 10% depreciation of the U.S. dollar against the euro in $ equivalent (in millions) (2) (392) 392 Moroccan dirham 4 (4) South African rand (1) 1 Swiss franc (14) 16 Ukrainian hryvnia 1 (1) Other 8 (5) Currency In 2016 Chinese renminbi Euro Derivative instruments ArcelorMittal uses derivative instruments to manage its exposure to movements in interest rates, foreign exchange rates and commodity prices. Changes in the fair value of derivative instruments are recognized in the consolidated statements of operations or in equity according to nature and effectiveness of the hedge. Derivatives used are non-exchange-traded derivatives such as over-the-counter swaps, options and forward contracts. For the Company s tabular presentation of information related to its market risk sensitive instruments, please see note 6 to the consolidated financial statements. Interest rate sensitivity Cash balances, which are primarily composed of euros and U.S. dollars, are managed according to the short term (up to one year) guidelines established by senior management on the basis of a daily interest rate benchmark, primarily through short-term currency swaps, without modifying the currency exposure. Interest rate risk on debt ArcelorMittal s policy consists of incurring debt at fixed and floating interest rates, primarily in U.S. dollars and euros according to general corporate needs. Interest rate and currency swaps are utilized to manage the currency and/or interest rate exposure of the debt. For the Company s tabular presentation of the fair values of its short and long term debt, please see note 6 to the consolidated financial statements. Commodity price risk ArcelorMittal utilizes a number of exchange-traded commodities in the steel-making process. In certain instances, ArcelorMittal is the leading consumer worldwide of certain commodities. In some businesses and in certain situations, ArcelorMittal is able to pass this exposure on to its customers. The residual exposures are managed as appropriate. Financial instruments related to commodities (base metals, energy, freight and emission rights) are utilized to manage ArcelorMittal s exposure to price fluctuations. Hedges in the form of swaps and options are utilized to manage the exposure to commodity price fluctuations. For the Company s tabular presentation of information related to its market risk sensitive instruments, please see note 6 to the consolidated financial statements. In respect of non-exchange traded commodities, ArcelorMittal is exposed to volatility in the prices of raw materials such as iron ore (which is generally correlated with steel prices with a time lag) and coking coal. This exposure is almost entirely managed through long-term contracts, however some hedging of iron ore exposures is made through derivative contracts. For a more detailed discussion of ArcelorMittal s iron ore and coking coal purchases, see "Raw materials".
39 Management report 39 Group organizational structure The following table identifies each significant operating subsidiary of ArcelorMittal, including the country of incorporation. Please refer to note of the consolidated financial statements for the ownership percentages of these subsidiaries. Unless otherwise stated, the subsidiaries as listed have share capital consisting solely of ordinary shares, which are held directly or indirectly by the Company and the proportion of ownership interests held equals to the voting rights held by the Company. Name of Subsidiary Abbreviation Country ArcelorMittal Dofasco G.P. ArcelorMittal Dofasco Canada ArcelorMittal México S.A. de C.V. ArcelorMittal Mexico Mexico ArcelorMittal USA LLC ArcelorMittal USA USA ArcelorMittal Long Products Canada G.P. ArcelorMittal Long Products Canada Canada ArcelorMittal Brasil S.A. ArcelorMittal Brasil Brazil Acindar Industria Argentina de Aceros S.A. Acindar Argentina ArcelorMittal Atlantique et Lorraine S.A.S. ArcelorMittal Atlantique & Lorraine France ArcelorMittal Belgium N.V. ArcelorMittal Belgium Belgium ArcelorMittal España S.A. ArcelorMittal España Spain ArcelorMittal Flat Carbon Europe S.A. AMFCE Luxembourg ArcelorMittal Galati S.A. ArcelorMittal Galati Romania ArcelorMittal Poland S.A. ArcelorMittal Poland Poland ArcelorMittal Eisenhüttenstadt GmbH ArcelorMittal Eisenhüttenstadt Germany ArcelorMittal Bremen GmbH ArcelorMittal Bremen Germany ArcelorMittal Méditerranée S.A.S. ArcelorMittal Méditerranée France ArcelorMittal Belval & Differdange S.A. ArcelorMittal Belval & Differdange Luxembourg ArcelorMittal Hamburg GmbH ArcelorMittal Hamburg Germany ArcelorMittal Ostrava a.s. ArcelorMittal Ostrava Czech Republic ArcelorMittal Duisburg GmbH ArcelorMittal Duisburg Germany ArcelorMittal International Luxembourg S.A.1 ArcelorMittal International Luxembourg Luxembourg ArcelorMittal South Africa Ltd. ArcelorMittal South Africa South Africa JSC ArcelorMittal Temirtau ArcelorMittal Temirtau Kazakhstan PJSC ArcelorMittal Kryvyi Rih ArcelorMittal Kryvyi Rih Ukraine ArcelorMittal Mining Canada G.P. and ArcelorMittal Infrastructure Canada G.P. ArcelorMittal Mines and Infrastructure Canada Canada ArcelorMittal Liberia Ltd ArcelorMittal Liberia Liberia JSC ArcelorMittal Temirtau ArcelorMittal Temirtau Kazakhstan PJSC ArcelorMittal Kryvyi Rih ArcelorMittal Kryvyi Rih Ukraine NAFTA Brazil and neighboring countries ("Brazil") Europe Africa and Commonwealth of Independent States ("ACIS") Mining 1. ArcelorMittal International Luxembourg is managed as part of the Europe segment as of January 1, ArcelorMittal is a holding company with no business operations of its own. All of ArcelorMittal s significant operating subsidiaries are indirectly owned by ArcelorMittal through intermediate holding companies. The following chart represents the operational structure of the Company, including ArcelorMittal s significant operating subsidiaries and not its legal or ownership structure.

40 40 Management report
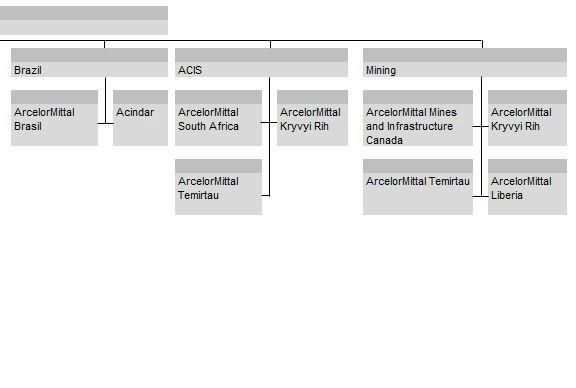
41 Management report 41
42 42 Management report Key transactions and events in 2017 ArcelorMittal s principal investments, acquisitions and disposals, and other key events that occurred during the year ended December 31, 2017 are summarized below: During 2017, ArcelorMittal completed several financing and repayment transactions. Please refer to Liquidity and capital resourcesfinancings for a summary of the transactions. During 2017, ArcelorMittal completed certain divestment and other investment transactions not listed below. Please refer to notes 2.3 and 2.5 to the consolidated financial statements within this report for a summary of the transactions. On August 25, 2017, ArcelorMittal completed the sale (per a sales agreement entered into in October 2016) of its 50% shareholding in Kalagadi Manganese (Proprietary) Limited to Kgalagadi Alloys (Proprietary) Limited for consideration to be paid during the life of the mine, which is contingent on the financial performance of the mine and cash flow availability. On August 7, 2017, ArcelorMittal USA and Cliffs Natural Resources ( Cliffs ) agreed that Cliffs would acquire ArcelorMittal USA s 21% ownership interest in the Empire Iron Mining Partnership for $133 million plus the assumption of all partnership liabilities. The payment of $133 million will be in three equal installments with the first payment of $44 million in August 2017, and the two subsequent payments to be received in August of 2018 and On June 28, 2017, the consortium formed by ArcelorMittal and Marcegaglia signed a lease and obligation to purchase agreement with the Italian Government for Ilva S.p.A. and certain of its subsidiaries ( Ilva ). Intesa Sanpaolo will formally join the consortium before the transaction closes. Ilva is Europe s largest single steel site and only integrated steelmaker in Italy with its main production facility based in Taranto. Ilva also has significant steel finishing capacity in Taranto, Novi Ligure and Genova. The purchase price amounts to 1.8 billion, with annual leasing costs of 180 million to be paid in quarterly installments. The assets will be transferred to AM InvestCo Italy Srl ("AM InvestCo") free of long term liabilities and financial debt and include 1 billion of net working capital, subject to adjustment. Ilva s assets will be initially leased with rental payments qualifying as down payments against the purchase price. The lease is for a minimum period of two years. The closing of the transaction is subject to certain conditions precedent, including receipt of antitrust approvals. With respect to antitrust approvals, ArcelorMittal notified the European Commission of AM InvestCo's proposed acquisition of Ilva on September 21, 2017, and submitted commitments on October 19, On November 8, 2017, the European Commission initiated a Phase II review of AM InvestCo s proposed acquisition of Ilva and ArcelorMittal confirmed it will continue to work closely and constructively with the Commission to explain the dynamics of the steel industry, the rationale of the proposed acquisition and the benefits it will bring to industry, customers, the environment and the local economy. The Company continues to engage in dialogue with the Commission seeking to secure approval for this transaction. The agreement includes industrial capital expenditure commitments over a seven-year period of approximately 1.3 billion with an investment program focused on blast furnaces, steel shops and finishing lines. It also includes environmental capital expenditure commitments of approximately 0.8 billion and environmental remediation commitments of approximately 0.3 billion, the latter of which will be funded with funds seized by the Italian Government from the former shareholder. The Company has identified synergies of 310 million which are targeted by 2020 (excluding impact from fixed cost reductions and volume improvements). On June 21, 2017, as a result of the extension of the partnership between ArcelorMittal and the Bekaert Group in the steel cord business in Brazil, the Company completed the acquisition of a 55.5% controlling interest in Bekaert Sumaré Ltda. from the Bekaert Group and renamed it ArcelorMittal Bekaert Sumaré Ltda., a manufacturer of metal ropes for automotive tires located in the municipality of Sumaré/SP, Brazil. The Company agreed to pay a total cash consideration of 56 million ($63 million) of which 52 million ($58 million) settled on closing date and 4 million ($5 million) to be paid subsequently upon conclusion of certain business restructuring measures by Bekaert. On May 22, 2017, following the approval of the Extraordinary General Meeting of shareholders of ArcelorMittal held on May 10, 2017, ArcelorMittal completed a reverse stock split and consolidated each three existing shares in the Company without nominal value into one share without nominal value. On March 1, 2017, ArcelorMittal s Board of Directors took note of Mr. Wilbur Ross resignation from the Board as a consequence of his confirmation as United States Secretary of Commerce. On February 23, 2017, ArcelorMittal and Votorantim S.A. announced the signing of an agreement, pursuant to which Votorantim s long steel businesses in Brazil, Votorantim Siderurgia, will become a subsidiary of ArcelorMittal Brasil and Votorantim will hold a noncontrolling interest in ArcelorMittal Brasil. Votorantim s long steel operations in Argentina (Acerbrag) and
43 Management report Colombia (PazdelRío) were not included in the transaction. The combination of the businesses is expected to result in a long product steel producer with annual crude steel capacity of 5.6 million tonnes and annual rolling capacity of 5.4 million tonnes. The combined operations include ArcelorMittal Brasil s production sites at Monlevade, Cariacica, Juiz de Fora, Piracicaba and Itaúna, and Votorantim Siderurgia s production sites at Barra Mansa, Resende and its participation in Sitrel, in Três Lagoas. The merger is expected to generate cost, logistical and operational synergies. The combined businesses production facilities are geographically complementary, enabling closer proximity and higher levels of service to its customer base. On February 7, 2018, the Brazilian antitrust authority CADE approved the transaction, which is expected to close during the first half of 2018, subject to the fulfillment of divestment commitments by ArcelorMittal Brasil. Until closing, ArcelorMittal Brasil and Votorantim Siderurgia will remain fully separate and independent companies. On January 27, 2017, China Oriental, a Chinese integrated iron and steel conglomerate listed on the Hong Kong Stock Exchange ( HKEx ) in which ArcelorMittal held a 47% associated interest, announced the completion of a share placement order to restore the minimum 25% free float requirement as per the HKEx listing requirement. The trading of China Oriental s shares, which had been suspended since April 29, 2014, resumed on February 1, Following this share placing, ArcelorMittal s interest in China Oriental decreased to 39%. Recent developments On February 12, 2018, ArcelorMittal announced that its subsidiary ArcelorMittal India Private Limited ("AMIPL") has submitted an offer for Essar Steel India Limited ("Essar"), an Indian steel company, in the framework of the corporate insolvency resolution process. In its offer, AMIPL set out a detailed industrial plan for Essar aimed at improving its performance and profitability and ensuring it can participate in the anticipated growth of steel demand in India. Essar is an integrated flat steel producer, with its main production facility in Gujarat. It has a nameplate crude steel capacity of 9.6 million tonnes per year, although the current maximum achievable crude steel production level is 6.1 million tonnes per year, due to a bottleneck in the steelmaking and casting process. 43
44 44 Management report Corporate governance At the same meeting, the shareholders re-elected Mr. Lakshmi N. Mittal, Mr. Bruno Lafont and Mr. Michel Wurth for a new term of three years each. The Corporate Governance section of our Annual Report 2017 contains a full overview of our corporate governance practices. The Board of Directors is composed of nine directors, of which eight are non-executive directors and five are independent directors. The Board of Directors comprises only one executive director, Mr. Lakshmi N. Mittal, the Chairman and Chief Executive Officer of ArcelorMittal. Directors and senior management Board of Directors ArcelorMittal places a strong emphasis on corporate governance. ArcelorMittal has five independent directors on its nine member Board of Directors. The Board s Audit & Risk Committee and Appointments, Remuneration and Corporate Governance Committee ( ARCG Committee ) are each comprised exclusively of independent directors. Mr. Bruno Lafont is the Lead Independent Director. In the most recent assessment of the Company s leadership structure, the ARCG Committee reviewed the key duties and responsibilities of the Company s Chairman and Chief Executive Officer and its Lead Independent Director as follows: The annual general meeting of shareholders on May 10, 2017 acknowledged the expiration of the terms of office of Mr. Lakshmi N. Mittal, Mr. Bruno Lafont and Mr. Michel Wurth. Chairman Lead Independent Director * Chairs the Board of Directors' and shareholders' meetings * Provides independent leadership to the Board of Directors * Works with the Lead Independent Director to set agenda for the Board of Directors and reviews the schedule of the meetings * Presides at executive sessions of independent directors * Serves as a public face of the Board of Directors and of the Company * Advises the Chairman of any decisions reached and suggestions made at the executive sessions, as appropriate * Serves as a resource for the Board of Directors * Coordinates the activities of the other independent directors * Guides discussions at the Board of Directors meetings and encourages directors to express their positions * Oversees Board of Directors' governance processes, including succession planning and other governance-related matters * Communicates significant business developments and timesensitive matters to the Board of Directors * Liaison between the Chairman and the other independent directors * Is responsible for managing day-to-day business and affairs of the Company * Calls meetings of the independent directors when necessary and appropriate * Interacts with the CEO Office and Executive Officers of the Company and frequently meets stakeholders and provides feedback to the Board of Directors * Leads the Board of Directors self-evaluation process and such other duties as are assigned from time to time by the Board of Directors The members of the Board of Directors are set out below: Age4 Name Date of joining the Board5 End of Term Position within ArcelorMittal Lakshmi N. Mittal 67 May 1997 May 2020 Chairman of the Board of Directors and Chief Executive Officer Vanisha Mittal Bhatia 37 December 2004 May 2019 Director Jeannot Krecké 67 January 2010 May 2019 Director Suzanne P. Nimocks 58 January 2011 May 2019 Director Bruno Lafont May 2011 May 2020 Lead Independent Director Tye Burt May 2012 May 2018 Director Michel Wurth 63 May 2014 May 2020 Director 54 May 2015 May 2018 Director 63 May 2016 May 2019 Director 23 Karyn Ovelmen 13 Karel de Gucht Member of the Audit & Risk Committee. Member of the Appointments, Remuneration and Corporate Governance Committee. Non-executive and independent director. Age as of December 31, Date of joining the Board of ArcelorMittal or, if prior to 2006, its predecessor Mittal Steel Company NV.
45 Management report Mr. Willbur L. Ross stepped down from the Board on March 1, Mr. Narayanan Vaghul stepped down from the Board on May 10, 2017 and Mr. Lewis B. Kaden stepped down from the Board on May 10, Henk Scheffer is the Company Secretary and, accordingly, acts as secretary of the Board of Directors. Lakshmi N. Mittal, 67, is the Chairman and Chief Executive of ArcelorMittal, a renowned global businessman who serves on the boards of various advisory councils, and an active philanthropist engaged in the fields of education and child health. Mr. Mittal was born in Sadulpur in Rajasthan in He graduated from St Xavier s College in Kolkata, where he received a Bachelor of Commerce degree. Having completed his education in India, Mr. Mittal began his career working in his family s steelmaking business in India before moving to Indonesia in 1976 to set up a small steel company that over time grew to become ArcelorMittal, the world s leading steel company and one of the foremost industrial companies in the world. He is widely recognized for the role he played in restructuring the steel industry towards a more consolidated and globalized model, pursuing and successfully integrating many acquisitions in North America, South America, Europe, South Africa and the CIS. Today ArcelorMittal continues to be the largest and most global steel manufacturer. "Mittal Steel" became the world s leading steel producer in 2004 following the merger of Ispat International and LNM Holdings, and the simultaneous acquisition of International Steel Group. Shortly after, in 2006, Mittal Steel launched an ambitious bid to merge with Arcelor which created ArcelorMittal. Mr. Mittal s contribution to business and global industry has been widely recognized. In 1996 he was awarded Steelmaker of the Year by New Steel in the United States and in 1998 the Willy Korf Steel Vision Award by World Steel Dynamics for outstanding vision, entrepreneurship, leadership and success in global steel development. He was named Fortune magazine s European Businessman of the Year in 2004 and Business Person of the year by the Sunday Times, International Newsmaker of the Year by Time Magazine and Person of the Year by the Financial Times in 2006 for his outstanding business achievements. In January 2007, Mr. Mittal was presented with a Fellowship from King s College London, the college s highest award. In 2007 he also received the Dwight D. Eisenhower Global Leadership Award, the Grand Cross of Civil Merit from Spain and was named AIST Steelmaker of the year. In January 2008, Mr. Mittal was awarded the Padma Vibhushan, India s second highest civilian honor, by the President of India. In September 2008, Mr. Mittal was chosen for the third Forbes Lifetime Achievement Award. In October 2010, he was awarded World Steel Association s medal in recognition of his services to the Association as its Chairman and also for his contribution to the sustainable development of the global steel industry. In 45 January 2013, Mr. Mittal was awarded a Doctor Honoris Causa by the AGH University of Science and Technology in Krakow, Poland. In addition to his role at ArcelorMittal, Mr. Mittal is an active participant of various boards and advisory councils. He is Chairman of the board of Aperam and a member of the board of Goldman Sachs. He previously sat on the board of Airbus N.V. He is a member of the Foreign Investment Council in Kazakhstan, the Global CEO Council of the Chinese People s Association for Friendship with Foreign Countries, the World Economic Forum s International Business Council, the World Steel Association s Executive Committee, the European Round Table of Industrialists, the Indian School of Business and a member of the board of Trustees of Cleveland Clinic. Mr. Mittal, with his wife Usha Mittal, is also an active philanthropist. He recently made a significant gift to Harvard to support the Lakshmi Mittal South Asia Institute and is a member of the Global Advisory Council of Harvard University. The Mittal family have also made important gifts to Great Ormond Street Hospital, supporting the Mittal Children s Medical Centre which formally opened in January 2018, and UNICEF, specifically on the topic of child malnutrition in India. Mr. Mittal and his wife Usha Mittal have a son, Aditya Mittal, and a daughter, Vanisha Mittal Bhatia. Mr. Mittal is a citizen of India. Vanisha Mittal Bhatia, 37, is a non-independent Director of ArcelorMittal. She was appointed as a member of the LNM Holdings Board of Directors in June Ms. Vanisha Mittal Bhatia was appointed to Mittal Steel s Board of Directors in December 2004, where she worked in the Procurement department leading various initiatives including "total cost of ownership program". She joined Aperam in April 2011 and since has held the position of Chief Strategy Officer. She has a Bachelor of Sciences from the European Business School. She is also the daughter of Mr. Lakshmi N. Mittal. Ms. Mittal Bhatia is a citizen of India. Jeannot Krecké, 67, is a non-executive and nonindependent Director of ArcelorMittal. He started his university studies at the Université Libre de Bruxelles (ULB) in Belgium in 1969, from where he obtained a degree in physical and sports education. He decided in 1983 to change professional direction. His interests led him to retrain in economics, accounting and taxation. He enrolled in various courses, in particular in the United States. Following the legislative elections of June 13, 2004, Mr. Krecké was appointed Minister of the Economy and Foreign Trade of Luxembourg on July 13, Upon the return of the coalition government formed by the Christian Social Party (CSV) and the Luxembourg Socialist Workers Party (LSAP) as a result of the legislative elections of June 7, 2009, Mr. Krecké retained the portfolio of Minister of the Economy and Foreign Trade on July 23, As of July 2004, Mr. Krecké represented the Luxembourg government at the Council of Ministers of the EU in the Internal Market and Industry sections of its Competitiveness configuration,
46 46 Management report as well as in the Economic and Financial Affairs Council, and in the Energy section of its Transport, Telecommunications and Energy configuration. He was also a member of the Eurogroup from July 2004 to June On February 1, 2012, Mr. Krecké retired from government and decided to end his active political career in order to pursue a range of different projects. Mr. Krecké is currently the CEO of Key International Strategy Services. He is a member of the boards of JSFC Sistema, of East West United Bank, of China Construction Bank Europe, of Calzedonia Finanziara S.A., Jan De Nul S.A. and Novenergia Holding Company S.A. Mr. Krecké is a citizen of Luxembourg. Suzanne P. Nimocks, 58, is a non-executive and independent Director of ArcelorMittal and a member of the Appointments, Remuneration and Corporate Governance Committee. She was previously a director (senior partner) with McKinsey & Company, a global management consulting firm, from June 1999 to March 2010, and was with the firm in various other capacities beginning in 1989, including as a leader in the firm s Global Petroleum Practice, Electric Power & Natural Gas Practice, Organization Practice, and Risk Management Practice. Ms. Nimocks chaired the Environmental Committee of the Greater Houston Partnership, the primary advocate of Houston s business community, until December 31, She holds a Bachelor of Arts in Economics from Tufts University and a Masters in Business Administration from the Harvard Graduate School of Business. Ms. Nimocks is currently a board member for Encana Corporation, Rowan Companies Plc, and Owens Corning, all listed companies. Encana is a major natural gas exploration and production company, Rowan Companies provides drilling services for the oil and gas industry and Owens Corning is a manufacturer of building products. In the non-profit sector, she is a member of the board of directors of the Houston Zoo and serves as a Trustee of the Texas Children s Hospital. Ms. Nimocks is a citizen of the United States of America. Bruno Lafont, 61, is Lead Independent Director of ArcelorMittal, a member of the Audit & Risk Committee and chairman of the Appointments, Remuneration and Corporate Governance Committee. He began his career at Lafarge in 1983 and has held numerous positions in finance and international operations with the same company. In 1995, Mr. Lafont was appointed Group Executive Vice President, Finance, and thereafter, Executive Vice President of the Gypsum Division in Mr. Lafont joined Lafarge s General Management as Chief Operating Officer between May 2003 and December 2005, Chief Executive Officer in January 2006, and he was appointed Chairman and Chief Executive Officer in May In July 2015 Mr. Lafont was appointed Honorary Chairman of Lafarge. He was cochairman of the Board of Directors of LafargeHolcim between July 2015 and May He is presently a board member of EDF and a member of the Executive Committee of the World Business Council for Sustainable Development (WBCSD). Born in 1956, Mr. Lafont is a graduate from the Hautes Etudes Commerciales business school (HEC 1977, Paris) and the Ecole Nationale d Administration (ENA 1982, Paris). Mr. Lafont is a citizen of France. Mr. Lafont has informed the Company that, on December 8, 2017, he (along with five other former Lafarge officers) was placed under formal investigation (mis en examen) in his capacity as former CEO of Lafarge SA, in relation to alleged payments made by a subsidiary of Lafarge SA (Lafarge Cement Syria) to terrorist groups in Syria, and that alleged violations of EU economic sanctions and French labor law are also being investigated. Tye Burt, 60, is a non-executive and independent Director of ArcelorMittal and a member of the Appointments, Remuneration and Corporate Governance Committee. He was appointed President and Chief Executive Officer of Kinross Gold Corporation in March He held this position until August 1, Kinross is listed on the New York Stock Exchange and the Toronto Stock Exchange. Mr. Burt was also a member of the board of directors of Kinross. Mr. Burt has broad experience in the global mining industry, specializing in corporate finance, business strategy and mergers and acquisitions. Prior to joining Kinross, he held the position of Vice Chairman and Executive Director of Corporate Development at Barrick Gold Corporation. He was President of the Cartesian Capital Group from 2000 to 2002; Chairman of Deutsche Bank Canada and Deutsche Bank Securities Canada; Global Managing Director of Global Metals and Mining for Deutsche Bank AG from 1997 to 2000; and Managing Director and Co-Head of the Global Mining Group at BMO Nesbitt Burns from 1995 to 1997, holding various other positions at BMO Nesbitt Burns from 1986 to Mr. Burt is the Chairman of Urthecast Corp., a Canadian TSX-listed company in the aerospace technology business. The company is focused on the business of streaming color images of the Earth from a suite of the company-owned satellites. He is also the Chair and Principal at Carbon Arc Capital Investments Corp. and the Life Sciences Research Campaign Chair of the University of Guelph's Better Planet Project. Mr. Burt is a member of the Duke of Edinburgh's Award Charter for Business Board of Governors and is Vice-Chair of the Governors of the Royal Ontario Museum Foundation. He is a graduate of Osgoode Hall Law School, a member of the Law Society of Upper Canada, and he holds a Bachelor of Arts degree from the University of Guelph. Mr. Burt is a citizen of Canada. Michel Wurth, 63, is a non-independent director of ArcelorMittal. He joined Arbed in 1979 and held a variety of functions before joining the Arbed Group Management Board and becoming its chief financial officer in The merger of Aceralia, Arbed and Usinor, leading to the creation of Arcelor in 2002, led to Mr. Wurth s appointment as senior executive vice president and CFO of Arcelor. He
47 Management report became a member of ArcelorMittal s Group Management Board in 2006, responsible for Flat Carbon Europe, Global R&D, Distribution Solutions and Long Carbon Worldwide respectively. Michel Wurth retired from the GMB in April 2014 and was elected to ArcelorMittal s board of directors in May He holds a Law degree from the University of Grenoble, France, and a degree in Political Science from the Institut d Études Politiques de Grenoble as well as a Master s of Economics from the London School of Economics, UK. Mr. Wurth is also doctor of laws honoris causa of the Sacred Heart University, Luxembourg. Mr. Wurth has served as Chairman of the Luxembourg Chamber of Commerce since He is also nonexecutive Chairman of Paul Wurth S.A. and of BIP Investment Partners S.A. and non-executive Director of BGL BNP Paribas S.A., of SMS Group and of Brasserie Nationale. Paul Wurth S.A. is controlled by SMS Group, a leading family owned equipment and engineering supplier for the steel and non-ferrous metal producing industry. BIP Investment Partners is a Luxembourg based company, mainly invested in private equity, BGL BNP Paribas is a Luxembourg bank, majority owned by BNP of France and Brasserie Nationale is a privately owned brewery based in Luxembourg. Mr. Wurth is a citizen of Luxembourg. Directors as a non-executive director and as member of their Audit Committee since December Mrs. Ovelmen holds a Bachelor of Arts degree from the University of Connecticut, USA, and is a Certified Public Accountant ("CPA"). Mrs. Ovelmen is a citizen of the United States of America. Mr. Karel de Gucht, 63, is a non-executive and independent director and was the European Commissioner for Trade in the 2nd Barroso Commission ( ) and for Development and Humanitarian Aid in the 1st Barroso Commission ( ). He was Minister of Foreign Affairs ( ) and Vice Prime Minister ( ) of Belgium. In addition, he was the Chairman in Office of the Organization for Security and Cooperation in Europe (OSCE) (2006) and Member of the Security Council of the United Nations ( ). He is a Professor of Law at VUB (the Dutch-speaking Free University of Brussels), a member of the Advisory Board of CVC Capital Partners, a member of the board of directors of Proximus NV (Telecom) and the president of the Board of IES, the Brussels Institute of European Studies. Mr. de Gucht holds a Master of Law degree from the VUB. Mr. de Gucht is a Belgian citizen. Senior management Karyn Ovelmen, 54, is a non-executive and independent director of ArcelorMittal as well as the chairman of the Audit & Risk Committee. Most recently she served as Executive Vice President and Chief Financial Officer of Flowserve, a leading provider of flow control products and services for the global infrastructure market, a position that she held from June 2015 to February Previously, she also served as Chief Financial Officer and Executive Vice President of LyondellBasell Industries NV from 2011 to May 2015, as Executive Vice President and Chief Financial Officer of Petroplus Holdings AG from May 2006 to September 2010 and as Executive Vice President and Chief Financial Officer of Argus Services Corporation from 2005 to Prior to that, she was Vice President of External Reporting and Investor Relations for Premcor Refining Group Inc. She also spent 12 years with PricewaterhouseCoopers, primarily serving energy industry accounts. Mrs. Ovelmen is also a member of the Gates Industrial Corporation plc. Board of Name Age1 On December 15, 2015, the Company announced that it would simplify its management structure in-line with the ongoing drive to promote a performance-driven culture, empowering the segments to deliver optimum business results. As a result the GMB, which was established to ensure a smooth integration following the creation of ArcelorMittal, was replaced, effective January 1, 2016, with a more flexible structure. As of December 31, 2016 and 2017, ArcelorMittal s senior management is comprised of the CEO Office supported by six other Executive Officers. ArcelorMittal s CEO Office is comprised of the Chief Executive Officer ( CEO ), Mr. Lakshmi N. Mittal and the Chief Financial Officer ( CFO ), Mr. Aditya Mittal. Together, the Executive Officers are responsible for the implementation of the Company strategy, overall management of the business and all operational decisions. Position Lakshmi N. Mittal 67 Chairman and Chief Executive Officer of ArcelorMittal Aditya Mittal 41 Chief Financial Officer of ArcelorMittal, Investor Relations, and Chief Executive Officer of ArcelorMittal Europe Brian Aranha 62 Executive vice president, head of strategy, CTO, R&D, CCM, and global automotive Henri Blaffart 62 Executive vice president, group head of HR and corporate services Jefferson de Paula 59 Executive vice president, CEO ArcelorMittal South America Long Robrecht Himpe 59 Executive vice president, president and CEO AM/NS Calvert, CEO ArcelorMittal North America Geert Van Poelvoorde 52 Executive vice president, CEO ArcelorMittal Europe Flat Simon C. Wandke 58 Executive vice president, CEO ArcelorMittal Mining 1. Age as of December 31,
48 48 Management report Lakshmi N. Mittal (See Board of Directors ). Aditya Mittal, 41, is the Group CFO and CEO Europe of ArcelorMittal. Prior to the merger that created the Company, he was President and Chief Financial Officer of Mittal Steel Company. In that role, he initiated and led the Company s offer for Arcelor, creating the world s first 100 million tonnes plus steel company. Mr. Mittal joined Mittal Steel in January 1997, holding various finance and management roles. In 1999, he was appointed Head of Mergers and Acquisitions. In this position, he led the Company s acquisition strategy, resulting in Mittal Steel s expansion into Central Europe, Africa and the United States. Subsequently he was also involved in post-integration, turnaround and improvement strategies regarding the acquired companies. In 2008, Mr. Mittal was named European Business Leader of the Future by CNBC Europe and was ranked fourth in Fortune magazine s 40 under 40 list in Mr. Mittal is an active philanthropist with particular interests in child health. Together with his wife Megha, he is a significant supporter of the Great Ormond Street Children s Hospital in London, having funded the Mittal Children s Medical Centre, which provides 240 beds, 6 operating theatres and more than 26,800 sq metres of state of the art clinical space. In India, the couple work closely with UNICEF, funding the first ever country-wide, statistically relevant survey into child nutrition, surveying in person more than 120,000 children and adolescents aged 0-19 years. The survey results will be used by the Government of India to inform relevant policy. Mr. Mittal serves on the board of Aperam, is Chairman of India s second largest refinery, Hindustan Mittal Energy Limited (HMEL), is a board member at the Wharton School and a board member at Iconiq Capital. He is also a trustee at Brookings Institute and an alumni of the World Economic Forum Young Global Leader s Programme. Mr. Mittal holds a Bachelor s degree in Economics with concentrations in Strategic Management and Corporate Finance from the Wharton School in Pennsylvania, United States. Mr. Aditya Mittal is the son of Mr. Lakshmi N. Mittal. Mr. Aditya Mittal is a citizen of India. Brian Aranha, 62, is executive vice president of ArcelorMittal. He joined Dofasco in 1979 as a member of the company's Research and Development Department. In 1989, he was assigned to the American Iron & Steel Institute (AISI) in Washington, D.C. and in 1991 he was part of a Canadian consortium conducting a study for the World Bank on restructuring the Polish steel industry. In 1992, Brian returned to Dofasco where he held various positions in Supply Chain, Quality, Technology and Commercial sections until 2003 when he was named Vice President Commercial. Mr. Aranha took up additional responsibilities as Vice President, NAFTA automotive, after integration into ArcelorMittal in He moved to Europe as CMO and head of Global Automotive in 2009 followed by other assignments in NAFTA region in Currently based in Luxembourg, Mr. Aranha has responsibility for Global Automotive, R&D, Strategy, Commercial Coordination and Automotive Joint Ventures in India and China. Mr. Aranha holds a Bachelor of Applied Science degree from the University of Toronto, Canada. In addition, he has completed the Executive Development Program at Queen's University, School of Business, Canada. Mr. Aranha is a citizen of Canada. Henri Blaffart, 62, is a member of the group management committee. He was appointed head of corporate services (including currently communication, corporate responsibility, legal, capital goods, shipping and, IT) in January 2014, in addition to his role as head of human resources (HR) for the Group, which he took on in April Before taking up his position at corporate level, Mr. Blaffart was head of HR for the Company s Flat Carbon Europe segment and a member of the segment management committee, a position he took up in April Previously he was CEO of ArcelorMittal Lorraine in France, having first been head of primary for the same operation. Mr. Blaffart joined the Cokerill Sambre group in 1982 in its construction business unit. He has held different positions in the Cokerill Sambre group, including CEO of operational units. After the merger between Usinor and Cokerill Sambre Group, he held a number of other positions in the company including R&D director for construction and CEO of the former Arcelor's research division. He is a civil engineer from the University of Liège and holds a masters degree in general management from the Ecole D'entreprise pour le Perfectionnement au Management in Belgium. Mr. Blaffart is a citizen of Belgium. Jefferson de Paula, 59, is a member of the group management committee who joined the group in 1991 as Meltshop Manager of Cariacica s plant (Brazil) and became the plant s General Manager in In 2001, he moved to Acindar in Argentina as COO and was appointed its Industrial and Commercial Vice President in In 2008, he joined Long Carbon Europe as COO of the Sections, Rails and Piles business division, later becoming CEO of Long Carbon Europe - South Division. In 2011, he was named CEO of Long Carbon Americas, which in 2014 became Long Carbon Central & South America. Mr. de Paula holds a Bachelor s Degree in metallurgical engineering from Universidade Federal Fluminense (Brazil), a Master s Degree in finance and marketing from Universidad Austral (Argentina) and has attended to senior executive courses from Insead (France) and from Kellogg Northwestern University (USA). In addition to his position in the Group, Mr. de Paula is the current President of the Latin America s Steel Association (Alacero), he sits in the board of directors of Brazil s Steel Association (Aço Brasil) and in the Strategic Board of the Industry Association of the State of Minas Gerais (FIEMG). Mr. de Paula is a citizen of Brazil. Robrecht Himpe, 59, is a member of the group management committee. He started his career at the Sidmar Gent hot strip mill in 1981 and became responsible for its cold rolling department in In 2001, he was
49 Management report appointed operational director of Bremen, before becoming operational director of Asturias in In 2006, he became vice president FCWE upstream and then chief operating officer in In 2008, he pursued his career as Chief Executive Officer of Flat Carbon Europe, before being appointed as health and safety and chief technology officer, positions he held until December In July 2016, he was appointed Chief Executive Officer of ArcelorMittal North America, a role he has been holding in addition to his responsibilities as President and Chief Executive Officer of AM/NS Calvert. Mr. Himpe is an electro-technical engineer and a graduate of the University of Ghent. Mr. Himpe is a citizen of Belgium. Geert Van Poelvoorde, 52, is a member of the group management committee. He started his career in 1989 as a project engineer at the Sidmar Gent hot strip mill, where he held several senior positions in the automation and process computer department. He moved to Stahlwerke Bremen in 1995 as senior project manager. Between 1998 and 2002, he headed a number of departments, and in 2003 he was appointed director of Stahlwerke Bremen, responsible for operations and engineering. In 2005, Mr. Van Poelvoorde returned to ArcelorMittal Gent to take up the position of Chief Operating Officer. In 2008, he became Chief Executive Officer of ArcelorMittal Gent with direct responsibility for primary operations. He was appointed Chief Executive Officer of the Business Division North within Flat Carbon Europe in 2009 and in January 2014, he was appointed Chief Executive Officer of Flat Carbon Europe and Purchasing. Since November 2015 he is also president of Eurofer, the European steel federation. He graduated from the University of Ghent with a degree in civil engineering and electronics. Mr. Van Poelvoorde is a citizen of Belgium. Simon C. Wandke, 58, is a member of the group management committee and he joined ArcelorMittal in January 2011 as chief commercial officer of ArcelorMittal Mining. He has over 30 years experience in the mining and minerals industry, starting his career in 1981 at BHP, where he held positions in mines in Australia and Indonesia and held other commercial offices globally until He then joined Destra Consulting Group as Partner before becoming Chief Marketing Officer for Ferrexpo plc in 2006 based in Hong Kong, Switzerland & United Kingdom. Simon is a graduate of the Australian Institute of Company Directors with a diploma in Company Directorship. He also holds a post graduate diploma in Corporate Finance from Swinburne University as well as a B.A., Psych, Marketing (Comm) from the University of Melbourne. Mr. Wandke holds dual citizenship in Australia and the United Kingdom. Board practices/corporate governance This section describes the corporate governance practices of ArcelorMittal for the year ended December 31, Board of Directors and senior management ArcelorMittal is governed by a Board of Directors and managed by the senior management. ArcelorMittal s senior management is comprised of the CEO Office - comprising the CEO, Mr. Lakshmi N. Mittal and the CFO, Mr. Aditya Mittal. The CEO Office is supported by a team of six other Executive Officers, who together encompass the key regions and corporate functions. A number of corporate governance provisions in the Articles of Association of ArcelorMittal reflect provisions of the Memorandum of Understanding signed on June 25, 2006 (prior to Mittal Steel Company N.V. s merger with Arcelor), amended in April 2008 and which mostly expired on August 1, For more information about the Memorandum of Understanding, see "Memorandum and articles of association". ArcelorMittal fully complies with the 10 Principles of Corporate Governance of the Luxembourg Stock Exchange. ArcelorMittal also complies with the New York Stock Exchange Listed Company Manual as applicable to foreign private issuers. Board of Directors Composition The Board of Directors is in charge of the overall governance and direction of ArcelorMittal. It is responsible for the performance of all acts of administration necessary or useful in furtherance of the corporate purpose of ArcelorMittal, except for matters reserved by Luxembourg law or the Articles of Association to the general meeting of shareholders. The Articles of Association provide that the Board of Directors is composed of a minimum of three and a maximum of 18 members, all of whom, except the CEO, must be non-executive directors. None of the members of the Board of Directors, except for the CEO, may hold an executive position or executive mandate within ArcelorMittal or any entity controlled by ArcelorMittal. The Articles of Association provide that directors are elected and removed by the general meeting of shareholders by a simple majority of votes cast. Other than as set out in the Company s Articles of Association, no shareholder has any specific right to nominate, elect or remove directors. Directors are elected by the general meeting of shareholders for three-year terms. In the event that a vacancy arises on the Board of Directors for any reason, the remaining members of the Board of Directors may by a simple majority elect a new director to temporarily fulfill the duties attaching to the vacant post until the next general meeting of the shareholders. In 2017, the Board of Directors proposed Mr. Bruno Lafont to serve as the new Lead Independent Director as well as the Chairman of the Appointments, Remuneration and
50 50 Management report Corporate Governance Committee, which was approved at the ArcelorMittal annual general shareholders' meeting held on May 10, Likewise, the Board of Directors also took note of Mr. Narayanan Vaghul s decision to resign from the Board of Directors on May 10, Mrs. Karyn Ovelmen succeeded Mr. Narayanan Vaghul as the Chairman of the Audit & Risk Committee. The Board of Directors is comprised of nine members, of which 8 are non-executive directors and one is an executive director. The CEO of ArcelorMittal is the sole executive director. Mr. Lakshmi N. Mittal was elected Chairman of the Board of Directors on May 13, Mr. Mittal is also ArcelorMittal s CEO. Mr. Mittal was re-elected to the Board of Directors for a three-year term at the annual general meeting of shareholders on May 10, Five of the 9 members of the Board of Directors are independent. The non-independent directors are Mr. Lakshmi N. Mittal, Ms. Vanisha Mittal Bhatia, Mr. Jeannot Krecké and Mr. Michel Wurth. A director is considered independent if: (a) he or she is independent within the meaning of the New York Stock Exchange Listed Company Manual, as applicable to foreign private issuers, (b) he or she is unaffiliated with any shareholder owning or controlling more than two percent of the total issued share capital of ArcelorMittal, and (c) the Board of Directors makes an affirmative determination to this effect. For these purposes, a person is deemed affiliated to a shareholder if he or she is an executive officer, a director who also is an employee, a general partner, a managing member or a controlling shareholder of such shareholder. The 10 Principles of Governance of the Luxembourg Stock Exchange, which constitute ArcelorMittal's domestic corporate governance code, require ArcelorMittal to define the independence criteria that apply to its directors, which are described in article 8.1 of its Articles of Association. Specific characteristics of the director role The Company s Articles of Association do not require directors to be shareholders of the Company. The Board of Directors nevertheless adopted a share ownership policy on October 30, 2012, that was amended on November 7, 2017, considering that it is in the best interests of all shareholders for all non-executive directors to acquire and hold a minimum number of ArcelorMittal ordinary shares in order to better align their long-term interests with those of ArcelorMittal s shareholders. The Board of Directors believes that this share ownership policy will result in a meaningful holding of ArcelorMittal shares by each nonexecutive director, while at the same time taking into account the fact that the share ownership requirement should not be excessive in order not to unnecessarily limit the pool of available candidates for appointment to the Board of Directors. Directly or indirectly, and as sole or joint beneficiary owner (e.g., with a spouse or minor children), within five years of the earlier of October 30, 2012 or the relevant person s election to the Board of Directors, the Lead Independent Director should own a minimum of 6,000 ordinary shares and each other non-executive director should own a minimum of 4,000 ordinary shares. Each director will hold the shares acquired on the basis of this policy for so long as he or she serves on the Board of Directors. Directors purchasing shares in compliance with this policy must comply with the ArcelorMittal Insider Dealing Regulations and, in particular, refrain from trading during any restricted period, including any such period that may apply immediately after the Director s departure from the Board of Directors for any reason. On October 30, 2012, the Board of Directors also adopted a policy that places limitations on the terms of independent directors as well as the number of directorships that directors may hold in order to align the Company s corporate governance practices with best practices in this area. The policy provides that an independent director may not serve on the Board of Directors for more than 12 consecutive years, although the Board of Directors may, by way of exception to this rule, make an affirmative determination, on a case-by-case basis, that he or she may continue to serve beyond the 12-year rule if the Board of Directors considers it to be in the best interest of the Company based on the contribution of the Director involved and the balance between the knowledge, skills, experience and need for renewal of the Board. As membership of the Board of Directors represents a significant time commitment, the policy requires both executive and non-executive directors to devote sufficient time to the discharge of their duties as a director of ArcelorMittal. Directors are therefore required to consult with the Chairman and the Lead Independent Director before accepting any additional commitment that could conflict with or impact the time they can devote to their role as a Director of ArcelorMittal. Furthermore, a non-executive director may not serve on the boards of directors of more than four publicly listed companies in addition to the ArcelorMittal Board of Directors. However, a non-executive Director s service on the board of directors of any subsidiary or affiliate of ArcelorMittal or of any non-publicly listed company is not taken into account for purposes of complying with the foregoing limitation. Although non-executive directors of ArcelorMittal who change their principal occupation or business association are not necessarily required to leave the Board of Directors, the policy requires each non-executive director, in such
51 Management report 51 circumstances, promptly to inform the Board of Directors of the action he or she is contemplating. Should the Board of Directors determine that the contemplated action would generate a conflict of interest, such non-executive director would be asked to tender his or her resignation to the Chairman of the Board of Directors, who would decide to accept the resignation or not. Company s corporate purpose. The Board of Directors (including its two committees) has its own budget, which covers functioning costs such as external consultants, continuing education activities for directors and travel expenses. None of the members of the Board of Directors, including the executive director, have entered into service contracts with ArcelorMittal or any of its subsidiaries that provide for any form of remuneration or for benefits upon the termination of their term. All non-executive Directors of the Company signed the Company s Appointment Letter, which confirms the conditions of their appointment by the General Meeting of the Shareholders including compliance with certain non-compete provisions, the 10 Principles of Corporate Governance of the Luxembourg Stock Exchange and the Company s Code of Business Conduct. The Board of Directors meets when convened by the Chairman of the Board or any two members of the Board of Directors. The Board of Directors holds physical meetings at least on a quarterly basis as five regular meetings are scheduled per year. The Board of Directors holds additional meetings if and when circumstances require, in person or by teleconference and can take decisions by written circulation, provided that all members of the Board of Directors agree. All members of the Board of Directors are required to sign the Company s Code of Business Conduct upon first joining the Board of Directors and confirm their adherence thereto on an annual basis thereafter. The remuneration of the members of the Board of Directors is determined on a yearly basis by the annual general meeting of shareholders. Share transactions by management In compliance with laws prohibiting insider dealing, the Board of Directors of ArcelorMittal has adopted insider dealing regulations, which apply throughout the ArcelorMittal group. These regulations are designed to ensure that insider information is treated appropriately within the Company and avoid insider dealing and market manipulation. Any breach of the rules set out in this procedure may lead to criminal or civil charges against the individuals involved, as well as disciplinary action by the Company. Shareholding requirement for non-executive directors In consideration of corporate governance trends indicating that a reasonable amount of share ownership helps better align the interests of the directors with those of all shareholders, the Board of Directors adopted on October 30, 2012 share ownership guidelines for non-executive directors as described above under Specific characteristics of the director role. This share ownership guidelines have been amended on November 7, Operation General The Board of Directors and the Board committees may engage the services of external experts or advisers as well as take all actions necessary or useful to implement the Meetings The Board of Directors held eight meetings in The average attendance rate of the directors at the Board of Directors meetings was 93%. In order for a meeting of the Board of Directors to be validly held, a majority of the directors must be present or represented, including at least a majority of the independent directors. In the absence of the Chairman, the Board of Directors will appoint by majority vote a chairman for the meeting in question. The Chairman may decide not to participate in a Board of Directors meeting, provided he has given a proxy to one of the directors who will be present at the meeting. For any meeting of the Board of Directors, a director may designate another director to represent him or her and vote in his or her name, provided that the director so designated may not represent more than one of his or her colleagues at any time. Each director has one vote and none of the directors, including the Chairman, has a casting vote. Decisions of the Board of Directors are made by a majority of the directors present and represented at a validly constituted meeting, except for the decisions of the Board of Directors relating to the issue of any financial instruments carrying or potentially carrying a right to equity pursuant to the authorization conferred by article 5.5 of the Articles of Association, which shall be taken by a majority of two-thirds of the directors present or represented at a validly constituted meeting. Lead Independent Director In April 2008, the Board of Directors created the role of Lead Independent Director. His or her function is highlighted above. Mr. Bruno Lafont was elected by the Board of Directors as ArcelorMittal's second Lead Independent Director and reelected as a director for a three-year term at ArcelorMittal annual general shareholder's meeting held on May 10, 2017.
52 52 Management report The agenda of each meeting of the Board of Directors is decided jointly by the Chairman of the Board of Directors and the Lead Independent Director. Separate meetings of independent directors The independent members of the Board of Directors may schedule meetings outside the presence of nonindependent directors. Four meetings of the independent directors outside the presence of management and nonindependent directors were held in Annual self-evaluation The Board of Directors decided in 2008 to start conducting an annual self-evaluation of its functioning in order to identify potential areas for improvement. The first selfevaluation process was carried out in early The selfevaluation process includes structured interviews between the Lead Independent Director and each director and covers the overall performance of the Board of Directors, its relations with senior management, the performance of individual directors, and the performance of the committees. The process is supported by the Company Secretary under the supervision of the Chairman and the Lead Independent Director. The findings of the self-evaluation process are examined by the ARCG Committee and presented with recommendations from the ARCG Committee to the Board of Directors for adoption and implementation. Suggestions for improvement of the Board of Directors process based on the prior year s performance and functioning are implemented during the following year. The 2017 Board of Directors self-evaluation was completed by the Board on January 29, The Board of Directors was of the opinion that it and the management had cooperated successfully during 2017 on important matters including operational and financial performance, Ilva acquisition, the ongoing strengthening of the balance sheet, strategy, sustainability, labor relations and health and safety. The Board of Directors reviewed the practical implementation of the governance structure and thought it was working well. The Board set new priorities for discussion and review and identified a number of priority topics for The Board of Directors believes that its members have the appropriate range of skills, knowledge and experience, as well as the degree of diversity, necessary to enable it to effectively govern the business. The Board of Directors composition is reviewed on a regular basis and additional skills and experience are actively searched for in line with the expected development of ArcelorMittal s business as and when appropriate. Required skills, experience and other personal characteristics Diverse skills, backgrounds, knowledge, experience, geographic location, nationalities and gender are required in order to effectively govern a global business the size of the Company s operations. The Board of Directors and its committees are therefore required to ensure that the Board has the right balance of skills, experience, independence and knowledge necessary to perform its role in accordance with the highest standards of governance. The Company s directors must demonstrate unquestioned honesty and integrity, preparedness to question, challenge and critique constructively, and a willingness to understand and commit to the highest standards of governance. They must be committed to the collective decision-making process of the Board of Directors and must be able to debate issues openly and constructively, and question or challenge the opinions of others. Directors must also commit themselves to remain actively involved in Board decisions and apply strategic thought to matters at issue. They must be clear communicators and good listeners who actively contribute to the Board in a collegial manner. Each director must also ensure that no decision or action is taken that places his or her interests in front of the interests of the business. Each director has an obligation to protect and advance the interests of the Company and must refrain from any conduct that would harm it. In order to govern effectively, non-executive directors must have a clear understanding of the Company s strategy, and a thorough knowledge of the ArcelorMittal group and the industries in which it operates. Non-executive directors must be sufficiently familiar with the Company s core business to effectively contribute to the development of strategy and monitor performance. With specific regard to the non-executive directors of the Company, the composition of the group of non-executive directors should be such that the combination of experience, knowledge and independence of its members allows the Board to fulfill its obligations towards the Company and other stakeholders in the best possible manner. The ARCG Committee ensures that the Board of Directors is comprised of high-caliber individuals whose background, skills, experience and personal characteristics enhance the overall profile of the Board and meets its needs and diversity aspirations by nominating high quality candidates for election to the Board by the general meeting of shareholders. Board profile The key skills and experience of the directors, and the extent to which they are represented on the Board of Directors and its committees, are set out below. In summary, the non-executive directors contribute:
53 Management report international and operational experience; understanding of the industry sectors in which ArcelorMittal operates; knowledge of world capital markets and being a company listed in several jurisdictions; and an understanding of the health, safety, environmental, political and community challenges that ArcelorMittal faces. Each director is required to adhere to the values set out in, and sign, the ArcelorMittal Code of Business Conduct. Renewal The Board of Directors plans for its own succession, with the assistance of the ARCG Committee. In doing this, the Board of Directors: considers the skills, backgrounds, knowledge, experience and diversity of geographic location, nationality and gender necessary to allow it to meet the corporate purpose; assesses the skills, backgrounds, knowledge, experience and diversity currently represented; identifies any inadequate representation of those attributes and agrees the process necessary to ensure a candidate is selected who brings them to the Board of Directors; and reviews how Board performance might be enhanced, both at an individual director level and for the Board as a whole. The Board believes that orderly succession and renewal is achieved through careful planning and by continuously reviewing the composition of the Board. When considering new appointments to the Board, the ARCG Committee oversees the preparation of a position specification that is provided to an independent recruitment firm retained to conduct a global search, taking into account, among other factors, geographic location, nationality and gender. In addition to the specific skills, knowledge and experience required of the candidate, the specification contains the criteria set out in the ArcelorMittal Board profile. Diversity In line with the worldwide effort to increase gender diversity on the boards of directors of listed and unlisted companies, the Board met its goal of increasing the number of women on the Board to at least three by the end of 2015 with the election of Mrs. Karyn Ovelmen in May Out of 9 members of the Board of Directors, women represent 33.33% in The ArcelorMittal Board s diversity not only 53 relates to gender, but also to the region, background and industry of its members. Director induction, training and development The Board considers that the development of the directors knowledge of the Company, the steel-making and mining industries, and the markets in which the Company operates is an ongoing process. To further bolster the skills and knowledge of directors, the Company set up a continuous development program in Upon his or her election, each new non-executive director undertakes an induction program specifically tailored to his or her needs and includes ArcelorMittal s long-term vision centered on the concept of Safe Sustainable Steel. The Board s development activities include the provision of regular updates to directors on each of the Company s products and markets. Non-executive directors may also participate in training programs designed to maximize the effectiveness of the directors throughout their tenure and link in with their individual performance evaluations. The training and development program may cover not only matters of a business nature, but also matters falling into the environmental, social and governance area. Structured opportunities are provided to build knowledge through initiatives such as visits to plants and mine sites and business briefings provided at Board meetings. Nonexecutive directors also build their Company and industry knowledge through the involvement of the CEO Office and other senior employees in Board meetings. Business briefings, site visits and development sessions underpin and support the Board s work in monitoring and overseeing progress towards the corporate purpose of creating longterm shareholder value through the development of the ArcelorMittal business in steel and mining. The Company therefore continuously builds directors knowledge to ensure that the Board remains up-to-date with developments within the Company s segments, as well as developments in the markets in which the Company operates. During the year, non-executive directors participated in the following activities: comprehensive business briefings intended to provide each director with a deeper understanding of the Company s activities, environment, key issues and strategy of the Company s segments. These briefings are provided to the Board of Directors by senior executives, including CEO Office members. The briefings provided during the course of 2017 covered health and safety processes, HR, legal and compliance, corporate responsibility, marketing, steel-making, strategy, international trade trends in steel industry in Europe. Certain business briefings were combined with site visits and thus took place on-site and, in other cases, they took place at Board meetings;
54 54 Management report briefing meetings with Company executives in charge of specific business segments or markets; site visits to plants and R&D centers; and development sessions on specific topics of relevance, such as health and safety, commodity markets, HR, investor relations, accounting, the world economy, changes in corporate governance standards, directors duties and shareholder feedback. The ARCG Committee oversees director training and development. This approach allows induction and learning opportunities to be tailored to the directors committee memberships, as well as the Board of Directors' specific areas of focus. In addition, this approach ensures a coordinated process in relation to succession planning, Board renewal, training, development and committee composition, all of which are relevant to the ARCG Committee s role in securing the supply of talent to the Board. Board of Directors committees The Board of Directors has two committees: the Audit & Risk Committee, and the ARCG Committee. Audit & Risk Committee In 2015, the Board decided to combine the Audit Committee with the Risk Management Committee in order to provide their members with a more holistic view of ArcelorMittal s current governance, risks and control systems. The primary function of the Audit & Risk Committee is to assist the Board in fulfilling its oversight responsibilities by reviewing; the integrity of the financial reports and other financial information provided by the Company to any governmental body or the public; the Company s compliance with legal and regulatory requirements; the registered public accounting firm s (Independent Auditor) qualifications and independence; the Company s system of internal control regarding finance, accounting, legal compliance, ethics and risk management that management and the Board have established; the Company s auditing, accounting and financial reporting processes generally; and the identification and management of risks to which the ArcelorMittal group is exposed. The Audit & Risk Committee must be composed solely of independent members of the Board of Directors. The members are appointed by the Board of Directors each year after the annual general meeting of shareholders. The Audit & Risk Committee comprises three members, all of whom must be independent under the company s corporate governance guidelines, the New York Stock Exchange (NYSE) standards as applicable to foreign private issuers and the 10 Principles of Corporate Governance of the Luxembourg Stock Exchange. The Audit & Risk Committee makes decisions by a simple majority with no member having a casting vote. At least one member must qualify as an Audit & Risk Committee financial expert as defined by the SEC and determined by the Board. At least one member must qualify as an Audit & Risk Committee risk management expert having experience in identifying, assessing, and managing risk exposures of large, complex companies. The Audit & Risk Committee currently consists of 3 members: Mrs. Karyn Ovelmen, Mr. Bruno Lafont and Mr. Karel de Gucht, each of whom is an independent Director according to the NYSE standards and the 10 Principles of Corporate Governance of the Luxembourg Stock Exchange. The Chairman of the Audit & Risk Committee is Mrs. Ovelmen. According to its charter, the Audit & Risk Committee is required to meet at least four times a year. During 2017, the Audit & Risk Committee met five times. The Audit & Risk Committee performs an annual self-evaluation and completed its 2017 self-evaluation on January 29, The charter of the Audit & Risk Committee is available from ArcelorMittal upon request. Appointments, Remuneration and Corporate Governance Committee The ARCG Committee is comprised of three directors, each of whom is independent under the New York Stock Exchange standards as applicable to foreign private issuers and the 10 Principles of Corporate Governance of the Luxembourg Stock Exchange. The members are appointed by the Board of Directors each year after the annual general meeting of shareholders. The ARCG Committee makes decisions by a simple majority with no member having a casting vote. The Board of Directors has established the ARCG Committee to: determine, on its behalf and on behalf of the shareholders within agreed terms of reference, ArcelorMittal s compensation framework, including short and long term
55 Management report incentives for the CEO, the CFO and for six other Executive Officers; review and approve succession and contingency plans for key managerial positions at the level of the Executive Officers consider any candidate for appointment or reappointment to the Board of Directors at the request of the Board of Directors and provide advice and recommendations to it regarding the same; evaluate the functioning of the Board of Directors and monitor the Board of Directors self-evaluation process; assess the roles of the Chairman and CEO and deliberate on the merits of the Board s leadership structure to ensure that the most efficient and appropriate structure is in place; and develop, monitor and review corporate governance principles and corporate responsibility policies applicable to ArcelorMittal, as well as their application in practice. The ARCG Committee s principal criteria in determining the compensation of executives is to encourage and reward performance that will lead to long-term enhancement of shareholder value. The ARCG Committee may seek the advice of outside experts. The three members of the ARCG Committee are Mr. Bruno Lafont, Mrs. Suzanne P. Nimocks and Mr. Tye Burt, each of whom is independent in accordance with the NYSE standards applicable to foreign private issuers and the 10 Principles of Corporate Governance of the Luxembourg Stock Exchange. The Chairman of the ARCG Committee is Mr. Lafont. The ARCG Committee is required to meet at least twice a year. During 2017, this committee met eight times. The ARCG Committee performs an annual self-evaluation and completed its 2017 self-evaluation on January 29, The charter of the ARCG Committee is available from ArcelorMittal upon request. Succession management Succession management at ArcelorMittal is a systematic, structured process for identifying and preparing employees with potential to fill key organizational positions, should the position become vacant. This process applies to all ArcelorMittal key positions up to and including the CEO Office. Succession management aims to ensure the continued effective performance of the organization by providing for the availability of experienced and capable employees who are prepared to assume these roles as they become available. For each position, candidates are 55 identified based on performance, potential and an assessment of leadership capabilities and their years to readiness. Development needs linked to the succession plans are discussed, after which Personal Development Plans are put in place, to accelerate development and prepare candidates. Regular reviews of succession plans are conducted at different levels of the organization to ensure that they are accurate and up to date, leading to at least once yearly a formal review by the CEO Office, of all key positions. Succession management is a necessary process to reduce risk of vacant positions or skill gap transitions, create a pipeline of future leaders, ensure smooth business continuity and improve employee motivation and engagement. This process has been in place for several years and reinforced, widened and made more systematic in all regions of the organization. The responsibility to review and approve succession plans and contingency plans at the highest level rests with the Board s ARCG Committee. Other corporate governance practices ArcelorMittal is committed to adhere to best practices in terms of corporate governance in its dealings with shareholders and aims to ensure good corporate governance by applying rules on transparency, quality of reporting and the balance of powers. ArcelorMittal continually monitors U.S., EU and Luxembourg legal requirements and best practices in order to make adjustments to its corporate governance controls and procedures when necessary, as evidenced by the new policies adopted by the Board of Directors in ArcelorMittal complies with the 10 Principles of Corporate Governance of the Luxembourg Stock Exchange in all respects. However, in respect of Recommendation 1.3 under the Principles, which advocates separating the roles of chairman of the board and the head of the executive management body, the Company has made a different choice. This is permitted, however, as, unlike the 10 Principles themselves with which ArcelorMittal must comply, the Recommendations are subject to a more flexible comply or explain standard. The nomination of the same person to both positions was approved by the shareholders (with the Significant Shareholder abstaining). Since that date, the rationale for combining the positions of CEO and Chairman of the Board of Directors has become even more compelling. The Board of Directors is of the opinion that Mr. Mittal s strategic vision for the steel industry in general and for ArcelorMittal in particular in his role as CEO is a key asset to the Company, while the fact that he is fully aligned with the interests of the Company s shareholders means that he is uniquely positioned to lead the Board of Directors in his role as Chairman. The combination of these roles was revisited at the Annual General Meeting of Shareholders of the Company held in May 2017, when Mr. Lakshmi N. Mittal
56 56 Management report was re-elected to the Board of Directors for another three year term by a strong majority. Ethics and conflicts of interest Ethics and conflicts of interest are governed by ArcelorMittal s Code of Business Conduct, which establishes the standards for ethical behavior that are to be followed by all employees and Directors of ArcelorMittal in the exercise of their duties. Each employee of ArcelorMittal is required to sign and acknowledge the Code of Conduct upon joining the Company. This also applies to the members of the Board of Directors of ArcelorMittal, who signed the Company s Appointment Letter in which they acknowledged their duties and obligations. Any new member of the Board of Directors must sign and acknowledge the Code of Conduct upon appointment. Employees must always act in the best interests of ArcelorMittal and must avoid any situation in which their personal interests conflict, or could conflict, with their obligations to ArcelorMittal. Employees are prohibited from acquiring any financial or other interest in any business or participating in any activity that could deprive ArcelorMittal of the time or the attention needed to devote to the performance of their duties. Any behavior that deviates from the Code of Business Conduct is to be reported to the employee s supervisor, a member of the management, the head of the legal department or the head of the internal assurance department. Code of Business Conduct training is offered throughout ArcelorMittal on a regular basis in the form of face-to-face trainings, webinars and online trainings. Employees are periodically trained about the Code of Business Conduct in each location where ArcelorMittal has operations. The Code of Business Conduct is available in the Corporate Governance-Our Policeis-Code of Business Conduct section of ArcelorMittal s website at In addition to the Code of Business Conduct, ArcelorMittal has developed a Human Rights Policy and a number of other compliance policies in more specific areas, such as antitrust, anti-corruption, economic sanctions and insider dealing. In all these areas, specifically targeted groups of employees are required to undergo specialized compliance training. Furthermore, ArcelorMittal s compliance program also includes a quarterly compliance certification process covering all business segments and entailing reporting to the Audit & Risk Committee. Process for Handling Complaints on Accounting Matters As part of the procedures of the Board of Directors for handling complaints or concerns about accounting, internal controls and auditing issues, ArcelorMittal s Anti-Fraud Policy and Code of Business Conduct encourage all employees to bring such issues to the Audit & Risk Committee s attention on a confidential basis. In accordance with ArcelorMittal s Anti-Fraud and Whistleblower Policy, concerns with regard to possible fraud or irregularities in accounting, auditing or banking matters or bribery within ArcelorMittal or any of its subsidiaries or other controlled entities may also be communicated through the Corporate Governance Whistleblower section of the ArcelorMittal website at where ArcelorMittal s Anti-Fraud Policy and Code of Business Conduct are also available in each of the main working languages used within the Group. In recent years, ArcelorMittal has implemented local whistleblowing facilities, as needed. During 2017, there were 143 complaints received relating to alleged fraud, which were referred to and duly reviewed by the Company s Internal Assurance Department. Following review by the Audit & Risk Committee, none of these complaints was found to be significant. Internal assurance ArcelorMittal has an Internal Assurance function that, through its Head of Internal Assurance, reports to the Audit & Risk Committee. The function is staffed by full-time professional staff located within each of the principal operating subsidiaries and at the corporate level. Recommendations and matters relating to internal control and processes are made by the Internal Assurance function and their implementation is regularly reviewed by the Audit & Risk Committee. Independent auditors The appointment and determination of fees of the independent auditors is the direct responsibility of the Audit & Risk Committee. The Audit & Risk Committee is further responsible for obtaining, at least once each year, a written statement from the independent auditors that their independence has not been impaired. The Audit & Risk Committee has also obtained a confirmation from ArcelorMittal s principal independent auditors to the effect that none of its former employees are in a position within ArcelorMittal that may impair the principal auditors independence. Measures to prevent insider dealing and market manipulation The Board of Directors of ArcelorMittal has adopted Insider Dealing Regulations ( IDR ), which are updated when necessary and in relation to which training is conducted throughout the Group. The IDR s most recent version has been updated in light of the new Market Abuse Regulation and is available on ArcelorMittal s website, The IDR apply to the worldwide operations of ArcelorMittal. The compliance and data protection officer of ArcelorMittal is also the IDR compliance officer and answers questions that members of senior management, the Board of
57 Management report 57 Directors, or employees may have about the IDR s interpretation. The IDR compliance officer maintains a list of insiders as required by Regulation No 596/2014 of the European Parliament and the Council dated 16 April 2014 on market abuse or MAR and the Commission Implementing Regulation 2016/347 of 10 March 2016 laying down technical standards with regard to the precise format of insider lists and for updating insider lists in accordance with MAR. The IDR compliance officer may assist senior executives and directors with the filing of notices required by Luxembourg law to be filed with the Luxembourg financial regulator, the CSSF (Commission de Surveillance du Secteur Financier). Furthermore, the IDR compliance officer has the power to conduct investigations in connection with the application and enforcement of the IDR, in which any employee or member of senior management or of the Board of Directors is required to cooperate. the IDR was again reiterated in the Group Policies and Procedures Manual in Basic director s remuneration: 144,000 ($151,790); Selected new employees of ArcelorMittal are required to participate in a training course about the IDR upon joining ArcelorMittal and every three years thereafter. The individuals who must participate in the IDR training include the members of senior management, employees who work in finance, legal, sales, mergers and acquisitions and other areas that the Company may determine from time to time. In addition, ArcelorMittal s Code of Business Conduct contains a section on Trading in the Securities of the Company that emphasizes the prohibition to trade on the basis of inside information, as amended in July An online interactive training tool based on the IDR was developed in 2010 and deployed across the group through ArcelorMittal s intranet, with the aim to enhance the staff s awareness of the risks of sanctions applicable to insider dealing. The importance of Lead Independent Director s remuneration: 204,000 ($215,036); Additional remuneration for the Chair of the Audit & Risk Committee: 28,000 ($29,515); Additional remuneration for the other Audit & Risk Committee members: 17,000 ($17,920); Additional remuneration for the Chairs of the other committees: 16,000 ($16,866); and Additional remuneration for the members of the other committees: 11,000 ($11,595). Compensation Board of Directors Directors fees The ARCG Committee of the Board of Directors prepares proposals on the remuneration to be paid annually to the members of the Board of Directors. At the May 10, 2017 annual general meeting of shareholders, the shareholders approved the annual remuneration for non-executive directors for the 2016 financial year, based on the following annual fees: The total annual remuneration of the members of the Board of Directors paid in 2017 and 2016 was as follows: Year ended December 31, (Amounts in $ thousands except Long-term incentives information) Base salary1 $ 1,505 $ 1,550 Director fees $ 1,744 $ 1,901 Short-term performance-related bonus 1 Long-term incentives 1, Chairman and CEO only. Slight differences between the years are possible, due to foreign currency effects. See "Remuneration - Long-term incentives plan". $ 2,333-49, ,214
58 58 Management report The annual remuneration paid for 2017 and 2016 to the current and former members of the Board of Directors for services in all capacities was as follows: (Amounts in $ thousands except share information) Short-term Incentives Short-term Incentives Lakshmi N. Mittal 1,505 1,550 2, Long-term Number of PSUs 49, Wilbur L. Ross, Jr Lewis B. Kaden Bruno Lafont Tye Burt Vanisha Mittal Bhatia Narayanan Vaghul Suzanne P. Nimocks Long-term Number of PSUs 168, Karyn Ovelmen Jeannot Krecké Michel Wurth Antoine Spillmann 2 Karel de Gucht Total ,249 3,451 2,333 49, ,214 Remuneration for non-executive Directors with respect to 2017 (subject to shareholder approval at the annual general meeting to be held on May 9, 2018) will be paid in 2018 and is included in the 2017 column. Remuneration for non-executive Directors with respect to 2016 (paid after shareholder approval at the annual general meeting held on May 10, 2017) is included in the 2016 column. Slight differences between the years are possible, due to foreign currency effects. Mr. de Gucht was elected to ArcelorMittal s Board of Directors on May 4, 2016 and Mr. Spillmann stepped down from the Board in May As of December 31, 2017, ArcelorMittal did not have any loans or advances outstanding to members of its Board of Directors and ArcelorMittal had not given any guarantees in favor of any member of its Board of Directors. The policy of the Company is not to grant any share-based remuneration to members of the Board of Directors who are not executives of the Company. The following tables provide a summary of the options and the exercise price of options and PSUs granted to the Chairman and CEO, who is the sole executive director on the Board of Directors, as of December 31, None of the members of the Board of Directors, including the Chairman and CEO, benefit from an ArcelorMittal pension plan. Options granted in 2010 Lakshmi N. Mittal1 Options granted in 2009 Options granted in 2008 Options Total Weighted Average Exercise Price of Options 18,833 20,000 20,000 58,833 $ $ Term (in years) Expiration date Aug. 3, 2020 Aug. 4, 2019 Aug. 5, 2018 Exercise price 1. The options granted in the table above were revised following the completion of the Company's share consolidation of each three existing shares into one share without nominal value on May 22, Lakshmi N. Mittal2 Term (in years) Vesting date PSUs granted in 2017 PSUs granted in 2016 PSUs granted in , ,214 59, January 1, 2021 January 1, 2020 and January 1, 2022 June 30, 2018 See "Remuneration - Long-term incentives for vesting conditions". The options granted in the table above were revised following the completion of the Company's share consolidation of each three existing shares into one share without nominal value on May 22, The PSUs granted in 2014 gave the right to receive ArcelorMittal shares at the end of the vesting period as the performance conditions set at the date of the grant have been partially met. See 2017 LTI vesting (2014 grants) below for more information.
59 Management report 59 Remuneration at a glance - senior management The following table provides a brief overview of the Company s remuneration policy for senior management. Additional information is provided below. ArcelorMittal's Remuneration Policy Remuneration Salary STI Period Strategy Characteristic Recruitment and retention Delivery of strategic priorities and financial success Reviewed annually by the ARCG Committee considering market data Increases based on Company performance and individual performance Maximum STI award of 225% of base salary for the CEO, 180% for CFO and 135% for Executive Officers 100% STI paid in cash Our first priority Health and Safety is part of the STI Overperformance towards competition LTIP Encourages long term shareholder return Performance share units granted with a face value of 100% of base salary for the CEO and CFO and 60% for Executive Officers Shares vest after a three-year performance period Performance related vesting Key Performance Metrics from 2017 Metrics Scheme EBITDA STI Rationale FCF STI ROCE STI Critical factor for long-term success and sustainability of the Company Gap to competition STI / LTIP Outperform peers Health & Safety STI Employee health and safety is a core value for the Company Business Specific measures STI EPS LTIP TSR LTIP Demonstrates growth and operational performance of the underlying businesses For corporate functions, links reward to strategic priorities of their functions Links reward to delivery of underlying equity returns to shareholders Creates a direct link between executive pay and shareholder value Measure is split equally between comparison against S&P 500 index and a peer group of companies


60 60 Management report Remuneration at a glance Pay outcomes The following graphics compare the compensation paid to the CEO, CFO and other Executive Officers in 2017 and 2016 in thousands of U.S. dollars. Information with respect to total remuneration paid is provided under 2017 Total remuneration below short-term incentives paid in 2017 Executive Realization as % of business target CEO office Lakshmi Mittal Aditya Mittal 135% Corporate Brian Aranha 132% Corporate Henri Blaffart 135% Flat Carbon Europe Geert van Poelvoorde 133% Long Carbon South America Jefferson de Paula 43% Mining Simon Wandke 85% 50% NAFTA 50% Calvert Robrecht Himpe 94% Note: Individual performance not included in the percent of realization.
61 Management report LTI vesting (2014 grants) The following tables provide information about the vesting in 2017 of long-term incentives granted to senior management in prior years. See also note 7.3 to the consolidated financial statements. CEO office TSR Vesting - 50% of overall opportunity EPS Vesting - 50% of overall opportunity The Company s TSR performance was -36.7% for the three-year performance period The Company s EPS performance was 193% for the three-year performance period This was below the threshold compared to the S&P 500 and the peer group performance This was an over-performance As a result, 0% of the TSR component of the 2014 LTIP has vested As a result, 150% of the EPS component of the 2014 LTIP has vested (as set forth in the table below) Number of PSUs granted in 2014 outstanding in 2017 Number of shares vested CEO 42,919 32,189 CFO and other ex-gmb members1 66,422 38, For ex-gmb members the vesting was pro-rata temporis. Executive officers In 2017, the following long-term incentives vested: Vehicle Date of vesting PSUs January 1, 2017 Performance approved by ARCG Committee on March 14, 2017 RSUs December 17, 2017 Remuneration strategy The ARCG Committee assists the Board of Directors to maintain a formal and transparent procedure for setting policy on senior management's remuneration and to determine an appropriate remuneration package for senior management. The ARCG Committee should ensure that remuneration arrangements support the strategic aims of the business and enable the recruitment, motivation and retention of senior executives while complying with all rules and regulations. Number of PSUs/RSUs Date of Grant granted to the Executive Officers and outstanding Number of Shares acquired by the Executive Officers September 27, ,450 11,758 December 17, ,668 14,668 the purposes of the ARCG Committee. The ARCG Committee makes decisions by a simple majority with no member having a casting vote and is chaired by Mr. Bruno Lafont, Lead Independent Director. Appointments, remuneration and corporate governance committee The primary function of the ARCG Committee is to assist the Board of Directors with respect to the following: review and approve corporate goals and objectives regarding remuneration relevant to the CEO Office and Executive Officers and other members of executive management as deemed appropriate by the committee, and assess performance against goals and objectives; make recommendations to the Board with respect to incentive remuneration plans and equity-based plans; identify candidates qualified to serve as members of the Board, the CEO Office and Executive Officers; recommend candidates to the Board for appointment by the general meeting of shareholders or for appointment by the Board to fulfill interim Board vacancies; Board oversight To this end, the Board of Directors has established the ARCG Committee to assist it in making decisions affecting employee remuneration. All members of the ARCG Committee are required to be independent under the Company s corporate governance guidelines, the NYSE standards and the 10 Principles of Corporate Governance of the Luxembourg Stock Exchange. The members are appointed by the Board of Directors each year after the annual general meeting of shareholders. The members have relevant expertise or experience relating to
62 62 Management report develop, monitor and review corporate governance principles applicable to the Company; Scope ArcelorMittal s remuneration philosophy and framework apply to the following groups of senior management: facilitate the evaluation of the Board; review the succession planning and the executive development of the members of the CEO Office and Executive Officers; the CEO and the CFO; and the other Executive Officers. submit proposals to the Board on the remuneration of the members of the CEO Office and Executive Officers, and on the appointment of new members thereto and new directors; and The remuneration philosophy and governing principles also apply, with certain limitations, to a wider group of employees including Executive Vice Presidents, Vice Presidents, General Managers and Managers. make recommendations to the Board of Directors in respect of the Company s framework of remuneration for the members of the CEO Office and Executive Officers and such other members of the executive management as designated by the committee. In making such recommendations, the committee may take into account factors that it deems necessary. This may include a member s total cost of employment (factoring in equity/long term incentives, any perquisites and benefits in kind and pension contributions). Remuneration philosophy The ARCG Committee met eight times in Its members comprise Mr. Bruno Lafont (Chairman), Mrs. Suzanne Nimocks and Mr. Tye Burt. Regular invitees include Mr. Lakshmi N. Mittal (CEO and Chairman) and Mr. Henri Blaffart (Head of Group Human Resources and Corporate Services). Mr. Henk Scheffer (Company Secretary) acts as secretary. Individual remuneration is discussed by the ARCG Committee without the person concerned being present. The ARCG Committee Chairman presents its decisions and findings to the Board of Directors after each ARCG Committee meeting. ArcelorMittal s remuneration philosophy for its senior management is based on the following principles: provide total remuneration competitive with executive remuneration levels of peers of similar size, scope and industry; encourage and reward performance that will lead to long-term enhancement of shareholder value; and promote internal pay equity by providing base pay and total remuneration levels that reflect the role, job size and responsibility as well as the performance and effectiveness of the individual. Remuneration framework The ARCG Committee develops proposals for senior management remuneration annually for the Board of Directors' consideration. Such proposals include the following components: fixed annual salary; short-term incentives (i.e., performance-based bonus); and long-term incentives (i.e., stock options (prior to May 2011), RSUs and PSUs (after May 2011), PSUs only as from 2016). The Company does not have any deferred compensation plans for senior management, including the Chairman and CEO. Remuneration policy The ARCG Committee set policies applied to Senior Management on base salary, short-term incentives and long-term incentives.
63 Management report 63 The following table provides an overview of the remuneration policy applied by the ARCG Remuneration component and link to strategy Fixed annual salary Competitive base salary to attract and retain high-quality and experienced senior executives Benefits Competitive level to ensure coverage of the executives Operational and performance framework Opportunity * Base salary levels are reviewed annually with effect from April 1 (except promotion) compared to the market to ensure that ArcelorMittal remains competitive with market median base pay levels * Reviews are based on market information obtained but not led by benchmarking to comparable roles, changes in responsibility and general economic conditions The ARCG does not set a maximum salary, instead when determining any salary increases it takes into account a number of reference points including salary increases across the wider company * May include costs of health insurance, death and disability insurances, company car, tax return preparation, etc. * Relocation benefits may be provided where a change of location is made at Company s request The cost to the Company of providing benefits can change from year to year. The level of benefit provided is intended to remain competitive Pension Competitive level of postemployment benefit to attract and retain executives Short term incentives (STI) Motivate the senior executives to achieve stretch performance on strategic priorities * Local benchmark of pension contributions for comparable roles * Scorecard is set at the commencement of each financial year * Measures and relative weights are chosen by the ARCG Committee to drive overall performance for the coming year * STI calculations for each employee reflect the performance of the ArcelorMittal group and /or the performance of the relevant business units, the achievement of specific objectives of the department and the individual employee s overall performance * No STI is paid for a performance below threshold 80%; 100% STI payout for performance achieved at 100%; 150% STI payout for performance achieved at 120% or above Range for CEO : 0 to 225% with a target at 100% of base salary Range for CFO: 0 to 180% with a target at 80% of base salary Range for Executive Officers: 0 to 135% with a target at 60% of base salary CEO Office LTIP LTIP Sustain shareholder wealth creation in excess of performance of a peer group and incentivize executives to achieve strategy * The vesting is subject to a relative TSR (Total Shareholder Return) compared to the S&P 500 and a peer group and to a relative EPS of a peer group over a three year- period *The peer group is determined by the ARCG Committee * No vesting will occur below the median for all grants as from 2016 * Performance is determined by the ARCG Committee Executive Officers LTIP - The vesting is subject to a relative TSR compared to a peer group and eventually an additional strategic priority in some business units (such as Gap to competition or TCOE) in The peer group is determined by the ARCG Committee - No vesting will occur below the median for all grants for the TSR portion - Performance is determined by the ARCG Committee Maximum value at grant: 100% of base salary for the CEO and CFO 60% of base salary for Executive Officers

64 64 Management report Remuneration mix The total remuneration target of the CEO and the CFO is structured to attract and retain executives; the amount of the remuneration received is dependent on the achievement of superior business and individual performance and on generating sustained shareholder value from relative performance. The following remuneration charts, which illustrate the various elements of the CEO, the CFO and the other Executive Officers compensation, are applicable for For each of the charts below, the columns on the left, middle and on the right, respectively, reflect the breakdown of compensation if targets are not met, met and exceeded. Note: no pension contribution
 was $6.")
65 Management report 65 Note: Other benefits, as shown above, do not include international mobility incentives that may be provided Total remuneration The total remuneration paid in 2017 to members of ArcelorMittal s senior management (including Mr. Lakshmi N. Mittal in his capacity as CEO) was $6.5 million in base salary and other benefits paid in cash (such as health, other insurances, lunch allowances, financial services, gasoline and car allowance) and $6.8 million in short-term performance-related variable remuneration consisting of a short-term incentive linked to the Company s 2016 results. During 2017, approximately $0.8 million was accrued by ArcelorMittal to provide pension benefits to senior management (other than Mr. Mittal). No loans or advances to ArcelorMittal s senior management were made during 2017, and no such loans or advances were outstanding as of December 31, The following table shows the remuneration received by the CEO, the CFO and the Executive Officers as determined by the ARCG Committee in relation to 2017 and 2016 including all remuneration components: Chief Financial Officer and Executive Officers (5) Chief Executive Officer (Amounts in $ thousands except for Long-term incentives) ,505 1,550 4,709 8,729 Retirement benefits Other benefits ,333 4,468 2,029 Base salary Short-term incentives3 Long-term incentives - fair value in $ thousands4 - number of share units ,130 2,297 1,922 6,882 49, ,214 94, ,623 The base salaries of the CEO and CFO were increased by 2% in In 2016, base salary also included vacation, notice period and severance payments. Other benefits comprise benefits paid in cash such as lunch allowances, financial services, gasoline and car allowances. Health insurance and other insurances are also included. Short-term incentives are entirely performance-based and are fully paid in cash. The short-term incentive for a given year relates to the Company s results in the previous year. Fair value determined at the grant date is recorded as an expense using the straight line method over the vesting period and adjusted for the effect of non-market based vesting conditions. The remuneration expenses recognized for the PSUs granted to the CEO and to the CFO and Executive Officers was $3 million (net of reversal of expenses relating to unvested PSUs) for the year ended December 31, The remuneration expenses recognized for the RSUs/PSUs granted to the CEO and to the other GMB members was $2 million for the year ended December 31, Jim Baske is included until June 30, 2016, Davinder Chugh is included until July 20, 2016 and Robrecht Himpe is included as from July 1, 2016.
66 66 Management report Short-term incentives Operating income plus depreciation, impairment expenses and exceptional items ( EBITDA ) at the Group, segment and / or Business unit level: this acts as the circuit breaker with respect to financial performance measures except for Mining where the Mining volume is the circuit breaker ; For the CEO and the CFO, the 2017 short-term incentive formula is based on: FCF at the Group, segment and /or Business unit level; EBITDA at the Group level: 30% (this acts as circuit breaker with respect to group-level financial performance measures as explained below); ROCE at the Group level; Gap to competition at the Group level; FCF at the Group level: 20%; Health and safety performance; and ROCE at the Group level : 20%; Gap to competition at the Group level: 20%; and Business specific measures for corporate functions. Health and safety performance at the Group level: 10%. Targets associated with ArcelorMittal s 2017 performance short-term incentive were aligned with its strategic objectives of improving health and safety performance and overall competitiveness. EBITDA operating as a circuit breaker for financial measures means that at least 80% of target must be met to trigger any short-term incentive payment with respect to the EBITDA and FCF performance measures. For the CEO, the performance short-term incentive at 100% achievement of performance targets linked to the business plan is equal to 100% of his base salary. For the CFO, the performance short-term incentive at 100% achievement of performance targets linked to the business plan is equal to 80% of his base salary. The different performance measures are combined through a cumulative system: each measure is calculated separately and is added up for the performance short-term incentive calculation. Performance below threshold will result in zero performance short-term incentive payout. For the other Executive Officers, the performance shortterm incentive at 100% achievement of performance targets linked to the business plan is equal to 60% of their base salary. Individual performance and assessment ratings define the individual short-term incentive multiplier that will be applied to the performance short-term incentive calculated based on actual performance against the performance measures. Those individuals who consistently perform at expected levels will have an individual multiplier of 1. For outstanding performers, an individual multiplier of up to 1.5 may cause the performance short-term incentive pay-out to be higher than 150% of the target short-term incentive, up to 225% of the target short-term incentive being the absolute maximum for the CEO. Similarly, a reduction factor will be applied for those at the lower end. The achievement level of performance for performance short-term incentive for the CEO, the CFO and the other Executive Officers is summarized as follows: For the other Executive Officers, the 2017 short-term incentive formula has been tailored for their respective positions and is generally based on the following: Target achievement 80% Target 100% Target achievement 120% Chief Executive Officer 50% of base pay 100% of base pay 150% of base pay Chief Financial Officer 40% of base pay 80% of base pay 120% of base pay Executive Officers 30% of base pay 60% of base pay 90% of base pay Functional level Long term incentive plan ArcelorMittal operates a long-term incentive plan to incentivize shareholder wealth creation in excess of performance of a peer group and incentivize executives to achieve strategy. On May 10, 2011, the annual general meeting of shareholders approved the ArcelorMittal Equity Incentive Plan, a new equity-based incentive plan that replaced the Global Stock Option Plan (see below and note 7.3 to the consolidated financial statements for a description of the Global Stock Option Plan). The ArcelorMittal Equity Incentive Plan is intended to align the interests of the
67 Management report Company s shareholders and eligible employees by allowing them to participate in the success of the Company. The ArcelorMittal Equity Incentive Plan provides for the grant of RSUs and PSUs to eligible Company employees (including the Executive Officers) and is designed to incentivize employees, improve the Company s long-term performance and retain key employees. On May 8, 2013, the annual general meeting of shareholders approved the GMB PSU Plan, which provides for the grant of PSUs to GMB members (and is now applicable to the CEO Office). Until the introduction of the GMB PSU Plan in 2013, GMB members were eligible to receive RSUs and PSUs under the ArcelorMittal Equity Incentive Plan. In 2016, a special grant was approved in order to align the grant with the Action 2020 plan put in place by ArcelorMittal. The maximum number of PSUs (and RSUs previously) available for grant during any given year is subject to the prior approval of the Company s shareholders at the annual general meeting. The annual shareholders meeting on May 4, 2016 approved the maximum to be granted until the next 67 annual shareholders meeting. For the period from the May 2016 annual general shareholders meeting to the May 2017 annual general shareholders meeting, a maximum of 30,000,000 PSUs (10,000,000 after the reverse stock split) may be allocated to eligible employees under the ArcelorMittal Equity Incentive Plan and the GMB PSU Plan combined. The 2017 Cap for the number of PSUs that may be allocated to the CEO Office and other retention based based grants below the CEO office level was approved at the annual shareholders' meeting on May 10, 2017 at a maximum of 3,000,000 shares (9,000,000 before the reverse stock split). In 2016, ArcelorMittal adapted the plan: To consider the comments of shareholders that vesting should not happen below the median and To adapt to Action 2020 (Special grant) Conditions of the 2017 grant were as follows: CEO Office Executive Officers PSUs with a three-year performance period PSUs with a three-year performance period Performance criteria: 50% TSR (½ vs. S&P 500 and ½ vs. peer group) and 50% EPS vs. peer group Performance criteria: TSR and Gap to competition in some areas Value at grant: 100% of base salary for the CEO and the CFO Vesting conditions: 2017 Grant Vesting conditions: Threshold Target TSR/EPS vs. peer group 100% median 120% median TSR vs. S&P 500 Performance equal to Index Performance equal to Index + 2% outperformance 50% 100% Vesting percentage Threshold Target TSR vs. peer group 100% median 50% vesting 120% median 100% vesting Gap to competition (where applicable) - 100% target 100% vesting Awards made in previous financial years which have not yet reached the end of the vesting period therefore the target was based on these performance measures. The Company's Long-Term Incentive Plan for senior management including Executive Officers follows the Company's strategy. In 2016, a special grant was deployed on a five-year performance period to achieve the Company's Action 2020 plan. ROCE remained a key target and Gap to Competition was added as performing against competition is essential. In 2014 and 2015, the Company's goal was to achieve ROCE and Mining volumes for the Mining segment and The plans in 2014, 2015 and 2016 are summarized below.
68 Management report 2014 Grant 68 CEO Office Other Executive Officers PSUs with a three-year performance period RSUs with a three-year vesting period (2014 grant vested in December 2017) Performance criteria: 50% TSR (½ vs. S&P 500 and ½ vs. peer group) and 50% EPS vs. peer group PSUs with a three-year performance period Value at grant: 100% of base salary for the CEO and 80% for the CFO Performance target: mainly ROCE and mining volume plan for the Mining segment Vesting conditions: One PSU can give right to 0 shares up to 1.5 shares Vesting conditions: Threshold 2015 Grant Stretch Threshold TSR/EPS vs. peer group 80% median 100% median 120% median TSR vs. S&P 500 Performance equal to 80% of Index Performance equal to Index Performance equal to Index + 2% outperformance 50% 100% 150% Vesting percentage 2016 Special Grant Target Target Stretch Performance 80% 100% 120% Vesting 50% 100% 150% Same as in 2014 Same as in 2014 PSUs with a five-year performance period, 50% vesting after three-year performance period and 50% after additional two-year performance period PSUs with a five-year performance period, 50% vesting after three-year performance period and 50% after additional two-year performance period Performance criteria: 50% TSR (½ vs. S&P 500 and ½ vs. peer group) and 50% EPS vs. peer group Performance criteria: ROCE and Gap to competition in some areas one target grant: a share will vest if performance is met at target one overperformance grant: a share will vest if performance exceeds 120% Value at grant: 150% of base salary for the CEO and the CFO Vesting conditions: Vesting conditions: Threshold TSR/EPS vs. peer group TSR vs. S&P 500 Vesting percentage Performance Target 100% median 120% median Performance equal to Index Performance equal to Index + 2% outperformance 50% 100% Target award vesting Overperformance award (=20% of target award) 100% 100% - 120% 100% 100% See note 7.3 to the consolidated financial statements for further details on RSUs and PSUs. include insurance, housing (in cases of international transfers), car allowances and tax assistance. Global Stock Option Plan SOX 304 and clawback policy Prior to the May 2011 annual general shareholders meeting adoption of the ArcelorMittal Equity Incentive Plan described above, ArcelorMittal s equity-based incentive plan took the form of a stock option plan known as the Global Stock Option Plan. Under Section 304 of the Sarbanes-Oxley Act, the SEC may seek to recover remuneration from the CEO and CFO of the Company in the event that it is required to restate accounting information due to any material misstatement thereof or as a result of misconduct in respect of a financial reporting requirement under the U.S. securities laws (the SOX Clawback ). See note 7.3 to the consolidated financial statements for further details on stock options Other benefits In addition to the remuneration described above, other benefits may be provided to senior management and, in certain cases, other employees. These other benefits can Under the SOX Clawback, the CEO and the CFO may have to reimburse ArcelorMittal for any short-term incentive or other incentive- or equity-based remuneration received during the 12-month period following the first public issuance or filing with the SEC (whichever occurs first) of
69 Management report the relevant filing, and any profits realized from the sale of ArcelorMittal securities during that 12-month period. The Board of Directors, through its ARCG Committee, decided in 2012 to adopt its own clawback policy (the Clawback Policy ) that applies to the members of the former GMB and to the Executive Vice President of Finance of ArcelorMittal. In 2016, the Clawback Policy was updated to reflect the Company s structural changes and now applies to the CEO Office and the Executive Officers. The Clawback Policy comprises cash short-term incentives and any other incentive-based or equity-based remuneration, as well as profits from the sale of the Company s securities received during the 12-month period following the first public issuance or filing with the SEC (whichever first occurs) of the filing that contained the material misstatement of accounting information. 69 For purposes of determining whether the Clawback Policy should be applied, the Board of Directors will evaluate the circumstances giving rise to the restatement (in particular, whether there was any fraud or misconduct), determine when any such misconduct occurred and determine the amount of remuneration that should be recovered by the Company. In the event that the Board of Directors determines that remuneration should be recovered, it may take appropriate action on behalf of the Company, including, but not limited to, demanding repayment or cancellation of cash short- term incentives, incentive-based or equity-based remuneration or any gains realized as the result of options being exercised or awarded or long-term incentives vesting. The Board may also choose to reduce future remuneration as a means of recovery. Major shareholders and related party transactions Major shareholders The following table sets out information as of December 31, 2017 with respect to the beneficial ownership of ArcelorMittal ordinary shares by each person who is known to be the beneficial owner of more than 5% of the shares and all directors and senior management as a group. ArcelorMittal Ordinary Shares1 Number Significant Shareholder2 Treasury Shares3 Other Public Shareholders4 Total Of which: Directors and Senior Management5 % 382,241, % 1,986, % 637,675, % 1,021,903, % 444, % 1 For purposes of this table, a person or group of persons is deemed to have beneficial ownership of any ArcelorMittal ordinary shares as of a given date on which such person or group of persons has the right to acquire such shares within 60 days after December 31, 2017 upon exercise of vested portions of stock options. All stock options that have been granted to date by ArcelorMittal have vested. 2 For purposes of this table, ordinary shares owned directly by Mr. Lakshmi Mittal and his wife, Mrs. Usha Mittal, and options held directly by Mr. Lakshmi Mittal, are aggregated with those ordinary shares beneficially owned by the Significant Shareholder. At December 31, 2017, Mr. Lakshmi Mittal and his wife, Mrs. Usha Mittal, had direct ownership of ArcelorMittal ordinary shares and indirect beneficial ownership (within the meaning set forth in Rule 13d-3 of the Exchange Act), through the Significant Shareholder, of two holding companies that own ArcelorMittal ordinary sharesnuavam Investments S.à r.l. ( Nuavam ) and Lumen Investments S.à r.l. ( Lumen ). Nuavam, a limited liability company organized under the laws of Luxembourg, was the owner of 63,658,348 ArcelorMittal ordinary shares. Lumen, a limited liability company organized under the laws of Luxembourg, was the owner of 318,288,328 ArcelorMittal ordinary shares. Mr. Mittal was the direct owner of 210,292 ArcelorMittal ordinary shares and held options to acquire an additional 58,833 ArcelorMittal ordinary shares, all of which are, for the purposes of this table, deemed to be beneficially owned by Mr. Mittal due to the fact that these options are exercisable within 60 days. Mrs. Mittal was the direct owner of 25,500 ArcelorMittal ordinary shares. Mr. Mittal, Mrs. Mittal and the Significant Shareholder shared indirect beneficial ownership of 100% of each of Nuavam and Lumen (within the meaning set forth in Rule 13d-3 of the Exchange Act). Accordingly, Mr. Mittal was the beneficial owner of 382,215,801 ArcelorMittal ordinary shares, Mrs. Mittal was the beneficial owner of 381,972,176 ordinary shares and the Significant Shareholder (when aggregated with ordinary shares of ArcelorMittal and options to acquire ordinary shares of ArcelorMittal held directly by Mr. and Mrs. Mittal) was the beneficial owner of 382,241,301 ordinary shares. Excluding options, Mr. Lakshmi Mittal and Mrs. Usha Mittal together beneficially owned 382,182,468 ArcelorMittal ordinary shares at such date. As of December 31, 2016 and 2015, the Significant Shareholder (together with Mr. Mittal and Mrs. Mittal) held 37.40% and 39.39% of the Company s ordinary shares respectively. 3 Represents ArcelorMittal ordinary shares repurchased pursuant to share repurchase programs in prior years, fractional shares returned in various transactions, and the use of treasury shares in various transactions in prior years; includes (1) 252,980 stock options that can be exercised by senior management (other than Mr. Mittal) and (2) 58,833 stock options that can be exercised by Mr. Mittal, in each case within 60 days of December 31, 2017, i.e. 0.03% of the total amount of outstanding shares. If exercised, the shares underlying these options will either have to be delivered out of Treasury shares or by the issuance of additional shares. 4 The Capital Group Companies Inc. s shareholding increased to 168,541,781 shares, corresponding to an interest of 5.49% on April 11, 2016 and subsequently decreased to 147,321,072 on January 25, 2017, corresponding to an interest of 4.8%.As a result of reverse stock split in May 2017, the Capital Group Companies Inc. was the owner of 49,107,024 ArcelorMittal shares on December 31, Includes shares beneficially owned by directors and members of senior management and excludes shares beneficially owned by Mr. Mittal. Note that (i) stock options included in this item that are exercisable within 60 days are excluded from Treasury Shares above (see also note 3 above) and (ii) ordinary shares included in this item are included in Other Public Shareholders above. Aditya Mittal is the direct owner of 70,121 ArcelorMittal ordinary shares and holds options to acquire an additional 47,067 ArcelorMittal ordinary shares, together representing less than 0.1% of the ArcelorMittal ordinary shares outstanding. Aditya Mittal holds a total of 218,296 PSUs of which 39,321 may vest in June 2018, 40,653 may vest in 2020 and 138,322 of which 50% may vest after 3 years in 2020 and 50% may vest after five years in As the vesting of PSUs is dependent on company performance criteria not fully within the control of the PSU holder, Aditya Mittal does not beneficially own ArcelorMittal ordinary shares by virtue of his ownership of the PSUs. Aditya Mittal is the son of Mr. Mittal and Mrs. Mittal and Group CFO and CEO ArcelorMittal Europe. Vanisha Mittal Bhatia is the direct owner of 8,500 ArcelorMittal ordinary shares, representing less than 0.1% of the ArcelorMittal ordinary shares outstanding. Vanisha Mittal Bhatia is the daughter of Mr. Mittal and Mrs. Mittal and a member of the Company s Board of Directors.
70 70 Management report As of December 31, 2015, 1,817,869 Mandatorily Convertible Notes had been converted at the option of their holders. On January 15, 2016, ArcelorMittal issued 137,967,116 (45,989,039 after reverse stock split mentioned below) new ordinary shares of the Company upon conversion as at such date of the 88,182,131 outstanding Mandatorily Convertible Notes at a conversion ratio of Following this issuance, the share capital of the Company was comprised of 1,803,359,338 (601,119,779 after reverse stock split mentioned below) shares and the Significant Shareholder (when aggregated with ordinary shares of ArcelorMittal and options to acquire ordinary shares of ArcelorMittal held directly by Mr. and Mrs. Mittal) held 37.41% of the outstanding shares. Following the Company s equity offering authorized by the EGM which closed on April 8, 2016, the Company s issued share capital was increased from 1,803,359,338 (601,119,779 after reverse stock split mentioned below) ordinary shares to 3,065,710,869 (1,021,903,623 after reverse stock split mentioned below) ordinary shares. The EGM of ArcelorMittal shareholders held on May 10, 2017 approved a reverse stock split. Following this approval, on May 22, 2017 ArcelorMittal completed the consolidation of each three existing shares in ArcelorMittal without nominal value into one share without nominal value. As a result, the aggregate number of shares issued and fully paid up decreased from 3,065,710,869 to 1,021,903,623. The ArcelorMittal ordinary shares may be held in registered form on the Company s register only. Registered shares are fully fungible and may consist of: a. ArcelorMittal Registry Shares, which are registered directly on ArcelorMittal s Luxembourg shareholder register, b. shares traded on Euronext Amsterdam, Euronext Paris, the regulated market of the Luxembourg Stock Exchange and the Spanish Stock Exchanges, which are held in Euroclear, or c. shares traded on the NYSE, named New York Registry Shares, which are registered (including in the name of the nominee of DTC) in a register kept by or on behalf of ArcelorMittal by its New York transfer agent. Under Luxembourg law, the ownership of registered shares is evidenced by the inscription of the name of the shareholder, the number of shares held by such shareholder and the amount paid up on each share in the shareholder register of ArcelorMittal. At December 31, 2017, 2,214 shareholders other than the Significant Shareholder, holding an aggregate of 15,504,772 ArcelorMittal ordinary shares were registered in ArcelorMittal s shareholder register, representing approximately 1.52% of the ordinary shares issued (including treasury shares). At December 31, 2017, there were 200 registered shareholders holding an aggregate of 71,019,261 New York Shares, representing approximately 6.95% of the ordinary shares issued (including treasury shares). ArcelorMittal s knowledge of the number of New York Shares held by U.S. holders is based solely on the records of its New York transfer agent regarding registered ArcelorMittal ordinary shares. At December 31, 2017, 564,071,990 ArcelorMittal ordinary shares were held through the Euroclear/Iberclear clearing system in The Netherlands, France, Luxembourg and Spain. Voting rights Each share entitles the holder to one vote at the general meeting of shareholders, and no shareholder benefits from specific voting rights. For more information relating to ArcelorMittal shares, see "Memorandum and articles of association, Voting and information rights. Related party transactions ArcelorMittal engages in certain commercial and financial transactions with related parties, including associates and joint ventures of ArcelorMittal. Please refer to note 11 of ArcelorMittal s consolidated financial statements. Shareholder s Agreement The Significant Shareholder, a holding company owned by the Significant Shareholder and ArcelorMittal are parties to a shareholder and registration rights agreement (the Shareholder s Agreement ) dated August 13, Pursuant to the Shareholder s Agreement and subject to the terms and conditions thereof, ArcelorMittal shall, upon the request of certain holders of restricted ArcelorMittal shares, use its reasonable efforts to register under the Securities Act of 1933, as amended, the sale of ArcelorMittal shares intended to be sold by those holders. By its terms, the Shareholder s Agreement may not be amended, other than for manifest error, except by approval of a majority of ArcelorMittal s shareholders (other than the Significant Shareholder and certain permitted transferees) at a general shareholders meeting. Memorandum of Understanding The Memorandum of Understanding entered into in connection with the Mittal Steel acquisition of Arcelor, certain provisions of which expired in August 2009 and August 2011, is described under "Material contracts, Memorandum of understanding".
71 Management report Agreements with Aperam SA post-stainless Steel Spin-Off In connection with the spin-off of its stainless steel division into a separately focused company, Aperam SA ( Aperam ), which was completed on January 25, 2011, ArcelorMittal entered into several agreements with Aperam and/ or certain Aperam subsidiaries. These agreements include a Master Transitional Services Agreement dated January 25, 2011 (the Transitional Services Agreement ) for support for/ from corporate activities, a purchasing services agreement for negotiation services from ArcelorMittal Purchasing (the Purchasing Services Agreement ), a sourcing services agreement for negotiation services from ArcelorMittal Sourcing (the Sourcing Services Agreement ), certain commitments regarding cost-sharing in Brazil and certain other ancillary arrangements governing the relationship between Aperam and ArcelorMittal following the spin-off, as well as certain agreements relating to financing. The Transitional Services Agreement between ArcelorMittal and Aperam expired at year-end The parties agreed to renew a limited number of services where expertise and bargaining power created value for each party. ArcelorMittal will continue to provide certain services in 2017 relating to areas including environmental and technical support and the administration of the shareholders register. In the area of research and development, Aperam entered into a frame arrangement with ArcelorMittal to establish a structure for future cooperation in relation to certain ongoing or new research and development programs. Currently, only limited research and development support are implemented through the agreement, but new collaborative endeavors are foreseen in The purchasing and sourcing of raw materials generally were not covered by the Transitional Services Agreement. Aperam is responsible for the sourcing of its key raw materials, including nickel, chromium, molybdenum and stainless steel scrap. However, under the terms of the 2011 Purchasing Services Agreement, Aperam still relies on ArcelorMittal for services in relation to the negotiation of certain contracts with global or large regional suppliers, including those relating to the following key categories: operating materials (rolls, electrodes and refractory materials), spare parts, transport, industrial products and services. The Purchasing Services Agreement also permits Aperam to avail itself of the services and expertise of ArcelorMittal for certain capital expenditure items. The Purchasing Services Agreement was entered into for an initial term of two years, which was to expire on January 24, However, since that date, the Purchasing Services Agreement has been extended successively until January 24, As from January 1, 2016, purchasing services for metallics (carbon scrap) were removed from the Purchasing Services Agreement. New specific IT service agreements are being put in place with Aperam, one for Asset Reliability Maintenance Program (ARMP) in its Brazilian entities, and 71 two others for the use in Europe of ARMP and for the use of the global wide area network (WAN). In Europe, Aperam purchased most of its electricity and natural gas though energy supply contracts put in place for the period with ArcelorMittal Energy SCA and ArcelorMittal Purchasing SAS. Purchasing activities will continue to be provided to Aperam pursuant to existing contracts with ArcelorMittal entities that it has specifically elected to assume. In addition, in September 2016, a services term sheet agreement has been concluded between ArcelorMittal Shared Service Center Europe Sp z.o.o. Sp.k. and Aperam according to which ArcelorMittal Shared Service Center Europe Sp z.o.o. Sp.k.SSC Poland will prepare in close cooperation with Aperam, transfer pricing documentation for the financial years 2015, 2016 and 2017 for specific Aperam entities. The transfer pricing documentation shall be compliant with OECD transfer pricing guidelines and in line with country specific legal requirements as well as respecting the country specific deadlines. The work shall include also the update of benchmark studies. In connection with the spin-off, management also renegotiated an existing Brazilian cost-sharing agreement between ArcelorMittal Brasil and Aperam Inox América do Sul S.A. (formerly known as ArcelorMittal Inox Brasil), pursuant to which, starting as of April 1, 2011, ArcelorMittal Brasil continued to perform purchasing, insurance and real estate activities for the benefit of certain of Aperam s Brazilian subsidiaries, with costs being shared on the basis of cost allocation parameters agreed between the parties. From the demerger of ArcelorMittal BioEnergia Ltda on July 1, 2011, its payroll functions were also handled by ArcelorMittal Brasil. The real estate, insurance activities and payroll functions of Aperam s Brazilian subsidiaries have not been handled by ArcelorMittal Brasil since January 1, 2013, June 30, 2013, and June 27, 2014 respectively. Memorandum and Articles of Association Below is a summary of ArcelorMittal s Articles of Association, filed as an exhibit to this annual report on Form 20-F and incorporated by reference herein. The full text of the Company s Articles of Association is also available on under InvestorsCorporate GovernanceBoard of Directors. Corporate purpose Article 3 of the Articles of Association provides that the corporate purpose of ArcelorMittal is the manufacture, processing and marketing of steel, steel products and all other metallurgical products, as well as all products and materials used in their manufacture, their processing and their marketing, and all industrial and commercial activities connected directly or indirectly with those objects, including mining and research activities and the creation, acquisition,
72 72 Management report holding, exploitation and sale of patents, licenses, knowhow and, more generally, intellectual and industrial property rights. a. ArcelorMittal Registry Shares, which are registered directly on ArcelorMittal s Luxembourg shareholder register, The Company may realize its corporate purpose either directly or through the creation of companies, the acquisition, holding or acquisition of interests in any companies or partnerships, membership in any associations, consortia and joint ventures. b. shares traded on Euronext Amsterdam, Euronext Paris, the regulated market of the Luxembourg Stock Exchange and the Spanish Stock Exchanges, which are held in Euroclear, or In general, the Company s corporate purpose comprises the participation, in any form whatsoever, in companies and partnerships and the acquisition by purchase, subscription or in any other manner as well as the transfer by sale, exchange or in any other manner of shares, bonds, debt securities, warrants and other securities and instruments of any kind. It may grant assistance to any affiliated company and take any measure for the control and supervision of such companies. It may carry out any commercial, financial or industrial operation or transaction that it considers to be directly or indirectly necessary or useful in order to achieve or further its corporate purpose. Form and transfer of shares The shares of ArcelorMittal are issued in registered form only and are freely transferable. There are no restrictions on the rights of Luxembourg or non-luxembourg residents to own ArcelorMittal shares. Under Luxembourg law, the ownership of registered shares is evidenced by the inscription of the name of the shareholder and the number of shares held by such shareholder in the shareholders register. Each transfer of shares is made by a written declaration of transfer recorded in the shareholders register of ArcelorMittal, dated and signed by the transferor and the transferee or by their duly appointed agent. ArcelorMittal may accept and enter into its shareholders register any transfer based on an agreement between the transferor and the transferee provided a true and complete copy of the agreement is provided to ArcelorMittal. The Articles of Association provide that shares may be held through a securities settlement (clearing) system or a professional depositary of securities. Shares held in this manner have the same rights and obligations as the registered shares. Shares held through a securities settlement system or a professional depositary of securities may be transferred in accordance with customary procedures for the transfer of securities in book-entry form. The ArcelorMittal ordinary shares may be held in registered form on the Company s register only. Registered shares are fully fungible and may consist of: c. shares traded on the NYSE, named New York Registry Shares, which are registered in a register (including in the name of the nominee of DTC) kept by or on behalf of ArcelorMittal by its New York transfer agent. Since March 2009, ArcelorMittal has used the services of BNP Paribas Securities Services to assist it with certain administrative tasks relating to the day-to-day administrative management of the shareholders register. The law of April 6, 2013 concerning dematerialized securities allows Luxembourg issuers to opt for the full dematerialization of shares. The EGM of ArcelorMittal shareholders held on May 10, 2017 authorized and empowered the Board of Directors to give effect to such dematerialization and to determine its effective date, following which new shares in the Company may only be issued in dematerialized form (the Effective Date ). Notice of the compulsory dematerialization will be given in accordance with Article 6.9 (i) of the Company s Articles of Association. As from the Effective Date, shareholders would be required to hold their shares in a securities account at a bank or other financial intermediary, which would in turn hold the shares via an account with a securities depository such as Clearstream or Euroclear. Dematerialized securities would be solely represented by account entries with the securities depositary and would therefore exist only in electronic form. It would then no longer be possible for shareholders to hold shares through a direct, nominative registration in the Company s register of shareholders as is currently the case. Issuance of shares The issuance of shares by ArcelorMittal requires either an amendment of the Articles of Association approved by an extraordinary general meeting of shareholders (an EGM ) or a decision of the Board of Directors that is within the limits of the authorized share capital set out in the Articles of Association. In the latter case, the Board of Directors may determine the conditions for the issuance of shares, including the consideration (cash or in kind) payable for such shares. The EGM may not validly deliberate unless at least half of the share capital is present or represented upon the first call. If the quorum is not met, the meeting may be reconvened as described in General Meeting of Shareholders below. The second meeting will be held regardless of the proportion of share capital represented. At
73 Management report both meetings, resolutions, in order to be adopted, must be carried by at least two-thirds of the votes cast. The Company s authorized share capital was 8,249 million represented by 1,995,857,213 shares in 2015 while its total issued share capital stood at 6,883 million, represented by 1,665,392,222 ordinary shares in Following the mandatory conversion on January 15, 2016 of outstanding Notes of the Company s $2.25 billion 6% Mandatorily Convertible Notes due 2016, the Company s issued share capital increased by 570 million from 6,883 million to 7,453 million represented by 1,803,359,338 shares without nominal value. On February 5, 2016, the Company announced its intention to increase its capital through a rights issue with shareholders benefiting from non-statutory preferential subscription rights on terms to be determined by the Company. At its meeting on February 3, 2016, the Board of Directors resolved among others and subject to approval by an EGM, to authorize the issue of up to 30,000,000,000 new ordinary shares, to cancel the statutory preferential subscription rights of the existing shareholders and to authorize the granting of preferential subscription rights to existing shareholders on terms to be determined based on market practice and conditions (the equity offering ). The EGM of ArcelorMittal shareholders, held on March 10, 2016, approved the two resolutions on its agenda: to reduce the share capital of the Company without distribution to shareholders, in order to reduce the par value of the shares in the Company to an amount of 10 euro cents per share and to increase the Company s authorized share capital including the authorization to limit or cancel the shareholders preferential subscription rights. The above authorization expires five years from the date of publication of the EGM minutes in the Official Luxembourg Gazette Mémorial C, which occurred on March 23, This authorization may be renewed from time to time by an EGM for periods not to exceed five years each. Following such approval, the Company s share capital decreased on March 10, 2016 from 7,453 million to 180 million represented by 1,803,359,338 ordinary shares without nominal value. The Company s authorized share capital, including the issued share capital, amounted to 3,200 million represented by 31,995,857,213 ordinary shares without nominal value. As a result of the Company s equity offering authorized by the EGM and which closed on April 8, 2016 at a price of 2.20 per share, the Company s issued share capital increased from 180 million to 306 million represented by 3,065,710,869 ordinary shares without nominal value and remained unchanged at December 31, The 73 Company s authorized share capital, including the issued share capital, amounted to 337 million represented by 3,372,281,956 ordinary shares without nominal value. The EGM of ArcelorMittal shareholders held on May 10, 2017 approved a reverse stock split and an increase of the Company s authorized share capital from 337 million to 345 million. Following this approval, on May 22, 2017 ArcelorMittal completed the consolidation of every three existing shares in ArcelorMittal without nominal value into one share without nominal value. As a result, the authorized share capital increased from 337 million represented by 3,372,281,956 ordinary shares without nominal value to 345 million represented by 1,151,576,921 ordinary shares without nominal value. There was no change in the issued share capital of ArcelorMittal which continues to amount to 306 million but the aggregate number of shares issued and fully paid up decreased from 3,065,710,869 to 1,021,903,623. Articles 4, 5, 7, 8, 9, 11, 13, 14 and 15 of the Articles of Association have been amended to reflect the recent changes in Luxembourg law. Such amendments to the Articles of Association were filed with the Luxembourg Register of Commerce and Companies on May 18, Preemptive rights Unless limited or cancelled by the Board of Directors as described below or by an EGM, holders of ArcelorMittal shares have a pro rata preemptive right to subscribe for newly issued shares, except for shares issued for consideration other than cash (i.e., in kind). The Articles of Association provide that preemptive rights may be limited or cancelled by the Board of Directors in the event of an increase in the Company s issued share capital until the date being five years from the date of publication via the online platform called Recueil électronique des sociétés et associations ( RESA ) which replaced as of June 1, 2016 the Luxembourg official legal gazette, the Mémorial, Recueil des Sociétés et Associations, of the relevant meeting minutes, which publication occurred on May 18, 2017 with respect to the minutes of the EGM held on May 10, This power of the Board of Directors may from time to time be renewed by an EGM for subsequent periods not to exceed five years each. Repurchase of shares ArcelorMittal is prohibited by Luxembourg law from subscribing for its own shares. ArcelorMittal may, however, repurchase its own shares or have another person repurchase shares on its behalf, subject to certain conditions, including: a prior authorization of the general meeting of shareholders setting out the terms and conditions of the proposed repurchase, including the maximum number of
74 74 Management report shares to be repurchased, the duration of the period for which the authorization is given (which may not exceed five years) and the minimum and maximum consideration per share; the repurchase may not reduce the net assets of ArcelorMittal on a non-consolidated basis to a level below the aggregate of the issued share capital and the reserves that ArcelorMittal must maintain pursuant to Luxembourg law or its Articles of Association; only fully paid-up shares may be repurchased. At December 31, 2017, all of ArcelorMittal s issued ordinary shares were fully paid-up; and the acquisition offer is made on the same terms and conditions to all the shareholders who are in the same position, it being noted however that listed companies may repurchase their own shares on the stock exchange without an acquisition offer having to be made to the shareholders. In addition, Luxembourg law allows the Board of Directors to approve the repurchase of ArcelorMittal shares without the prior approval of the general meeting of shareholders if necessary to prevent serious and imminent harm to ArcelorMittal. In such a case, the next general meeting of shareholders must be informed by the Board of Directors of the reasons for and the purpose of the acquisitions made, the number and nominal values, or in the absence thereof, the accounting par value of the shares acquired, the proportion of the issued share capital that they represent, and the consideration paid for them. The general meeting of shareholders held on May 5, 2015 (the General Meeting ) decided (a) to cancel with effect as of the date of the General Meeting the authorization granted to the Board of Directors by the general meeting of shareholders held on May 11, 2010 with respect to the share buy-back program, and (b) to authorize, effective immediately after the General Meeting, the Board of Directors, with the option to delegate to the corporate bodies of the other companies in the ArcelorMittal group in accordance with the Luxembourg law of August 10, 1915 on commercial companies, as amended (the Law ), to acquire and sell shares in the Company in accordance with the Law and any other applicable laws and regulations, including but not limited to entering into off-market and over-the-counter transactions and to acquire shares in the Company through derivative financial instruments. Any acquisitions, disposals, exchanges, contributions or transfers of shares by the Company or other companies in the ArcelorMittal group must be in accordance with Luxembourg laws transposing Directive 2003/6/EC regarding insider dealing and market manipulation as repealed and replaced by Regulation (EU) No. 596/2014 of the European Parliament and of the Council of April 16, 2014 on market abuse and Commission Delegated Regulation (EU) No. 2016/1052 of March 8, 2016 with regard to regulatory technical standards for the conditions applicable to buy-back programs and stabilization measures. Such transactions may be carried out at any time, including during a tender offer period, subject to applicable laws and regulations including Section 10(b) and Section 9(a)(2) of the Securities Exchange Act of 1934, as amended (the Exchange Act ), and Rule 10b-5 promulgated under the Exchange Act. The authorization is valid for a period of five years, i.e., until the annual general meeting of shareholders to be held in May 2020, or until the date of its renewal by a resolution of the general meeting of shareholders if such renewal date is prior to the expiration of the five-year period. Capital reduction The Articles of Association provide that the issued share capital of ArcelorMittal may be reduced subject to the approval of at least two-thirds of the votes cast at an extraordinary general meeting of shareholders where, at first call, at least 50% of the issued share capital is required to be represented, with no quorum being required at a reconvened meeting. General meeting of shareholders The shareholders rights law of May 24, 2011, which transposes into Luxembourg law Directive 2007/36/EC of the European Parliament and of the Council of July 11, 2007 on the exercise of certain rights of shareholders in listed companies of July 14, 2007 came into force on July 1, 2011 (the Shareholder s Rights Law ). The Shareholders Rights Law abolished the blocking period and introduced the record date system into Luxembourg law. As set out in the Articles of Association, the record date applicable to ArcelorMittal is the 14th day at midnight before the general meeting date. Only the votes of shareholders who are shareholders of the Company on the record date will be taken into account, regardless of whether they remain shareholders on the general meeting date. Shareholders who intend to participate in the general meeting must notify the Company at the latest on the date indicated in the convening notice of their intention to participate (by proxy or in person). Ordinary general meetings of shareholders. At an ordinary general meeting of shareholders there is no quorum requirement and resolutions are adopted by a simple majority, irrespective of the number of shares represented. Ordinary general meetings deliberate on any matter that does not require the convening of an extraordinary general meeting.
75 Management report Extraordinary general meetings of shareholders. An extraordinary general meeting must be convened to deliberate on the following types of matters: an increase or decrease of the authorized or issued share capital, a limitation or exclusion of existing shareholders preemptive rights, the acquisition by any person of 25% or more of the issued share capital of ArcelorMittal, approving a merger or similar transaction such as a spinoff, and any transaction or matter requiring an amendment of the Articles of Association. The extraordinary general meeting must reach a quorum of shares present or represented at the meeting of 50% of the share capital in order to validly deliberate. If this quorum is not reached, the meeting may be reconvened and the second meeting will not be subject to any quorum requirement. In order to be adopted by the extraordinary general meeting (on the first or the second call), any resolution submitted must be approved by at least two-thirds of the votes cast except for certain limited matters where the Articles of Association require a higher majority (see Amendment of the Articles of Association ). Votes cast do not include votes attaching to shares with respect to which the shareholder has not taken part in the vote, has abstained or has returned a blank or invalid vote. Voting and information rights The voting and information rights of ArcelorMittal s shareholders have been further expanded since the entry into force of the Shareholders Rights Law on July 1, There are no restrictions on the rights of Luxembourg or non-luxembourg residents to vote ArcelorMittal shares. Each share entitles the shareholder to attend a general meeting of shareholders in person or by proxy, to address the general meeting of shareholders and to vote. Each share entitles the holder to one vote at the general meeting of shareholders. There is no minimum shareholding (beyond owning a single share or representing the owner of a single share) required to be able to attend or vote at a general meeting of shareholders. The Board of Directors may also decide to allow shareholders to vote by correspondence by means of a form providing for a positive or negative vote or an abstention on each agenda item. The conditions for voting by correspondence are set out in the Articles of Association and in the convening notice. 75 The Board of Directors may decide to arrange for shareholders to be able to participate in the general meeting by electronic means by way, among others, of (i) real-time transmission to the public of the general meeting, (ii) twoway communication enabling shareholders to address the general meeting from a remote location, or (iii) a mechanism allowing duly identified shareholders to cast their votes before or during the general meeting without the need for them to appoint a proxyholder who would be physically present at the meeting. A shareholder may act at any general meeting of shareholders by appointing another person (who need not be a shareholder) as his or her attorney by means of a written proxy using the form made available on the website of the Company. The completed and signed proxy must be sent to the Company in accordance with the instructions set out in the convening notice. General meetings of shareholders are convened by the publication of a notice at least 30 days before the meeting date in a Luxembourg newspaper, via the RESA, and by way of press release sent to the major news agencies. Ordinary general meetings are not subject to any minimum shareholder participation level. Extraordinary general meetings, however, are subject to a minimum quorum of 50% of the share capital. In the event the 50% quorum is not met upon the first call, the meeting may be reconvened by way of convening notice published in the same manner as the first notice, at least 17 days before the meeting date. No quorum is required upon the second call. Shareholders whose share ownership is directly registered in the shareholders register of the Company must receive the convening notice by regular mail, unless they have accepted to receive it through other means (i.e., electronically). In addition, all materials relating to a general meeting of shareholders must be made available on the website of ArcelorMittal from the first date of publication of the convening notice. Based on an amendment voted by the extraordinary general meeting of shareholders on May 10, 2017, the Articles of Association of ArcelorMittal provide that the annual general meeting of shareholders is held each year within six months from the end of the previous financial year at the Company s registered office or at any other place in the Grand Duchy of Luxembourg as determined by the Board of Directors and indicated in the convening notice. Luxembourg law requires the Board of Directors to convene a general meeting of shareholders if shareholders representing in the aggregate 10% of the issued share capital so require in writing with an indication of the requested agenda. In this case, the general meeting of shareholders must be held within one month of the request. If the requested general meeting of shareholders is not so convened, the relevant shareholder or group of
76 76 Management report shareholders may petition the competent court in Luxembourg to have a court appointee convene the general meeting. Shareholders representing in the aggregate 5% of the issued share capital may also request that additional items be added to the agenda of a general meeting and may draft alternative resolutions to be submitted to the general meeting regarding existing agenda items. The request must be made in writing and sent either to the electronic address or to the Company s postal address set out in the convening notice. The Shareholders Rights Law provides that a company s articles of association may allow shareholders to ask questions prior to the general meeting which will be answered by management during the general meeting s questions and answers session prior to the vote on the agenda items. Although the Articles of Association of ArcelorMittal do not specifically address this point, shareholders may ask questions in writing ahead of a general meeting, which are taken into account in preparing the general meeting s questions and answers session. With regard to the May 4, 2016 general meeting, shareholders were expressly encouraged to send questions and comments to the Company in advance by writing to a dedicated address indicated in the convening notice. Election and removal of directors. Members of the Board of Directors are elected by simple majority of the represented shareholders at an ordinary general meeting of shareholders. Directors are elected for a period ending on a date determined at the time of their appointment. The directors of ArcelorMittal are elected for three-year terms. Any director may be removed with or without cause by a simple majority vote at any general meeting of shareholders. (a) a director s power to vote on a proposal, arrangement or contract in which the director is financially interested; If a Director has directly or indirectly a financial interest in a transaction that is submitted to the Board of Directors for approval and this interest conflicts with that of ArcelorMittal (other than transactions which are ordinary business operations and are entered into under normal conditions), the Director must advise the Board of Directors of the existence and nature of the conflict and cause a record of his/her statement to be included in the minutes of the meeting. In addition, the Director may not take part in the discussions on and may not vote on the relevant transaction and he or she shall not be counted for the purposes of whether the quorum is present, in which case the Board of Directors may validly deliberate if at least the majority of the non-conflicted directors are present or represented. At the next following general meeting of shareholders of ArcelorMittal, before any other resolution is put to a vote, a special report will be made by the Board of Directors to the shareholders meeting on any such transaction. (b) the directors power, in the absence of an independent quorum, to vote compensation to themselves or any members of their body; The remuneration of the Directors is determined each year by the annual general meeting of shareholders subject to Article 17 of the Articles of Association. The annual shareholders meeting of the Company decides on the directors remuneration. The Chairman & CEO is not remunerated for his membership on the Board of Directors. The remuneration of the Chairman & CEO is determined by the Board s ARCG Committee, which consists solely of independent directors. For more information, see "Compensation". (c) borrowing powers exercisable by the directors and how such borrowing powers can be varied; Any transaction between ArcelorMittal or a subsidiary of ArcelorMittal and a Director (or an affiliate of a Director) must be conducted on arm s length terms and, if material, must obtain the approval of the Independent Directors. (d) retirement or non-retirement of directors under an age limit requirement There is no retirement or non-retirement of directors under an age limit requirement. However, on October 30, 2012, the Board of Directors adopted a policy that places limitations on the terms of independent directors as well as the number of directorships Directors may hold in order to align the Company s corporate governance practices with best practices in this area. The policy provides that an independent director may not serve on the Board of Directors for more than 12 consecutive years, although the Board of Directors may, by way of exception to this rule, make an affirmative determination, on a case-by-case basis, that he or she may continue to serve beyond the 12 years rule if the Board of Directors considers it to be in the best interest of the Company based on the contribution of the Director involved and the balance between the knowledge, skills, experience and need for renewal of the Board. (e) number of shares, if any, required for director s qualification. Article 8.2 of the Articles of Association states that the members of the Board of Directors do not have to be shareholders in the Company. However, the Board of Directors has introduced on April 27, 2015 a policy that requires members of the Board of Directors to hold 10,000 shares in the Company (15,000 for the Lead Independent Director). For more information, see "Board practices/ corporate governance, Specific characteristics of the director role
77 Management report ArcelorMittal s Articles of Association provide that the Significant Shareholder is entitled to nominate a number of candidates for election by the shareholders to the Board of Directors in proportion to its shareholding. The Significant Shareholder has not exercised this right to date. Amendment of the Articles of Association Any amendments to the Articles of Association must be approved by an extraordinary general meeting of shareholders held in the presence of a Luxembourg notary, followed by the publications required by Luxembourg law. In order to be adopted, amendments of the Articles of Association of ArcelorMittal relating to the size and the requisite minimum number of independent and nonexecutive directors of the Board of Directors, the composition of the Audit & Risk Committee, and the nomination rights to the Board of Directors of the Significant Shareholder require a majority of votes representing twothirds of the voting rights attached to the shares in ArcelorMittal. The same majority rule would apply to amendments of the provisions of the Articles of Association that set out the foregoing rule. Annual accounts Each year before submission to the annual ordinary general meeting of shareholders, the Board of Directors approves the stand-alone audited accounts for ArcelorMittal, the parent company of the ArcelorMittal group as well as the annual consolidated accounts of the ArcelorMittal group, each of which are prepared in accordance with IFRS. The Board of Directors also approves the management reports on each of the stand-alone audited annual accounts and the consolidated annual accounts, and in respect of each of these sets of accounts a report must be issued by the independent auditors. The annual accounts, the annual consolidated accounts, the management reports and the auditor s reports will be available on request from the Company and on the Company s website from the date of publication of the convening notice for the annual ordinary general meeting of shareholders. The parent company accounts and the consolidated accounts, after their approval by the annual ordinary general meeting of shareholders, are filed with the Luxembourg register of trade and companies. Dividends Except for shares held in treasury by the Company, each ArcelorMittal share is entitled to participate equally in dividends if and when declared out of funds legally available for such purposes. The Articles of Association provide that the annual ordinary general meeting of shareholders may declare a dividend and that the Board of Directors may 77 declare interim dividends within the limits set by Luxembourg law. Declared and unpaid dividends held by ArcelorMittal for the account of its shareholders do not bear interest. Under Luxembourg law, claims for dividends lapse in favor of ArcelorMittal five years after the date on which the dividends have been declared. Merger and division A merger whereby the Luxembourg company being acquired transfers to an existing or newly incorporated Luxembourg company all of its assets and liabilities in exchange for the issuance to the shareholders of the company being acquired of shares in the acquiring company, and a division whereby a company (the company being divided) transfers all its assets and liabilities to two or more existing or newly incorporated companies in exchange for the issuance of shares in the beneficiary companies to the shareholders of the company being divided or to such company, and certain similar restructurings must be approved by an extraordinary general meeting of shareholders of the relevant companies held in the presence of a notary. These transactions require the approval of at least two-thirds of the votes cast at a general meeting of shareholders of each of the companies where at least 50% of the share capital is represented upon first call, with no such quorum being required at a reconvened meeting. Liquidation In the event of the liquidation, dissolution or winding-up of ArcelorMittal, the assets remaining after allowing for the payment of all liabilities will be paid out to the shareholders pro rata to their respective shareholdings. The decision to liquidate, dissolve or wind-up requires the approval of at least two-thirds of the votes cast at a general meeting of shareholders where at first call at least 50% of the share capital is represented, with no quorum being required at a reconvened meeting. Irrespective of whether the liquidation is subject to a vote at the first or a subsequent extraordinary general meeting of shareholders, it requires the approval of at least two-thirds of the votes cast at the extraordinary general meeting of shareholders. Mandatory bidsqueeze-out rightsell-out right Mandatory bid. The Luxembourg law of May 19, 2006 implementing Directive 2004/25/EC of the European Parliament and the Council of April 21, 2004 on takeover bids ( the Takeover Law ), provides that, if a person acting alone or in concert acquires securities of ArcelorMittal which, when added to any existing holdings of ArcelorMittal securities, give such person voting rights representing at least one third of all of the voting rights attached to the issued shares in ArcelorMittal, this person is obliged to make an offer for the remaining shares in ArcelorMittal. In a
78 78 Management report mandatory bid situation the fair price is in principle considered to be the highest price paid by the offeror or a person acting in concert with the offeror for the securities during the 12 month period preceding the mandatory bid. ArcelorMittal s Articles of Association provide that any person who acquires shares giving them 25% or more of the total voting rights of ArcelorMittal must make or cause to be made, in each country where ArcelorMittal s securities are admitted to trading on a regulated or other market and in each of the countries in which ArcelorMittal has made a public offering of its shares, an unconditional public offer of acquisition for cash to all shareholders for all of their shares and also to all holders of securities giving access to capital or linked to capital or whose rights are dependent on the profits of ArcelorMittal. The price offered must be fair and equitable and must be based on a report drawn up by a leading international financial institution or other internationally recognized expert. Squeeze-out right. The Takeover Law provides that, when an offer (mandatory or voluntary) is made to all of the holders of voting securities of ArcelorMittal and after such offer the offeror holds at least 95% of the securities carrying voting rights and 95% of the voting rights, the offeror may require the holders of the remaining securities to sell those securities (of the same class) to the offeror. The price offered for such securities must be a fair price. The price offered in a voluntary offer would be considered a fair price in the squeeze-out proceedings if the offeror acquired at least 90% of the ArcelorMittal shares carrying voting rights that were the subject of the offer. The price paid in a mandatory offer is deemed a fair price. The consideration paid in the squeeze-out proceedings must take the same form as the consideration offered in the offer or consist solely of cash. Moreover, an all-cash option must be offered to the remaining ArcelorMittal shareholders. Finally, the right to initiate squeeze-out proceedings must be exercised within three months following the expiration of the offer. Sell-out right. The Takeover Law provides that, when an offer (mandatory or voluntary) is made to all of the holders of voting securities of ArcelorMittal and if after such offer the offeror holds securities carrying more than 90% of the voting rights, the remaining security holders may require that the offeror purchase the remaining securities of the same class. The price offered in a voluntary offer would be considered fair in the sell-out proceedings if the offeror acquired at least 90% of the ArcelorMittal shares carrying voting rights and which were the subject of the offer. The price paid in a mandatory offer is deemed a fair price. The consideration paid in the sell-out proceedings must take the same form as the consideration offered in the offer or consist solely of cash. Moreover, an all-cash option must be offered to the remaining ArcelorMittal shareholders. Finally, the right to initiate sell-out proceedings must be exercised within three months following the expiration of the offer. Disclosure of significant ownership in ArcelorMittal shares Holders of ArcelorMittal shares and derivatives or other financial instruments linked to ArcelorMittal shares may be subject to the notification obligations of the Luxembourg law of January 11, 2008, as last amended by the law dated May 10, 2016, on transparency requirements regarding information about issuers whose securities are admitted to trading on a regulated market (the Transparency Law ). The following description summarizes these obligations. ArcelorMittal shareholders are advised to consult with their own legal advisers to determine whether the notification obligations apply to them. The Transparency Law provides that, if a person acquires or disposes of a shareholding in ArcelorMittal, and if following the acquisition or disposal the proportion of voting rights held by the person reaches, exceeds or falls below one of the thresholds of 5%, 10%, 15%, 20%, 25%, one-third, 50% or two-thirds of the total voting rights existing when the situation giving rise to a declaration occurs, the relevant person must simultaneously notify ArcelorMittal and the CSSF (the Luxembourg securities regulator) of the proportion of voting rights held by it further to such event within four Luxembourg Stock Exchange trading days of the day of execution of the transaction triggering the threshold crossing. A person must also notify ArcelorMittal of the proportion of his or her voting rights if that proportion reaches, exceeds or falls below the above mentioned thresholds as a result of events changing the breakdown of voting rights. The above notification obligations also apply to persons who directly or indirectly hold financial instruments linked to ArcelorMittal shares. Pursuant to article 12 a. of the Transparency Law, persons who hold ArcelorMittal shares and financial instruments linked to ArcelorMittal Shares must aggregate their holding. ArcelorMittal s Articles of Association also provide that the above disclosure obligations also apply to: any acquisition or disposal of shares resulting in the threshold of 2.5% of voting rights in ArcelorMittal being crossed upwards or downwards, any acquisition or disposal of shares resulting in the threshold of 3.0% of voting rights in ArcelorMittal being crossed upwards or downwards, and with respect to any shareholder holding at least 3.0% of the voting rights in ArcelorMittal, to any acquisition or disposal of shares resulting in successive thresholds of 1.0% of voting rights being crossed upwards or downwards. Pursuant to the Articles of Association of ArcelorMittal, any person who acquires shares giving him or her 5% or more
79 Management report or a multiple of 5% or more of the voting rights must inform ArcelorMittal within 10 Luxembourg Stock Exchange trading days following the date on which the threshold was crossed by registered letter with return receipt requested as to whether he or she intends to acquire or dispose of shares in ArcelorMittal within the next 12 months or intends to seek to obtain control over ArcelorMittal or to appoint a member to ArcelorMittal s Board of Directors. The sanction of suspension of voting rights will apply until such time as the notification has been properly made by the relevant shareholder(s). For the purposes of calculating the percentage of a shareholder s voting rights in ArcelorMittal, the following are taken into account: voting rights held by a third party with whom that person or entity has concluded an agreement and which obliges them to adopt, by concerted exercise of the voting rights they hold, a lasting common policy towards ArcelorMittal; voting rights held by a third party under an agreement concluded with that person or entity providing for the temporary transfer for consideration of the voting rights in question; voting rights attaching to shares pledged as collateral with that person or entity, provided the person or entity controls the voting rights and declares its intention to exercise them; voting rights attaching to shares in which a person or entity holds a life interest; voting rights which are held or may be exercised within the meaning of the four foregoing points by an undertaking controlled by that person or entity; voting rights attaching to shares deposited with that person or entity which the person or entity may exercise at its discretion in the absence of specific instructions from the shareholders; voting rights held by a third party in its own name on behalf of that person or entity; and voting rights which that person or entity may exercise as a proxy where the person or entity may exercise the voting rights in its sole discretion. In addition, the Articles of Association provide that, for the purposes of calculating a person s voting rights in ArcelorMittal, the voting rights attached to shares underlying any other financial instruments owned by that person (such as convertible notes) must be taken into account for purposes of the calculation described above. 79 Disclosure of insider dealing transactions Members of the Board of Directors and the members of the CEO Office, Executive Officers and other executives fulfilling senior management responsibilities within ArcelorMittal and falling with the definition of Persons Discharging Senior Managerial Responsibilities set out below and persons closely associated with them must disclose to the CSSF and to ArcelorMittal all transactions relating to shares or debt instruments of ArcelorMittal or derivatives or other financial instruments linked to any shares or debt instruments of ArcelorMittal (together the Financial Instruments ) conducted by them or for their account. Such notifications shall be made promptly and not later than three business days after the date of the transaction. Persons Discharging Senior Managerial Responsibilities within ArcelorMittal are the members of the Board of Directors, and the CEO Office, the Executives Officers, and other executives occupying a high level management position with regular access to non-public material information relating, directly or indirectly, to ArcelorMittal and have the authority to make management decisions about the future development of the Company and its business strategy (see "Key Transactions and events in 2017" for a description of senior management). Persons closely associated with them include their respective family members. Both information on trading in Financial Instruments by Persons Discharging Senior Managerial Responsibilities and ArcelorMittal s Insider Dealing Regulations are available on under InvestorsCorporate GovernanceShare Transactions by Management. In 2017, five notifications were received by ArcelorMittal from such persons and filed with the CSSF. Publication of regulated information Since January 2009, disclosure to the public of regulated information (within the meaning of the Luxembourg Transparency Law) concerning ArcelorMittal has been made by publishing the information through the centralized regulated information filing and storage system managed by the Luxembourg Stock Exchange and accessible in English and French on in addition to the publication by ArcelorMittal of the information by way of press release. All news and press releases issued by the Company are available on in the News and Media section.
80 80 Management report Limitation of directors liability/indemnification of Directors and the members of the CEO Office The Articles of Association of ArcelorMittal provide that ArcelorMittal will, to the broadest extent permitted by Luxembourg law, indemnify every director and member of the CEO Office as well as every former director or member of the CEO Office for fees, costs and expenses reasonably incurred in the defense or resolution (including a settlement) of all legal actions or proceedings, whether civil, criminal or administrative, he or she has been involved in his or her role as former or current director or member of the CEO Office. The right to indemnification does not exist in the case of gross negligence, fraud, fraudulent inducement, dishonesty or for a criminal offense, or if it is ultimately determined that the director or members of the CEO Office has not acted honestly, in good faith and with the reasonable belief that he or she was acting in the best interests of ArcelorMittal. Luxembourg takeover law disclosure The following disclosure is provided based on article 11 of the Luxembourg law of 19 May 2006 transposing Directive 2004/25/EC of 21 April 2004 on takeover bids (the Takeover Law ). The Articles of Association of the Company are available on com, under Investors, Corporate Governance. With regard to articles 11 (1) (a) and (c) of the Takeover Law, the Company has issued a single category of shares (ordinary shares), and the Company s shareholding structure showing each shareholder owning 2.5% or more of the Company s share capital is available elsewhere in this report and on under Investors, Corporate Governance, Shareholding Structure, where the shareholding structure chart is updated monthly. With regard to article 11(1) (b) of the Takeover Law, the ordinary shares issued by the Company are listed on various stock exchanges including NYSE and are freely transferable. With regard to article 11(1) (d), each ordinary share of the Company gives right to one vote, as set out in article 13.6 of the Articles of Association, and there are no special control rights attaching to the shares. Article 8 of the Articles of Association provides that the Mittal Shareholder (as defined in the Articles of Association) may, at its discretion, exercise the right of proportional representation and nominate candidates for appointment to the Board of Directors (defined as Mittal Shareholder Nominees ). The Mittal Shareholder has not, to date, exercised that right. Articles 11(1) (e) and (f) of the Takeover Law are not applicable to the Company. However, the sanction of suspension of voting rights automatically applies, subject to limited exceptions set out in the Transparency Law as amended from time to time (as defined below), to any shareholder (or group of shareholders) who has (or have) crossed the thresholds set out in article 7 of the Articles of Association and articles 8 to 15 of the Luxembourg law of 11 January 2008 on the transparency requirements regarding issuers of securities (the Transparency Law ) but have not notified the Company accordingly. The sanction of suspension of voting rights will apply until such time as the notification has been properly made by the relevant shareholder(s). Article 11(1) (g) of the Takeover Law is not applicable to the Company. With regard to article 11(1) (h) of the Takeover Law, the Articles of Association provide that the directors are elected by annual general meeting of shareholders for a term that may not exceed three years, and may be re-elected. The rules governing amendments to the Articles of Association are described elsewhere in this report and are set out in article 19 of the Articles of Association. With regard to article 11(1) (i) of the Takeover Law, the general meeting of shareholders held on May 05, 2015 granted the Board of Directors a new share buy-back authorization whereby the Board may authorize the acquisition or sale of Company shares including, but not limited to, entering into off-market and over-the-counter transactions and the acquisition of shares through derivative financial instruments. Any acquisitions, disposals, exchanges, contributions or transfers of shares by the Company or other companies in the ArcelorMittal group must be in accordance with Luxembourg laws transposing Regulation 2014/57/EU on market abuse and EC Supplementing Regulation 2016/1052 regarding conditions applicable to buy-back programs and stabilization measures and may be carried out by all means, on or off-market, including by a public offer to buy-back shares, or by the use of derivatives or option strategies. The fraction of the capital acquired or transferred in the form of a block of shares may amount to the entire program. Such transactions may be carried out at any time, including during a tender offer period, in accordance with applicable laws and regulations, including Section 10(b) and Section 9(a)(2) of the Securities Exchange Act of 1934, as amended (the Exchange Act ), and Rule 10b-5 promulgated under the Exchange Act. The authorization is valid for a period of five years, i.e., until the annual general meeting of shareholders to be held in May 2020, or until the date of its renewal by a resolution of the general meeting of shareholders if such renewal date is prior to the expiration the five-year period. The maximum number of own shares that the Company may hold at any time directly or indirectly may not have the effect of reducing its net assets ( actif net ) below the amount mentioned in paragraphs 1 and 2 of Article of the Grand-Ducal Regulation coordinating the amended law of 10 August 1915 on commercial companies. The purchase price per share to be paid shall not represent more than 110% of the trading price of the shares on the New York Stock Exchange
81 Management report and on the Euronext markets where the Company is listed, the Luxembourg Stock Exchange or the Spanish stock exchanges of Barcelona, Bilbao, Madrid and Valencia, depending on the market on which the purchases are made, and no less than one cent. For off-market transactions, the maximum purchase price shall be 110% of the reference price on the Euronext markets where the Company is listed. The reference price will be deemed to be the average of the final listing prices per share on the relevant stock exchange during 30 consecutive days on which the relevant stock exchange is open for trading preceding the three trading days prior to the date of purchase. In the event of a share capital increase by incorporation of reserves or issue premiums and the free allotment of shares as well as in the event of the division or regrouping of the shares, the purchase price indicated above shall be adjusted by a multiplying coefficient equal to the ratio between the number of shares comprising the issued share capital prior to the transaction and such number following the transaction. The total amount allocated for the Company s share repurchase program may not in any event exceed the amount of the Company s then available equity. Articles 11(1) (j) and (k) of the Takeover Law are not applicable to the Company. Material contracts The following are material contracts, not entered into in the ordinary course of business, to which ArcelorMittal has been a party during the past two years. ArcelorMittal Equity Incentive Plan, Performance Share Unit Plan and Special Grant For a description of such plans, please refer to Compensation. Memorandum of Understanding On June 25, 2006, Mittal Steel, the Significant Shareholder and Arcelor signed a binding Memorandum of Understanding ( MoU ) to combine Mittal Steel and Arcelor in order to create the world s leading steel company. In April 2008, the Board of Directors approved resolutions amending certain provisions of the MoU in order to adapt it to the Company s needs in the post-merger and postintegration phase, as described under "Board practices/ corporate governance, Operation, Lead Independent Director". On the basis of the MoU, Arcelor s Board of Directors recommended Mittal Steel s offer for Arcelor, and the parties to the MoU agreed to certain corporate governance and other matters relating to the combined ArcelorMittal group. Certain provisions of the MoU relating to corporate governance were incorporated into the Articles of Association of ArcelorMittal at the extraordinary general meeting of the shareholders on November 5, Certain additional provisions of the MoU expired effective August 1, 2009 and on August 1, ArcelorMittal s corporate governance rules will continue to reflect, subject to those provisions of the MoU that have been incorporated into the Articles of Association, the best standards of corporate governance for comparable companies and to conform with the corporate governance aspects of the NYSE listing standards applicable to non-u.s. companies and Ten Principles of Corporate Governance of the Luxembourg Stock Exchange. The following summarizes the main provisions of the MoU that remain in effect or were in effect in Standstill The Significant Shareholder agreed not to acquire, directly or indirectly, ownership or control of an amount of shares in the capital stock of the Company exceeding the percentage of shares in the Company that it will own or control following completion of the Offer (as defined in the MoU) for Arcelor and any subsequent offer or compulsory buy-out, except with the prior written consent of a majority of the independent directors on the Company s Board of Directors. Any shares acquired in violation of this restriction will be deprived of voting rights and shall be promptly sold by the Significant Shareholder. Notwithstanding the above, if (and whenever) the Significant Shareholder holds, directly and indirectly, less than 45% of the then-issued Company shares, the Significant Shareholder may purchase (in the open market or otherwise) Company shares up to such 45% limit. In addition, the Significant Shareholder is also permitted to own and vote shares in excess of the threshold mentioned in the immediately preceding paragraph or the 45% limit mentioned above, if such ownership results from (1) subscription for shares or rights in proportion to its existing shareholding in the Company where other shareholders have not exercised the entirety of their rights or (2) any passive crossing of this threshold resulting from a reduction of the number of Company shares (e.g., through self-tender offers or share buy-backs) if, in respect of (2) only, the decisions to implement such measures were taken at a shareholders meeting in which the Significant Shareholder did not vote or by the Company s Board of Directors with a majority of independent directors voting in favor. Once the Significant Shareholder exceeds the threshold mentioned in the first paragraph of this Standstill subsection or the 45% limit, as the case may be, as a consequence of any corporate event set forth in (1) or (2) above, it shall not be permitted to increase the percentage of shares it owns or controls in any way except as a result of subsequent occurrences of the corporate events described in (1) or (2) above, or with the prior written consent of a majority of the independent directors on the Company s Board of Directors.
82 82 Management report If subsequently the Significant Shareholder sells down below the threshold mentioned in the first paragraph of this Standstill subsection or the 45% limit, as the case may be, it shall not be permitted to exceed the threshold mentioned in the first paragraph of this Standstill subsection or the 45% limit, as the case may be, other than as a result of any corporate event set out in (1) or (2) above or with the prior written consent of a majority of the independent directors. Finally, the Significant Shareholder is permitted to own and vote shares in excess of the threshold mentioned in the first paragraph of this Standstill subsection or the 45% limit mentioned above if it acquires the excess shares in the context of a takeover bid by a third party and (1) a majority of the independent directors of the Company s Board of Directors consents in writing to such acquisition by the Significant Shareholder or (2) the Significant Shareholder acquires such shares in an offer for all of the shares of the Company. Non-compete For so long as the Significant Shareholder holds and controls at least 15% of the outstanding shares of the Company or has representatives on the Company s Board of Directors or CEO Office, the Significant Shareholder and its affiliates will not be permitted to invest in, or carry on, any business competing with the Company, except for PT ISPAT Indo. Additional information ArcelorMittal produces a range of publications to inform its shareholders. These documents are available in various formats: they can be viewed online, downloaded or obtained on request in paper format. Please refer to to the Investors menu, under Financial Reports. Sustainable development ArcelorMittal s sustainable development information is detailed in the online Annual Review that will be published during the second quarter of 2018 and available on annualreview2017.arcelormittal.com. ArcelorMittal as parent company of the ArcelorMittal group ArcelorMittal, incorporated under the laws of Luxembourg, is the parent company of the ArcelorMittal group and is expected to continue this role during the coming years. The Company has no branch offices. Group companies listed on the Luxembourg Stock Exchange ArcelorMittal s securities are traded on several exchanges, including the Luxembourg Stock Exchange, and its primary stock exchange regulator is the Luxembourg CSSF (Commission de Surveillance du Secteur Financier). ArcelorMittal s CSSF issuer number is E Other listings ArcelorMittal is listed on the stock exchanges of New York (MT), Amsterdam (MT), Paris (MT), Luxembourg (MT) and on the Spanish stock exchanges of Barcelona, Bilbao, Madrid and Valencia (MTS). Indexes ArcelorMittal is a member of more than 120 indices including the following leading indices: DJ SOTXX 50, DJ EURO STOXX 50, CAC40, AEX, FTSE Eurotop 100, MSCI Pan-Euro, DJ Stoxx 600, S&P Europe 500, Bloomberg World Index, IBEX 35 index, and NYSE Composite Index. Recognized for its commitments to sustainable development, ArcelorMittal is also included in the FTSE4Good Index and VBSDO s Benchmark of Circular business Practices Further, ArcelorMittal has been participating in CDP since 2005 and the United National Global Compact since Share price performance During 2017, the price of ArcelorMittal shares increased by 29% in euro terms compared to 2016; the chart below shows a comparison between the performance of ArcelorMittal s shares and the Eurostoxx600 Basic Resource (SXPP) which increased by 19% in 2017 compared to 2016.
83 Management report Dividend On January 31, 2018, the Company announced that the Board has agreed on a new dividend policy which will be proposed to shareholders at the annual general meeting of shareholders in May Given the current de-leveraging focus, dividends will begin at $0.10/share in 2018 (paid from 2017 results). Once the Company achieves net debt at or below its $6 billion target, then the Company is committed to returning a portion of the amount of annual net cash provided by operating activities less capital expenditures to shareholders. Investor relations As the world s leading steel company and major investment vehicle in the steel sector, ArcelorMittal has a dedicated investor relations team at the disposal of analysts and investors. By implementing high standards of financial information disclosure and providing clear, regular, transparent and even-handed information to all its shareholders, ArcelorMittal aims to be the first choice for investors in the sector. To meet this objective and provide information to fit the needs of all parties, ArcelorMittal implements an active and broad investor communications policy: conference calls, road shows with the financial community, regular participation at investor conferences, plant visits and meetings with individual investors. ArcelorMittal s senior management plans to meet investors and shareholder associations in road shows throughout Depending on their geographical location, investors may use the following s or contact numbers to reach the investor relations team: institutionalsamericas@arcelormittal.com investor.relations@arcelormittal.com privateinvestors@arcelormittal.com creditfixedincome@arcelormittal.com Sustainable responsible investors The Investor Relations team is also a source of information for the growing sustainable responsible investment community. The team organizes special events on ArcelorMittal s corporate responsibility strategy and answers all requests for information sent to the Group crteam@arcelormittal.com or may be contacted at Financial calendar The schedule is available on ArcelorMittal s website under Investor>Financial calendar. Financial results* January 31, Results for the 4th quarter 2017 and 12 months May 11, Results for the 1st quarter August 1, Results for the 2nd quarter 2018 and 6 months 2018.
84 84 Management report November 1, Results for the 3rd quarter * Earnings results are issued before the opening of the stock exchanges on which ArcelorMittal is listed. Meeting of shareholders May 9, Annual General Meeting of Shareholders. Contact the investor relations team on the information detailed above or please visit investors/contact. Controls and procedures Disclosure controls and procedures Management maintains disclosure controls and procedures that are designed to ensure that information required to be disclosed in the Company s reports under the Securities Exchange Act of 1934, as amended (the Exchange Act ) is recorded, processed, summarized and reported within time periods specified in the SEC s rules and forms, and that such information is accumulated and communicated to management, including the Chief Executive Officer and Chief Financial Officer, as appropriate, to allow timely decisions regarding required disclosures. ArcelorMittal s controls and procedures are designed to provide reasonable assurance of achieving their objectives. Management carried out an evaluation, under the supervision and with the participation of its Chief Executive Officer and Chief Financial Officer, of the effectiveness of the design and operation of the Company s disclosure controls and procedures (as defined in Exchange Act Rule 13a-15(e)) as of December 31, Based upon that evaluation, the Company s Chief Executive Officer and Chief Financial Officer concluded that the Company s disclosure controls and procedures were effective as of December 31, 2017 so as to provide reasonable assurance that (1) information required to be disclosed by the Company in the reports that the Company files under the Exchange Act is recorded, processed, summarized and reported within the time periods specified in the SEC s rules and forms, and (2) that such information is accumulated and communicated to the Company s management, including its Chief Executive Officer and its Chief Financial Officer, as appropriate, to allow timely decisions regarding required disclosures. There are inherent limitations to the effectiveness of any system of disclosure controls and procedures, including the possibility of human error and the circumvention or overriding of the controls and procedures. Accordingly, even effective disclosure controls and procedures can only provide reasonable assurance of achieving their control objectives. Management s Annual Report on Internal Control Over Financial Reporting Management is responsible for establishing and maintaining adequate internal control over financial reporting. Internal control over financial reporting is a process designed to provide reasonable assurance regarding the reliability of financial reporting and the preparation of financial statements for external purposes in accordance with generally accepted accounting principles. The Company s internal control over financial reporting includes those policies and procedures that: pertain to the maintenance of records that, in reasonable detail, accurately and fairly reflect the transactions and dispositions of the assets of ArcelorMittal; provide reasonable assurance that transactions are recorded, as necessary, to permit preparation of financial statements in accordance with IFRS; provide reasonable assurance that receipts and expenditures of ArcelorMittal are made in accordance with authorizations of ArcelorMittal's management and directors; and provide reasonable assurance that unauthorized acquisition, use or disposition of ArcelorMittal s assets that could have a material effect on the financial statements would be prevented or detected on a timely basis. Because of its inherent limitations, internal control over financial reporting is not intended to provide absolute assurance that a misstatement of the Company s financial statements would be prevented or detected. In addition, projections of any evaluation of effectiveness to future periods are subject to the risk that controls may become inadequate because of changes in conditions, or that the degree of compliance with the policies or procedures may deteriorate. Management assessed the effectiveness of internal control over financial reporting as of December 31, 2017 based upon the framework in Internal ControlIntegrated Framework (2013) issued by the Committee of Sponsoring Organizations of the Treadway Commission ( COSO ). Based on this assessment, management concluded that ArcelorMittal s internal control over financial reporting was effective as of December 31, Changes in Internal Control over Financial Reporting There have been no changes in the Company s internal control over financial reporting that occurred during the year ending December 31, 2017 that have materially affected or are reasonably likely to have materially affected the Company s internal control over financial reporting.
85 Management report 85 Chief executive officer and chief financial officer s responsibility statement We confirm, to the best of our knowledge, that: 1. the consolidated financial statements of ArcelorMittal presented in this Annual Report and prepared in conformity with International Financial Reporting Standards as issued by the International Accounting Standards Board and as adopted by the European Union, give a true and fair view of the assets, liabilities, financial position, profit or loss of ArcelorMittal and the undertakings included within the consolidation taken as a whole; and 2. the management report includes a fair review of the development and performance of the business and position of ArcelorMittal and undertakings included within the consolidation taken as a whole, together with a description of the principal risks and uncertainties they face. Chief executive officer Chief financial officer Lakshmi N. Mittal Aditya Mittal February 16, 2018 February 16, 2018
86
87 Consolidated financial statements 87 ArcelorMittal and Subsidiaries Consolidated Statements of Operations Year Ended December 31, ,791 63,578 Notes 4.1 and , and ,876 50,428 65,196 Gross margin 7,803 6,363 (1,618) Selling, general and administrative expenses 2,369 2,202 2,543 Operating income (loss) 5,434 4,161 (4,161) Sales (including 7,503, 5,634, and 6,124 of sales to related parties for 2017, 2016 and 2015, respectively) Cost of sales (including 1,033, 1,390 and 1,460 of purchases from related parties for 2017, 2016 and 2015, respectively) Income (loss) from investments in associates, joint ventures and other investments Financing costs - net 6.2 (875) 615 (502) (2,056) (2,858) 5,007 2,720 (7,521) Net income (loss) (including non-controlling interests) 4,575 1,734 (8,423) Net income (loss) attributable to equity holders of the parent 4,568 1,779 (7,946) Income (loss) before taxes Income tax expense 9.1 Net income (loss) attributable to non-controlling interests 7 4,575 Net income (loss) (including non-controlling interests) 2017 (45) 1, (477) (8,423) Year Ended December 31, Earnings (loss) per common share (in U.S. dollars) 1 Basic (10.29) Diluted (10.29) Basic 1, Diluted 1, Weighted average common shares outstanding (in millions) Following the completion of the Company s share consolidation of each three existing shares into one share without nominal value on May 22, 2017, the earnings (loss) per common share and corresponding basic and diluted weighted average common shares outstanding for prior periods has been recast in accordance with IFRS. Please refer to note 10 for more information. The accompanying notes are an integral part of these consolidated financial statements.
88 Consolidated financial statements 88 ArcelorMittal and Subsidiaries Consolidated Statements of Other Comprehensive Income ,575 Net income (loss) (including non-controlling interests) Year Ended December 31, ,734 (8,423) Items that can be recycled to the consolidated statements of operations Available-for-sale investments: Gain (loss) arising during the period Reclassification adjustments for (gain) loss included in the consolidated statements of operations (439) (74) (369) (340) (14) (93) (312) Derivative financial instruments: Gain (loss) arising during the period Reclassification adjustments for (gain) loss included in the consolidated statements of operations Exchange differences arising on translation of foreign operations: (398) (7,876) (13) (11) 2,004 (411) (7,887) Gain (loss) arising during the period 341 (79) (666) Reclassification adjustments for (gain) loss included in the consolidated statements of operations (662) 167 (26) Gain (loss) arising during the period Reclassification adjustments for (gain) loss included in the consolidated statements of operations 2,025 (21) Share of other comprehensive income (loss) related to associates and joint ventures Income tax benefit (expense) related to components of other comprehensive income (loss) that can be recycled to the consolidated statements of operations 4 Items that cannot be recycled to the consolidated statements of operations Employee benefits - Recognized actuarial gains (losses) 1,098 Share of other comprehensive income (loss) related to associates and joint ventures 29 (24) (36) Income tax benefit (expense) related to components of other comprehensive income that cannot be recycled to the consolidated statements of operations 42 1 (47) Total other comprehensive income (loss) 4,083 (159) (8,884) 4,037 (186) (8,554) Total other comprehensive income gain (loss) attributable to: Equity holders of the parent Non-controlling interests 46 4,083 Total comprehensive income (loss) (330) 27 (159) (8,884) 8,658 1,575 (17,307) 8,605 1,593 (16,500) Total comprehensive income (loss) attributable to: Equity holders of the parent Non-controlling interests Total comprehensive income (loss) 53 8,658 The accompanying notes are an integral part of these consolidated financial statements. (18) 1,575 (807) (17,307)
89 Consolidated financial statements 89 ArcelorMittal and Subsidiaries Consolidated Statements of Financial Position ASSETS Current assets: Cash and cash equivalents Restricted cash Trade accounts receivable and other (including 406 and 322 from related parties at December 31, 2017 and 2016, respectively) December 31, , , ,863 2, ,986 1, ,745 14,734 1, , ,737 36,971 5,084 1,471 7,055 2,234 58,552 85,297 5,651 34,831 4, ,837 1,353 52,895 75, ,785 1, and ,428 11, , , , ,115 10,143 2,684 7,630 1, ,032 44,442 11,789 2,529 8,297 1, ,702 42, Short-term provisions Accrued expenses and other liabilities Income tax liabilities Liabilities held for sale Total current liabilities Non-current liabilities: Long-term debt, net of current portion Deferred tax liabilities Deferred employee benefits Long-term provisions Other long-term obligations Total non-current liabilities Total liabilities Contingencies and commitments and 11.1 Inventories Prepaid expenses and other current assets Assets held for sale Total current assets Non-current assets: Goodwill and intangible assets Property, plant and equipment and biological assets Investments in associates and joint ventures Other investments Deferred tax assets Other assets Total non-current assets Total assets LIABILITIES AND EQUITY Current liabilities: Short-term debt and current portion of long-term debt Trade accounts payable and other (including 260 and 179 to related parties at December 31, 2017 and 2016, respectively) Notes and 8.3 Equity: Common shares (no par value, 1,151,576,921 and 1,124,093,985 shares authorized, 1,021,903,623 and 1,021,903,623 shares issued, and 1,019,916,787 and 1,019,496,143 shares outstanding at December 31, 2017 and 2016, respectively) Treasury shares (1,986,836 and 2,407,480 common shares at December 31, 2017 and 2016, respectively, at cost) Additional paid-in capital Retained earnings Reserves Equity attributable to the equity holders of the parent Non-controlling interests Total equity Total liabilities and equity The accompanying notes are an integral part of these consolidated financial statements. 10 (362) (371) 34,848 20,635 (16,733) 38,789 2,066 40,855 85,297 34,826 16,049 (20,770) 30,135 2,190 32,325 75,142
90 90 Consolidated financial statements ArcelorMittal and Subsidiaries Consolidated Statements of Changes in Equity Reserves Items that cannot be recycled to the Consolidated Statements of Operations Items that can be recycled to the Consolidated Statements of Operations Additional Paid-in Capital Retained Earnings 1,838 20,258 22,182 Foreign Currency Translation Adjustments Unrealized Gains (Losses) on Availablefor-Sale Securities Recognized actuarial (losses) gains Equity attributable to the equity holders of the parent Noncontrolling interests Total Equity 42,086 3,074 45,160 Shares 1 Share capital ,011 Net loss (including non-controlling interests) Other comprehensive income (loss) Total comprehensive income (loss) Other changes in non-controlling interests (note 10.5) Recognition of share based payments (note 7.3) Balance at December 31, 2014 Voluntary conversion of mandatorily convertible notes (note 10.2) Treasury Shares Mandatorily convertible notes Unrealized Gains (Losses) on Derivative Financial Instruments (399) (7,946) (7,946) (7,627) (4,671) (8,423) (7,946) (477) (8,166) 25 (354) (59) (8,554) (330) (8,884) (8,166) 25 (354) (59) (16,500) (807) (17,307) 1 18 (38) 20 Mandatory convertible bonds extension (note 10.2) (20) (20) Dividend (note 10.4) (331) (331) (86) (417) Other movements (3) (3) (11) ,011 1,800 20,294 13, Net income (including noncontrolling interests) 1,779 Other comprehensive income (loss) (471) (14) Total comprehensive income (loss) 1,779 (471) (14) 1,593 (18) 1, ,971 3,115 3,115 10,376 Balance at December 31, 2015 Equity offering (note 10.1) (377) (15,793) (4,730) 25,272 1,779 (186) 2,298 (45) (14) 27,570 1, (159) Reduction of the share capital par value (note 10.1) Conversion of the mandatorily convertible notes (note 10.2) ,178 Recognition of share-based payments (note 7.3) Dividend (note 10.4) (63) (63) Equity offering in ArcelorMittal South Africa ("AMSA") (note ) 437 (301) 136 (80) 56 Equity share option plan in AMSA (note ) (36) 21 (15) 15 AMSA B-BBEE transaction (note ) ,826 16,049 Other movements (10,376) (1,800) 1, Net income (including noncontrolling interests) 4,568 Other comprehensive income (loss) 2,602 (235) 501 1,169 Total comprehensive income (loss) 4,568 2,602 (235) 501 Recognition of share-based payments (note 7.3) 9 22 Dividend (note 10.4) Acquisition of Sumaré (note 2.2.4) Mandatory convertible bonds extension (note 10.2) Other movements 18 1, ,848 20,635 Balance at December 31, 2016 Balance at December 31, (371) (362) (77) (16,544) (23) (4) 32,325 4, ,575 4, ,083 1,169 8, , (145) (145) (83) (83) ,789 2,066 40,855 (13,942) (93) 823 (3,521) 30, ,190 (4,690) 31 Amounts are in millions of shares (treasury shares are excluded). On May 22, 2017, ArcelorMittal completed the consolidation of each three existing shares in ArcelorMittal without nominal value into one share without nominal value. As a result of this reverse stock split, the number of outstanding shares decreased from 3,058 to 1,020 and all prior periods have been recast in accordance with IFRS. Please refer to note 10 for further information. The accompanying notes are an integral part of these consolidated financial statements.
91 Consolidated financial statements 91 ArcelorMittal and Subsidiaries Consolidated Statements of Cash Flows Notes Operating activities: Net income (loss) (including non-controlling interests) Adjustments to reconcile net income (loss) to net cash provided by operations: Depreciation and amortization Impairment Interest expense Interest income Income tax expense (benefit) Remeasurement gain relating to US deferred employee benefits Net gain on disposal of subsidiaries (Income) loss from investments in associates, joint ventures and other investments Provision on pensions and OPEB Change in fair value adjustment on call option on mandatory convertible bonds and pellet purchase agreement ,575 1,734 (8,423) 5.1 and and , (56) 432 (18) (448) 555 2, ,172 (58) 986 (832) (23) (615) 439 3,192 4,764 1,383 (105) 902 (72) (578) (138) 108 (541) (201) Unrealized foreign exchange effects Write-downs (reversal) of inventories to net realizable value, provisions and other non-cash operating expenses net Changes in assets and liabilities that provided (required) cash, net of acquisitions: Trade accounts receivable Inventories Trade accounts payable and other Interest paid Interest received Income taxes paid Dividends received from associates, joint ventures and other investments Cash contributions to plan assets and benefits paid for pensions and OPEB VAT and other amounts received (paid) from/to public authorities Other working capital and provisions movements Net cash provided by operating activities Investing activities: Purchase of property, plant and equipment and intangibles Disposals of net assets of subsidiaries, net of cash disposed of 13, nil and 10 in 2017, 2016 and 2015, respectively Acquisitions of net assets of subsidiaries, net of cash acquired of 617, 63 and nil in 2017, 2016 and 2015, respectively Disposals of associates and joint ventures Disposals of financial assets Other investing activities net Net cash used in investing activities Financing activities: Disposal of non-controlling interests Proceeds from short-term debt Proceeds from long-term debt Payments of short-term debt Payments of long-term debt Equity offering Dividends paid (includes 141, 61 and 85 of dividends paid to non-controlling shareholders in 2017, 2016 and 2015, respectively) Other financing activities net Net cash (used in) provided by financing activities Net increase (decrease) in cash and cash equivalents Effect of exchange rate changes on cash Cash and cash equivalents: At the beginning of the year Reclassification of the period-end cash and cash equivalents from (to) held for sale At the end of the year December 31, ,420 (620) (2,347) 1,094 (947) 57 (506) 232 (496) (177) (282) 4,563 (373) (2,055) 1,405 (1,354) 60 (296) 176 (395) 46 (382) 2, (1,012) (1,561) 89 (398) 227 (556) 166 (81) 2,151 (2,819) (2,444) (2,707) and (77) (2,830) 1, (73) (1,143) (2,170) ,859 1,407 (2,102) (2,691) 56 1, (2,721) (4,912) 3, ,256 (2,490) (501) (141) (61) (416) (63) (1,731) 2 58 (29) (2,926) (1,361) (127) (267) 2, ,574 4,002 (13) 2,501 The accompanying notes are an integral part of these consolidated financial statements ,893 4,002
92 92 Consolidated financial statements Summary of notes to consolidated financial statements 1.2 Use of judgment and estimates Note 7: Personnel expenses and deferred employee benefits 7.1 Employees and key management personnel 7.2 Deferred employee benefits 1.3 Accounting standards applied 7.3 Note 1: Accounting principles 1.1 Basis of presentation Share-based payments Note 2: Scope of consolidation 2.1 Basis of consolidation Note 8: Provisions, contingencies and commitments 8.1 Provisions overview 2.2 Investments in subsidiaries Divestments and assets held for sale Environmental liabilities, asset retirement obligations and legal proceedings 2.4 Investments in associates and joint arrangements 8.3 Commitments 2.5 Other investments 2.6 Income (loss) from investments in associates, joint ventures and other investments Note 9: Income taxes 9.1 Income tax expense (benefit) 9.2 Income tax recorded directly in equity Note 3: Segment reporting 3.1 Reportable segments 9.3 Uncertain tax positions 9.4 Deferred tax assets and liabilities 3.2 Geographical information Sales by type of products Tax losses, tax credits and other tax benefits carried forward Note 4: Operating data 4.1 Revenue 4.2 Cost of sales 4.3 Trade accounts receivable and other 4.4 Inventories 4.5 Prepaid expenses and other current assets 4.6 Other assets 4.7 Trade accounts payable and other 4.8 Accrued expenses and other liabilities Note 5: Goodwill, intangible and tangible assets 5.1 Goodwill and intangible assets 5.2 Property, plant and equipment and biological assets 5.3 Impairment of intangible assets, including goodwill, and tangible assets Note 6: Financing and financial instruments 6.1 Financial assets and liabilities 6.2 Financing costs - net 6.3 Risk management policy Note 10: Equity 10.1 Share details 10.2 Equity instruments and hybrid instruments 10.3 Earnings per common share 10.4 Dividends 10.5 Non-controlling interests Note 11: Related parties 11.1 Sales and trade receivables 11.2 Purchases and trade payables 11.3 Other transactions with related parties Note 12: Principal accountant fees and services Note 13: Subsequent event
93 93 Consolidated financial statements Note 1: Accounting principles ArcelorMittal ( ArcelorMittal or the Company ), together with its subsidiaries, owns and operates steel manufacturing and mining facilities in Europe, North and South America, Asia and Africa. Collectively, these subsidiaries and facilities are referred to in the consolidated financial statements as the operating subsidiaries. These consolidated financial statements were authorized for issuance on February 16, 2018 by the Company s Board of Directors. 1.1 Basis of presentation The consolidated financial statements have been prepared on a historical cost basis, except for available-for-sale financial assets, derivative financial instruments, biological assets and certain assets and liabilities held for sale, which are measured at fair value less cost to sell, inventories, which are measured at the lower of net realizable value or cost, and the financial statements of the Company s Venezuelan tubular production facilities Industrias Unicon CA ( Unicon ), for which hyperinflationary accounting is applied (see note 2.2.2). The consolidated financial statements have been prepared in accordance with International Financial Reporting Standards ( IFRS ) as issued by the International Accounting Standards Board ( IASB ) and as adopted by the European Union and are presented in U.S. dollars with all amounts rounded to the nearest million, except for share and per share data. 1.2 Use of judgment and estimates The preparation of consolidated financial statements in conformity with IFRS recognition and measurement principles and, in particular, making the critical accounting judgments requires the use of estimates and assumptions that affect the reported amounts of assets, liabilities, revenues and expenses. Management reviews its estimates on an ongoing basis using currently available information. Changes in facts and circumstances or obtaining new information or more experience may result in revised estimates, and actual results could differ from those estimates. The following summary provides further information about the Company s critical accounting policies under which significant judgments, estimates and assumptions are made. It should be read in conjunction with the notes mentioned in the summary: Deferred tax assets (note 9): The Company assesses the recoverability of deferred tax assets based on future taxable income projections, which are inherently uncertain and may be subject to changes over time. Judgment is required to assess the impact of such changes on the measurement of these assets and the time frame for their utilization. In addition, the Company applies judgment to recognize income tax liabilities when they are probable and can be reasonably estimated depending on the interpretation, which may be uncertain, of applicable tax laws and regulations. ArcelorMittal periodically reviews its estimates to reflect changes in facts and circumstances. Provisions for pensions and other post-employment benefits (note 7.2): Benefit obligations and plan assets can be subject to significant volatility, in particular due to changes in market conditions and actuarial assumptions. Such assumptions differ by plan, take local conditions into account and include discount rates, expected rates of compensation increases, health care cost trend rates, mortality and retirement rates. They are determined following a formal process involving the Company's expertise and independent actuaries. Assumptions are reviewed annually and adjusted following actuarial and experience changes. Provisions (note 8): Provisions, which result from legal or constructive obligations arising as a result of past events, are recognized based on the Company's, and in certain instances, third-party's best estimate of costs when the obligation arises. They are reviewed periodically to take into consideration changes in laws and regulations and underlying facts and circumstances. Impairment of tangible and intangible assets, including goodwill (note 5.3): In the framework of the determination of the recoverable amount of assets, the estimates, judgments and assumptions applied for the value in use calculations relate primarily to growth rates, expected changes to average selling prices, shipments and direct costs. Assumptions for average selling prices and shipments are based on historical experience and expectations of future changes in the market. Discount rates are reviewed annually. Derivative financial instruments (note 6.1.5): Certain of the Company's derivative financial instruments are classified as Level 3 as they include unobservable inputs. In particular, the Company uses estimates to compute unobservable volatility based on movements of stock market prices for the fair valuation of the call option on the 1,000 mandatory convertible bonds. Mining reserve estimates (note 5.2): Proven iron ore and coal reserves are those quantities whose recoverability can be determined with reasonable certainty from a given date forward and under existing government regulations, economic and operating conditions; probable reserves have a lower degree of assurance but high enough to assume continuity between points of observation. Their estimates and the estimates of mine lives have been prepared by ArcelorMittal experienced engineers and geologists and detailed independent verifications of the methods and procedures are conducted on a regular basis by external consultants. Reserves are updated
94 94 Consolidated financial statements annually and calculated using a 3-year average reference price duly adjusted for quality, ore content, logistics and other considerations. In order to estimate reserves, estimates are required for a range of geological, technical and economic factors, including quantities, grades, production techniques, recovery rates, production costs, transport costs, commodity demand, commodity prices and exchange rates. Estimating the quantity and/or grade of reserves requires the size, shape and depth of ore bodies to be determined by analyzing geological data such as drilling samples. This process may require complex and difficult geological judgments to interpret the data. Because the economic assumptions used to estimate reserves change from period to period, and because additional geological data is generated during the course of operations, estimates of reserves may change from period to period. 1.3 Accounting standards applied Adoption of new IFRS standards, amendments and interpretations applicable from January 1, 2017 On January 1, 2017, the Company adopted the following amendments which have an impact on the disclosure in the consolidated financial statements of the Company: Amendments to IAS 7 Statement of Cash Flows issued on January 29, 2016, which clarify that entities shall provide disclosures that enable users of financial statements to evaluate changes in liabilities arising from financing activities, including non-cash changes and changes arising from cash flows. The additional disclosures are reflected in note On January 1, 2017, the Company adopted the following amendments which did not have any material impact on the consolidated financial statements of the Company: Amendments to IAS 12 Income Taxes issued on January 19, 2016, which clarify how to account for deferred tax assets related to debt instruments measured at fair value and how to recognize deferred tax assets for unrealized losses. Annual Improvements published on December 8, 2016, which amended IFRS 12 Disclosure of Interests in Other Entities and clarifies the scope of the standard by specifying that the disclosure requirements in the standard apply to an entity s interests that are classified as held for sale, as held for distribution or as discontinued operations in accordance with IFRS 5 Noncurrent Assets Held for Sale and Discontinued Operations New IFRS standards and amendments applicable from 2018 onward On May 28, 2014, the IASB issued IFRS 15 Revenue from Contracts with Customers which provides a unified fivestep model for determining the timing, measurement and recognition of revenue. The focus of the new standard is to recognize revenue as performance obligations are met rather than based on the transfer of risks and rewards. IFRS 15 includes a comprehensive set of disclosure requirements including qualitative and quantitative information about contracts with customers to understand the nature, amount, timing and uncertainty of revenue. The standard supersedes IAS 18 Revenue, IAS 11 Construction Contracts and a number of revenue-related interpretations. On September 11, 2015, the IASB issued an amendment formalizing a oneyear deferral of the effective date for annual periods beginning on or after January 1, 2018, with early application permitted. On April 12, 2016, the IASB issued amendments to IFRS 15 which clarify how to identify a performance obligation, determine whether a company is a principal or an agent and determine when the revenue from granting a license should be recognized. These amendments are also effective for annual periods beginning on or after January 1, 2018, with early application permitted. The Company s revenue is predominantly derived from the single performance obligation to transfer steel and mining products under arrangements in which the transfer of risks and rewards of ownership and the fulfillment of the Company s performance obligation occur at the same time. The Company has laid out a detailed assessment and implementation plan for the roll out of IFRS 15. As part of this process the Company assessed its performance obligations underlying the revenue recognition, estimation of variable considerations including rebates, methods for estimating warranties, and customized products. The Company concluded that there will not be a material impact, except for the impact it will have on the disclosures. ArcelorMittal has established the procedures and controls to commence applying IFRS 15 as of January 1, 2018, and intends to apply the full retrospective transition approach without any practical expedients and will accordingly recast its comparative information where applicable. On July 24, 2014, the IASB issued the final version of IFRS 9 Financial Instruments (2014) which replaces IAS 39 and modifies substantially the classification and measurement of financial instruments. The final version of the standard contains requirements in the following areas: Classification and measurement: Financial assets are classified and measured by reference to the business model within which they are held and their contractual cash flow characteristics. Financial liabilities are classified in a similar manner to IAS 39, however there are differences in the requirements regarding the measurement of an entity's own credit risk.
95 Consolidated financial statements 95 Impairment: The standard introduces an 'expected credit loss' model replacing the current incurred loss model for the measurement of the impairment of financial assets; it is therefore no longer necessary for a credit event to have occurred before a credit loss is recognized. Hedge accounting: The standard introduces a new hedge accounting model that is designed to more closely align with how entities undertake risk management activities when hedging financial and non-financial risk exposures, which may result in the increased application of hedge accounting. Derecognition: The requirements for derecognition of financial assets and liabilities are carried forward from IAS 39. IFRS 9 is effective for annual periods beginning on or after January 1, 2018, with early application permitted and is applied retrospectively, except for the hedge accounting requirements which are applied prospectively. The Company has substantially finalized its assessment of the impact upon adoption of IFRS 9 and does not expect this impact to be material. While ArcelorMittal will provide additional disclosures as required by the new standard and update the hedge documentation when hedge accounting is applied, the Company does not expect the standard to materially impact the measurement of either its financial liabilities, which are mainly carried at amortized cost or its financial assets, which are mainly comprised of cash and cash equivalents, trade receivables and available-for-sale equity instruments. However, the Company will make the irrevocable election upon adoption of IFRS 9 to classify the latter at fair value through other comprehensive income, as a result of which unrealized gains and losses which the Company currently recognizes in the consolidated statements of other comprehensive income (823 net gain as at December 31, 2017) will not be any longer recycled to the consolidated statements of operations upon disposal. On January 13, 2016, the IASB issued IFRS 16 Leases which will replace IAS 17 Leases. This new standard specifies how to recognize, measure, present and disclose leases. The standard provides a single lessee accounting model, requiring lessees to recognize assets and liabilities for all leases unless the lease term is 12 months or less or the underlying asset has a low value. This standard is effective for annual periods beginning on or after January 1, 2019, with early application permitted if IFRS 15 has also been applied. At December 31, 2017 and 2016, the Company has non-cancellable operating lease commitments on an undiscounted basis of 1,311 and 1,312, respectively (see note 8.3). A preliminary review and assessment of the Company's lease arrangements indicates that most of these arrangements will meet the definition of a lease under IFRS 16. The Company intends to apply the modified retrospective transition approach with the cumulative effect of initial application of IFRS 16 recognized at January 1, In addition, it intends to apply the practical expedient to grandfather the definition of a lease on transition and accordingly apply IFRS 16 to all contracts entered into before January 1, 2019 and identified as leases in accordance with IAS 17 and IFRIC 4. Hence, the Company will recognize a right-of-use asset and corresponding liability in respect of the net present value of these leases unless they qualify for short-term leases upon the application of IFRS 16. The actual quantification of the impact of the application of IFRS 16 on the consolidated financial statements is ongoing and will depend on future economic conditions, including the Company's incremental borrowing rate and the composition of the Company's lease portfolio at January 1, On September 12, 2016, the IASB issued amendments to IFRS 4 Insurance Contracts. These amendments propose two approaches (an overlay approach and a deferral approach) in order to address temporary volatility in reported results arising from implementing the new financial instruments Standard IFRS 9 before implementing the replacement standard that the board is developing for IFRS 4. These amendments to IFRS 4 supplement existing options in the Standard that can already be used to address the temporary volatility. These amendments are effective when an insurer first applies IFRS 9 (overlay approach) or during the three years period beginning on January 1, 2018 (deferral approach). The Company does not expect that the adoption of these amendments will have a material impact to its consolidated financial statements. These amendments are effective for annual periods beginning on or after January 1, 2019, with early application permitted. The Company does not expect that the adoption of these amendments will have a material impact to its consolidated financial statements. The Company does not plan to early adopt the new accounting standards, amendments and interpretations New IFRS standards, amendments and interpretations not yet endorsed by the European Union On June 20, 2016, the IASB issued amendments to IFRS 2 Share-based Payment. These amendments clarify the effects of vesting and non-vesting conditions on the measurement of cash-settled share-based payments; the treatment of share-based payment transactions with a net settlement feature for withholding tax obligations; and the treatment of a modification to the terms and conditions of a share-based payment that changes the classification of the transaction from cash-settled to equity-settled. These amendments are effective for annual periods beginning on or after January 1, 2018, with early application permitted. The Company does not expect that the adoption of these amendments will have a material impact to its consolidated financial statements.
96 Consolidated financial statements 96 On December 8, 2016, the IASB issued IFRIC 22 Foreign Currency Transactions and Advance Consideration. This interpretation provides guidance about which exchange rate to use in reporting foreign currency transactions (such as revenue transactions) when payment is made or received in advance. This interpretation is effective for annual periods beginning on or after January 1, 2018, with early application permitted. The Company does not expect that the adoption of this interpretation will have a material impact to its consolidated financial statements. On May 18, 2017, the IASB issued IFRS 17 "Insurance Contracts", which is designed to achieve the goal of a consistent, principle-based accounting for insurance contracts. IFRS 17 requires insurance liabilities to be measured at a current fulfillment value and provides a more uniform measurement and presentation approach for all insurance contracts. IFRS 17 supersedes IFRS 4 "Insurance Contracts" and related interpretations and is effective for periods beginning on or after January 1, 2021, with earlier adoption permitted if both IFRS 15 "Revenue from Contracts with Customers" and IFRS 9 "Financial Instruments" have also been applied. The Company is in the process of assessing whether there will be a material change to its consolidated financial statements upon adoption of this new standard. On June 7, 2017, the IASB issued IFRIC 23 Uncertainty over Income Tax Treatments. This interpretation addresses the determination of taxable profit (tax loss), tax bases, unused tax losses, unused tax credits and tax rates when there is uncertainty over income tax treatments under IAS 12. This interpretation is effective for annual periods beginning on or after January 1, 2019, with early application permitted. The Company does not expect that the adoption of this interpretation will have a material impact to its consolidated financial statements. On October 12, 2017, the IASB issued an amendment to IFRS 9 in respect of prepayment features with negative compensation, which amends the existing requirements in IFRS 9 regarding termination rights in order to allow measurement at amortized cost (or, depending on the business model, at fair value through other comprehensive income) even in the case of negative compensation payments. This amendment is effective for annual periods beginning on or after January 1, 2019, with early application permitted. The Company does not expect that the adoption of this interpretation will have a material impact to its consolidated financial statements. Also, on October 12, 2017, the IASB issued an amendment to IAS 28 Investments in Associates and Joint Ventures in relation to long-term interests in associates and joint ventures. The amendment clarifies that an entity applies IFRS 9 to long-term interests in an associate or joint venture that form part of the net investment in the associate or joint venture but to which the equity method is not applied. This amendment is effective for annual periods beginning on or after January 1, 2019, with early application permitted. The Company does not expect that the adoption of this amendment will have a material impact to its consolidated financial statements. On December 12, 2017 the IASB issued Annual Improvements to make amendments to the following standards: IFRS 3 "Business Combinations" clarifies that when an entity obtains control of a business that is a joint operation, it remeasures previously held interests in that business. IFRS 11 "Joint Arrangements" clarifies that when an entity obtains joint control of a business that is a joint operation, the entity does not remeasure previously held interests in that business. IAS 12 "Income Taxes" clarifies that all income tax consequences of dividends should be recognized in profit or loss, regardless of how the tax arises. IAS 23 "Borrowing Costs" clarifies that if any specific borrowing remains outstanding after the related asset is ready for its intended use or sale, that borrowing becomes part of the funds that an entity borrows generally when calculating the capitalization rate on general borrowings. These amendments are effective for annual periods beginning on or after January 1, 2019, with early application permitted. The Company does not expect that the adoption of these amendments will have a material impact to its consolidated financial statements. On February 7, 2018, the IASB issued amendments to IAS 19 Employee benefits which clarify that current service cost and net interest after a remeasurement resulting from a plan amendment, curtailment or settlement should be determined using the assumptions applied for the remeasurement. In addition, the amendments clarify the effect of a plan amendment, curtailment or settlement on the requirements regarding the asset ceiling. These amendments are effective for annual periods beginning on or after January 1, 2019, with early application permitted. The Company does not expect that the adoption of these amendments will have a material impact to its consolidated financial statements. The Company does not plan to early adopt the new accounting standards, amendments and interpretations.
97 Consolidated financial statements 97 Note 2: Scope of consolidation 2.1 Basis of consolidation The consolidated financial statements include the accounts of the Company, its subsidiaries and its interests in associated companies and joint arrangements. Subsidiaries are consolidated from the date the Company obtains control (ordinarily the date of acquisition) until the date control ceases. The Company controls an entity when the Company is exposed to or has rights to variable returns from its involvement with the entity and has the ability to affect those returns through its power over the entity. Associated companies are those companies over which the Company has the ability to exercise significant influence on the financial and operating policy decisions, which it does not control. Generally, significant influence is presumed to exist when the Company holds more than 20% of the voting rights. Joint arrangements, which include joint ventures and joint operations, are those over whose activities the Company has joint control, typically under a contractual arrangement. In joint ventures, ArcelorMittal exercises joint control and has rights to the net assets of the arrangement. The investment is accounted for under the equity method and therefore recognized at cost at the date of acquisition and subsequently adjusted for ArcelorMittal s share in undistributed earnings or losses since acquisition, less any impairment incurred. Any excess of the cost of the acquisition over the Company s share of the net fair value of the identifiable assets, liabilities, and contingent liabilities of the associate or joint venture recognized at the date of acquisition is considered as goodwill. The goodwill is included in the carrying amount of the investment and is evaluated for impairment as part of the investment. The consolidated statements of operations include the Company s share of the profit or loss of associates and joint ventures from the date that significant influence or joint control commences until the date significant influence or joint control ceases, adjusted for any impairment losses. Adjustments to the carrying amount may also be necessary for changes in the Company s proportionate interest in the investee arising from changes in the investee s equity that have not been recognized in the investee s profit or loss. The Company s share of those changes is recognized directly in the relevant reserve within equity. The Company assesses the recoverability of its investments accounted for under the equity method whenever there is an indication of impairment. In determining the value in use of its investments, the Company estimates its share in the present value of the projected future cash flows expected to be generated by operations of associates and joint ventures. The amount of any impairment is included in income (loss) from investments in associates, joint ventures and other investments in the consolidated statements of operations (see also note 2.6). For investments in joint operations, in which ArcelorMittal exercises joint control and has rights to the assets and obligations for the liabilities relating to the arrangement, the Company recognizes its assets, liabilities and transactions, including its share of those incurred jointly. Investments in other entities, over which the Company and/ or its operating subsidiaries do not have the ability to exercise significant influence and have a readily determinable fair value, are accounted for as available-forsale at fair value with any resulting gain or loss, net of related tax effect, recognized in the consolidated statements of other comprehensive income, until realized. Realized gains and losses from the sale of available-for-sale securities are determined on an average cost method. To the extent that these investments do not have a readily determinable fair value, they are accounted for under the cost method. While there are certain limitations on the Company s operating and financial flexibility arising from the restrictive and financial covenants of the Company s principal credit facilities described in note There are no significant restrictions resulting from borrowing agreements or regulatory requirements on the ability of consolidated subsidiaries, associates and jointly controlled entities to transfer funds to the parent in the form of cash dividends to pay commitments as they come due. Intercompany balances and transactions, including income, expenses and dividends, are eliminated in the consolidated financial statements. Gains and losses resulting from intercompany transactions are also eliminated. Non-controlling interests represent the portion of profit or loss and net assets not held by the Company and are presented separately in the consolidated statements of operations, in the consolidated statements of other comprehensive income and within equity in the consolidated statements of financial position. 2.2 Investments in subsidiaries List of subsidiaries The table below provides a list of the Company s principal operating subsidiaries at December 31, Unless otherwise stated, the subsidiaries listed below have share capital consisting solely of ordinary shares or voting interests in the case of partnerships, which are held directly or indirectly by the Company and the proportion of ownership interests held equals to the voting rights held by the Company. The country of incorporation corresponds to their principal place of operations.
98 98 Consolidated financial statements Name of Subsidiary Country % of Ownership NAFTA ArcelorMittal Dofasco G.P. Canada % ArcelorMittal México S.A. de C.V. Mexico % ArcelorMittal USA LLC United States % ArcelorMittal Long Products Canada G.P. Canada % ArcelorMittal Brasil S.A. Brazil % Acindar Industria Argentina de Aceros S.A. Argentina % ArcelorMittal Atlantique et Lorraine S.A.S. France % ArcelorMittal Belgium N.V. Belgium % ArcelorMittal España S.A. Spain ArcelorMittal Flat Carbon Europe S.A. Luxembourg ArcelorMittal Galati S.A. Romania ArcelorMittal Poland S.A. Poland % ArcelorMittal Eisenhüttenstadt GmbH Germany % ArcelorMittal Bremen GmbH Germany % ArcelorMittal Méditerranée S.A.S. France % ArcelorMittal Belval & Differdange S.A. Luxembourg % ArcelorMittal Hamburg GmbH Germany % ArcelorMittal Ostrava a.s. Czech Republic % ArcelorMittal Duisburg GmbH Germany % ArcelorMittal International Luxembourg S.A. Luxembourg % 1 ArcelorMittal South Africa Ltd. ("AMSA") South Africa 69.22% 2 JSC ArcelorMittal Temirtau Kazakhstan % PJSC ArcelorMittal Kryvyi Rih ("AM Kryvyi Rih") Ukraine 95.13% ArcelorMittal Mining Canada G.P. and ArcelorMittal Infrastructure G.P.("AMMIC") Canada 85.00% ArcelorMittal Liberia Ltd Liberia 85.00% JSC ArcelorMittal Temirtau Kazakhstan PJSC ArcelorMittal Kryvyi Rih Ukraine Brazil and neighboring countries ("Brazil") Europe 99.85% % 99.70% Africa and Commonwealth of Independent States ("ACIS") Mining % 95.13% ArcelorMittal International Luxembourg S.A. is managed by Europe reportable segment as of January 1, In 2016, AMSA issued shares in a B-BBEE ( broad-based black economic empowerment ) transaction resulting in a decrease in ArcelorMittal's voting rights to 53.92% (see note 10.5) Translation of financial statements denominated in foreign currency The functional currency of ArcelorMittal S.A. is the U.S. dollar. The functional currency of each of the principal operating subsidiaries is the local currency, except for ArcelorMittal México, AMMIC and ArcelorMittal International Luxembourg, whose functional currency is the U.S. dollar and ArcelorMittal Ostrava, ArcelorMittal Poland and ArcelorMittal Galati, whose functional currency is the euro. Transactions in currencies other than the functional currency of a subsidiary are recorded at the rates of exchange prevailing at the date of the transaction. Monetary assets and liabilities in currencies other than the functional currency are remeasured at the rates of exchange prevailing on the date of the consolidated statements of financial position and the related translation gains and losses are reported within financing costs in the consolidated statements of operations. Non-monetary items that are carried at cost are translated using the rate of exchange prevailing at the date of the transaction. Nonmonetary items that are carried at fair value are translated using the exchange rate prevailing when the fair value was determined and the related translation gains and losses are reported in the consolidated statements of comprehensive income. Upon consolidation, the results of operations of ArcelorMittal s subsidiaries, associates and joint arrangements whose functional currency is other than the U.S. dollar are translated into U.S. dollars at the monthly average exchange rates and assets and liabilities are translated at the year-end exchange rates. Translation adjustments are recognized directly in other comprehensive income and are included in net income (including non-
99 Consolidated financial statements 99 controlling interests) only upon sale or liquidation of the underlying foreign subsidiary, associate or joint arrangement. Since 2010 Venezuela has been considered a hyperinflationary economy and therefore the financial statements of Unicon are adjusted to reflect the changes in the general purchasing power of the local currency before being translated into U.S. dollars. The Company used estimated general price indices of 2,055.5%, 533.9% and 146.7% for the years ended December 31, 2017, 2016 and 2015, respectively, for this purpose. As a result of the inflation-related adjustments on monetary items, losses of 31, 8 and 161 were recognized in net financing costs for the years ended December 31, 2017, 2016 and 2015, respectively. Effective January 1, 2016, the Company applied the DICOM rate to translate its Venezuelan operations. As a result of this change, ArcelorMittal s net equity in Unicon decreased from 628 to 43 at January 1, The DICOM rate was originally set at 206 bolivars per U.S. dollar on March 10, 2016, before falling to 674 bolivars per U.S. dollar at December 31, The DICOM rate continued to weaken during 2017 to 3,345 bolivars per U.S. dollar on August 31, 2017, when the Venezuelan government temporarily suspended the sale of U.S. dollars through its DICOM auction system. On February 5, 2018, the Venezuelan government reopened the auction at the new DICOM rate of 30,987 bolivars per euro (25,000 bolivars per U.S. dollar). The Company continued to translate its Unicon's operations at the DICOM rate. At December 31, 2017, ArcelorMittal s net investment in Unicon was 65. The foreign exchange controls in Venezuela may limit the ability to repatriate earnings and ArcelorMittal s Venezuelan operations ability to remit dividends and pay intercompany balances at any official exchange rate or at all Business combinations Business combinations are accounted for using the acquisition method as of the acquisition date, which is the date on which control is transferred to ArcelorMittal. The Company controls an entity when it is exposed to or has rights to variable returns from its involvement with the entity and has the ability to affect those returns through its power over the entity. The Company measures goodwill at the acquisition date as the total of the fair value of consideration transferred, plus the proportionate amount of any non-controlling interest, plus the fair value of any previously held equity interest in the acquiree, if any, less the net recognized amount (generally at fair value) of the identifiable assets acquired and liabilities assumed. In a business combination in which the fair value of the identifiable net assets acquired exceeds the cost of the acquired business, the Company reassesses the fair value of the assets acquired and liabilities assumed. If, after reassessment, ArcelorMittal s interest in the net fair value of the acquiree s identifiable assets, liabilities and contingent liabilities exceeds the cost of the business combination, the excess (bargain purchase) is recognized immediately as a reduction of cost of sales in the consolidated statements of operations. Any contingent consideration payable is recognized at fair value at the acquisition date and any costs directly attributable to the business combination are expensed as incurred Acquisitions On December 21, 2017, the Company acquired from Alcatel Lucent the reinsurance company Electro-Re S.A. for total consideration of 246 million (290; cash inflow was 35, net of cash acquired of 325). The reinsurance company is incorporated in Luxembourg and operates through a series of reinsurance agreements with the Company s subsidiaries. On June 28, 2017, AM InvestCo Italy S.r.l. ("AM InvestCo"), a consortium formed by ArcelorMittal and Marcegaglia with respective interests of 85% and 15%, signed a lease agreement with the Italian Government with an obligation to purchase Ilva S.p.A. and certain of its subsidiaries ("Ilva"). Intesa Sanpaolo will formally join the consortium before the transaction closing. Ilva is Europe s largest single steel site and only integrated steelmaker in Italy with its main production facility based in Taranto. Ilva also has significant steel finishing capacity in Taranto, Novi Ligure and Genova. The purchase price amounts to 1.8 billion ($2.16 billion) subject to certain adjustments, with annual leasing costs of 180 million (216) to be paid in quarterly installments. Ilva s business units will be initially leased with rental payments qualifying as down payments against the purchase price and will be part of the Europe reportable segment. The lease period is for a minimum of two years. The closing of the transaction is subject to certain conditions precedent, including receipt of antitrust approvals. ArcelorMittal notified the European Commission of AM InvestCo's proposed acquisition of Ilva on September 21, 2017, and submitted commitments on October 19, On November 8, 2017, the European Commission initiated a Phase II review of AM InvestCo s proposed acquisition of Ilva and ArcelorMittal confirmed it will continue to work closely and constructively with the Commission to explain the dynamics of the steel industry, the rationale of the proposed acquisition and the benefits it will bring to industry, customers, the environment and the local economy. The Company continues to engage in dialogue with the Commission seeking to secure approval for this transaction. Based on current facts and circumstances, the Company expects that this transaction is a business combination as it will obtain control of the business subject to the lease. The agreement includes
100 100 Consolidated financial statements industrial capital expenditure commitments of approximately 1.3 billion ($1.6 billion) over a seven-year period focused on blast furnaces, steel shops and finishing lines, environmental capital expenditure commitments of approximately 0.8 billion ($1.0 billion) and environmental remediation commitments of approximately 288 million (345), the latter of which will be funded with funds seized by the Italian Government from the former shareholder. On June 21, 2017, as a result of the extension of the partnership between ArcelorMittal and Bekaert Group ("Bekaert") in the steel cord business in Brazil, the Company completed the acquisition from Bekaert of a 55.5% controlling interest in Bekaert Sumaré Ltda. subsequently renamed ArcelorMittal Bekaert Sumaré Ltda. ("Sumaré"), which subsequently merged into Belgo-Mineira Bekaert Artefatos de Arames Ltda. a manufacturer of metal ropes for automotive tires located in the municipality of Sumaré/SP, Brazil. The Company agreed to pay total cash consideration of 56 million (63; 49 net of cash acquired of 14) of which 52 million (58) settled on closing date and 4 million (5) to be paid subsequently upon conclusion of certain business restructuring measures by Bekaert. Sumaré is part of the Brazil reportable segment. On May 18, 2017, the Company acquired from Crédit Agricole Assurances the reinsurance company Crédit Agricole Reinsurance S.A. for consideration of 186 million (208; cash inflow was 20, net of cash acquired of 228). The reinsurance company is incorporated in Luxembourg and operates through a series of reinsurance agreements with the Company s subsidiaries. On February 23, 2017, ArcelorMittal and Votorantim S.A.signed an agreement, pursuant to which Votorantim s long steel businesses in Brazil, Votorantim Siderurgia, will become a subsidiary of ArcelorMittal Brasil and Votorantim will hold a non-controlling interest in ArcelorMittal Brasil. The combined operations include ArcelorMittal Brasil s production sites at Monlevade, Cariacica, Juiz de Fora, Piracicaba and Itaúna, and Votorantim Siderurgia s production sites at Barra Mansa, Resende and its participation in Sitrel, in Três Lagoas. On February 7, 2018, the Brazilian antitrust authority CADE approved the transaction, which is expected to close during the first half of 2018, conditioned to the fulfillment of divestment commitments by ArcelorMittal Brasil. Until closing, ArcelorMittal Brasil and Votorantim Siderurgia will remain fully separate and independent companies. On January 18, 2017, the Company acquired from Parfinada B.V. the reinsurance company Artzare S.A. for total consideration of 43 million (45; cash inflow was 5, net of cash acquired of 50). The reinsurance company is incorporated in Luxembourg and operates through a series of reinsurance agreements with the Company s subsidiaries. On December 21, 2016, ArcelorMittal acquired from Skanska Financial Services AB the reinsurance company SCEM Reinsurance S.A. ( SCEM ) for total consideration of 54 million (56; cash inflow was 7, net of cash acquired of 63). The Company concluded that the acquisitions of Electro-Re S.A., SCEM, Artzare S.A. and Crédit Agricole Reinsurance S.A. were not business combinations mainly as the transactions did not include the acquisition of any strategic management processes, operational processes and resource management processes. There were no significant acquisitions in The table below summarizes the estimated acquisition-date fair value of the assets acquired and liabilities assumed in respect of Sumaré: Sumaré Other current assets 50 Property, plant and equipment 69 Intangible assets 21 Other non-current assets 7 Total assets acquired 147 Deferred tax liabilities (23) Other liabilities (29) Total liabilities acquired (52) Net assets acquired 95 Non-controlling interests (48) Consideration paid, net 44 Consideration payable 5 Goodwill Divestments and assets held for sale Non-current assets and disposal groups that are classified as held for sale are measured at the lower of carrying amount and fair value less costs to sell. Assets and disposal groups are classified as held for sale if their carrying amount will be recovered through a sale transaction rather than through continuing use. The non-current asset, or disposal group, is classified as held for sale only when the sale is highly probable and is available for immediate sale in its present condition and is marketed for sale at a price that is reasonable in relation to its current fair value. Assets held for sale are presented separately in the consolidated statements of financial position and are not depreciated. Gains (losses) on disposal of subsidiaries are recognized in cost of sales, whereas gains (losses) on disposal of investments accounted for under the equity method and other investments are recognized in income (loss) from investments in associates, joint ventures and other investments.
101 Consolidated financial statements Divestments Divestments in 2017 On December 15, 2017, ArcelorMittal completed the sale of its 100% shareholding in ArcelorMittal Georgetown Inc. ("Georgetown"), a wire rod mill in Georgetown in the United States for total cash consideration of 19 and the result on disposal was 18. The fair value measurement of Georgetown, which was part of the NAFTA reportable segment, was determined using the contract price, a Level 3 unobservable input. On March 13, 2017, ArcelorMittal and the management of ArcelorMittal Tailored Blanks Americas ( AMTBA ), comprising the Company s tailored blanks operations in Canada, Mexico and the United States, entered into a joint venture agreement following which the Company recognized an investment of 65 in AMTBA accounted for under the equity method. AMTBA was part of the NAFTA reportable segment and was classified as held for sale at December 31, On February 10, 2017, ArcelorMittal completed the sale of certain ArcelorMittal Downstream Solutions entities in the Europe segment following its commitment to sell such operations in December The Company recorded an impairment charge of 18 in cost of sales in The assets and liabilities subject to the sale were classified as held for sale at December 31, The fair value measurement of these operations, which were part of the Europe reportable segment, was determined using the contract price, a Level 3 unobservable input. Divestments in 2016 On September 30, 2016, ArcelorMittal completed the sale of its wholly owned subsidiary ArcelorMittal Zaragoza in Spain to Megasa Siderúrgica S.L. for total consideration of 80 million (89). Prior to the disposal, the Company recorded an impairment charge of 49 (of which 2 related to allocated goodwill) in cost of sales to write the net carrying amount down to the net proceeds from the sale. The fair value measurement of ArcelorMittal Zaragoza was determined using the contract price, a Level 3 unobservable input. ArcelorMittal Zaragoza was part of the Europe reportable segment. On August 7, 2016, ArcelorMittal completed the sale of the Company s 49% interest in its associates ArcelorMittal Algérie and ArcelorMittal Tebessa and its 70% interest in its subsidiary ArcelorMittal Pipes and Tubes Algeria, which was announced on October 7, 2015 as part of an outline agreement for restructuring the shareholding of its Algerian activities. As part of the agreement, ArcelorMittal transferred such interests to IMETAL, an Algerian state-owned entity. ArcelorMittal Pipes and Tubes Algeria and ArcelorMittal Algérie were part of the ACIS reportable segment while ArcelorMittal Tebessa was part of the Mining reportable segment. Previously, on January 10, 2015, ArcelorMittal had completed the sale of a 21% controlling stake in ArcelorMittal Tebessa, which holds two iron ore mines in Ouenza and Boukadra, Tebessa, to Sider and the Ferphos Group, two Algerian state-owned entities. The Company accounted for its remaining 49% stake under the equity method. The assets and liabilities of ArcelorMittal Pipes and Tubes Algeria and ArcelorMittal Tebessa were classified as held for sale at December 31, On April 4, 2016, ArcelorMittal completed the sale of the LaPlace and Vinton Long Carbon facilities in the United States. The total consideration was 96 and the result on disposal was 0. In 2015, the Company recorded an impairment charge of 231 (of which 13 relating to allocated goodwill) in cost of sales to write the carrying amount of the LaPlace, Steelton and Vinton facilities down to the expected net proceeds from the sale. The fair value measurement of the Long Carbon facilities in the United States was determined using the contract price, a Level 3 unobservable input. These facilities were part of the NAFTA reportable segment. The assets and liabilities of the Steelton facility remained classified as held for sale at December 31, 2017 and 2016 (see note 2.3.2). Divestments in 2015 On March 30, 2015, following an agreement signed on October 21, 2014, the Company established the joint venture ArcelorMittal CLN Distribuzione Italia S.r.l. ( AMCDI ) with Coils Lamiere Nastri S.P.A. ( CLN ) through the contribution of assets and liabilities of its wholly owned subsidiary ArcelorMittal Distribution Solutions Italia S.R.L ( AMDSI ). ArcelorMittal holds a 49% stake in AMCDI, which is accounted for under the equity method. AMDSI was part of the Europe reportable segment. On February 26, 2015, following an agreement signed on September 18, 2014, ArcelorMittal established the investment ArcelorMittal RZK Celik Servis Merkezi Sanayi ve Ticaret Anonim Sirketi ( AM RZK ) with a local partner in Turkey through the contribution of assets and liabilities of the Company s wholly owned subsidiary Rozak Demir Profil Ticaret ve Sanayi Anonim Sirketi ( Rozak ). ArcelorMittal holds a 50% stake in AM RZK and the investment is accounted for under the equity method. Rozak was part of the Europe reportable segment. On January 23, 2015, ArcelorMittal completed the disposal of the building on Avenue de la Liberté in Luxembourg city (the Liberté Building ), formerly the headquarters of the Company, to the Banque et Caisse d Epargne de l Etat ( BCEE ) following a memorandum of understanding signed on November 14, The result on disposal for the 2015 disposals described above was immaterial. The aggregate net assets disposed of amounted to 97.
102 102 Consolidated financial statements The table below summarizes the significant divestments: 2017 AMTBA Downstream Solutions Europe Georgetown 2016 ArcelorMittal Zaragoza ArcelorMittal Tubular Products Algeria LaPlace and Vinton Long Carbon facilities Cash and cash equivalents 13 Other current assets Property, plant and equipment Other assets Total assets Current liabilities Other long-term liabilities Total liabilities (11) % 100% 100% 100% 100% 100% Total net assets/(liabilities) disposed of (11) 96 Consideration Reclassification of foreign exchange translation difference Gain on disposal Total net assets/(liabilities) % of net assets sold Assets held for sale In December 2017, ArcelorMittal committed to a plan to sell its 100% owned subsidiary Go Steel Frýdek Místek ("Frýdek Mistek"). Frýdek Místek forms part of the Europe reportable segment. Accordingly, at December 31, 2017, the carrying amount of assets and liabilities subject to the transaction were classified as held for sale. The fair value of the assets and liabilities classified as held for sale were in line with their carrying value. The fair value measurement was determined using the contract price, a Level 3 unobservable input. In addition, the assets and liabilities of the Steelton facility in the United States remained classified as held for sale at December 31, 2017 (see note 2.3.1). The details for the entities classified as held for sale as at December 31, 2016, which have been disposed during 2017 are disclosed in note Divestments.
103 Consolidated financial statements 103 The table below provides details of the assets and liabilities held for sale after elimination of intra-group balances in the consolidated statements of financial position: Frydek Místek Steelton December 31, 2017 Total Trade accounts receivable and other Inventories Total current assets Property, plant and equipment Total non-current assets Total assets Trade accounts payable and other Accrued expenses and other liabilities Total current liabilities Long-term provisions Total non-current liabilities ASSETS Current assets: Non-current assets: LIABILITIES Current liabilities: Non-current liabilities: Total liabilities December 31, 2016 AMTBA Downstream Solutions Europe Steelton Total ASSETS Current assets: Cash and cash equivalents Trade accounts receivable and other Inventories Property, plant and equipment Other assets Total non-current assets Prepaid expenses and other current assets Total current assets Non-current assets: Total assets LIABILITIES Current liabilities: Short-term debt and current portion of long-term debt Trade accounts payable and other Accrued expenses and other liabilities Total current liabilities Non-current liabilities: Long-term debt net of current portion Long-term provisions Total non-current liabilities Total liabilities
104 104 Consolidated financial statements 2.4 Investments in associates and joint arrangements The carrying amounts of the Company s investments accounted for under the equity method were as follows: Category 2017 December 31, 2016 Joint ventures 1,249 1,507 Associates 2,854 2,000 Individually immaterial joint ventures and associates1 Total ,084 4,297 Individually immaterial joint ventures and associates represent in aggregate less than 20% of the total carrying amount of investments in joint ventures and associates at December 31, 2017 and 2016, and none of them have a carrying value exceeding 100 at December 31, 2017 and Joint ventures The following tables summarize the latest available financial information and reconcile it to the carrying value of each of the Company s material joint ventures, as well as the income statement of the Company s material joint ventures: Joint Ventures Place of incorporation and operation 1 Calvert United States Macsteel Netherlands VAMA China Principal Activity Automotive steel finishing Steel trading and shipping Automotive steel finishing Ownership and voting rights at December 31, 2017 Current assets of which cash and cash equivalents Non-current assets Current liabilities of which trade and other payables and provisions Non-current liabilities of which trade and other payables and provisions Net assets Company's share of net assets Adjustments for differences in accounting policies and other Carrying amount in the statements of financial position Revenue Depreciation and amortization Interest income Interest expense Income tax benefit (expense) Net income (loss) Other comprehensive income (loss) Total comprehensive income (loss) Cash dividends received by the Company Tameh Poland Energy production and supply December 31, 2017 Borçelik Total Turkey Manufacturing and sale of steel 2, % 49.00% 50.00% 45.33% 1, , , % 2, ,218 1, ,596 1,276 6 (3) (30) (27) ,249 2,870 (62) (35) ,775 (1) 14 (10) (5) (30) 1 (28) (27) 4 (7) 42 (1) ,234 (22) 1 (12) (20) 65 (1) ,698 (142) 16 (81) (32) The country of incorporation corresponds to the country of operation except for Tameh whose country of operation is also the Czech Republic and Macsteel whose countries of operation are mainly the United States, the United Arab Emirates and China. The non-current liabilities include 40 deferred tax liability. Adjustment in Borçelik relates primarily to differences in accounting policies regarding revaluation of fixed assets.
105 Consolidated financial statements 105 Joint Ventures Place of incorporation and operation1 Principal Activity Ownership and voting rights at December 31, 2016 Current assets of which cash and cash equivalents Non-current assets Current liabilities of which trade and other payables and provisions Non-current liabilities of which trade and other payables and provisions December 31, 2016 Borçelik Total Calvert United States Macsteel Baffinland VAMA Tameh Netherlands Canada China Poland Turkey Automotive steel finishing Steel trading and shipping Extraction of iron ore3 Automotive steel finishing Energy production and supply Manufacturing and sale of steel2, % 50.00% 44.54% 49.00% 50.00% 45.33% , , , , , , Net assets , ,342 Company's share of net assets , Adjustments for differences in accounting policies and other Carrying amount in the statements of financial position Revenue (59) (31) (82) ,507 2,358 2, ,261 (59) (1) (3) (30) (20) (20) (133) Interest income Interest expense (31) (9) (20) (28) (1) (7) (96) (4) (26) 18 (10) (28) (50) (43) (58) (43) (58) Depreciation and amortization Income tax benefit (expense) Net income (loss) Other comprehensive income (loss) Total comprehensive income (loss) Cash dividends received by the Company The country of incorporation corresponds to the country of operation except for Tameh whose country of operation is also the Czech Republic and Macsteel whose countries of operation are mainly the United States, the United Arab Emirates and China. The non-current liabilities include 39 deferred tax liability. Adjustment in Baffinland relates primarily to differences in accounting policies regarding revaluation of fixed assets, preferred shares and locally recognized goodwill. Adjustment in Borçelik relates primarily to differences in accounting policies regarding revaluation of fixed assets.
106 106 Consolidated financial statements Joint Ventures Place of incorporation and operation1 Principal Activity Ownership and voting rights at December 31, 2015 Revenue Depreciation and amortization December 31, 2015 Borçelik Total Calvert United States Macsteel Baffinland VAMA Tameh Netherlands Canada China Poland Turkey Automotive steel finishing Steel trading and shipping Development of iron ore mine Automotive steel finishing Energy production and supply Manufacturing and sale of steel 50.00% 50.00% 2,094 2, % 49.00% % ,114 (58) (1) (26) (33) (20) (138) Interest income Interest expense (31) (10) (16) (1) (7) (65) Income tax benefit (expense) (5) (2) 34 (4) (17) 6 Net income (loss) (23) 32 (66) (88) (99) Other comprehensive income (loss) 8 Total comprehensive income (loss) (23) 40 (66) (88) Cash dividends received by the Company % 14 (1) 7 31 (92) 9 41 The country of incorporation corresponds to the country of operation except for Tameh whose country of operation is also the Czech Republic and Macsteel whose countries of operation are mainly the United States, the United Arab Emirates and China. Macsteel Macsteel International Holdings B.V. ( Macsteel ) is a joint venture between Macsteel Holdings Luxembourg S.à r.l. and AMSA which provides the Company with an international network of traders and trading channels including the shipping of steel. VAMA Valin ArcelorMittal Automotive Steel ( VAMA ) is a joint venture between ArcelorMittal and Hunan Valin which produces steel for high-end applications in the automobile industry. VAMA supplies international automakers and firsttier suppliers as well as Chinese car manufacturers and their supplier networks. Baffinland Baffinland is a joint arrangement between ArcelorMittal and Nunavut Iron Ore ("NIO"). Baffinland owns the Mary River project, which has direct shipping, high grade iron ore on Baffin Island in Nunavut (Canada). During 2017, ArcelorMittal s shareholding in Baffinland decreased from 44.54% to 31.07% following capital calls exclusively fulfilled by NIO, and the conversion of preferred shares held by NIO into equity. As a result, ArcelorMittal recognized a loss on dilution of 22 including the recycling of accumulated foreign exchange translation losses of 52 loss in income (loss) from investments in associates, joint ventures and other investments. In addition, as ArcelorMittal lost joint control but maintained significant influence over Baffinland, the investment was reclassified to an associate (see note 2.4.2). Calvert AM/NS Calvert ("Calvert"), a joint venture between the Company and Nippon Steel & Sumitomo Metal Corporation ( NSSMC ), is a steel processing plant in Calvert, Alabama, United States. Calvert had a 6-year agreement to purchase 2 million tonnes of slabs annually from ThyssenKrupp Steel USA ("TK CSA"), an integrated steel mill complex located in Rio de Janeiro, Brazil, using a market-based price formula. TK CSA had an option to extend the agreement for an additional 3 years on terms that are more favorable to the joint venture, as compared with the initial 6-year period. In December 2017 and in connection with the acquisition of TK CSA by Ternium S.A., the agreement was amended to (i) extend the term of the agreement to December 31, 2020, (ii) make a corresponding reduction in the annual slab purchase obligation so that the aggregate slab purchase obligation over the full term of the agreement remained the same and (iii) eliminated TK CSA s extension option. The remaining slabs for Calvert's operations are sourced from ArcelorMittal plants in the United States, Brazil and Mexico. ArcelorMittal is principally responsible for marketing the product on behalf of the joint venture. Calvert serves the automotive, construction, pipe and tube, service center, and appliance/ HVAC industries. Tameh Tameh is a joint venture between ArcelorMittal and Tauron Group including four energy production facilities located in Poland and the Czech Republic. Tameh s objective is to ensure energy supply to the Company s steel plants in these countries as well as the utilization of steel plant gases for energy production processes.
107 Consolidated financial statements 107 Borçelik Borçelik Çelik Sanayii Ticaret Anonim irketi ("Borçelik"), incorporated and located in Turkey, is a joint venture between ArcelorMittal and Borusan Holding involved in the manufacturing and sale of cold-rolled and galvanized flat steel products Associates The following table summarizes the financial information and reconciles it to the carrying amount of each of the Company s material associates, as well as the income statement of the Company s material associates: December 31, 2017 Associates Financial statements reporting date Place of incorporation and operation1 Principal Activity China Oriental DHS Group Gonvarri Steel Industries Baffinland June 30, 2017 September 30, 2017 September 30, 2017 December 31, 2017 Bermuda Germany Spain Canada Iron and steel manufacturing Steel manufacturing 3 Steel manufacturing4 Extraction of iron ore 5 Total Ownership and voting rights at December 31, % 33.43% 35.00% Current assets 1,737 1,699 1, ,758 Non-current assets 1,336 3,096 1,372 1,698 7,502 Current liabilities 1, , , , ,670 2,983 1,784 1,220 7, ,652 Non-current liabilities Non-controlling interests Net assets attributable to equity holders of the parent Company's share of net assets Adjustments for differences in accounting policies and other 31.07% 32 (54) 23 1 Other adjustments (4) 201 Carrying amount in the statements of financial position 835 1, ,854 2,944 1,773 2, ,920 Profit or loss from continuing operations Net income (loss) 275 (4) 122 (20) 373 (15) Revenue Other comprehensive income (loss) Total comprehensive income (loss) Cash dividends received by the Company (1) (5) (9) 274 (9) 113 (20) The country of incorporation corresponds to the country of operation except for China Oriental whose country of operation is China. Other adjustments correspond to the difference between the carrying amount at December 31, 2017 and the net assets situation corresponding to the latest financial statements ArcelorMittal is permitted to disclose. The amount for DHS Group includes an adjustment to align the German GAAP financial information with the Company s accounting policies and is mainly linked to property, plant and equipment, inventory and pension. Adjustments in Gonvarri Steel Industries primarily relate to differences in accounting policies regarding revaluation of fixed assets. Adjustments in Baffinland primarily relate to differences in accounting policies regarding revaluation of fixed assets and locally recognized goodwill.
108 108 Consolidated financial statements Associates Financial statements reporting date China Oriental DHS Group June 30, 2016 September 30, 2016 September 30, 2016 Bermuda Germany Spain Iron and steel manufacturing Steel manufacturing3 Steel manufacturing4 Place of incorporation and operation1 Principal Activity December 31, 2016 Gonvarri Steel Industries Total Ownership and voting rights at December 31, % 33.43% 35.00% Current assets 1,422 1,624 1,481 4,527 Non-current assets 1,504 2,999 1,178 5,681 Current liabilities 1, , , , ,364 2,830 1,534 5, ,124 Non-current liabilities Non-controlling interests Net assets attributable to equity holders of the parent Company's share of net assets 17 (51) Other adjustments2 (18) (61) (11) Carrying amount in the statements of financial position ,000 1,751 1,396 2,258 5,405 Adjustments for differences in accounting policies and other Revenue (34) (90) 123 (91) Net income (loss) 83 (96) Other comprehensive income (loss) (3) 4 1 Total comprehensive income (loss) 83 (99) Cash dividends received by the Company Profit or loss from continuing operations The country of incorporation corresponds to the country of operation except for China Oriental whose country of operation is China. Other adjustments correspond to the difference between the carrying amount at December 31, 2016 and the net assets situation corresponding to the latest financial statements ArcelorMittal is permitted to disclose. The amount for DHS Group includes an adjustment to align the German GAAP financial information with the Company s accounting policies, and is mainly linked to property, plant and equipment, inventory and pension. Adjustments in Gonvarri Steel Industries primarily relate to differences in accounting policies regarding revaluation of fixed assets. September 30, 2015 Germany Spain Spain Poland Steel manufacturing Manufacturing of metal components Steel manufacturing Production and distribution of steel products Associates China Oriental DHS Group Financial statements reporting date June 30, 2015 September 30, 2015 Bermuda Place of incorporation and operation1 Principal Activity Iron and steel manufacturing December 31, 2015 Stalprodukt Total S.A.2 September 30, 2015 Gonvarri Steel Industries September 30, 2015 Gestamp 2 Ownership and voting rights at December 31, 2015 * 46.99% 33.43% 35.00% 35.00% Revenue 1,768 1, % 5,642 2, ,835 6 (47) Net income (loss) 10 (45) Other comprehensive income (loss) (1) (35) (53) (89) 9 (45) Profit or loss from continuing operations Total comprehensive income (loss) Cash dividends received by the Company * The country of incorporation corresponds to the country of operation except for China Oriental whose country of operation is China. Date of the latest available financial statements is September 30, The ownership stake is equal to the voting rights percentage, except for Stalprodukt S.A. whose voting rights correspond to 28.26%.
109 Consolidated financial statements 109 China Oriental China Oriental Group Company Limited ( China Oriental ) is a Chinese integrated iron and steel company listed on the Hong Kong Stock Exchange ( HKEx ). On April 29, 2014, China Oriental s shares were suspended from trading as a consequence of China Oriental not meeting the minimum free float listing requirement of 25% of the HKEx. In order to restore the minimum free float, the Company sold a 17.40% stake to ING Bank N.V. ( ING ) and Deutsche Bank Aktiengesellschaft ( Deutsche Bank ) together with put option agreements. The Company had not derecognized the 17.40% stake in China Oriental as it retained its exposure to significant potential risks and rewards of the investment through the put options. On April 30, 2014, Deutsche Bank exercised its put option with respect to a 7.50% stake in China Oriental. Simultaneously, the Company sold this investment to Macquarie Bank and entered into a put option arrangement with the latter maturing on April 30, On April 30, 2015, both put options were exercised, resulting in a decrease of accrued expenses and other liabilities and prepaid expenses and other current assets by 96 and 112, respectively. On January 27, 2017, in order to restore the minimum free float requirement, China Oriental issued 586,284,000 new shares resulting in a decrease of the Company s interest from 46.99% to 39.02%. As a result, ArcelorMittal recorded a loss of 67 upon dilution partially offset by a gain of 23 following the recycling of accumulated foreign exchange translation gains from other comprehensive income to income (loss) from investments in associates, joint ventures and other investments. The trading of China Oriental s shares, which had been suspended since April 29, 2014, resumed on February 1, DHS Group DHS - Dillinger Hütte Saarstahl AG ( DHS Group ), incorporated and located in Germany, is a leading producer of heavy steel plates, cast slag pots and semi-finished products, such as pressings, pressure vessel heads and shell sections in Europe. The DHS Group also includes a further rolling mill operated by Dillinger France in Dunkirk (France). Gestamp Gestamp Automoción ( Gestamp ) is a Spanish multinational company, which is a leader in the European automotive industry. The activities of Gestamp and its subsidiaries are focused on the design, development, and manufacturing of metal components for the automotive industry via stamping, tooling, assembly, welding, tailor welded blanks, and die cutting. The entity also includes other companies dedicated to services such as research and development of new technologies. On February 1, 2016, ArcelorMittal completed the sale of its 35.00% stake in Gestamp to the majority shareholder, the Riberas family, for total cash consideration of 875 million (971). The gain on disposal was recorded in income (loss) from investments in associates, joint ventures and other investments and amounted to 329 including the reclassification of the accumulated foreign exchange translation losses and unrealized losses on derivative financial instruments from other comprehensive income to the statements of operations of 90 and 12, respectively. In addition to the cash consideration, ArcelorMittal received a payment of 10 million (11) for the 2015 dividend. ArcelorMittal has continued its supply relationship with Gestamp through its 35.00% shareholding in Gonvarri Steel Industries, a sister company of Gestamp. ArcelorMittal sells coils to Gonvarri Steel Industries for processing before they pass to Gestamp and other customers. Further, ArcelorMittal continues to have a board presence in Gestamp, collaborate in automotive R&D and remain its major steel supplier. Gonvarri Steel Industries Holding Gonvarri SL ( Gonvarri Steel Industries ) is dedicated to the processing of steel. The entity is a European leader in steel service centers and renewable energy components, with strong presence in Europe and Latin America. Stalprodukt S.A. Stalprodukt S.A. is a leading manufacturer and exporter of highly processed steel products based in Poland. On December 16, 2015, the Company sold 356,424 shares in Stalprodukt S.A., which resulted in a decrease in the ownership percentage from 33.77% to 28.47%. The Company recorded a loss on disposal of 6 in income (loss) from investments in associates, joint ventures and other investments (see note 2.6). As of December 31, 2015, the investment had a market value of 155. In 2016, following an additional sale of shares, the Company classified the investment as available-for-sale securities (see note 2.5).
110 110 Consolidated financial statements Other associates and joint ventures that are not individually material The Company has interests in a number of other joint ventures and associates, none of which are regarded as individually material. The following table summarizes the financial information of all individually immaterial joint ventures and associates that are accounted for using the equity method: Carrying amount of interests in associates and joint ventures December 31, 2017 Associates Joint Ventures December 31, 2016 Associates Joint Ventures Share of: Income (loss) from continuing operations Other comprehensive income (loss) 10 (2) 1 Total comprehensive income (loss) (1) The Company s unrecognized share of accumulated losses in AM RZK amounted to nil, for the years ended December 31, 2017, 2016, and 7 for the year ended December 31, The Company s unrecognized share of accumulated losses in ArcelorMittal Algérie amounted to 0 and 8 for the years ended December 31, 2016 and December 31, 2015, respectively. ArcelorMittal Algérie was sold on August 7, 2016 (see note 2.3). In 2016, the Company s share of net losses reduced the carrying amount of its 40.80% interest in the joint venture ArcelorMittal Tubular Products Jubail ( Al Jubail ) to nil. Furthermore, the Company granted shareholder loans to Al Jubail for 140 and 168 as of December 31, 2017 and 2016, respectively. During 2016, the Company's share of additional losses of 19 were recognized against its shareholder loans reducing the carrying amount of such loans to 149 at December 31, During 2017, losses were recognized against the Company's carrying amount and shareholder loans in Al Jubail, reducing the total to 152 at December 31, Impairment of associates and joint ventures For the years ended December 31, 2017 and 2016, the Company identified an impairment indicator with respect to its shareholder loans in Al Jubail. Accordingly, it performed a value in use calculation and concluded the carrying amount of the investment and shareholder loans was recoverable. For the remaining investments, the Company concluded there were no impairment triggers. For the year ended December 31, 2016, the Company recorded an impairment charge of 14 of its shareholder loan to Kalagadi, and 14 of the Company s 28.24% interest in Comvex, a deep sea harbor facility on the Black Sea in Romania for the year ended December 31, For the remaining investments, the Company concluded there were no impairment triggers. For the year ended December 31, 2015, the Company tested for impairment its investment in Kalagadi Manganese (Proprietary) Limited ( Kalagadi Manganese ), a joint venture between ArcelorMittal and Kalahari Resource (2) (Proprietary) Ltd that is engaged in exploring, mining, ore processing, and smelting manganese in the Kalahari Basin in South Africa, and determined that the value in use was lower than the carrying amount. In determining the value in use, the Company estimated its share in the present value (using a pre-tax discount rate of 12.48%) of the projected future cash flows expected to be generated over the current life-of-the-mine plan or long term production plan. The key assumptions for the value in use calculations are primarily the discount rates, capital expenditure, expected changes to average selling prices, shipments and direct costs during the period. Based on the analysis of value in use, the Company recognized an impairment charge of 283 in income (loss) from investments in associates, joint ventures and other investments (see note 2.6) for the full carrying amount of the investment (205) and loans (78) as a result of a downward revision of cash flow projections resulting from the expectation of the persistence of a lower manganese price outlook. For the year ended December 31, 2016, the Company s unrecognized share of accumulated losses in Kalagadi Manganese was 9. In addition, for the year ended December 31, 2015, the Company recorded an impairment charge of 69 in respect of its investment in Uttam Galva Steels Ltd ( Uttam Galva ) (a manufacturer of cold rolled steel and galvanized steel based in India in which the Company holds a 29.00% interest). In determining the value in use of its investment in Uttam Galva, the Company estimated its share in the present value (using a pre-tax discount rate of 13.91%) of the projected future cash flows expected to be generated by operations. The value in use was based on cash flows for a period of five years, which were extrapolated for the remaining years based on an estimated growth rate not exceeding the average long-term growth rate for the relevant markets. In addition to the impairment of the carrying amount, the Company recorded an impairment charge on the loans related to Uttam Galva for 69 and an impairment charge of 22 in respect of its 25.00% interest in the Northern Cape Iron Ore Mining Project, an associate in South Africa.
111 Consolidated financial statements 111 The Company is not aware of any material contingent liabilities related to associates and joint ventures for which it is severally liable for all or part of the liabilities of the associates, nor are there any contingent liabilities incurred jointly with other investors. See note 8.3 for disclosure of commitments related to associates and joint ventures. Hibbing Taconite Mines Investments in joint operations I/N Tek The Company had investments in the following joint operations as of December 31, 2017 and 2016: I/N Tek in which the Company holds a 60.00% interest operates a cold-rolling mill in the United States. Peña Colorada Double G Coatings Peña Colorada is an iron ore mine located in Mexico in which ArcelorMittal holds a 50.00% interest. Peña Colorada operates an open pit mine as well as concentrating facility and two-line pelletizing facility. ArcelorMittal holds a 50.00% interest in Double G Coating, a hot dip galvanizing and Galvalume facility in the United States. 2.5 The Hibbing Taconite Mines in which the Company holds a 62.31% interest are iron ore mines located in the USA and operations consist of open pit mining, crushing, concentrating and pelletizing. Hibbing Taconite Mines and Peña Colorada are part of the Mining segment; other joint operations are part of NAFTA. Other investments The Company holds the following other investments: Available-for-sale securities (at fair value) Investments accounted for at cost Total The Company s material available-for-sale investments at December 31, 2017 and 2016 are the following: Ere li Demir ve Çelik Fabrikalari T.A.S. ( Erdemir ) As of December 31, 2017 and 2016, the fair value of ArcelorMittal s stake in Erdemir amounted to 1,118 and 618, respectively. Unrealized gains (losses) recognized in other comprehensive income were 658 and 183 for the year ended December 31, 2017 and 2016, respectively. During the fourth quarter of 2015, the fair value of Erdemir decreased below the fair value at which the Company previously recorded an impairment charge and accordingly, the Company recorded an additional impairment charge of 101 in income (loss) from investments in associates, joint ventures and other investments for the year ended December 31, Stalprodukt S.A. Following the sale of 729,643 shares including the subsequent capital reduction of Stalprodukt S.A. during the first six months of 2016, for total cash consideration of 46, ArcelorMittal s ownership interest and voting rights in Stalprodukt S.A. decreased from 28.47% to 21.20% and from 28.26% to 11.61%, respectively. As a result of the loss of significant influence, the Company discontinued the accounting for its investment under the equity method and reclassified its interest as available-for-sale within other investments in the statements of financial position (see note 2017 December 31, , , ). The Company recorded an aggregate loss on disposal of 26 in income (loss) from investments in associates, joint ventures and other investments including a loss of 13 with respect to the above mentioned transaction, a loss of 13 with respect to the fair value remeasurement of the remaining interest of 21.20% and a loss of 11 and a gain of 11 resulting from the reclassification of the accumulated foreign exchange translation losses and unrealized gains on derivative financial instruments from other comprehensive income to the statements of operations, respectively. As of December 31, 2017 and 2016, the fair value of ArcelorMittal s stake in Stalprodukt S.A. was 171 and 148, respectively. Unrealized gains recognized in other comprehensive income were 77 and 66 for the year ended December 31, 2017 and 2016, respectively. Gerdau On July 14, 2015, ArcelorMittal entered into a share swap agreement with Gerdau whereby ArcelorMittal exchanged unlisted shares of Gerdau against listed shares and a cash consideration of 28. The share swap resulted in a gain of 55 recorded as income (loss) from investments in associates, joint ventures and other investments. The unlisted shares were accounted for at cost, whereas the shares listed on an exchange are accounted for at fair value. As of December 31, 2017 and 2016, the fair value of ArcelorMittal s stake in Gerdau was 112 and 99. Unrealized
112 112 Consolidated financial statements gains recognized in other comprehensive income were 42 and 38 for the year ended December 31, 2017 and 2016, respectively. At December 31, 2017 and 2016, the Company reviewed its investments in Erdemir, Gerdau and Stalprodukt S.A. for impairment and concluded there were no impairment triggers. Unconsolidated structured entities The aforesaid operating leases have been agreed for a 12 year period, during which the Company is obliged to pay the structured entities minimum fees equivalent to approximately 4 per year and per vessel. In addition, ArcelorMittal holds call options to buy each of the six vessels from the structured entities at pre-determined dates and prices as presented in the table below. The structured entities hold put options enabling them to sell each of the vessels at the end of the lease terms at 6 each to the Company. ArcelorMittal has operating lease arrangements for six vessels (Panamax Bulk Carriers) involving structured entities whose main purpose is to hold legal title of the six vessels and to lease them to the Company. Such entities are wholly-owned and controlled by a financial institution and are funded through equity instruments by the financial institution. Operating lease arrangements began for five vessels in 2013 and for a sixth vessel in Call option strike prices at the 132nd at the 144th month month at the 60th month at the 72nd month at the 84th month at the 96th month at the 108th month at the 120th month First four vessels Fifth vessel Sixth vessel Exercise dates Amounts per vessel 1 1. If the actual fair value of each vessel is higher than the strike price at each of the exercise dates, ArcelorMittal is obliged to share 50% of the gain with the structured entities. In addition, pursuant to these arrangements, the Company had a receivable (classified as Other assets ) of 26 and 30 at December 31, 2017 and 2016, respectively, which does not bear interest, is forgiven upon default and will be repaid by the structured entities quarterly in arrears throughout the lease term. The outstanding balance will be used to offset payment of any interim call options, if exercised. 2.6 Income (loss) from investments in associates, joint ventures and other investments Income (loss) from investments in associates, joint ventures and other investments consisted of the following: Share in net earnings of equity-accounted companies Impairment charges Gain (loss) on disposal Dividend income Total For the year ended December 31, 2017, impairment charges include 17 and 9 relating to the write down of receivables from associates and joint ventures. For the year ended December 31, 2016, impairment charges include 14 and 14 relating to Kalagadi (see note 2.4.4) and Comvex, respectively. For the year ended December 31, 2015, impairment charges include mainly impairments in connection with the Company s investments in Kalagadi, Uttam Galva (see note 2.4.4), Northern Cape Iron Ore Mining Project, and the Company s investment in Erdemir (see note 2.5) Year Ended December 31, (59) (26) (28) (565) (117) (502) For the year ended December 31, 2017, gain (loss) on disposal includes a gain of 133 (the cash settlement occurs through three annual installments of 44 and the first one was completed on August 7, 2017) and disposal of the Company's 21% shareholding in Empire Iron Mining Partnership ("EIMP"), a loss of 44 on dilution of the Company's share in China Oriental (see note 2.4), a loss of 22 on dilution of the Company's interest in Baffinland (see note 2.4), a loss of 187 as a result of the reclassification of the accumulated foreign exchange translation losses from other comprehensive income to the statements of operations following the completion of the sale of the
113 Consolidated financial statements 113 Company's 50% shareholding in Kalagadi to Kgalagadi Alloys (Proprietary) Limited on August 25, As per sales agreement signed on October 21, 2016, ArcelorMittal receives a contingent consideration to be paid during the life of the mine, which is capped at 150 and contingent upon the financial performance of the mine and cash flow availability. For the year ended December 31, 2016, gain (loss) on disposal mainly includes a gain of 329 relating to the disposal of Gestamp (see note 2.4), a loss of 26 relating to the disposal of Stalprodukt S.A. shares (see note 2.5) and a gain of 74 following the sale of its 10.08% interest in Hunan Valin to a private equity fund. The Company transferred the Hunan Valin shares and simultaneously received the full proceeds of 165 (RMB1,103 million) on September 14, For the year ended December 31, 2015, gain (loss) on disposal mainly includes a net gain of 55 relating to the Gerdau share swap (see note 2.5). Note 3: Segment reporting 3.1 Reportable segments The Company is organized in five operating and reportable segments, which are components engaged in business activities from which they may earn revenues and incur expenses (including revenues and expenses relating to transactions with other components of the Company), for which discrete financial information is available and whose operating results are evaluated regularly by the chief operating decision maker CODM to make decisions about resources to be allocated to the segment and assess its performance. As of January 1, 2016, the Group Management Board GMB (ArcelorMittal s previous CODM) was replaced by the CEO Office - comprising the CEO, Mr. Lakshmi N. Mittal and the CFO, Mr. Aditya Mittal. These operating segments include the attributable goodwill, intangible assets, property, plant and equipment, and certain equity method investments. They do not include cash and short-term deposits, short-term investments, tax assets and other current financial assets. Attributable liabilities are also those resulting from the normal activities of the segment, excluding tax liabilities and indebtedness but including post retirement obligations where directly attributable to the segment. The treasury function is managed centrally for the Company and is not directly attributable to individual operating segments or geographical areas. ArcelorMittal s segments are structured as follows: NAFTA represents the flat, long and tubular facilities of the Company located in North America (Canada, United States and Mexico). NAFTA produces flat products such as slabs, hot-rolled coil, cold-rolled coil, coated steel and plate. These products are sold primarily to customers in the following sectors: automotive, energy, construction, packaging and appliances and via distributors or processors. NAFTA also produces long products such as wire rod, sections, rebar, billets, blooms and wire drawing, and tubular products; Brazil includes the flat operations of Brazil and the long and tubular operations of Brazil and neighboring countries including Argentina, Costa Rica and Venezuela. Flat products include slabs, hot-rolled coil, cold-rolled coil and coated steel. Long products consist of wire rod, sections, bar and rebar, billets, blooms and wire drawing; Europe is the largest flat steel producer in Europe, with operations that range from Spain in the west to Romania in the east, and covering the flat carbon steel product portfolio in all major countries and markets. Europe produces hot-rolled coil, cold-rolled coil, coated products, tinplate, plate and slab. These products are sold primarily to customers in the automotive, general and packaging sectors. Europe also produces long products consisting of sections, wire rod, rebar, billets, blooms and wire drawing, and tubular products. In addition, it includes Downstream Solutions, primarily an in-house trading and distribution arm of ArcelorMittal. Downstream Solutions also provides value-added and customized steel solutions through further steel processing to meet specific customer requirements; ACIS produces a combination of flat, long and tubular products. Its facilities are located in Africa and the Commonwealth of Independent States; and Mining comprises all mines owned by ArcelorMittal in the Americas (Canada, United States, Mexico and Brazil), Asia (Kazakhstan), Europe (Ukraine and Bosnia & Herzegovina) and Africa (Liberia). It provides the Company's steel operations with high quality and low-cost iron ore and coal reserves and also sells limited amounts of mineral products to third parties.
114 114 Consolidated financial statements The following table summarizes certain financial data for ArcelorMittal s operations by reportable segments. Year ended December 31, 2015 Sales to external customers NAFTA Brazil Europe ACIS Mining Others 1 Elimination Total 17,225 7,954 31,586 5, , , (705) (624) (3,522) (140) 31 (4,161) Depreciation and amortization , ,192 Impairment ,370 4,764 Capital expenditures , ,707 15,769 5,526 28,999 5, , , , , , ,893 6,571 35,825 7, , , , , , , Intersegment sales Operating income (loss) (3,994) Year ended December 31, 2016 Sales to external customers Intersegment sales 2 Operating income (loss) Depreciation and amortization Impairment Capital expenditures (3,810) (208) (94) 4, , ,444 68,679 Year ended December 31, 2017 Sales to external customers Intersegment sales 2 Operating income (loss) Depreciation and amortization Impairment Capital expenditures (5,320) (288) (18) 5, , , Others include all other operational and non-operational items which are not segmented, such as corporate and shared services, financial activities, and shipping and logistics. 2. Transactions between segments are reported on the same basis of accounting as transactions with third parties except for certain mining products shipped internally and reported on a cost plus basis. The reconciliation from operating income (loss) to net income (loss) (including non-controlling interests) is as follows: 2017 Operating income (loss) Income/ (loss) from investments in associates and joint ventures Financing costs - net Income (loss) before taxes Income tax expense Net income/ (loss) (including non-controlling interests) 5, (875) Year ended December 31, ,161 (4,161) 615 (502) (2,056) (2,858) 5,007 2,720 (7,521) ,575 1, (8,423) The Company does not regularly provide a measure of total assets and liabilities for each reportable segment to the CODM. 3.2 Geographical information Geographical information, by country or region, is separately disclosed and represents ArcelorMittal s most significant regional markets. Attributed assets are operational assets employed in each region and include items such as pension balances that are specific to a country. Unless otherwise stated in the table heading as a segment disclosure, these disclosures are specific to the country or region stated. They do not include goodwill, deferred tax assets, other investments or receivables and other noncurrent financial assets. Attributed liabilities are those arising within each region, excluding indebtedness.
115 Consolidated financial statements 115 Sales (by destination) 2017 Year ended December 31, Americas 14,367 12,284 13,619 Brazil 4,149 3,506 3,809 Canada 3,034 2,818 2,913 Mexico 2,251 1,806 1,913 Argentina 1, , , ,036 22,207 25,909 Germany 5,933 4,768 5,473 France 4,051 3,655 3,743 Spain 3,751 3,015 3,406 Poland 3,746 2,997 3,023 Italy 2,711 2,067 2,278 Turkey 1,937 1,789 1,962 Czech Republic 1,400 1,107 1,476 United Kingdom 1,370 1,159 1,246 Russia 1, Belgium 1, ,108 Netherlands 1,117 1, ,948 3,886 4,024 33,918 27,616 29,827 United States Venezuela Others Total Americas Europe Romania Others Total Europe Asia & Africa 2,560 2,026 2,111 Egypt Morocco South Africa 1, China Kazakhstan South Korea Rest of Africa India Rest of Asia Total Asia & Africa Total ,790 2,119 2,397 8,725 6,968 7,842 68,679 56,791 63,578 Revenues from external customers attributed to the country of domicile (Luxembourg) were 111, 88 and 85 for the years ended December 31, 2017, 2016 and 2015, respectively.
116 116 Consolidated financial statements Non-current assets1 per significant country: December 31, Canada 5,368 5,208 Brazil 4,466 4,471 United States 4,029 4,209 Mexico Argentina Venezuela ,098 15,010 France 4,738 4,194 Belgium 2,827 2,458 Germany 2,737 2,395 Poland 2,421 2,112 Ukraine 2,077 2,110 Spain 2,035 1,797 Luxembourg Americas Others Total Americas Europe 1,277 1,142 Romania Czech Republic Bosnia and Herzegovina Italy Others ,003 17,942 Kazakhstan 1,322 1,223 South Africa Morocco Total Europe Asia & Africa Liberia Total Asia & Africa 2,314 2,280 Unallocated assets 21,137 17,663 Total 58,552 52,895 Others 1. Non-current assets do not include goodwill (as it is not allocated to the individual countries), deferred tax assets, investment in associate and joint ventures, other investments and other non-current financial assets. Such assets are presented under the caption Unallocated assets. 3.3 Sales by type of products The table below presents sales to external customers by product type. In addition to steel produced by the Company, amounts include material purchased for additional transformation and sold through distribution services. Others mainly includes non-steel sales and services. Year ended December 31, Flat products 43,065 34,215 36,226 Long products 13,685 12,104 13,996 1,810 1,500 2, Tubular products Mining products Others Total 9,134 8,191 9,723 68,679 56,791 63,578
117 Consolidated financial statements 117 Note 4: Operating data 4.1 Revenue Revenue is measured at the fair value of the consideration received or receivable. Revenue is reduced for estimated customer returns and other similar allowances. Revenue from the sale of goods is recognized when the Company has transferred to the buyer the significant risks and rewards of ownership of the goods, no longer retains control over the goods sold, the amount of revenue can be measured reliably, it is probable that the economic benefits associated with the transaction will flow to the Company and the costs incurred or to be incurred in respect of the transaction can be measured reliably. 4.2 Revenue from the sale of iron ore is recognized when the risk and rewards of ownership are transferred to the buyer. The selling price is contractually determined on a provisional basis, based on a reliable estimate of the selling price and adjustments in the price may subsequently occur depending on movements in the reference price or contractual iron ore prices to the date of the final pricing and final product specifications. ArcelorMittal records amounts billed to a customer in a sale transaction for shipping and handling costs as sales and the related shipping and handling costs incurred as cost of sales. Cost of sales Cost of sales includes the following components: Year ended December 31, ,813 34,276 41,788 Labor costs 1 8,842 7,572 9,125 Logistic expenses 4,161 3,760 4,252 Depreciation and amortization 2,768 2,721 3,192 4,764 Materials Other 2,086 1,894 2,075 Total 60,876 50,428 65,196 Impairment 1. In 2016, labor costs include an 832 gain relating to changes in post-employment benefit plans in the US (see note 7.2). 4.3 Trade accounts receivable and other Trade accounts receivable are initially recorded at their fair value and do not carry any interest. ArcelorMittal maintains an allowance for doubtful accounts at an amount that it considers to be a reliable estimate of losses resulting from the inability of its customers to make required payments. In judging the adequacy of the allowance for doubtful accounts, ArcelorMittal considers multiple factors including historical bad debt experience, the current economic environment and the aging of the receivables. Recoveries of trade receivables previously reserved in the allowance for doubtful accounts are recognized as gains in selling, general and administrative expenses. ArcelorMittal s policy is to record an allowance and a charge in selling, general and administrative expense when a specific account is deemed uncollectible and to provide for each receivable overdue by more than 180 days; an allowance is utilized when there is legal evidence that the receivable will not be collected. Based on historical experience, such receivables are generally not recoverable, unless it can be clearly demonstrated that the receivable is still collectible. Estimated unrecoverable amounts of trade receivables between 60 days and 180 days overdue are provided for based on past historic loss rate. Trade accounts receivable and allowance for doubtful accounts December 31, Gross amount Allowance for doubtful accounts Total ,056 3,158 (193) 3,863 (184) 2,974
118 118 Consolidated financial statements The carrying amount of the trade accounts receivable and other approximates their fair value. Before granting credit to any new customer, ArcelorMittal uses an internally developed credit scoring system to assess the potential customer s credit quality and to define credit limits by customer. For all significant customers the credit terms must be approved by the credit committees of each reportable segment. Limits and scoring attributed to customers are reviewed periodically. There are no customers who represent more than 5% of the total balance of trade accounts receivable. Exposure to credit risk by reportable segment The maximum exposure to credit risk for trade accounts receivable by reportable segment is as follows: NAFTA Brazil Europe ACIS Mining Total 2017 December 31, ,052 1, ,863 2,974 Aging of trade accounts receivable December 31, December 31, 2017 Gross Allowance 2016 Total Gross Allowance Total 3,134 (4) 3,130 2,476 (6) 2,470 Overdue 1-30 days 538 (9) (1) 291 Overdue days 106 (1) (1) 62 Overdue days (1) 31 Overdue days 46 (13) (6) (166) (169) 76 4,056 (193) 3,863 3,158 (184) 2,974 Not past due More than 180 days Total The movement in the allowance for doubtful accounts in respect of trade accounts receivable during the periods presented is as follows: Balance as of December 31, Additions Balance as of December 31, Additions Balance as of December 31, Additions Deductions/ Releases (19) Foreign exchange and others (27) Balance as of December 31, Deductions/ Releases (25) Foreign exchange and others 5 Balance as of December 31, Deductions/ Releases (38) Foreign exchange and others 13 Balance as of December 31, The Company has established a number of programs for sales without recourse of trade accounts receivable to various financial institutions (referred to as true sale of receivables ( TSR )). Through the TSR programs, certain operating subsidiaries of ArcelorMittal surrender the control, risks and benefits associated with the accounts receivable sold; therefore, the amount of receivables sold is recorded as a sale of financial assets and the balances are removed from the consolidated statements of financial position at the moment of sale.
119 Consolidated financial statements Inventories Net realizable value represents the estimated selling price at which the inventories can be realized in the normal course of business after allowing for the cost of conversion from their existing state to a finished condition and for the cost of marketing, selling, and distribution. Net realizable value is estimated based on the most reliable evidence available at the time the estimates were made of the amount that the inventory is expected to realize, taking into account the purpose for which the inventory is held. Inventories are carried at the lower of cost or net realizable value. Cost is determined using the average cost method. Costs of production in process and finished goods include the purchase costs of raw materials and conversion costs such as direct labor and an allocation of fixed and variable production overheads. Raw materials and spare parts are valued at cost, inclusive of freight, shipping, handling as well as any other costs incurred in bringing the inventories to their present location and condition. Interest charges, if any, on purchases have been recorded as financing costs. Costs incurred when production levels are abnormally low are capitalized as inventories based on normal capacity with the remaining costs incurred recorded as a component of cost of sales in the consolidated statements of operations. Previous write-downs are reversed in case the circumstances that previously caused inventories to be written down below cost no longer exist. Inventories, net of allowance for slow-moving inventory, excess of cost over net realizable value and obsolescence of 1,239 and 1,097 as of December 31, 2017 and 2016, respectively, are comprised of the following: 2017 December 31, 2016 Finished products 6,321 4,861 Production in process 4,049 3,264 Raw materials 5,883 5,141 Manufacturing supplies, spare parts and other 1,733 1,468 17,986 14,734 Total Note 4.2 discloses the cost of inventories (materials) recognized as an expense during the year. The movement in the inventory reserve is as follows: Balance as of December 31, ,293 Balance as of December 31, ,707 Balance as of December 31, , Additions 1 Deductions / Releases 2 1,256 (637) Additions 1 Deductions / Releases Additions (964) 1 Deductions / Releases (404) Foreign exchange and others (205) Balance as of December 31, ,707 Foreign exchange and others (119) Balance as of December 31, ,097 Foreign exchange and others 104 Balance as of December 31, ,239 Additions refer to write-downs of inventories including those utilized or written back during the same financial year. Deductions/releases correspond to write-backs and utilizations related to the current and prior periods. 4.5 Prepaid expenses and other current assets 2017 December 31, 2016 VAT receivables Prepaid expenses and non-trade receivables Financial amounts receivable Income tax receivable Receivables from public authorities Receivables from sale of financial and intangible assets Derivative financial instruments Other 1 Total 1. Other includes mainly advances to employees, accrued interest and other miscellaneous receivables ,931 1,665
120 120 Consolidated financial statements 4.6 Other assets Other assets consisted of the following: December 31, Derivative financial instruments (see Note ) Financial amounts receivable Long-term VAT receivables Cash guarantees and deposits Receivables from public authorities Accrued interest Receivables from sale of financial and intangible assets Income tax receivable ,234 1,353 Other 1 Total 1. Other mainly includes assets in pension funds and other amounts receivable 4.7 Trade accounts payable and other Trade accounts payable are obligations to pay for goods that have been acquired in the ordinary course of business from suppliers. Trade accounts payable have maturities from 15 to 180 days depending on the type of material, the geographic area in which the purchase transaction occurs and the various contractual agreements. The carrying value of trade accounts payable approximates fair value. 4.8 Accrued expenses and other liabilities Accrued expenses and other liabilities are comprised of the following as of: 2017 December 31, ,787 1,560 Accrued interest and other payables Payable from acquisition of intangible, tangible & financial assets Other amounts due to public authorities Derivative financial instruments ,505 3,943 Accrued payroll and employee related expenses Unearned revenue and accrued payables Total Note 5: Goodwill, intangible and tangible assets 5.1 Goodwill and intangible assets The carrying amounts of goodwill and intangible assets are summarized as follows: December 31, ,294 5,248 Concessions, patents and licenses Customer relationships and trade marks Goodwill on acquisitions Other Total ,737 5,651 Goodwill Goodwill arising on an acquisition is recognized as previously described within the business combinations section in note Goodwill is allocated to those groups of cash-generating units that are expected to benefit from the business combination in which the goodwill arose and in all cases is at the operating segment level, which represents the lowest level at which goodwill is monitored for internal management purposes.
121 Consolidated financial statements 121 Goodwill acquired in business combinations for each of the Company s operating segments is as follows: NAFTA 2,209 Foreign exchange differences and other movements 6 Brazil 1,426 December 31, 2015 Divestments1 (13) 2,202 1, Europe 547 (16) (2) ACIS 961 (112) Total 5, (15) 1. December 31, ,248 See note December 31, 2016 Foreign exchange differences and other movements1 Divestments December 31, 2017 NAFTA 2, ,249 Brazil 1,668 (28) 1, Europe ACIS 849 (26) 823 Total 5, , The movements for Brazil includes 2 related to Sumaré acquisition (please refer to note 2.2.4) Intangible assets Intangible assets are recognized only when it is probable that the expected future economic benefits attributable to the assets will accrue to the Company and the cost can be reliably measured. Intangible assets acquired separately by ArcelorMittal are initially recorded at cost and those acquired in a business combination are initially recorded at fair value at the date of the business combination. These primarily include the cost of technology and licenses purchased from third parties and operating authorizations granted by governments or other public bodies (concessions). Intangible assets are amortized on a straight-line basis over their estimated economic useful lives, which typically do not exceed five years. Amortization is included in the consolidated statements of operations as part of cost of sales. ArcelorMittal s industrial sites which are regulated by the European Directive 2003/87/EC of October 13, 2003 on carbon dioxide ( CO2 ) emission rights, effective as of January 1, 2005, are located primarily in Belgium, Czech Republic, France, Germany, Luxembourg, Poland, Romania and Spain. ArcelorMittal's operations in Ontario, Canada are subject to the Climate Change Mitigation and Low-carbon Economy Act, 2016, a cap and trade program regulation effective from July 1, The emission rights allocated to the Company on a no-charge basis pursuant to the annual national allocation plan are recorded at nil value and purchased emission rights are recorded at cost.
122 122 Consolidated financial statements Other intangible assets are summarized as follows: Concessions, patents and licenses Customer relationships and trade marks Other Total 730 1, , Disposals (2) (5) (7) Foreign exchange differences (1) 22 (1) 20 Cost At December 31, 2015 Acquisitions Transfers and other movements (4) 14 Fully amortized intangible assets 2 (71) (2) (73) At December 31, , , Acquisitions Disposals (1) Foreign exchange differences Transfers and other movements 1 20 (1) (3) 16 Fully amortized intangible assets 2 (18) (3) (21) At December 31, , , , (1) 189 Accumulated amortization and impairment losses At December 31, 2015 Amortization charge Foreign exchange differences 3 15 (1) (2) (2) Fully amortized intangible assets 2 (71) (2) (73) At December 31, Amortization charge Foreign exchange differences Transfers and other movements Transfers and other movements 1,429 (4) (1) (5) Fully amortized intangible assets 2 (18) (3) (21) At December 31, , ,633 At December 31, At December 31, Carrying amount Transfers and other movements correspond mainly to transfer from assets under construction into patents and licenses in 2017 and Fully amortized assets correspond mainly to licenses in 2017 and Research and development costs not meeting the criteria for capitalization are expensed as incurred. These costs amounted to 278, 239 and 227 for the years ended December 31, 2017, 2016, and 2015, respectively and were recognized in selling, general and administrative expenses. 5.2 Property, plant and equipment and biological assets Property, plant and equipment is recorded at cost less accumulated depreciation and impairment. Cost includes all related costs directly attributable to the acquisition or construction of the asset. Except for land and assets used in mining activities, property, plant and equipment is depreciated using the straight-line method over the useful lives of the related assets as presented in the table below. Asset Category Land Useful Life Range Not depreciated Buildings 10 to 50 years Property plant & equipment 15 to 50 years Auxiliary facilities 15 to 45 years Other facilities 5 to 20 years
123 Consolidated financial statements 123 The Company s annual review of useful lives leverages on the experience gained from an in-depth review performed every five years, any significant change in the expected pattern of consumption embodied in the asset, and the specialized knowledge of ArcelorMittal s network of chief technical officers. The chief technical officer network includes engineers with facility-specific expertise related to plant and equipment used in the principal production units of the Company s operations. The most recent in-depth review took place in 2014, during which the Company performed a review of the useful lives of its assets and determined its maintenance and operating practices enabled an extension of the useful lives of plant and equipment. In performing this review, the Company gathered and evaluated data, including commissioning dates, designed capacities, maintenance records and programs, and asset performance history, among other attributes. In accordance with IAS 16, Property, Plant and Equipment, the Company considered this information at the level of components significant in relation to the total cost of the item of plant and equipment. Other factors the Company considered in its determination of useful lives included the expected use of the assets, technical or commercial obsolescence, and operational factors that led to improvements in monitoring and process control that contribute to longer asset lives. In addition, the Company considered the accumulated technical experience and knowledge sharing programs that allowed for the exchange of best practices within the chief technical officer network and the deployment of these practices across the Company s principal production units. Major improvements, which add to productive capacity or extend the life of an asset, are capitalized, while repairs and maintenance are expensed as incurred. Where a tangible fixed asset comprises major components having different useful lives, these components are accounted for as separate items. Property, plant and equipment under construction is recorded as construction in progress until it is ready for its intended use; thereafter it is transferred to the related class of property, plant and equipment and depreciated over its estimated useful life. Interest incurred during construction is capitalized if the borrowing cost is directly attributable to the construction. Gains and losses on retirement or disposal of assets are recognized in cost of sales. Property, plant and equipment acquired by way of finance leases is stated at an amount equal to the lower of the fair value and the present value of the minimum lease payments at the inception of the lease. Each lease payment is allocated between the finance charges and a reduction of the lease liability. The interest element of the finance cost is charged to the consolidated statements of operations over the lease period so as to achieve a constant rate of interest on the remaining balance of the liability. The residual values and useful lives of property, plant and equipment are reviewed at each reporting date and adjusted if expectations differ from previous estimates. Depreciation methods applied to property, plant and equipment are reviewed at each reporting date and changed if there has been a significant change in the expected pattern of consumption of the future economic benefits embodied in the asset. Mining assets comprise: Mineral rights acquired; Capitalized developmental stripping (as described below in Stripping and overburden removal costs ). Property, plant and equipment used in mining activities is depreciated over its useful life or over the remaining life of the mine, if shorter, and if there is no alternative use. For the majority of assets used in mining activities, the economic benefits from the asset are consumed in a pattern which is linked to the production level and accordingly, assets used in mining activities are primarily depreciated on a units-ofproduction basis. A unit-of-production is based on the available estimate of proven and probable reserves. Capitalization of pre-production expenditures ceases when the mining property is capable of commercial production as it is intended by management. General administration costs that are not directly attributable to a specific exploration area are charged to the consolidated statements of operations. Mining Reserves Reserves are estimates of the amount of product that can be economically and legally extracted from the Company s properties. In order to estimate reserves, estimates are required for a range of geological, technical and economic factors, including quantities, grades, production techniques, recovery rates, production costs, transport costs, commodity demand, commodity prices and exchange rates. Estimating the quantity and/or grade of reserves requires the size, shape and depth of ore bodies to be determined by analyzing geological data such as drilling samples. This process may require complex and difficult geological judgments to interpret the data. Because the economic assumptions used to estimate reserves change from period to period, and because additional geological data is generated during the course of operations, estimates of reserves may change from period to period. Changes in reported reserves may affect the Company s financial results and financial position in a number of ways, including the following: Asset carrying amounts may be affected due to changes in estimated future cash flows.
124 124 Consolidated financial statements Depreciation, depletion and amortization charged in the consolidated statements of operations may change where such charges are determined by the units of production basis, or where the useful economic lives of assets change. Overburden removal costs recognized in the consolidated statements of financial position or charged to the consolidated statements of operations may change due to changes in stripping ratios or the units of production basis of depreciation. Decommissioning, site restoration and environmental provisions may change where changes in estimated reserves affect expectations about the timing or cost of these activities. Stripping and overburden removal costs In open pit and underground mining operations, it is often necessary to remove overburden and other waste materials to access the deposit from which minerals can be extracted. This process is referred to as stripping. Stripping costs can be incurred before the mining production commences ( developmental stripping ) or during the production stage ( production stripping ). A mine can operate several open pits that are regarded as separate operations for the purpose of mine planning and production. In this case, stripping costs are accounted for separately, by reference to the ore extracted from each separate pit. If, however, the pits are highly integrated for the purpose of mine planning and production, stripping costs are aggregated. The determination of whether multiple pit mines are considered separate or integrated operations depends on each mine s specific circumstances. The following factors would point towards the stripping costs for the individual pits being accounted for separately: If mining of the second and subsequent pits is conducted consecutively with that of the first pit, rather than concurrently. If separate investment decisions are made to develop each pit, rather than a single investment decision being made at the outset. If the pits are operated as separate units in terms of mine planning and the sequencing of overburden and ore mining, rather than as an integrated unit. If expenditures for additional infrastructure to support the second and subsequent pits are relatively large. If the pits extract ore from separate and distinct ore bodies, rather than from a single ore body. The relative importance of each factor is considered by local management to determine whether the stripping costs should be attributed to the individual pit or to the combined output from several pits. Developmental stripping costs contribute to the future economic benefits of mining operations when the production begins and so are capitalized as tangible assets (construction in progress), whereas production stripping is a part of on-going activities and commences when the production stage of mining operations begins and continues throughout the life of a mine. Capitalization of developmental stripping costs ends when the commercial production of the minerals commences. Production stripping costs are incurred to extract the ore in the form of inventories and/or to improve access to an additional component of an ore body or deeper levels of material. Production stripping costs are accounted for as inventories to the extent the benefit from production stripping activity is realized in the form of inventories. Production stripping costs are recognized as a non-current asset ( stripping activity assets ) to the extent it is probable that future economic benefit in terms of improved access to ore will flow to the Company, the components of the ore body for which access has been improved can be identified and the costs relating to the stripping activity associated with that component can be measured reliably. All stripping costs assets (either stripping activity assets or capitalized developmental stripping costs) are presented within a specific mining assets class of property, plant and equipment and then depreciated on a units-of-production basis. Exploration and evaluation expenditure Exploration and evaluation activities involve the search for iron ore and coal resources, the determination of technical feasibility and the assessment of commercial viability of an identified resource. Exploration and evaluation activities include: researching and analyzing historical exploration data; conducting topographical, geological, geochemical and geophysical studies; carrying out exploratory drilling, trenching and sampling activities; drilling, trenching and sampling activities to determine the quantity and grade of the deposit; examining and testing extraction methods and metallurgical or treatment processes; and
125 Consolidated financial statements 125 detailed economic feasibility evaluations to determine whether development of the reserves is commercially justified and to plan methods for mine development. making permanent excavations; Exploration and evaluation expenditure is charged to the consolidated statements of operations as incurred except in the following circumstances, in which case the expenditure is capitalized: (i) the exploration and evaluation activity is within an area of interest which was previously acquired in a business combination and measured at fair value on acquisition; or (ii) when management has a high degree of confidence in the project s economic viability and it is probable that future economic benefits will flow to the Company. building roads and tunnels; and Capitalized exploration and evaluation expenditures are generally recorded as a component of property, plant and equipment at cost less impairment charges, unless their nature requires them to be recorded as an intangible asset. As the asset is not available for use, it is not depreciated and all capitalized exploration and evaluation expenditure is monitored for indications of impairment. To the extent that capitalized expenditure is not expected to be recovered, it is recognized as an expense in the consolidated statements of operations. Cash flows associated with exploration and evaluation expenditure are classified as operating activities when they are related to expenses or as an investing activity when they are related to a capitalized asset in the consolidated statements of cash flows. Development expenditure Development is the establishment of access to the mineral reserve and other preparations for commercial production. Development activities often continue during production and include: sinking shafts and underground drifts (often called mine development); developing passageways and rooms or galleries; advance removal of overburden and waste rock. Development (or construction) also includes the installation of infrastructure (e.g., roads, utilities and housing), machinery, equipment and facilities. When reserves are determined and development is approved, expenditures capitalized as exploration and evaluation are reclassified as construction in progress and are reported as a component of property, plant and equipment. All subsequent development expenditures are capitalized and classified as construction in progress. On completion of development, all assets included in construction in progress are individually reclassified to the appropriate category of property, plant and equipment and depreciated accordingly. Biological assets Biological assets are part of the Brazil operating segment and consist of eucalyptus forests located in the Brazilian state of Minas Gerais exclusively from renewable plantations and intended for the production of charcoal to be utilized as fuel and a source of carbon in the direct reduction process of pig iron production in some of the Company s blast furnaces in Brazil. Biological assets are measured at their fair value, net of estimated costs to sell at the time of harvest. The fair value is determined based on the discounted cash flow method, taking into consideration the cubic volume of wood, segregated by plantation year, and the equivalent sales value of standing trees. The average sales price was estimated based on domestic market prices. In determining the fair value of biological assets, a discounted cash flow model was used, with a harvest cycle of six to seven years.
126 126 Consolidated financial statements Property, plant and equipment and biological assets are summarized as follows: Land, buildings and Improvements Machinery, equipment and other 2 Construction in progress Mining Assets Total 11,732 43,934 3,510 3,659 62, ,074 Cost At December 31, Additions 37 2,426 (13) (1,798) (24) (4) (1,543) (4) (254) (118) Foreign exchange differences (606) (1,122) (57) Disposals (129) (1,386) (64) (186) Divestments (note 2.3) Transfers to assets held for sale (note 2.3) Other movements 1 At December 31, 2016 Additions Foreign exchange differences Disposals Divestments (note 2.3) Transfers to assets held for sale (note 2.3) Other movements 1 At December 31, 2017 (18) 162 (3) 1,875 (97) (2,224) 72 11,108 43,317 3,257 3,751 61, , ,938 1,629 5, ,343 (115) (97) (853) (7) (1) (7) (40) (47) (21) (95) (116) (958) 143 1,928 (2,113) ,845 50,174 3,732 3,875 70,626 Accumulated depreciation and impairment 3,344 20,220 1,060 2,431 27,055 Depreciation charge for the year 339 2, ,628 Impairment (note 5.3) (14) At December 31, 2015 Disposals (103) (1,336) (24) (9) (1,472) Foreign exchange differences (414) (1,083) (15) (1) (1,513) (14) (168) (182) (63) (63) Divestments (note 2.3) Transfers to assets held for sale (note 2.3) Other movements 1 At December 31, 2016 Depreciation charge for the year Impairment (note 5.3) 993 2,491 26, , , (61) Foreign exchange differences 940 Transfers to assets held for sale (note 2.3) 1 (41) 13 19,980 Disposals Divestments (note 2.3) (28) 3,138 (820) 4,080 (1) 18 2 (56) (882) 5,040 (4) (39) (43) (18) (64) (82) ,356 25, ,611 33,655 At December 31, ,970 23,337 2,264 1,260 34,831 At December 31, ,489 24,474 2,744 1,264 36,971 Other movements At December 31, 2017 (22) Carrying amount Other movements predominantly represent transfers from construction in progress to other categories and retirement of fully amortized assets. Machinery, equipment and other includes biological assets of 36 and 49 as of December 31, 2017 and 2016 respectively, and bearer plants of 35 and 36 as of December 31, 2017 and 2016, respectively. The carrying amount of temporarily idle property, plant and equipment at December 31, 2017 and 2016 was 325 and 359 including 297 and 298 in Brazil, 6 and 43 in NAFTA and 22 and 18 in the Europe segment, respectively. The carrying amount of property, plant and equipment retired from active use and not classified as held for sale was 51 and 75 at December 31, 2017 and 2016, respectively. Such assets are carried at their recoverable amount.
127 Consolidated financial statements 127 Lease arrangements The Company may enter into arrangements that do not take the legal form of a lease, but may contain a lease. This will be the case if the following two criteria are met: The fulfillment of the arrangement depends on the use of a specific asset and The arrangement conveys a right to use the asset. Assets under lease arrangements which transfer substantially all of the risks and rewards of ownership to the Company are classified as finance leases. On initial recognition, the leased asset and its related liability are measured at an amount equal to the lower of its fair value and the present value of the minimum lease payments. Subsequent to initial recognition, the asset is accounted for in accordance with the accounting policy applicable to that asset while the minimum lease payments are apportioned between financing costs and reduction of the lease liability. Assets held under lease arrangements that are not finance leases are classified as operating leases and are not recognized in the consolidated statements of financial position. Payments made under operating leases are recognized in cost of sales in the consolidated statements of operations on a straight-line basis over the lease terms. The carrying amount of capitalized leases was 415 and 467 as of December 31, 2017 and 2016, respectively including 364 and 421 related to machinery and equipment and 51 and 46 to buildings, respectively. The total future minimum lease payments related to finance leases for the year ended December 31, 2017 were as follows: and beyond 160 Total minimum lease commitments 744 Less: future finance charges 256 Present value of minimum lease payments 488 The total future minimum lease payments related to finance leases for the year ended December 31, 2016 were as follows: and beyond 221 Total minimum lease commitments 821 Less: future finance charges 292 Present value of minimum lease payments 529 The present value of the future minimum lease payments was 488 and 529 for the year ended December 31, 2017 and 2016, respectively. The 2017 calculation is based on an average discount rate of 13.2% (13.1% in 2016) considering maturities from 1 to 14 years (from 1 to 15 years in 2016) including the renewal option when intended to be exercised. 5.3 Impairment of intangible assets, including goodwill, and tangible assets Impairment charges recognized, were as follows: Type of asset 2017 Year ended December 31, Goodwill Intangible assets Tangible assets ,753 Total ,764
128 128 Consolidated financial statements Impairment test of goodwill Goodwill is tested for impairment annually, as of October 31 or whenever changes in circumstances indicate that the carrying amount may not be recoverable, at the level of the groups of cash-generating units ( GCGU ) which correspond to the operating segments representing the lowest level at which goodwill is monitored for internal management purposes. Whenever the cash-generating units comprising the operating segments are tested for impairment at the same time as goodwill, the cashgenerating units are tested first and any impairment of the assets is recorded prior to the testing of goodwill. The recoverable amounts of the GCGUs are mainly determined based on their value in use. The value in use of each GCGU is determined by estimating future cash flows. The 2017 impairment test of goodwill did not include the GCGU corresponding to the Mining segment as goodwill allocated to this GCGU was fully impaired in The key assumptions for the value in use calculations are primarily the discount rates, growth rates, expected changes to average selling prices, shipments and direct costs during the period. Assumptions for average selling prices and shipments are based on historical experience and expectations of future changes in the market. In addition, with respect to raw material price assumptions, the Company applied a range of $57 /t to $67 /t for iron ore and $118 /t to$168 /t for coking coal. Cash flow forecasts adjusted for the risks specific to the tested assets are derived from the most recent financial plans approved by management for the next five years. Beyond the specifically forecasted period, the Company extrapolates cash flows for the remaining years based on an estimated growth rate of 2%. This rate does not exceed the average long-term growth rate for the relevant markets. Management estimates discount rates using pre-tax rates that reflect current market rates for investments of similar risk. The rate for each GCGU was estimated from the weighted average cost of capital of producers, which operate a portfolio of assets similar to those of the Company s assets. NAFTA Brazil Europe ACIS GCGU weighted average pre-tax discount rate used in 2017 (in %) GCGU weighted average pre-tax discount rate used in 2016 (in %) Once recognized, impairment losses for goodwill are not reversed. There was no impairment charge recognized with respect to goodwill following the Company s impairment test as of October 31, The total value in use calculated for all GCGUs increased overall in 2017 as compared to In validating the value in use determined for the GCGUs, the Company performed a sensitivity analysis of key assumptions used in the discounted cash-flow model (such as discount rates, average selling prices, shipments and terminal growth rate). The Company believes that reasonably possible changes in key assumptions could cause an impairment loss to be recognized in respect of ACIS and the Brazil segments. ACIS produces a combination of flat and long products. Its facilities are located in Asia, Africa and Commonwealth of Independent States. ACIS is significantly self-sufficient in raw materials. The Company believes that sales volumes, prices and discount rates are the key assumptions most sensitive to change. ACIS is also exposed to export markets and international steel prices which are volatile, reflecting the cyclical nature of the global steel industry, developments in particular steel consuming industries and macroeconomic trends of emerging markets, such as economic growth. Discount rates may be affected by changes in countries specific risks; such risk premium decreased in 2017 in the case of Ukraine due to improved political and market conditions. The ACIS value in use model anticipates a limited increase in sales volumes in 2018 compared to 2017 ( 13.1 million tonnes for the year ended December 31, 2017) and marginal improvements thereafter. Average selling prices in the model are expected to increase in 2018 due to higher international raw material prices and stabilize subsequently in line with such long-term prices. The Brazil segment produces a combination of flat and long products. Its facilities are mainly located in Brazil and Argentina. The Company believes that sales volumes, prices and discount rates are the key assumptions most sensitive to change. It is also exposed to export markets and international steel prices which are volatile, reflecting the cyclical nature of the global steel industry, developments in particular steel consuming industries and macroeconomic trends of emerging markets, such as economic growth. Discount rates may be affected by changes in countries specific risks, in particular in Brazil, whose economy starts however a turnaround with improved market conditions leading to higher steel prices and higher steel consumption, particularly in the automotive industry whereas some weakness remains in the construction business. The Brazil value in use model anticipates a marginal increase in sales volumes in 2018 compared to 2017 (10.8 tonnes for the year ended December 31, 2017), a slight decrease in 2019 and continuous improvements thereafter. Average selling prices in the model are expected to increase in 2018 following higher raw material prices and adjust to a stable but lower level subsequently.
129 Consolidated financial statements 129 The following changes in key assumptions in projected earnings in every year of initial five-year period and perpetuity, at the GCGU level, assuming unchanged values for the other assumptions, would cause the recoverable amount to equal respective carrying value as of the impairment test date (i.e.: October 31, 2017 and 2016) Excess of recoverable amount over carrying amount 2016 ACIS Brazil ACIS Brazil 272 1, Decrease in average selling price (change in %) Decrease in shipments (change in %) Increase in pre-tax discount rate (change in basis points) Impairment test of intangible assets cash-generating unit level. In certain instances, the cashgenerating unit is an integrated manufacturing facility which may also be an operating subsidiary. Further, a manufacturing facility may be operated in concert with another facility with neither facility generating cash flows that are largely independent from the cash flows of the other. In this instance, the two facilities are combined for purposes of testing for impairment. As of December 31, 2017, the Company determined it has 59 cash-generating units. In 2015, in connection with management s annual test for impairment of goodwill as of October 31, 2015, intangible assets were also tested for impairment at that date. Accordingly, ArcelorMittal recognized impairment charges of 94 and 63with respect to mining permits and concessions in ArcelorMittal Princeton in the United States and ArcelorMittal Liberia (Mining), respectively. Impairment test of property, plant and equipment An impairment loss, related to intangible assets other than goodwill and tangible assets recognized in prior years is reversed if, and only if, there has been a change in the estimates used to determine the asset s recoverable amount since the last impairment loss was recognized. However, the increased carrying amount of an asset due to a reversal of an impairment loss will not exceed the carrying amount that would have been determined (net of amortization or depreciation) had no impairment loss been recognized for the asset in prior years. A reversal of an impairment loss is recognized immediately as part of operating income in the consolidated statements of operations. At each reporting date, ArcelorMittal reviews the carrying amounts of its intangible assets (excluding goodwill) and tangible assets to determine whether there is any indication that the carrying amount of those assets may not be recoverable through continuing use. If any such indication exists, the recoverable amount of the asset (or cash generating unit) is reviewed in order to determine the amount of the impairment, if any. The recoverable amount is the higher of its net selling price (fair value reduced by selling costs) and its value in use. In estimating its value in use, the estimated future cash flows are discounted to their present value using a pre-tax discount rate that reflects current market assessments of the time value of money and the risks specific to the asset (or cash-generating unit). For an asset that does not generate cash inflows largely independent of those from other assets, the recoverable amount is determined for the cash-generating unit to which the asset belongs. The cashgenerating unit is the smallest identifiable group of assets corresponding to operating units that generate cash inflows. If the recoverable amount of an asset (or cash-generating unit) is estimated to be less than its carrying amount, an impairment loss is recognized. An impairment loss is recognized as an expense immediately as part of operating income in the consolidated statements of operations. Impairment charges relating to property, plant and equipment were as follows for the years ended December 31, 2017, 2016 and 2015: 2017 In 2017, the Company recognized a total impairment charge related to property, plant and equipment in AMSA (ACIS) amounting to 206. During the six months ended June 30, 2017, management performed a test for impairment relating to the Long Carbon cash-generating unit of ArcelorMittal South Africa as a result of a downward revision of cash flow projections. Accordingly, the Company recognized an impairment charge of 46 consisting of the following: In the case of permanently idled assets, the impairment is measured at the individual asset level. Otherwise, the Company s assets are measured for impairment at the Cash-Generating Unit Country Operating Segment Long Steel Products South Africa ACIS Impairment Recorded Pre-Tax Discount Rate 17.12% 2016 Pre-Tax Discount Rate 16.63% Carrying amount of property, plant and equipment as of June 30,
130 130 Consolidated financial statements In connection with management s annual test for impairment of goodwill, property, plant and equipment was also tested for impairment at that date. As of December 31, 2017, the Company concluded that the value in use of property, plant and equipment in AMSA was lower than its carrying amount Impairment Recorded in the context of the appreciation of the rand against U.S. dollar and the uncertainties about demand outlook. Accordingly, the Company recognized a total impairment charge of 160 consisting mainly of the following: 2017 Pre-Tax Discount Rate Country Operating Segment Vanderbijlpark facility South Africa ACIS % 14.97% 296 Long Steel Products South Africa ACIS % 15.22% Pre-Tax Discount Rate Carrying amount of property, plant and equipment as of December 31, 2017 Cash-Generating Unit Company concluded that the value in use of property, plant and equipment in AMSA was lower than its carrying amount following a revised competitive outlook. Accordingly, the Company recognized a total impairment charge of 156 consisting mainly of the following: In 2016, the Company recognized a total impairment charge of property, plant and equipment amounting to 205. This charge included 49 in connection with the sale of the ArcelorMittal Zaragoza facility in Spain (Europe segment) on September 30, 2016 (see note 2.3.1). In connection with management s annual test for impairment of goodwill as of October 31, 2016, property, plant and equipment was also tested for impairment at that date. The Cash-Generating Unit Country Operating Segment Vanderbijlpark facility South Africa ACIS Impairment Recorded 2015 In 2015, the Company recognized an impairment charge of property, plant and equipment amounting to 3,753. This charge included 335 relating to the idling for an indefinite time of the Sestao facility in Spain (Europe segment), 19 in connection with the closure of the Georgetown facility in the United States (NAFTA) and 27 related to the Vereeniging meltshop closure in South Africa (ACIS). Additionally, the Company recognized impairment charges of 231 and 18 in connection with the intended sale of the Long Carbon facilities (ArcelorMittal Laplace, Steelton and Vinton) in the United States (NAFTA) and the intended sale of certain activities of ArcelorMittal Downstream Solutions (Europe segment), respectively. In addition, the Company recorded impairment charges of 176, 276 and 45 relating to the ArcelorMittal Point Lisas facility currently idled in Trinidad and Tobago (Brazil 2016 Pre-Tax Discount Rate % 2015 Pre-Tax Discount Rate 14.71% Carrying amount of property, plant and equipment as of December 31, segment), Indiana Harbor East and West facilities in the United States (NAFTA) following deployment of asset optimization programs and other assets in Spain (Europe segment), respectively. In connection with management s annual test for impairment of goodwill as of October 31, 2015, property, plant and equipment was also tested for impairment at that date. Management concluded that the recoverable amount of certain of the Company s property, plant and equipment in the Mining segment was lower than their carrying amount due to a downward revision of cash flow projections primarily resulting from the expected persistence of a lower coking coal and iron ore price outlook. The Company also concluded that the value in use of property, plant and equipment of the Saldanha plant in AMSA was lower than its carrying amount following a revised competitive outlook. Accordingly, the Company recognized a total impairment charge of 2,617 consisting of the following:
131 Consolidated financial statements 131 Operating Segment Impairment Recorded 2015 Pre-Tax Discount Rate 2014 Pre-Tax Discount Rate Carrying amount of property, plant and equipment as of December 31, 2015 Cash-Generating Unit Country ArcelorMittal Liberia Liberia Mining 1, % 17.80% 25 ArcelorMittal Princeton United States Mining % 11.00% 4 Las Truchas Mines Mexico Mining % 12.26% ArcelorMittal Serra Azul Brazil Mining % 14.56% Volcan mine Mexico Mining % 9.42% Saldanha facility South Africa ACIS % 11.90% 64 Note 6: Financing and financial instruments 6.1 Financial assets and liabilities Financial assets and liabilities mainly comprise: gross debt (see note 6.1.2) cash and cash equivalents, restricted cash and reconciliations of cash flows (see note 6.1.3) net debt (see note 6.1.4) derivative financial instruments (see note 6.1.5) other non-derivative financial assets and liabilities (see note 6.1.6) Fair values versus carrying amounts The estimated fair values of certain financial instruments have been determined using available market information or other valuation methodologies that require judgment in interpreting market data and developing estimates. The following tables summarize assets and liabilities based on their categories
132 132 Consolidated financial statements December 31, 2017 Carrying amount in the consolidated statements of financial position Nonfinancial assets and liabilities 2, Loan and receivables Liabilities at amortized cost Fair value recognized in profit or loss Availablefor-sale assets Derivatives 2, ,863 3,863 17,986 17, ASSETS Current assets: Cash and cash equivalents Restricted cash Trade accounts receivable and other Inventories Prepaid expenses and other current assets 1,931 1, Assets held for sale Total current assets 26,745 19,435 7, Non-current assets: 5,737 5,737 Property, plant and equipment and biological assets 36,971 36, Investments in associates and joint ventures 5,084 5,084 Other investments 1,471 1,471 Deferred tax assets 7,055 7,055 Other assets 2, Total non-current assets 58,552 55, , Total assets 85,297 74,657 8, ,471 1,076 Short-term debt and current portion of long-term debt 2,785 2,785 Trade accounts payable and other 13,428 13,428 Goodwill and intangible assets LIABILITIES AND EQUITY Current liabilities: Short-term provisions Accrued expenses and other liabilities Income tax liabilities ,505 1,080 3, Liabilities held for sale Total current liabilities 21,410 1,756 19, ,143 10,143 Deferred tax liabilities 2,684 2,684 Deferred employee benefits 7,630 7,630 Long-term provisions 1,612 1,612 Non-current liabilities: Long-term debt, net of current portion Other long-term obligations Total non-current liabilities ,032 12,130 10, ,789 38,789 Equity: Equity attributable to the equity holders of the parent 2,066 2,066 Total equity 40,855 40,855 Total liabilities and equity 85,297 54,741 29, Non-controlling interests
133 Consolidated financial statements 133 December 31, 2016 ASSETS Current assets: Cash and cash equivalents Restricted cash Trade accounts receivable and other Inventories Prepaid expenses and other current assets Assets held for sale Total current assets Carrying amount in the consolidated statements of financial position Nonfinancial assets and liabilities Loan and receivables 2, Liabilities at amortized cost Fair value recognize d in profit or loss Availablefor-sale assets Derivatives 2, ,974 2,974 14,734 14,734 1, ,247 15,960 6, Non-current assets: 5,651 5,651 34,831 34, ,297 4, Deferred tax assets 5,837 5,837 Other assets 1, Total non-current assets 52,895 50, Total assets 75,142 66,935 6, ,885 1,885 11,633 11, , , Goodwill and intangible assets Property, plant and equipment and biological assets Investments in associates and joint ventures Other investments LIABILITIES AND EQUITY Current liabilities: Short-term debt and current portion of long-term debt Trade accounts payable and other Short-term provisions Accrued expenses and other liabilities Income tax liabilities Liabilities held for sale Total current liabilities 18,115 1,518 16, ,789 11,789 Deferred tax liabilities 2,529 2,529 Deferred employee benefits 8,297 8,297 Long-term provisions 1,521 1,518 3 Non-current liabilities: Long-term debt, net of current portion Other long-term obligations ,702 12,530 12, Equity attributable to the equity holders of the parent Non-controlling interests 30,135 30,135 2,190 2,190 Total equity 32,325 32,325 Total liabilities and equity 75,142 46,373 28, Total non-current liabilities Equity: The Company classifies the bases used to measure certain assets and liabilities at their fair value. Assets and liabilities carried or measured at fair value have been classified into three levels based upon a fair value hierarchy that reflects
134 134 Consolidated financial statements the significance of the inputs used in making the measurements. The levels are as follows: Level 1: Quoted prices in active markets for identical assets or liabilities that the entity can access at the measurement date; Level 2: Significant inputs other than within Level 1 that are observable for the asset or liability, either directly (i.e.: as prices) or indirectly (i.e.: derived from prices); Level 3: Inputs for the assets or liabilities that are not based on observable market data and require management assumptions or inputs from unobservable markets. The following tables summarize the bases used to measure certain assets and liabilities at their fair value. Level 1 Level 2 As of December 31, 2017 Level 3 Total Assets at fair value: Available-for-sale financial assets1 1,444 Derivative financial current assets Derivative financial non-current assets , ,520 Derivative financial current liabilities Derivative financial non-current liabilities Total liabilities at fair value Level 1 Level 2 Total assets at fair value 1,444 Liabilities at fair value: 1. The balance does not include equity investments of 27 carried at cost As of December 31, 2016 Level 3 Total Assets at fair value: Available-for-sale financial assets Derivative financial current assets ,326 Derivative financial current liabilities Derivative financial non-current liabilities Total liabilities at fair value Derivative financial non-current assets Total assets at fair value Liabilities at fair value: 1. The balance does not include equity investments of 32 carried at cost Available-for-sale financial assets classified as Level 1 refer to listed securities quoted in active markets. A quoted market price in an active market provides the most reliable evidence of fair value and is used without adjustment to measure fair value whenever available, with limited exceptions. The total fair value is either the price of the most recent trade at the time of the market close or the official close price as defined by the exchange on which the asset is most actively traded on the last trading day of the period, multiplied by the number of units held without consideration of transaction costs. The increase in available-for-sale financial assets in 2017 is mainly related to the increase in the share price of Erdemir. Derivative financial assets and liabilities classified as Level 2 refer to instruments to hedge fluctuations in interest rates, foreign exchange rates, raw materials (base metals), freight, energy and emission rights, see note for further information. Derivative financial assets and liabilities classified as Level 3 are described in note Gross debt Gross debt includes bank debt, debenture loans and finance lease obligations and is stated at amortized cost. However, loans that are hedged under a fair value hedge are remeasured for the changes in the fair value that are attributable to the risk that is being hedged.
135 Consolidated financial statements Short-term debt Short-term debt, including the current portion of long-term debt, consisted of the following: Short-term bank loans and other credit facilities including commercial paper 1 Current portion of long-term debt Lease obligations Total December 31, ,735 1, ,785 1,885 The weighted average interest rate on short-term borrowings outstanding was 3.1% and 2.7% as of December 31, 2017 and 2016, respectively. In 2014, ArcelorMittal entered into certain short-term committed bilateral credit facilities. The facilities were extended in 2015, 2016 and As of December 31, 2017, the facilities, totaling approximately 0.8 billion, remain fully available. On September 15, 2017, ArcelorMittal entered into a short-term borrowing with a financial institution for net proceeds of CAD 936 million (771) with repayment over several dates in 2017 and As of December 31, 2017, CAD 236 million (188) was outstanding. Commercial paper The Company has a commercial paper program enabling borrowings of up to 1 billion. As of December 31, 2017 and 2016, the outstanding amount was 1,125 and 392, respectively.
136 136 Consolidated financial statements Long-term debt Long-term debt is comprised of the following: December 31, Year of maturity Type of Interest 5.5 billion Revolving Credit Facility billion tranche billion Revolving Credit Facility billion tranche Fixed 500 million Unsecured Notes 2018 Fixed 400 million Unsecured Notes billion Unsecured Notes3 Interest rate Floating Floating 5.88% % Floating 1.70% Fixed 6.13% million Unsecured Notes 2019 Fixed 3.00% billion Unsecured Notes Fixed 10.60% Unsecured Notes 2020 Fixed 5.13% CHF 225 million Unsecured Notes 2020 Fixed 2.50% million Unsecured Notes 2020 Fixed 2.88% billion Unsecured Bonds 2020 Fixed 5.75% billion Unsecured Notes 2021 Fixed 6.00% million Unsecured Notes 2021 Fixed 3.00% million Unsecured Notes 2022 Fixed 3.13% billion Unsecured Notes Fixed 6.75% 655 1, million Unsecured Notes 2023 Fixed 0.95% Unsecured Notes 2025 Fixed 6.13% billion Unsecured Bonds Fixed 7.50% 1,092 1, billion Unsecured Notes Fixed 7.25% Other loans Fixed EIB loan Fixed Floating Floating Corporate 1.0 billion Unsecured Bonds ICO loan Other loans 1.25% % 1.16% 2.18% 0.01% % Total Corporate ,513 11,794 Other loans - Americas Fixed/Floating 0.00% % Other loans - Europe Fixed/Floating 0.00% % ,705 12,022 Total Less current portion of long-term debt Total long-term debt (excluding lease obligations) Long-term lease obligations6 Total long-term debt, net of current portion (976) (697) 9,729 11, ,143 11, Rates applicable to balances outstanding at December 31, 2017, including the effect of step-ups and step-downs following rating changes. For debt that has been redeemed in its entirety during 2017, the interest rates refer to the rates at repayment date. 2. Amount outstanding was repaid at the original maturity, November 17, Early redeemed on December 28, Early redeemed on April 3, Bonds or Notes partially repurchased on October 16, 2017, pursuant to cash tender offer. 6. Net of current portion of 74 and 65 in 2017 and in 2016, respectively. Corporate 5.5 billion Revolving Credit Facility On December 21, 2016, ArcelorMittal signed an agreement for a $5.5 billion revolving credit facility (the "Facility"). This Facility amends and restates the $6 billion revolving credit facility dated April 30, The amended agreement incorporates a first tranche of $2.3 billion maturing on December 21, 2019, and a second tranche of $3.2 billion maturing on December 21, 2021, restoring the Facility to the
137 Consolidated financial statements 137 original tenors of 3 years and 5 years. The Facility may be used for general corporate purposes. As of December 31, 2017, the $5.5 billion revolving credit facility was fully available. Bonds 371 of its U.S. dollar denominated 6.75% Notes due March 1, 2041 (the USD 2041 Notes ) for a total aggregate purchase price (including premiums and accrued interest) of 445. Following this purchase, 629 principal amount of the USD 2041 Notes remained outstanding. On December 28, 2017, ArcelorMittal redeemed 644 (the remaining outstanding balance) of its 1.5 billion 6.125% Notes due June 1, 2018 for a total aggregate purchase price including accrued interest and premium on early repayment of 658, which was financed with existing cash and liquidity. 383 of its U.S. dollar denominated 7.00% Notes due October 15, 2039 (the 2039 Notes ) for a total aggregate purchase price (including premiums and accrued interest) of 464. Following this purchase, 1,117 principal amount of the USD 2039 Notes remained outstanding. On December 4, 2017, ArcelorMittal issued 500 million (600) 0.95% Notes due January 17, 2023, under its wholesale Euro Medium Term Notes Program. On April 3, 2017, ArcelorMittal redeemed all of its outstanding 1.5 billion 9.85% Notes due June 1, 2019 for a total aggregate purchase price including accrued interest and premium on early repayment of 1,040, which was financed with existing cash and liquidity. On November 17, 2017, at maturity, ArcelorMittal repaid the 540 million (647) principal amount that remained outstanding, following the cash tender offers in April 2016, of its 1 billion 4.625% unsecured bonds. On October 16, 2017, pursuant to cash tender offers and financed with existing cash and liquidity, ArcelorMittal purchased: 441 of its U.S. dollar denominated 6.25% Notes due February 25, 2022 (the USD 2022 Notes ) for a total aggregate purchase price (including premiums and accrued interest) of 510. Following this purchase, 659 principal amount of the USD 2022 Notes remained outstanding. As a result of the above mentioned redemptions, net financing costs for the year ended December 31, 2017 included 389 of premiums and other fees. The margin applicable to ArcelorMittal s principal credit facilities ($5.5 billion revolving credit facility and certain other credit facilities) and the coupons on certain of its outstanding bonds are subject to adjustment in the event of a change in its long-term credit ratings. The following table provides details of the outstanding bonds on maturity, the original coupons and the current interest rates for the bonds impacted by changes in the long-term credit rating: Date of issuance Repayment date Original interest rate Current interest rate1 400 million Unsecured Notes Apr 9, 2015 Apr 9, 2018 Euribor 3M % Euribor 3M % 500 million Unsecured Notes Mar 29, 2012 Mar 29, % 5.75% 99.71% 750 million Unsecured Notes Mar 25, 2014 Mar 25, % 3.00% 99.65% Nominal value Issued at % Jun 1, 2015 Jun 1, % 5.13% % CHF 225 million Unsecured Notes Jul 3, 2015 Jul 3, % 2.50% % 600 million Unsecured Notes Jul 4, 2014 Jul 6, % 2.88% 99.18% 1.0 billion Unsecured Bonds Aug 5, 2010 Aug 5, % 5.75% 98.46% 1.5 billion Unsecured Notes Mar 7, 2011 Mar 1, % 6.00% 99.36% 500 million Unsecured Notes Apr 9, 2015 Apr 9, % 3.00% 99.55% 750 million Unsecured Notes Jan 14, 2015 Jan 14, % 3.13% 99.73% 1.1 billion Unsecured Notes Feb 28, 2012 Feb 25, % 6.75% 98.28% 500 million Unsecured Notes Dec 4, 2017 Jan 17, % 0.95% 99.38% 500 million Unsecured Notes Jun 1, 2015 Jun 1, % 6.13% % 1.0 billion Unsecured Bonds Oct 8, 2009 Oct 15, % 7.50% 95.20% 500 Unsecured Bonds Aug 5, 2010 Oct 15, % 7.50% % 1.0 billion Unsecured Notes Mar 7, 2011 Mar 1, % 7.25% 99.18% 500 million Unsecured Notes 1. Rates applicable at December 31, 2017.
138 138 Consolidated financial statements European Investment Bank ( EIB ) Loan On December 16, 2016, ArcelorMittal signed a 350 million finance contract with the European Investment Bank in order to finance European research, development and innovation projects over the period within the European Union, namely predominantly France, Belgium and Spain, but also in Czech Republic, Poland, Luxembourg and Romania. This operation benefits from a guarantee from the European Union under the European Fund for Strategic Investments. As of December 31, 2017, 350 million (420) was fully drawn. Instituto de Crédito Oficial ( ICO ) Loan The Company entered into an agreement with the ICO on April 9, 2010, for the financing of the Company investment plan in Spain for the period The last installment under this agreement was due on April 7, The outstanding amount at maturity was 7. The facility was repaid at maturity. Other loans Other loans relate to various debt with banks and public institutions. On October 9, 2017, ArcelorMittal completed the offering of 300 million (360) variable rate loan in the German Schuldschein market. The proceeds of the issuance were used to repay or prepay existing indebtedness. Americas 1 billion senior secured asset-based revolving credit facility ArcelorMittal. As of December 31, 2017, the facility is fully available. Other loans Other loans relate mainly to loans contracted by ArcelorMittal Brazil with different counterparties. Europe, Asia and Africa On December 21, 2017, ArcelorMittal Kryvyi Rih entered into a 175 loan agreement with the European Bank for Reconstruction and Development in order to support the upgrade of its production facilities, energy efficiency improvement and environmental impact reduction. The loan agreement also provides for an additional 175 in loan facilities which are currently uncommitted. As of December 31, 2017, the facility remains fully available. On May 25, 2017, ArcelorMittal South Africa signed a 4.5 billion South African rand revolving borrowing base finance facility maturing on May 25, Any borrowings under the facility are secured by certain eligible inventory and receivables, as well as certain other working capital and related assets of ArcelorMittal South Africa. The facility is used for general corporate purposes. The facility is not guaranteed by ArcelorMittal. As of December 31, 2017, 3.7 billion South African rand (298) was drawn. Other loans Other loans mainly relate to loans contracted by ArcelorMittal in Spain with different counterparties. Other Certain debt agreements of the Company or its subsidiaries contain certain restrictive covenants. Among other things, these covenants limit encumbrances on the assets of ArcelorMittal and its subsidiaries, the ability of ArcelorMittal s subsidiaries to incur debt and the ability of ArcelorMittal and its subsidiaries to dispose of assets in certain circumstances. Certain of these agreements also require compliance with a financial covenant. On May 23, 2016, ArcelorMittal USA LLC signed a 1 billion senior secured asset-based revolving credit facility maturing on May 23, Borrowings under the facility are secured by inventory and certain other working capital and related assets of ArcelorMittal USA and certain of its subsidiaries in the United States. The facility may be used for general corporate purposes. The facility is not guaranteed by As of December 31, 2017 the scheduled maturities of short-term debt, long-term debt and long-term lease obligations, including their current portion are as follows: Year of maturity Amount , , , , ,710 Subsequent years Total 3,333 12,928
139 Consolidated financial statements 139 The carrying amount and the estimated fair value of the Company s short and long-term debt is: Instruments payable bearing interest at fixed rates Instruments payable bearing interest at variable rates Total long-term debt, including current portion Short term bank loans and other credit facilities including commercial paper December 31, 2017 Carrying Estimated Amount Fair Value 9,862 11,084 December 31, 2016 Carrying Estimated Amount Fair Value 11,657 12,666 1,331 1, ,193 12,385 12,551 13,504 1,735 1,731 1,123 1,139 The following tables summarize the Company s bases used to measure its debt at fair value. Fair value measurement has been classified into three levels based upon a fair value hierarchy that reflects the significance of the inputs used in making the measurements. As of December 31, 2017 Carrying amount Fair Value Level 1 Level 2 Level 3 Total 11,084 Instruments payable bearing interest at fixed rates 9,862 9,946 1,138 Instruments payable bearing interest at variable rates 1, ,301 11,193 10,427 1,958 12,385 1,731 1,731 Total long-term debt, including current portion Short term bank loans and other credit facilities including commercial paper 1,735 As of December 31, 2016 Carrying amount Instruments payable bearing interest at fixed rates Instruments payable bearing interest at variable rates Total long-term debt, including current portion Short term bank loans and other credit facilities including commercial paper Instruments payable classified as Level 1 refer to the Company s listed bonds quoted in active markets. The total fair value is the official closing price as defined by the exchange on which the instrument is most actively traded on the last trading day of the period, multiplied by the number of units held without consideration of transaction costs. Instruments payable classified as Level 2 refer to all debt instruments not classified as Level 1. The fair value of the debt is based on estimated future cash flows converted into U.S. dollar at the forward rate and discounted using current U.S. dollar zero coupon rates and ArcelorMittal s credit spread quotations for the relevant maturities. There were no instruments payable classified as Level Cash and cash equivalents, restricted cash and reconciliations of cash flows Cash and cash equivalents consist of cash and short-term highly liquid investments that are readily convertible to cash with original maturities of three months or less at the time of 11,657 Fair Value Level 1 Level 2 Level 3 Total 11, , ,551 12,347 1,157 13,504 1,139 1,139 1,123 purchase and are carried at cost plus accrued interest, which approximates fair value. Significant cash or cash equivalent balances may be held from time to time at the Company s international operating subsidiaries, including in particular those in France and the United States, where the Company maintains cash management systems under which most of its cash and cash equivalents are centralized. Other subsidiaries which may hold significant cash balances, include those in Argentina, Brazil, Canada, Kazakhstan, Morocco, South Africa and Ukraine. Some of these operating subsidiaries have debt outstanding or are subject to acquisition agreements that impose restrictions on such operating subsidiaries ability to pay dividends, but such restrictions are not significant in the context of ArcelorMittal s overall liquidity. Repatriation of funds from operating subsidiaries may also be affected by tax and foreign exchange policies in place from time to time in the various countries where the Company operates, though none of these policies are currently significant in the context of ArcelorMittal s overall liquidity.
140 140 Consolidated financial statements Cash and cash equivalents consisted of the following: December 31, ,701 1,601 Term deposits Money market funds ,574 2,501 Cash at bank Total 1. Money market funds are highly liquid investments with a maturity of 3 months or less from the date of acquisition. Restricted cash represents cash and cash equivalents not readily available to the Company, mainly related to insurance deposits, cash accounts in connection with environmental obligations and true sale of receivables programs, as well as various other deposits or required balance obligations related to letters of credit and credit arrangements. Changes in restricted cash are included within other investing activities (net) in the consolidated statements of cash flows. Restricted cash of 212 as of December 31, 2017 included 112 relating to various environmental obligations and true sales of receivables programs in ArcelorMittal South Africa. Restricted cash as of December 31, 2017 and 2016 included 75 in connection with the mandatory convertible bonds (see note 10.2). Reconciliation of liabilities arising from financing activities The table below details changes in the Company's liabilities arising from financing activities, including both cash and non-cash changes. Liabilities arising from financing activities are those for which cash flows were, or future cash flows will be classified in the Company's consolidated statements of cash flows from financing activities. Short-term debt and current portion of longterm debt Long-term debt, net of current portion Balance as of December 31, 2016 (note 6.1.2) Proceeds from long-term debt 11,789 1,885 1,407 (2,691) Payments of long-term debt Amortized cost Unrealized foreign exchange effects Proceeds from short-term debt 1,859 Payments of short-term debt1 (2,164) (976) Current portion of long-term debt Other movements Balance as of December 31, 2017 (note 6.1.2) ,143 2,785 Cash payments by the Company for the reduction of the outstanding liability relating to a lease is classified under other financing activities in the Company's consolidated statements of cash flows Net debt The Company monitors its net debt in order to manage its capital. The following table presents the structure of the Company s net debt by original currency at December 31, 2017: Short-term debt and current portion of long-term debt Long-term debt, net of current portion Total USD 2,785 EUR USD CHF ZAR 1, ,143 4,831 5, Cash and cash equivalents including restricted cash (2,786) Net debt 10,142 (724) 5,982 (1,387) 3,948 (1) 229 December 31, 2017 Other CAD (in USD) (249) (17) (408) (251)
141 Consolidated financial statements Derivative financial instruments The Company uses derivative financial instruments principally to manage its exposure to fluctuations in interest rates, exchange rates, prices of raw materials, energy and emission rights allowances arising from operating, financing and investing activities. Derivative financial instruments are classified as current or non-current assets or liabilities based on their maturity dates and are accounted for at the trade date. Embedded derivatives are separated from the host contract and accounted for separately if they are not closely related to the host contract. The Company measures all derivative financial instruments based on fair values derived from market prices of the instruments or from option pricing models, as appropriate. Gains or losses arising from changes in fair value of derivatives are recognized in the consolidated statements of operations, except for derivatives that are highly effective and qualify for cash flow or net investment hedge accounting. Changes in the fair value of a derivative that is highly effective and that is designated and qualifies as a cash flow hedge are recorded in other comprehensive income. Amounts deferred in equity are recorded in the consolidated statements of operations in the periods when the hedged item is recognized in the consolidated statements of operations and within the same line item (see note 6.3 Cash flow hedges). The Company formally assesses, both at the hedge s inception and on an ongoing basis, whether the derivatives that are used in hedging transactions are highly effective in offsetting changes in fair values or cash flows of hedged items. When a hedging instrument is sold, terminated, expired or exercised, the accumulated unrealized gain or loss on the hedging instrument is maintained in equity until the forecasted transaction occurs. If the hedged transaction is no longer probable, the cumulative unrealized gain or loss, which had been recognized in equity, is reported immediately in the consolidated statements of operations. Foreign currency differences arising on the translation of a financial liability designated as a hedge of a net investment in a foreign operation are recognized directly as a separate component of equity, to the extent that the hedge is effective. To the extent that the hedge is ineffective, such differences are recognized in the consolidated statements of operations (see note 6.3 Net investment hedge). The Company manages the counter-party risk associated with its instruments by centralizing its commitments and by applying procedures which specify, for each type of transaction and underlying position, risk limits and/or the characteristics of the counter-party. The Company does not generally grant to or require guarantees from its counterparties for the risks incurred. Allowing for exceptions, the Company s counterparties are part of its financial partners and the related market transactions are governed by framework agreements (mainly International Swaps and Derivatives Association agreements which allow netting only in case of counterparty default). Accordingly, derivative assets and derivative liabilities are not offset.
142 142 Consolidated financial statements Derivative financial instruments classified as Level 2: The following tables summarize this portfolio: Interest rate swaps - fixed rate borrowings/loans Notional Amount 6 Fair Value Assets Average Rate1 0.98% Notional Amount 6 December 31, 2017 Liabilities Fair Average Value Rate1 1.01% Foreign exchange rate instruments Forward purchase contracts ,939 (140) Forward sale contracts (11) Currency swaps purchases 9 (7) Currency swaps sales 1,000 (157) Exchange option purchases 338 (7) Exchange options sales 319 Total foreign exchange rate instruments (5) 25 (327) Raw materials (base metals), freight, energy, emission rights Term contracts sales Term contracts purchases Options sales/purchases (38) (40) 1 9 Total raw materials (base metals), freight, energy, emission rights 67 (78) Total 92 (405) 1. The average rate is determined for fixed rate instruments on basis of the U.S. dollar and foreign currency rates and for variable rate instruments generally on the basis of Euribor or Libor. Notional Amount Assets Fair Value December 31, 2016 Liabilities Notional Amount Fair Value Foreign exchange rate instruments 3, (21) Forward sale contracts (26) Currency swaps purchases (33) Currency swaps sales (24) Exchange option purchases Exchange options sales Forward purchase contracts 175 Total foreign exchange rate instruments (104) Raw materials (base metals), freight, energy, emission rights Term contracts sales (36) Term contracts purchases (123) 6 Option sales/purchases Total raw materials (base metals), freight, energy, emission rights Total Derivative financial assets and liabilities classified as Level 2 refer to instruments to hedge fluctuations in interest rates, foreign exchange rates, raw materials (base metals), freight, energy and emission rights. The total fair value is based on the price a dealer would pay or receive for the security or similar securities, adjusted for any terms specific to that asset or liability. Market inputs are obtained from wellestablished and recognized vendors of market data and the fair value is calculated using standard industry models based on significant observable market inputs such as 6 82 (159) 257 (263) foreign exchange rates, commodity prices, swap rates and interest rates. Derivative financial instruments classified as Level 3: Derivative financial non-current assets classified as Level 3 refer to the call option on the 1,000 mandatory convertible bonds (see note 10.2). The fair valuation of Level 3 derivative instruments is established at each reporting date and compared to the prior period. ArcelorMittal s valuation policies for Level 3 derivatives are an integral part of its
143 Consolidated financial statements 143 internal control procedures and have been reviewed and approved according to the Company s principles for establishing such procedures. In particular, such procedures address the accuracy and reliability of input data, the accuracy of the valuation model and the knowledge of the staff performing the valuations. ArcelorMittal establishes the fair valuation of the call option on the 1,000 mandatory convertible bonds through the use of binomial valuation models based on the estimated values of the underlying equity spot price of $299 and volatility of 12.65%. Binomial valuation models use an iterative procedure to price options, allowing for the specification of nodes, or points in time, during the time span between the valuation date and the option s expiration date. In contrast to the Black-Scholes model, which provides a numerical result based on inputs, the binomial model allows for the calculation of the asset and the option for multiple periods along with the range of possible results for each period. Observable input data used in the valuations include zero coupon yield curves, stock market prices, European Central Bank foreign exchange fixing rates and Libor interest rates. Unobservable inputs are used to measure fair value to the extent that relevant observable inputs are not available. Specifically the Company computes unobservable volatility data based mainly on the movement of stock market prices observable in the active market over 90 working days. Derivative financial liabilities classified as Level 3 relate to a pellet purchase agreement that contains a special payment that varies according to the price of steel in the United States domestic market ( domestic steel price ). The Company concluded that this payment feature was an embedded derivative not closely related to the host contract. ArcelorMittal establishes the fair valuation of the special payment by comparing the current forecasted domestic steel price to the projected domestic steel price at the inception of the contract. Observable input data includes third-party forecasted domestic steel prices. Unobservable inputs are used to measure fair value to the extent that relevant observable inputs are not available or not consistent with the Company s views on future prices and refer specifically to domestic steel prices beyond the timeframe of available third-party forecasts. The following table summarizes the reconciliation of the fair value of the conversion option classified as Level 3 with respect to the call option on the 1,000 mandatory convertible bonds and the fair value of the special payment included in the pellet purchase agreement: Balance as of December 31, 2015 Call option on 1,000 mandatory convertible bonds Special payment in pellet purchase agreement Total 4 4 Change in fair value 171 (33) 138 Balance as of December 31, (33) 142 Change in fair value 809 (231) 578 Balance as of December 31, (264) 720 The fair value movement on Level 3 derivative instruments is recorded in the consolidated statements of operations. The increase in the fair value of the call option on 1,000 mandatory convertible bonds is due to an increase in the share price of Erdemir and China Oriental, which impacts the value of the notes in which Hera Ermac, a wholly-owned subsidiary, invested the bonds proceeds (see note 10.2) Other non-derivative financial assets and liabilities Other non-derivative financial assets and liabilities include cash and cash equivalents and restricted cash (see note 6.1.3), trade and certain other receivables (see note 4.3, 4.5 and 4.6), investments in available-for-sale equity securities (see note 2.5), trade payables and certain other liabilities (see notes 4.7 and 4.8). These instruments are recognized initially at fair value when the Company becomes a party to the contractual provisions of the instrument. Non-derivative financial assets are derecognized if the Company s contractual rights to the cash flows from the financial instruments expire or if the Company transfers the financial instruments to another party without retaining control of substantially all risks and rewards of the instruments. Nonderivative financial liabilities are derecognized when they are extinguished (i.e. when the obligation specified in the contract is discharged, cancelled or expired). Impairment of financial assets A financial asset is considered to be impaired if objective evidence indicates that one or more events have had a negative effect on the estimated future cash flows of that asset. Estimated future cash flows are determined using various assumptions and techniques, including comparisons to published prices in an active market and discounted cash flow projections using projected growth rates, weighted average cost of capital, and inflation rates. In the case of available-for-sale securities, the Company reviews the available-for-sale investments at the end of
144 144 Consolidated financial statements each reporting period to assess whether there is any objective evidence of impairment. A significant or prolonged decline in the fair value of an available-for-sale investment below its cost is objective evidence of impairment. The Company considers a prolonged decline in fair value to occur when the market value remains continuously below the cost for more than two years. If any such evidence exists for available-for-sale financial assets, the cumulative loss measured as the difference between the acquisition cost and the current fair value less any impairment loss on that financial asset previously recognized in the consolidated statements of operations is removed from equity and recognized in the consolidated statements of operations. Once an impairment loss is recognized for an investment, any increases in fair value are recorded in other comprehensive income while decreases in fair value are recorded in the consolidated statements of operations. 6.2 Financial assets are tested for impairment annually or whenever changes in circumstances indicate that the carrying amount may not be recoverable. If objective evidence indicates that cost-method investments need to be tested for impairment, calculations are based on information derived from business plans and other information available for estimating their value in use. Any impairment loss is recognized in the consolidated statements of operations. An impairment loss related to financial assets is reversed if and to the extent there has been a change in the estimates used to determine the recoverable amount. The loss is reversed only to the extent that the asset s carrying amount does not exceed the carrying amount that would have been determined if no impairment loss had been recognized. Reversals of impairment are recognized in net income except for reversals of impairment of available-for-sale equity securities, which are recognized in equity. Financing costs - net Financing costs - net recognized in the years ended December 31, 2017, 2016 and 2015 are as follows: 2017 Year ended December 31, Interest expense (879) (1,172) Interest income (108) (353) (435) (399) (3) (697) Change in fair value adjustment on call option on mandatory convertible bonds and pellet purchase agreement (note 6.1.5) Accretion of defined benefit obligations and other long term liabilities Net foreign exchange result 546 (1,383) Other 1 (823) (642) (376) Total (875) (2,056) (2,858) 1. Other mainly includes expenses related to true sale of receivables ( TSR ) programs and bank fees. It also includes premiums and fees of 389 relating to the bonds early redeemed in 2017 (399 of premiums and fees relating to bonds early redeemed in 2016). In 2017 and in 2015, other also includes expenses relating to the extension of the mandatory convertible bonds (see note 10.2) of 92 and 79, respectively. 6.3 Risk management policy The Company's operations expose it to a variety of financial risks: interest rate risk, foreign exchange risk, liquidity risk and risks in fluctuations in prices of raw materials, freight and energy. The Company actively monitors and seeks to reduce volatility of these exposures through a diversity of financial instruments, where considered appropriate. The Company has formalized how it manages these risks within the Treasury and Financial Risk Management Policy, which has been approved by Management. Capital management The Company's objective when managing capital are to safeguard continuity, maintain a strong credit rating and healthy capital ratios to support its business and provide adequate return to shareholders through continuing growth. The Company sets the amount of capital required on the basis of annual business and long-term operating plans which include capital and other strategic investments. The funding requirement is met through a combination of equity, bonds and other long-term and short-term borrowings. The Company monitors capital using a gearing ratio, being the ratio of net debt as a percentage of total equity. December 31, Total equity 40,855 32,325 Net debt 10,142 11,059 Gearing 24.8% 34.2%
145 Consolidated financial statements 145 Interest rate risk The Company is exposed to interest rate risk on short-term and long-term floating rate instruments and on refinancing of fixed rate debt. The Company's policy is to maintain a balance of fixed and floating interest rate borrowings, which is adjusted depending on the prevailing market interest rates and outlook. As at December 31, 2017, the long-term debt was comprised of 88% fixed rate debt and 12% variable rate debt (note 6.1.2). The Company utilizes certain instruments to manage interest rate risks. Interest rate instruments allow the Company to borrow long-term at fixed or variable rates, and to swap the rate of this debt either at inception or during the lifetime of the borrowing. The Company and its counterparties exchange, at predefined intervals, the difference between the agreed fixed rate and the variable rate, calculated on the basis of the notional amount of the swap. Similarly, swaps may be used for the exchange of variable rates against other variable rates. Foreign exchange rate risk The Company is exposed to changes in values arising from foreign exchange rate fluctuations generated by its operating activities. Because a substantial portion of ArcelorMittal s assets, liabilities, sales and earnings are denominated in currencies other than the U.S. dollar (its reporting currency), ArcelorMittal has an exposure to fluctuations and depreciation in the values of these currencies relative to the U.S. dollar. These currency fluctuations, especially the fluctuation of the value of the U.S. dollar relative to the euro, the Canadian dollar, Brazilian real, Polish Zloty, Kazakh tenge, South African rand and Ukrainian hryvnia, as well as fluctuations in the other countries currencies in which ArcelorMittal has significant operations and/or sales, could have a material impact on its financial position, cash flows and results of operations. ArcelorMittal faces transaction risk, where its businesses generate sales in one currency but incur costs relating to that revenue in a different currency. For example, ArcelorMittal s non-u.s. subsidiaries may purchase raw materials, including iron ore and coking coal, in U.S. dollars, but may sell finished steel products in other currencies. Consequently, an appreciation of the U.S. dollar will increase the cost of raw materials; thereby having a negative impact on the Company s operating margins, unless the Company is able to pass along the higher cost in the form of higher selling prices. Following its Treasury and Financial Risk Management Policy, the Company hedges a portion of its net exposure to foreign exchange rates through forwards, options and swaps. ArcelorMittal also faces foreign currency translation risk, which arises when ArcelorMittal translates the statements of operations of its subsidiaries, its corporate net debt (note 6.1.4) and other items denominated in currencies other than the U.S. dollar, for inclusion in the consolidated financial statements. The Company manages translation risk arising from its investments in subsidiaries by monitoring the currency mix of the consolidated statements of financial position. The Company may enter into derivative transactions to hedge the residual exposure, and currently designated an EUR/USD cross currency swaps with a notional of 1,000 to hedge euro denominated net investments in foreign operations (see Net investment hedge ). The Company also uses the derivative instruments, described above, at the corporate level to hedge debt recorded in foreign currency other than the functional currency or the balance sheet risk associated with certain monetary assets denominated in a foreign currency other than the functional currency. Liquidity Risk Liquidity risk is the risk that the Company may encounter difficulties in meeting its obligations associated with financial liabilities that are settled by delivering cash. ArcelorMittal Treasury is responsible for the Company's funding and liquidity management. ArcelorMittal s principal sources of liquidity are cash generated from its operations, its credit lines at the corporate level and various working capital credit lines at the level of its operating subsidiaries. The Company actively manages its liquidity. Following the Company's Treasury and Financial Risk Management Policy, the levels of cash, credit lines and debt are closely monitored and appropriate actions are taken in order to comply with the covenant ratios, leverage, fixed/floating ratios, maturity profile and currency mix. The contractual maturities of the below financial liabilities include estimated loan repayments, interest payments and settlement of derivatives, excluding any impact of netting agreements. The cash flows are calculated based on market data as of December 31, 2017, and as such are sensitive to movements in mainly forex exchange rates and interest rates. The cash flows are non-discounted, except for derivative financial liabilities where the cash flows equal their fair values.
146 146 Consolidated financial statements Carrying amount Contractual Cash Flow December 31, 2017 from 2020 to After Non-derivative financial liabilities Bonds (9,458) (13,514) (1,309) (1,306) (5,658) (5,241) Loans over 100 (1,371) (1,546) (549) (118) (676) (203) (13,428) (13,448) (13,448) Trade and other payables (2,099) (2,232) (1,444) (263) (258) (267) (26,356) (30,740) (16,750) (1,687) (6,592) (5,711) Foreign exchange contracts (327) (327) (170) (64) (93) Other commodities contracts1 (342) (342) (156) (37) (68) (81) Total (669) (669) (326) (37) (132) (174) Other loans Total Derivative financial liabilities 1. Commodity contracts include base metals, freight, energy and emission rights. Carrying amount Contractual Cash Flow December 31, 2016 from 2019 to After (1,261) (2,076) (6,093) (8,798) (57) (172) (98) Non-derivative financial liabilities Bonds (11,597) (18,228) (694) (873) (546) (11,633) (11,647) (11,647) (1,383) (1,523) (856) (124) (370) (173) (25,307) (32,271) (14,310) (2,257) (6,635) (9,069) Foreign exchange contracts (104) (104) (73) (7) (24) Other commodities contracts1 (192) (192) (153) (5) (1) (33) Total (296) (296) (226) (12) (1) (57) Loans over 100 Trade and other payables Other loans Total Derivative financial liabilities 1. Commodity contracts include base metals, freight, energy and emission rights. Cash flow hedges The following tables present the periods in which the derivatives designated as cash flows hedges are expected to mature: December 31, 2017 Assets/ (liabilities) Fair value Foreign exchange contracts Commodities Emission rights Total (118) 20 (Outflows)/inflows 3 months and less (83) months 2019 After 2019 (25) 6-12 months (10) (37) (37) (135) (74) (21) (41) 1 December 31, 2016 Assets/ (liabilities) 87 3 months and less (104) (104) (80) 5 Fair value Foreign exchange contracts Commodities Emission rights Total (Outflows)/inflows months 6-12 months 2018 After Associated gains or losses that were recognized in other comprehensive income are reclassified from equity to the consolidated statements of operations in the same period during which the hedged forecasted cash flow affects the consolidated statements of operations. The following table presents the periods in which the realized and unrealized gains or losses on derivatives
147 Consolidated financial statements 147 designated as cash flows hedges recognized in other comprehensive income, net of tax, are expected to impact the consolidated statements of operations: December 31, 2017 Assets/ (liabilities) Carrying amount (141) Foreign exchange contracts (Expense)/income 3 months and less (95) 3-6 months 2019 After 2019 (26) 6-12 months (20) Commodity contracts Emission rights (38) (86) (22) (8) Total December 31, 2016 Assets/ (liabilities) Carrying amount 54 3 months and less months 6-12 months 2018 After Commodity contracts Emission rights 22 (1) 1 22 Total Foreign exchange contracts (Expense)/income Net investment hedge In December 2014, the Company entered into EUR/USD cross currency swaps ( CCS ) to hedge an euro denominated net investment in foreign operations amounting to 303 million, and designated them as a net investment hedge. The EUR/USD CCS with a notional of 375 were unwound on January 14, A deferred gain of 83, net of a deferred tax expense of 24, will be recycled to the consolidated statements of operations when the hedged assets are disposed of. On May 27, 2015, the Company entered into additional EUR/USD CCS with a notional of 1,000 to hedge an euro denominated net investment in foreign operations amounting to 918 million, and designated them as a net investment hedge. As of December 31, 2017 and 2016, the EUR/USD CCS have a fair value loss of 157, net of a deferred tax of 44, and a fair value loss of 21, net of a deferred tax of 6, respectively. Fair value movements have been recorded in the consolidated statements of other comprehensive income. The fair value of the net investment hedge is included in other long-term obligations in the consolidated statements of financial position. The CCS is categorized as Level 2. Net investment hedges are as follows: December 31, 2017 Derivatives Fair value at December 31, 2016 Date traded CCS 5Y 500 May 27, (67) (64) CCS 10Y 300 May 27, 2015 (14) (42) (56) CCS 10Y 160 May 27, 2015 (8) (22) (30) 40 May 27, 2015 CCS 10Y Total 1. 1,000 Change in fair value Fair value as of December 31, Notional amount (2) (5) (7) (21) (136) (157) The net investment hedges were fully effective. As such, the change in fair value is entirely recorded in other comprehensive income.
148 148 Consolidated financial statements December 31, 2016 Derivatives Notional amount Date traded Fair value at December 31, 2015 Change in fair value Fair value as of December 31, CCS 30Y 250 December 3, (56) CCS 30Y 125 December 12, (29) CCS 5Y 500 May 27, 2015 (7) 10 3 CCS 10Y 300 May 27, 2015 (10) (4) (14) CCS 10Y 160 May 27, 2015 (6) (2) (8) CCS 10Y 40 May 27, 2015 (1) (1) (2) 61 (82) (21) Total 1. 1,375 The net investment hedges were fully effective. As such, the change in fair value is entirely recorded in other comprehensive income. Raw materials, freight, energy risks and emission rights The Company is exposed to risks in fluctuations in prices of raw materials (including base metals such as zinc, nickel, aluminum, tin, copper and iron ore), freight and energy, both through the purchase of raw materials and through sales contracts. The Company uses financial instruments such as forward purchases or sales, options and swaps in order to manage the volatility of prices of certain raw materials, freight and energy. Fair values of raw material, freight, energy and emission rights instruments categorized as Level 2 are as follows: December 31, Base metals Freight Energy (oil, gas, electricity) (1) Emission rights (37) (104) Total (11) (77) Derivative assets associated with raw materials, energy, freight and emission rights Derivative liabilities associated with raw materials, energy, freight and emission rights Total (78) (159) (11) (77) ArcelorMittal consumes large amounts of raw materials (the prices of which are related to the London Metals Exchange price index, the Steel Index and Platts Index), ocean freight (the price of which is related to a Baltic Exchange Index), and energy (the prices of which are mainly related to the New York Mercantile Exchange energy index (NYMEX), the European Energy Exchange (EEX) power indexes, the powernext gas indexes). As a general matter, ArcelorMittal is exposed to price volatility with respect to its purchases in the spot market and under its long-term supply contracts. In accordance with its risk management policy, ArcelorMittal hedges a part of its exposure related to raw materials procurements. Emission rights Pursuant to the application of the European Directive 2003/87/EC of October 13, 2003, as amended by the European Directive 2009/29/EC of April 23, 2009, establishing a scheme for emission allowance trading, the Company enters into certain types of derivatives (mainly forward transactions and options) in order to implement its management policy for associated risks. As of December 31, 2017 and 2016, the Company had a net notional position of 484 with a net negative fair value of 37 and a net notional position of 420 with a net negative fair value of 104, respectively. Credit risk The Company s treasury department monitors various market data regarding the credit standings and overall reliability of the financial institutions for all countries where the Company s subsidiaries operate. The choice of the financial institution for the financial transactions must be approved by the treasury department. Credit risk related to customers, customer credit terms and receivables are discussed in note 4.3.
149 Consolidated financial statements 149 Sensitivity analysis Foreign currency sensitivity The following tables detail the Company s derivative financial instruments sensitivity to a 10% strengthening and a 10% weakening in the U.S. dollar against the euro. A positive number indicates an increase in profit or loss and other equity, where a negative number indicates a decrease in profit or loss and other equity. The sensitivity analysis includes the Company s complete portfolio of foreign currency derivatives outstanding. The impact on the non /$ derivatives reflects the estimated move of such currency pairs, when the U.S. dollar appreciates or depreciates 10% against the euro, based on computations of correlations in the foreign exchange markets in 2017 and Income 10% strengthening in U.S. dollar December 31, 2017 Other Equity (24) (511) 10% weakening in U.S. dollar Income 10% strengthening in U.S. dollar December 31, 2016 Other Equity (3) (375) 10% weakening in U.S. dollar Cash flow sensitivity analysis for variable rate instruments The following tables detail the Company s variable interest rate instruments sensitivity. A change of 100 basis points ( bp ) in interest rates during the period would have increased (decreased) profit or loss by the amounts presented below. This analysis assumes that all other variables, in particular foreign currency rates, remain constant. December 31, 2017 Floating porting of net debt1 Interest Rate Swaps/ Forward Rate Agreements 100 bp increase bp decrease (11) December 31, 2016 Floating porting of net debt1 Interest Rate Swaps/ Forward Rate Agreements 100 bp increase bp decrease (11) 1. Please refer to note for a description of net debt (including fixed and floating portion) Base metals, energy, freight, emissions rights The following tables detail the Company s sensitivity to a 10% increase and decrease in the price of the relevant base metals, energy, freight and emissions rights. The sensitivity analysis includes only outstanding, un-matured derivative instruments either held for trading at fair value through the consolidated statements of operations or designated in hedge accounting relationships.
150 150 Consolidated financial statements December 31, 2017 Income Other Equity Cash Flow Hedging Reserves % in prices Base Metals Iron Ore Emission rights 45 1 Base Metals (4) (30) Iron Ore Emission rights (45) Energy (1) Energy -10% in prices December 31, 2016 Income Other Equity Cash Flow Hedging Reserves % in prices Base Metals Iron Ore (10) 1 Emission rights 32 Energy (8) 1 Base Metals (3) (18) Iron Ore 10 (1) Emission rights (32) 8 (1) -10% in prices Energy Note 7: Personnel expenses and deferred employee benefits 7.1 Employees and key management personnel As of December 31, 2017, 2016 and 2015, ArcelorMittal had approximately 197,000, 199,000 and 209,000 employees, respectively, and the total annual compensation of ArcelorMittal s employees in 2017, 2016 and 2015 was as follows: Year Ended December 31, Employee Information Wages and salaries 7,912 7,675 8, Pension cost (see note 7.2) Gain following new labor agreement in the U.S. (see note 7.2) 265 (832) Other staff expenses 1,791 1,591 1,695 Total 9,968 8,558 10,324 As of January 1, 2016, the Group Management Board ( GMB ), ArcelorMittal s former senior management, was replaced by the CEO Office supported by six other Executive officers. ArcelorMittal s CEO Office is comprised by the CEO, Mr. Lakshmi N. Mittal and the CFO, Mr. Aditya Mittal. Together, the Executive officers are responsible for the implementation of the Company strategy, overall management of the business and all operational decisions. The key management personnel compensation for 2017 and 2016 reflects this new structure.
151 Consolidated financial statements 151 The total annual compensation of ArcelorMittal s key management personnel (as described above for 2017 and 2016), including its Board of Directors, expensed in 2017, 2016 and 2015 was as follows: Year Ended December 31, Base salary and directors fees Short-term performance-related bonus Post-employment benefits 1 1 Share based compensation The fair value of the stock options granted and shares allocated based on Restricted Share Unit ( RSU ) and Preference Share Unit ( PSU ) plans to the ArcelorMittal s key management personnel is recorded as an expense in the consolidated statements of operations over the relevant vesting periods. As of December 31, 2017, 2016 and 2015, ArcelorMittal did not have any outstanding loans or advances to members of its Board of Directors or key management personnel, and, as of December 31, 2017, 2016 and 2015, ArcelorMittal had not given any guarantees for the benefit of any member of its Board of Directors or key management personnel. 7.2 Deferred employee benefits ArcelorMittal s operating subsidiaries sponsor different types of pension plans for their employees. Also, some of the operating subsidiaries offer other post-employment benefits, that are principally post-retirement healthcare plans. These benefits are broken down into defined contribution plans and defined benefit plans. Defined contribution plans are those plans where ArcelorMittal pays fixed or determinable contributions to external life insurance or other funds for certain categories of employees. Contributions are paid in return for services rendered by the employees during the period. Contributions are expensed as incurred consistent with the recognition of wages and salaries. No provisions are established with respect to defined contribution plans as they do not generate future commitments for ArcelorMittal. Defined benefit plans are those plans that provide guaranteed benefits to certain categories of employees, either by way of contractual obligations or through a collective agreement. For defined benefit plans, the cost of providing benefits is determined using the projected unit credit method, with actuarial valuations being carried out each fiscal year. The retirement benefit obligation recognized in the consolidated statements of financial position represents the present value of the defined benefit obligation less the fair value of plan assets. The present value of the defined benefit obligation is determined by discounting the estimated future cash outflows using interest rates of high quality corporate bonds that are denominated in the currency in which the benefits will be paid, and that have terms to maturity approximating to the terms of the related pension obligation. In countries where there is no deep market in such bonds, the market rates on government bonds are used. Remeasurement arising from experience adjustments and changes in actuarial assumptions are charged or credited to other comprehensive income in the period in which they arise. Any asset resulting from this calculation is limited to the present value of available refunds and reductions in future contributions to the plan. Current service cost, which is the increase of the present value of the defined benefit obligation resulting from the employee service in the current period, is recorded as an expense as part of cost of sales and selling, general and administrative expenses in the consolidated statements of operations. The net interest cost, which is the change during the period in the net defined benefit liability or asset that arises from the passage of time, is recognized as part of financing costs net in the consolidated statements of operations. The Company recognizes gains and losses on the settlement of a defined benefit plan when the settlement occurs. The gain or loss on settlement comprises any resulting change in the fair value of plan assets and any change in the present value of the defined benefit obligation. Past service cost is the change in the present value of the defined benefit obligation resulting from a plan amendment or a curtailment. Past service cost is recognized immediately in the consolidated statements of operations in the period in which it arises. Voluntary retirement plans primarily correspond to the practical implementation of social plans or are linked to collective agreements signed with certain categories of employees. Early retirement plans are those plans that primarily correspond to terminating an employee s contract before the normal retirement date. Liabilities for early retirement plans are recognized when the affected employees have formally been informed and when amounts owed have been determined using an appropriate actuarial calculation. Liabilities relating to the early retirement plans are calculated annually on the basis of the number of employees likely to take early retirement and are discounted using an interest rate which corresponds to that of high
152 152 Consolidated financial statements quality bonds that have maturity dates similar to the terms of the Company s early retirement obligations. Termination benefits are provided in connection with voluntary separation plans. The Company recognizes a liability and expense when it can no longer withdraw the offer or, if earlier, when it has a detailed formal plan which has been communicated to employees or their representatives. Discount rates The discount rate is based on several high quality corporate bond indexes and yield curves in the appropriate jurisdictions (rated AA or higher by a recognized rating agency). In countries where there is no deep market in such bonds, the market rates on government bonds are used. Nominal interest rates vary worldwide due to exchange rates and local inflation rates. Other long-term employee benefits include various plans that depend on the length of service, such as long service and sabbatical awards, disability benefits and long-term compensated absences such as sick leave. The amount recognized as a liability is the present value of benefit obligations at the consolidated statements of financial position date, and all changes in the provision (including actuarial gains and losses or past service costs) are recognized in the consolidated statements of operations in the period in which they arise. Rate of compensation increase The rate of compensation increase reflects actual experience and the Company s long-term outlook, including contractually agreed upon wage rate increases for represented hourly employees. The expense associated with the above pension plans and post-employment benefits, as well as the carrying amount of the related liability/asset on the consolidated statements of financial position are based on a number of assumptions and factors such as discount rates, expected rate of compensation increase, healthcare cost trend rates, mortality rates and retirement rates. Healthcare cost trend rate The healthcare cost trend rate is based on historical retiree cost data, near-term healthcare outlook, including appropriate cost control measures implemented by the Company, and industry benchmarks and surveys. Mortality and retirement rates Mortality and retirement rates are based on actual and projected plan experience. Statements of Financial Position Total deferred employee benefits including pension or other post-employment benefits, are as follows: December 31, Pension plan benefits 3,067 3,061 Other post-employment benefits 4,140 4,801 Early retirement benefits Defined benefit liabilities 7,487 8, ,630 8,297 Termination benefits Total The early retirement benefits and termination benefits are mainly related to European countries (Belgium, Spain, Germany and Luxembourg). Pension plans A summary of the significant defined benefit pension plans is as follows: U.S. ArcelorMittal USA s pension plan is a non-contributory defined benefit plan covering approximately 14% of its employees. Certain non-represented salaried employees hired before 2003 receive pension benefits which are determined under a Cash Balance formula as an account balance which grows with interest credits and allocations based on a percentage of pay. Certain wage and salaried employees represented by a union hired before November 2005 receive a monthly benefit at retirement based on a fixed rate and years of service. These plans are closed to new participants. Represented employees hired after November 2005 and employees at locations which were acquired from International Steel Group Inc. receive defined pension benefits through a multi-employer pension plan that is accounted for as a defined contribution plan, due to the limited information made available to each of the 483 (as of December 31, 2016) different participating employers. ArcelorMittal USA s labour agreement with the United Steelworkers ( USW ) increased the contributions to the multi-employer plan to $2.70 per contributory hour (retroactive to September 1, 2015) from $2.65. The contribution rate increased by $0.05 each September 1 for the term of the contract which ends September 1, 2018.
153 Consolidated financial statements 153 Canada Europe The primary pension plans are those of ArcelorMittal Dofasco, AMMIC and ArcelorMittal Long Products Canada. Certain European operating subsidiaries maintain primarily unfunded defined benefit pension plans for a certain number of employees. Benefits are based on such employees length of service and applicable pension table under the terms of individual agreements. Some of these unfunded plans have been closed to new entrants and replaced by defined contributions pension plans for active members financed by employer and employee contributions. The ArcelorMittal Dofasco pension plan is a hybrid plan providing the benefits of both a defined benefit and defined contribution pension plan. The defined contribution component is financed by both employer and employee contributions. The employer s defined contribution is based on a percentage of company profits. The defined benefit pension plan was closed for new hires on December 31, 2010 and replaced by a new defined contribution pension plan with contributions related to age, service and earnings. At the end of 2012, ArcelorMittal Dofasco froze and capped benefits for its hourly and salaried employees who were still accruing service under the defined benefit plan and began transitioning these employees to the new defined contribution pension plan for future pension benefits. The AMMIC defined benefit plan provides salary related benefit for non-union employees and a flat dollar pension depending on an employee s length of service for union employees. This plan was closed for new non-union hires on December 31, 2009 and replaced by a defined contribution pension plan with contributions related to age and service. Effective January 1, 2015, AMMIC implemented a plan to transition its non-union employees who were still benefiting under the defined benefit plan to a defined contribution pension plan. Transition dates can extend up to January 1, 2025 depending on the age and service of each member. ArcelorMittal Long Products Canada sponsors several defined benefit and defined contribution pension plans for its various groups of employees, with most defined benefit plans closed to new entrants several years ago. The primary defined benefit pension plan sponsored by ArcelorMittal Long Products Canada provides certain unionized employees with a flat dollar pension depending on an employee s length of service. ArcelorMittal Long Products Canada entered into a six-year collective labor agreement during the third quarter of 2014 with its Contrecoeur-West union group. The defined benefit plan was closed to new hires. A new defined contribution type arrangement was established for new hires. Brazil The primary defined benefit plans, financed through trust funds, have been closed to new entrants. Brazilian entities have all established defined contribution plans that are financed by employer and employee contributions. As from December 2015 new Belgian legislation modifies the minimum guaranteed rates of return applicable to Belgian Defined Contribution Plans. For insured plans, the rates of 3.25% on employer contributions and 3.75% on employee contributions will continue to apply to the accumulated pre-2016 contributions. For contributions paid as from January, 1, 2016, a new variable minimum guaranteed rate of return applies. For 2016 and 2017, the minimum guaranteed rate of return was 1.75% and this is also the best estimate for Due to the statutory minimum guaranteed return, Belgian defined contribution plans do not meet the definition of defined contribution plans under IFRS. Therefore, the Belgian defined contribution plans are classified as defined benefit plans. On April 25, 2016, the Company agreed with unions in France to cap the annual indexation of the IRUS pension plan until 2026 and to pay a lump sum amount to cover the indexation obligation for subsequent years. These changes resulted in a gain of 96 recorded in cost of sales and selling, general and administrative expenses in the statements of operations. Others A very limited number of defined benefit plans are in place in other countries (such as South Africa, Mexico, Kazakhstan, Ukraine and Morocco). The majority of the funded defined benefit pension plans described earlier provide benefit payments from trusteeadministered funds. ArcelorMittal also sponsors a number of unfunded plans where the Company meets the benefit payment obligation as it falls due. Plan assets held in trusts are legally separated from the Company and are governed by local regulations and practice in each country, as is the nature of the relationship between the Company and the governing bodies and their composition. In general terms, governing bodies are required by law to act in the best interest of the plan members and are responsible for certain tasks related to the plan (e.g. setting the plan's investment policy). In case of the funded pension plans, the investment positions are managed within an asset-liability matching ("ALM") framework that has been developed to achieve long-term investments that are in line with the obligations of the pension plans.
154 154 Consolidated financial statements A long-term investment strategy has been set for ArcelorMittal s major funded pension plans, with its asset allocation comprising of a mixture of equity securities, fixed income securities, real estate and other appropriate assets. This recognizes that different asset classes are likely to produce different long-term returns and some asset classes may be more volatile than others. The long-term investment strategy ensures, in particular, that investments are adequately diversified. The following tables detail the reconciliation of defined benefit obligation ( DBO ), plan assets, irrecoverable surplus and statements of financial position. Year ended December 31, 2017 Total United States Canada Brazil Europe Other 10,054 3,627 3, , Change in benefit obligation Benefit obligation at beginning of the period Current service cost Interest cost on DBO Past service cost - Plan amendments Plan participants contribution 323 (28) (131) (130) 1 (2) Financial assumptions Experience adjustment 36 (52) (656) (265) (15) Actuarial (gain) loss Demographic assumptions Benefits paid Foreign currency exchange rate differences and other movements Benefit obligation at end of the period (197) (49) (130) (12) ,835 3,508 3, , Change in plan assets 7,048 2,768 2, Interest income on plan assets Return on plan assets greater/(less) than discount rate (8) Employer contribution (196) (49) (37) (3) (11) Fair value of plan assets at beginning of the period Plan participants contribution Benefits paid Foreign currency exchange rate differences and other movements Fair value of plan assets at end of the period Present value of the wholly or partly funded obligation Fair value of plan assets (545) (260) ,822 2,993 3, (9,352) (3,477) (3,463) (765) 7,822 2,993 3, (1,635) 924 Net present value of the wholly or partly funded obligation (1,530) (484) (296) (42) (711) Present value of the unfunded obligation (1,483) (31) (18) (1) (1,355) Prepaid due to unrecoverable surpluses Net amount recognized Net assets related to funded obligations Recognized liabilities (34) (3,047) 20 (3,067) (515) (515) (12) 15 3 (78) (23) (3) (6) (2) (337) (46) (2,072) (77) 17 (354) (46) 3 (2,075) (77) Change in unrecoverable surplus Unrecoverable surplus at beginning of the period Interest cost on unrecoverable surplus Change in unrecoverable surplus in excess of interest Exchange rates changes Unrecoverable surplus at end of the period (34) (18) (3) (4) (9) (1) (1) 2 (3) (2) 7 (1) (1) (34) (23) (3) (6) (2)
155 Consolidated financial statements 155 Year ended December 31, 2016 Total United States Canada Brazil Europe Other 236 Change in benefit obligation 9,883 3,623 2, ,601 Current service cost Interest cost on DBO Past service cost - Plan amendments (80) 12 4 (96) Plan participants contribution Curtailments and settlements (10) (4) Actuarial (gain) loss Demographic assumptions (12) (21) 1 8 Financial assumptions Experience adjustment (14) (8) (633) (261) Benefit obligation at beginning of the period Benefits paid Foreign currency exchange rate differences and other movements 1 Benefit obligation at end of the period (6) 1 (1) (186) (42) (129) (15) (64) (143) 10,054 3,627 3, , (16) Change in plan assets 6,828 2,795 2, Interest income on plan assets Return on plan assets greater/(less) than discount rate Employer contribution (4) (4) (185) (42) (38) (3) Fair value of plan assets at beginning of the period Plan participants contribution Settlements (529) Benefits paid Foreign currency exchange rate differences and other movements Fair value of plan assets at end of the period Present value of the wholly or partly funded obligation Fair value of plan assets 1 (261) ,048 2,768 2, (8,730) (3,593) (3,040) (703) 7,048 2,768 2, (12) (1,379) (128) 24 (15) Net present value of the wholly or partly funded obligation (1,682) (825) (245) (19) (602) Present value of the unfunded obligation (1,324) (34) (13) (1) (1,203) Prepaid due to unrecoverable surpluses (34) (18) (3) (4) (9) (276) (23) (1,809) (73) Net amount recognized Net assets related to funded obligations Recognized liabilities (3,040) 21 (3,061) (859) (859) 18 (294) (23) 3 (73) (1,812) (73) Change in unrecoverable surplus Unrecoverable surplus at beginning of the period (80) (21) (53) (3) (3) Interest cost on unrecoverable surplus (10) (1) (8) (1) (1) (4) Exchange rates changes (11) (1) (9) (1) Unrecoverable surplus at end of the period (34) (18) (3) (4) (9) Change in unrecoverable surplus in excess of interest 1. Others: includes the derecognition of the benefit obligation and plan assets in ArcelorMittal Point Lisas for 136 and 127, respectively.
156 156 Consolidated financial statements The following tables detail the components of net periodic pension cost: Year ended December 31, 2017 Canada Brazil Europe 125 United States Net interest cost/(income) on net DB liability/(asset) Total Total United States 31 Canada (96) Net periodic pension cost (benefit) Current service cost Past service cost - Plan amendments Total Others Year ended December 31, 2016 Net periodic pension cost (benefit) Current service cost 112 Past service cost - Plan amendments (80) Past service cost - Curtailments (6) Brazil Europe Others (6) Net interest cost/(income) on net DB liability/(asset) Total (11) 7 Total Canada 121 United States 36 4 (1) Year ended December 31, 2015 Net periodic pension cost (benefit) Current service cost Past service cost - Plan amendments Past service cost - Curtailments Brazil Europe Others (1) Net interest cost/(income) on net DB liability/(asset) Total Other post-employment benefits and other long-term employee benefits ("OPEB") ArcelorMittal s principal operating subsidiaries in the United States, Canada, Europe and certain other countries, provide other post-employment benefits and other long-term employee benefits ( OPEB ), including medical benefits and life insurance benefits, work medals and retirement indemnity plans, to employees and retirees. Substantially all union-represented ArcelorMittal USA employees hired before June 2016 are covered under post-employment life insurance and medical benefit plans that require a level of cost sharing from retirees. The post-employment life insurance benefit formula used in the determination of postemployment benefit cost is primarily based on a specific amount for hourly employees. ArcelorMittal USA does not pre-fund most of these post-employment benefits. ArcelorMittal s USA labor agreement with the United Steelworkers ( USW ) was ratified in This labor agreement is valid until September 1, ArcelorMittal performed a number of changes mainly related to healthcare post-employment benefits in its subsidiary ArcelorMittal USA. Also, in accordance with the new agreement, required payments into an existing Voluntary Employee Beneficiary Association ( VEBA ) trust were fixed at 5% of ArcelorMittal USA s operating income of their separate financial statements after the first quarter of The changes resulted in a gain of 832 recorded in cost of sales in the consolidated statements of operations in The Company has significant assets mostly in the VEBA post-employment benefit plan. These assets consist of 70% in fixed income and 30% in equities. The total fair value of the assets in the VEBA trust was 490 as of December 31, 2017.
157 Consolidated financial statements 157 Summary of changes in the other post-employment benefit obligation and changes in plan assets are as follows: Year ended December 31, 2017 Total United States Canada Europe Others 133 Change in benefit obligation 5,400 4, Current service cost Interest cost on DBO Benefit obligation at beginning of the period Past service cost - Plan amendments Plan participants contribution (942) (1,005) Demographic assumptions (153) (168) Financial assumptions (680) (728) 40 9 (1) Experience adjustment (109) (109) 3 (5) 2 (258) (177) (32) (42) (7) Actuarial (gain) loss Benefits paid Foreign currency exchange rate differences and other movements Benefit obligation at end of the period ,686 3, Change in plan assets Interest income on plan assets Return on plan assets greater/(less) than discount rate (44) (44) (61) (59) (2) (757) (689) (68) (211) (151) (60) Present value of the unfunded obligation (3,929) (2,580) (679) (511) (159) Net amount recognized (4,140) (2,731) (679) (571) (159) Fair value of plan assets at beginning of the period Employer contribution Plan participants contribution Benefits paid Foreign currency exchange rate differences and other movements Fair value of plan assets at end of the period Present value of the wholly or partly funded obligation Fair value of plan assets Net present value of the wholly or partly funded obligation
158 158 Consolidated financial statements Year ended December 31, 2016 Total United States Canada Europe Others Change in benefit obligation 6,251 4, Current service cost Interest cost on DBO (851) (844) (3) (4) (48) (62) (184) (154) (32) 2 Financial assumptions (8) Experience adjustment (53) (68) 10 (6) 11 (323) Benefit obligation at beginning of the period Past service cost - Plan amendments Plan participants contribution Actuarial (gain) loss Demographic assumptions Benefits paid Foreign currency exchange rate differences and other movements 1 Benefit obligation at end of the period (240) (31) (40) (12) (27) (43) 5,400 4, Change in plan assets Fair value of plan assets at beginning of the period Interest income on plan assets Employer contribution Plan participants contribution (242) (240) (2) (821) (760) (61) (222) (168) (54) Present value of the unfunded obligation (4,579) (3,423) (592) (431) (133) Net amount recognized (4,801) (3,591) (592) (485) (133) Return on plan assets greater/(less) than discount rate Benefits paid Fair value of plan assets at end of the period Present value of the wholly or partly funded obligation Fair value of plan assets Net present value of the wholly or partly funded obligation 1. Includes a 53 increase in benefit obligation retained by the Company in respect of Steelton, which has been classified as held for sale at December 31, 2016 (see note 2.3.2). The following tables detail the components of net periodic other post-employment cost: Year ended December 31, 2017 Canada Europe Others 100 United States Net interest cost/(income) on net DB liability/(asset) Actuarial (gains)/losses recognized during the year Total United States 59 Components of net periodic OPEB cost (benefit) Current service cost Past service cost - Plan amendments Total Total Year ended December 31, 2016 Components of net periodic OPEB cost (benefit) Current service cost Past service cost - Plan amendments Net interest cost/(income) on net DB liability/(asset) Actuarial (gains)/losses recognized during the year Total 100 Canada Europe 7 27 Others 7 (851) (844) (3) (4) (527) (608)
159 Consolidated financial statements 159 Year ended December 31, 2015 Components of net periodic OPEB cost (benefit) Total Current service cost 96 Past service cost - Plan amendments (2) Cost of termination benefits Net interest cost/(income) on net DB liability/(asset) Actuarial (gains)/losses recognized during the year Total United States 50 Canada Europe Others (2) (3) 317 (3) The following tables detail where the expense is recognized in the consolidated statements of operations: Year ended December 31, Net periodic pension cost Net periodic OPEB cost 310 (527) 317 Total 555 (393) 558 Cost of sales 220 (725) 197 Selling, general and administrative expenses Financing costs - net Total 555 (393) 558
160 160 Consolidated financial statements Plan Assets The weighted-average asset allocations for the funded defined benefit plans by asset category were as follows: December 31, 2017 United States 53% Equity Securities Canada Brazil 56% Europe Others 3% 41% 3% 41% - Asset classes that have a quoted market price in an active market 26% 47% - Asset classes that do not have a quoted market price in an active market 27% 9% 34% 42% 97% 71% 49% 4% 33% 97% 67% 49% 30% 9% 2% Fixed Income Securities (including cash) - Asset classes that have a quoted market price in an active market - Asset classes that do not have a quoted market price in an active market Real Estate - Asset classes that have a quoted market price in an active market - Asset classes that do not have a quoted market price in an active market Other 2% 4% 1% % 1% % 2% 2% % 13% 2% 26% - Asset classes that have a quoted market price in an active market 4% 2% 3% - Asset classes that do not have a quoted market price in an active market 9% 23% 100% 100% 100% 100% 100% Total 8% 8% December 31, 2016 United States 50% Equity Securities Canada Brazil Europe Others 53% 3% 40% 46% 3% 40% - Asset classes that have a quoted market price in an active market 25% - Asset classes that do not have a quoted market price in an active market 25% 7% 37% 47% 98% 72% 50% 2% 35% 98% 71% 50% 35% 12% Fixed Income Securities (including cash) - Asset classes that have a quoted market price in an active market - Asset classes that do not have a quoted market price in an active market Real Estate 4% - Asset classes that have a quoted market price in an active market - Asset classes that do not have a quoted market price in an active market Other - Asset classes that have a quoted market price in an active market 1% 9% 1% 25% 100% 2% 9% Total 1% 4% - Asset classes that do not have a quoted market price in an active market 1% 1% 2% 8% 5% 8% 20% 100% 100% 100% 100% These assets include investments in ArcelorMittal stock of approximately 3, but not in property or other assets occupied or used by ArcelorMittal. These assets may also include ArcelorMittal shares held by mutual fund investments. The invested assets produced an actual return of 799 and 612 in 2017 and 2016, respectively. The Finance and Retirement Committees of the Boards of Directors for the respective operating subsidiaries have general supervisory authority over the respective trust funds. These committees have established asset allocation targets for the period as described below. Asset managers are permitted some flexibility to vary the asset allocation from the long-term investment strategy within control ranges agreed upon. December 31, 2017 United States Canada Brazil Europe Equity Securities 37% 46% 1% 3% Fixed Income Securities (including cash) 43% 41% 93% 71% 3% 8% 3% % Real Estate Other 17% 5% 3% 26% Total 100% 100% 100% 100%
161 Consolidated financial statements 161 Assumptions used to determine benefit obligations at December 31, Pension Plans Other Post-employment Benefits % % 1.60% % 2.05% % 1.30% % 0.90% % 0.90% % Discount rate Range Weighted average 3.45% 3.92% 4.21% 3.60% 4.19% 4.49% Rate of compensation increase Range 1.80% % Weighted average 1.80% % 2.81% 3.11% 2.00% % 2.00% % 3.11% 3.32% 2.00% % 3.38% 2.00% % 3.98% Other Post-employment Benefits % % 1.80% % 2.00% % Healthcare cost trend rate assumed Range 4.48% Weighted average Cash contributions and maturity profile of the plans In 2018, the Company expects its cash contributions to amount to 299 for pension plans, 144 for other postemployment benefits plans, 120 for defined contribution plans and 73 for United States multi-employer plans. Cash contributions to defined contribution plans and to United States multi-employer plans sponsored by the Company, were respectively 104 and 67 in % 4.75% appropriate element of a long-term strategy to manage the plans efficiently. Life expectancy Most plans provide benefits for the life of the covered members, so increases in life expectancy will result in an increase in the plans benefit obligations. Through its defined benefit pension plans and OPEB plans, ArcelorMittal is exposed to a number of risks, the most significant of which are detailed below: Assumptions regarding future mortality rates have been set considering published statistics and, where possible, ArcelorMittal s own experience. In 2017, ArcelorMittal USA updated the company specific tables it uses to value most of its postretirement liabilities. These tables were projected forward using the most recent projection scales issued by the Society of Actuaries. Use of these new mortality assumptions resulted in reducing the pension and OPEB by 95 and 51, respectively. The current longevities at retirement underlying the values of the defined benefit obligation were approximately 22. Changes in bond yields Healthcare cost trend rate A decrease in corporate bond yields will increase plan liabilities, although this will be partially offset by an increase in the value of the plans bond holdings. The majority of the OPEB plans benefit obligations are linked to the change in the cost of various health care components. Future healthcare cost will vary based on several factors including price inflation, utilization rate, technology advances, cost shifting and cost containing mechanisms. A higher healthcare cost trend would lead to higher OPEB plan benefit obligations. At December 31, 2017, the weighted average duration of the liabilities related to the pension and other postemployment benefits plans were 12 (2016: 11) and 14 (2016: 13), respectively. Risks associated with defined benefit plans Asset volatility The plan liabilities are calculated using a discount rate set with reference to corporate bond yields; if plan assets underperform this yield, this will create a deficit. In most countries with funded plans, plan assets hold a significant portion of equities, which are expected to outperform corporate bonds in the long-term while providing volatility and risk in the short-term. As the plans mature, ArcelorMittal intends to reduce the level of investment risk by investing more in assets that better match the liabilities. However, ArcelorMittal believes that due to the long-term nature of the plan liabilities, a level of continuing equity investment is an In 2017, the Company changed its provider of insured coverage of Medicare eligible participants in the United States. This resulted in significantly lowering the premiums and resulted in reducing the OPEB defined benefit obligations by 1,061. In 2017, the healthcare cost trend rate assumption in the United States was adjusted, which resulted in increasing the OPEB defined benefit obligations by 117.
162 162 Consolidated financial statements Sensitivity analysis The following information illustrates the sensitivity to a change of the significant actuarial assumptions related to ArcelorMittal s pension plans (as of December 31, 2017, the defined benefit obligation for pension plans was 10,835): Effect on 2018 Pre-Tax Pension Expense (sum of service cost and interest cost) Effect on December 31, 2017 DBO Change in assumption 100 basis points decrease in discount rate (50) 1, basis points increase in discount rate 40 (1,095) 100 basis points decrease in rate of compensation (14) (180) 100 basis points increase in rate of compensation year increase of the expected life of the beneficiaries The following table illustrates the sensitivity to a change of the significant actuarial assumptions related to ArcelorMittal s OPEB plans (as of December 31, 2017 the defined benefit obligation for post-employment benefit plans was 4,686): Effect on 2018 Pre-Tax OPEB Expense (sum of service cost and interest cost) Effect on December 31, 2017 DBO Change in assumption 100 basis points decrease in discount rate (3) basis points increase in discount rate 2 (553) 100 basis points decrease in healthcare cost trend rate (31) (469) 100 basis points increase in healthcare cost trend rate year increase of the expected life of the beneficiaries The above sensitivities reflect the effect of changing one assumption at a time. Actual economic factors and conditions often affect multiple assumptions simultaneously, and the effects of changes in key assumptions are not necessarily linear. Multi-employer plans ArcelorMittal participates in one material multi-employer pension plan in the United States. Under multi-employer plans, several participating employers make contributions into a pension plan. The assets of the plan are not limited to the participants of a particular employer. If an employer is unable to make required contributions to the plan, any unfunded obligations may be borne by the remaining employers. Additionally, if an employer withdraws from the plan, it may be required to pay an amount based on the underfunded status of the plan. As of December 31, 2016, which is the latest period for which information is available, the multi-employer pension plan had a total actuarial liability of 4,993 and assets with market value of 4,142 for a funded ratio of about 83%. ArcelorMittal represented approximately 29% of total contributions made to the plan in the past three years. 7.3 Share-based payments ArcelorMittal issues equity-settled share-based payments to certain employees, including stock options, RSUs and PSUs. Equity-settled share-based payments are measured at fair value (excluding the effect of non market-based vesting conditions) at the date of grant. The fair value determined at the grant date of the equity-settled sharebased payments is expensed on a graded vesting basis over the vesting period, based on the Company s estimate of the shares that will eventually vest and adjusted for the effect of non market-based vesting conditions. For stock options, RSUs and PSUs, fair value is measured using the Black-Scholes-Merton pricing model and the market value of the shares at the date of the grant after deduction of dividend payments during the vesting period, respectively. Where the fair value calculation requires modeling of the Company s performance against other market index, fair value is measured using the Monte Carlo pricing model to estimate the forecasted target performance goal for the company and its peer companies. The expected life used in the model has been adjusted, based on management s best estimate, for the effects of non-transferability, exercise restrictions and behavioral considerations. In addition, the expected annualized volatility has been set by reference to the implied volatility of options available on ArcelorMittal shares in the open market, as well as, historical patterns of volatility. For the RSUs and PSUs, the fair value determined at the grant date of the equity-settled share-based payments is expensed on a straight line method over the vesting period and adjusted for the effect of non marketbased vesting conditions. On May 22, 2017, ArcelorMittal completed the consolidation of each three existing shares in ArcelorMittal without nominal value into one share without nominal value. As a result of this reverse stock split, the outstanding number of
163 Consolidated financial statements 163 stock options, PSUs and RSUs per employee has been recast for prior periods. Stock Option Plans Prior to the May 2011 annual general shareholders meeting adoption of the ArcelorMittal Equity Incentive Plan described below, ArcelorMittal s equity-based incentive plan took the form of a stock option plan known as the Global Stock Option Plan. Under the terms of the ArcelorMittal Global Stock Option Plan (which replaced the ArcelorMittal Shares plan that expired in 2009), ArcelorMittal may grant options to purchase common shares to senior management of ArcelorMittal and its associates for up to 100,000,000 (33,333,333 shares after reverse stock split) shares of common shares. The exercise price of each option equals not less than the fair market value of ArcelorMittal shares on the grant date, with a maximum term of 10 years. Options are granted at the discretion of ArcelorMittal s Appointments, Remuneration and Corporate Governance ("ARCG") Committee, or its delegate. The options vest either ratably upon each of the first three anniversaries of the grant date, or, in total, upon the death, disability or retirement of the participant. August 2010 Exercise prices (per option) $91.98 August Date of grant November August No options were granted during the years ended December 31, 2017, 2016, and The compensation expense recognized for stock option plans was nil for each of the years ended December 31, 2017, 2016 and Option activity with respect to ArcelorMittal Shares and ArcelorMittal Global Stock Option Plan is summarized below as of and for each of the years ended December 31, 2017, 2016 and 2015: Outstanding, December 31, 2014 Number of Options Range of Exercise Prices (per option) 6,692, Weighted Average Exercise Price (per option) (961,733) Expired 5,730, (1,048,266) ,682, (1,397,659) Outstanding, December 31, ,284, Exercisable, December 31, ,730, Exercisable, December 31, ,682, Exercisable, December 31, ,284, Outstanding, December 31, 2015 Expired Outstanding, December 31, 2016 Expired The following table summarizes information about total stock options of the Company outstanding as of December 31, 2017: Options Outstanding Exercise Prices (per option) Number of options $ ,117,757 Weighted average contractual life (in years) ,058, Options exercisable (number of options) Maturity 1,117,757 August 3, ,058,014 August 4, November 10, ,108, ,108,242 August 5, 2018 $63.42 $ ,284, ,284,875
164 164 Consolidated financial statements Long-Term Incentives: Equity-Based Incentives (Share Unit Plans) On May 10, 2011, the annual general meeting of shareholders approved the ArcelorMittal Equity Incentive Plan, a new equity-based incentive plan that replaced the Global Stock Option Plan. The ArcelorMittal Equity Incentive Plan is intended to align the interests of the Company s shareholders and eligible employees by allowing them to participate in the success of the Company. The ArcelorMittal Equity Incentive Plan provides for the grant of RSUs and PSUs to eligible Company employees (including the Executive Officers) and is designed to incentivize employees, improve the Company s long-term performance and retain key employees. On May 8, 2013, the annual general meeting of shareholders approved the GMB PSU Plan, which provides for the grant of PSUs to GMB members (and is now applicable to the CEO Office). Until the introduction of the GMB PSU Plan in 2013, GMB members were eligible to receive RSUs and PSUs under the ArcelorMittal Equity Incentive Plan. In 2016, a special grant was approved in order to align the grant with the Action 2020 plan put in place by ArcelorMittal. The maximum number of PSUs (and RSUs previously) available for grant during any given year is subject to the prior approval of the Company s shareholders at the annual general meeting. The annual shareholders meeting on May 4, 2016 approved the maximum to be granted until the next annual shareholders meeting. For the period from the May 2016 annual general shareholders meeting to the May 2017 annual general shareholders meeting, a maximum of 30,000,000 PSUs (10,000,000 PSU's after the reverse stock split) may be allocated to eligible employees under the Conditions of the 2017 grant were as follows: ArcelorMittal Equity Incentive Plan and the GMB PSU Plan combined. The 2017 Cap for the number of PSUs that may be allocated to the CEO Office and other retention based grants below the CEO Office level was approved at the annual shareholders' meeting on May 10, 2017 at a maximum of 3,000,000 shares. ArcelorMittal Equity Incentive Plan RSUs granted under the ArcelorMittal Equity Incentive Plan are designed to provide a retention incentive to eligible employees. RSUs are subject to cliff vesting after three years, with 100% of the grant vesting on the third anniversary of the grant contingent upon the continued active employment of the eligible employee within the Company. The grant of PSUs under the ArcelorMittal Equity Incentive Plan aims to serve as an effective performance-enhancing scheme based on the employee s contribution to the eligible achievement of the Company s strategy. Awards in connection with PSUs are subject to the fulfillment of cumulative performance criteria (such as return on capital employed ("ROCE"), total shareholders return ("TSR"), earnings per share ("EPS") and gap to competition) over a three year period from the date of the PSU grant. The employees eligible to receive PSUs are a sub-set of the group of employees eligible to receive RSUs. The target group for PSU grants initially included the Chief Executive Officer and the other GMB members. However, from 2013 onwards, the Chief Executive Officer and other GMB members (and in 2016, the CEO Office) received PSU grants only under the GMB PSU Plan instead of the ArcelorMittal Equity Incentive Plan. CEO Office PSUs with a three-year performance period Executive Officers and other qualifying employees PSUs with a three-year performance period Performance criteria: 50% TSR (½ vs. S&P 500 and ½ vs. peer group) and 50% EPS vs. peer group Performance criteria: TSR and Gap to competition in some areas Value at grant: 100% of base salary for the CEO and the CFO Vesting conditions: 2017 Grant Vesting conditions: Threshold TSR/EPS vs. peer group TSR vs. S&P 500 Vesting percentage Target Threshold 100% median 120% median TSR vs. peer group 100% median 50% vesting Performance equal to Index Performance equal to Index + 2% outperformance Gap to competition (where applicable) - 50% 100% Awards made in previous financial years which have not yet reached the end of the vesting period The Company's Long-Term Incentive Plan for senior management including Executive Officers follows the Company's strategy. Target 120% median 100% vesting 100% target 100% vesting In 2014 and 2015, the Company's goal was to achieve ROCE and Mining volume for the Mining segment and therefore the target was based on these performance measures. In 2016, in order to ensure achievement of the Action 2020 plan, ArcelorMittal made a special grant ( Special Grant ) to
165 Consolidated financial statements 165 qualifying employees (including the Executive Officers), instead of the standard grant. The value of the Special Grant at grant date is based generally on a specified percentage of the base salary depending on the position of the employee at grant date. The vesting is subject to continued active employment within the ArcelorMittal group and to yearly performance of ROCE targets and other strategic objectives within the business units Grant The plans in 2016, 2015 and 2014 are summarized below: CEO Office PSUs with a three-year performance period Executive Officers and other qualifying employees RSUs with a three-year vesting period (2014 grant vested in December 2017) Performance criteria: 50% TSR (½ vs. S&P 500 and ½ vs. peer group) and 50% EPS vs. peer group PSUs with a three-year performance period Value at grant: 100% of base salary for the CEO and 80% for the CFO Performance target: mainly ROCE and mining volume plan for the Mining segment Vesting conditions: One PSU can give right to 0 shares up to 1.5 shares Vesting conditions: Threshold Target Stretch TSR/EPS vs. peer group 80% median 100% median 120% median TSR vs. S&P 500 Performance equal to 80% of Index Performance equal to Index Performance equal to Index + 2% outperformance 50% 100% 150% 2016 Special Grant 2015 Grant Vesting percentage Threshold Target Stretch Performance 80% 100% 120% Vesting 50% 100% 150% Same as in 2014 Same as in 2014 PSUs with a five-year performance period, 50% vesting after threeyear performance period and 50% after additional two-year performance period PSUs with a five-year performance period, 50% vesting after three-year performance period and 50% after additional two-year performance period Performance criteria: 50% TSR (½ vs. S&P 500 and ½ vs. peer group) and 50% EPS vs. peer group Performance criteria: ROCE and Gap to competition in some areas one target grant: a share will vest if performance is met at target one overperformance grant: a share will vest if performance exceeds 120% Value at grant: 150% of base salary for the CEO and the CFO Vesting conditions: Vesting conditions: TSR/EPS vs. peer group Threshold 100% median Target 120% median TSR vs. S&P 500 Performance equal to Index Performance equal to Index + 2% outperformance 50% 100% Vesting percentage Performance Target award vesting 100% 100% 120% 100% Overperformance award (=20% of target award) - 100%
166 166 Consolidated financial statements The following table summarizes the Company s share unit plans outstanding December 31, 2017: At Grant date Number of shares issued as of December 31, 2017 Shares Shares Shares outstanding exited forfeited Type of plan Number of shares Number of beneficiaries Maturity Fair value per share December 20, 2017 PSU 1,081, January 1, ,081,447 December 20, 2017 CEO Office 90,084 2 January 1, ,084 June 30, 2016 PSU II 3,472, January 1, ,238, ,425 June 30, 2016 CEO PSU II 153,268 2 January 1, ,268 June 30, 2016 PSU I 3,472, January 1, ,238, ,425 June 30, 2016 CEO PSU I 153,268 2 January 1, ,268 PSU 295, January 1, ,661 49,274 59,391 Grant date December 18, 2015 December 18, 2015 June 30, 2015 December 17, 2014 RSU 368, December 18, ,005 3,138 GMB PSU 154,767 4 June 30, ,767 PSU 326, January 1, ,481 87,197 $10.68 $ ,902,841 3, ,712 Total 9,568,691 The compensation expense recognized for RSUs and PSUs was immaterial for the years ended December 31, 2017, 2016 and Share unit plan activity is summarized below as of and for each year ended December 31, 2017, 2016 and 2015: Outstanding, December 31, 2014 Granted Exited Forfeited Outstanding, December 31, 2015 Granted 1 Number of shares 1,136,761 RSUs Fair value per share Number of shares 1,086,834 PSUs Fair value per share , , (107,544) (77,099) (8,239) (158,622) ,320, ,370, ,252, Exited (564,679) Forfeited (105,721) , ,039, ,199, Outstanding, December 31, 2016 Granted 1 Exited (303,550) Forfeited (40,699) Outstanding, December 31, , (19,816) (564,179) (204,855) (437,141) ,596, Including 27,807 over-performance shares granted for the targets achievement of the PSU grant September 27, 2013 (1,567 over-performance shares for the PSU grant March 29, 2013 in 2016). Note 8: Provisions, contingencies and commitments ArcelorMittal recognizes provisions for liabilities and probable losses that have been incurred when it has a present legal or constructive obligation as a result of past events, it is probable that the Company will be required to settle the obligation and a reliable estimate of the amount of the obligation can be made. If the effect of the time value of money is material, provisions are discounted using a current pre-tax rate that reflects, where appropriate, the risks specific to the liability. Where discounting is used, the increase in the provision due to the passage of time is recognized as a financing cost. Future operating expenses or losses are excluded from recognition as provisions as they do not meet the definition of a liability. Contingent assets and contingent liabilities are excluded from recognition in the consolidated statements of financial position. Provisions for onerous contracts are recorded in the consolidated statements of operations when it becomes known that the unavoidable costs of meeting the obligations under the contract exceed the economic benefits expected to be received. Assets dedicated to the onerous contracts are tested for impairment before recognizing a separate provision for the onerous contract. Provisions for restructuring are recognized when and only when a detailed formal plan exists and a valid expectation in those affected by the restructuring has been raised, by starting to implement the plan or announcing its main features.
167 Consolidated financial statements 167 ArcelorMittal records asset retirement obligations ( ARO ) initially at the fair value of the legal or constructive obligation in the period in which it is incurred and capitalizes the ARO by increasing the carrying amount of the related non-current asset. The fair value of the obligation is determined as the discounted value of the expected future cash flows. The liability is accreted to its present value through net financing cost and the capitalized cost is depreciated in accordance with the Company s depreciation policies for property, plant and equipment. Subsequently, when reliably measurable, ARO is recorded on the consolidated statements of financial position increasing the cost of the asset and the fair value of the related obligation. Foreign exchange gains or losses on AROs denominated in foreign currencies are recorded in the consolidated statements of operations. ArcelorMittal is subject to changing and increasingly stringent environmental laws and regulations concerning air emissions, water discharges and waste disposal, as well as certain remediation activities that involve the clean-up of soil and groundwater. ArcelorMittal is currently engaged in the investigation and remediation of environmental contamination at a number of its facilities. Most of these are legacy obligations arising from acquisitions. Environmental costs that relate to current operations or to an existing condition caused by past operations, and which do not contribute to future revenue generation or cost reduction, are expensed. Liabilities are recorded when environmental assessments and/or remedial efforts are probable and the cost can be reliably estimated based on ongoing engineering studies, discussions with the environmental authorities and other assumptions relevant to the nature and extent of the remediation that may be required. The ultimate cost to ArcelorMittal is dependent upon factors beyond its control such as the scope and methodology of the remedial action requirements to be established by environmental and public health authorities, new laws or government regulations, rapidly changing technology and the outcome of any potential related litigation. Environmental liabilities are discounted if the aggregate amount of the obligation and the amount and timing of the cash payments are fixed or reliably determinable. The estimates of loss contingencies for environmental matters and other contingencies are based on various judgments and assumptions including the likelihood, nature, magnitude and timing of assessment, remediation and/or monitoring activities and the probable cost of these activities. In some cases, judgments and assumptions are made relating to the obligation or willingness and ability of third parties to bear a proportionate or allocated share of cost of these activities, including third parties who sold assets to ArcelorMittal or purchased assets from it subject to environmental liabilities. ArcelorMittal also considers, among other things, the activity to date at particular sites, information obtained through consultation with applicable regulatory authorities and third-party consultants and contractors and its historical experience with other circumstances judged to be comparable. Due to the numerous variables associated with these judgments and assumptions, and the effects of changes in governmental regulation and environmental technologies, both the precision and reliability of the resulting estimates of the related contingencies are subject to substantial uncertainties. As estimated costs to remediate change, the Company will reduce or increase the recorded liabilities through write backs or additional provisions in the consolidated statements of operations. ArcelorMittal does not expect these environmental issues to affect the utilization of its plants, now or in the future. ArcelorMittal is currently and may in the future be involved in litigation, arbitration or other legal proceedings. Provisions related to legal and arbitration proceedings are recorded in accordance with the principles described above. Most of these claims involve highly complex issues. Often these issues are subject to substantial uncertainties and, therefore, the probability of loss and an estimation of damages are difficult to ascertain. Consequently, ArcelorMittal may be unable to make a reliable estimate of the expected financial effect that will result from ultimate resolution of the proceeding. In those cases, ArcelorMittal has disclosed information with respect to the nature of the contingency. ArcelorMittal has not accrued a provision for the potential outcome of these cases. For cases in which the Company was able to make a reliable estimate of the expected loss or range of probable loss and has accrued a provision for such loss, it believes that publication of this information on a case-by-case basis would seriously prejudice the Company s position in the ongoing legal proceedings or in any related settlement discussions. Accordingly, in these cases, the Company has disclosed information with respect to the nature of the contingency, but has not disclosed its estimate of the range of potential loss. In the cases in which quantifiable fines and penalties have been assessed, the Company has indicated the amount of such fine or penalty or the amount of provision accrued that is the estimate of the probable loss.
168 168 Consolidated financial statements These assessments can involve series of complex judgments about future events and can rely heavily on estimates and assumptions. The assessments are based on estimates and assumptions that have been deemed reasonable by management. The Company believes that the aggregate provisions recorded for the above matters are adequate based upon currently available information. However, given the inherent uncertainties related to these cases and in estimating contingent liabilities, the Company could, in the future, incur judgments that have a material adverse effect on its results of operations in any particular period. The Company considers it highly unlikely, however, that any such judgments could have a material adverse effect on its liquidity or financial condition. 8.1 Provisions overview Balance at December 31, 2016 Additions 1 Deductions/ Payments Effects of foreign exchange and other movements Balance at December 31, Environmental (see note 8.2) (57) 63 Asset retirement obligations (see note 8.2) (9) (9) (41) (44) Site restoration Staff related obligations Voluntary separation plans (173) Tax claims (109) Other legal claims (64) (22) 2 24 Litigation and other (see note 8.2) Commercial agreements and onerous contracts Other (37) , (392) 152 2,022 Short-term provisions Long-term provisions 1,521 1,612 1,947 2,022 Balance at December 31, 2015 Additions 1 Deductions/ Payments Effects of foreign exchange and other movements Balance at December 31, 2016 Environmental (see note 8.2) (65) Asset retirement obligations (see note 8.2) (4) (5) 358 Site restoration Staff related obligations Voluntary separation plans 64 8 (20) (9) (63) (68) (71) (45) 413 Tax claims (22) Other legal claims (44) (69) 3 5 (5) (254) 4 (11) 26 Litigation and other (see note 8.2) Other unasserted claims Commercial agreements and onerous contracts Other (51) (11) 115 2, (596) (35) 1,947 Short-term provisions Long-term provisions 1,434 1,521 2,204 1, Additions exclude provisions reversed or utilized during the same year. Effects of foreign exchange and other movements in 2017 are mainly related to the depreciation of U.S. dollar against local currencies primarily in Europe. On November 16, 2016, upon settlement of the competition commission case in South Africa, the provision of 84 recorded for this case was reclassified to "other long-term obligations" (65) and "Accrued expenses and other liabilities" (19). Deductions and payments for commercial agreements and onerous contracts reflect the increase in raw materials and steel prices.
169 Consolidated financial statements 169 There are uncertainties regarding the timing and amount of the provisions above. Changes in underlying facts and circumstances for each provision could result in differences in the amounts provided for and the actual outflows. In general, provisions are presented on a non-discounted basis due to the uncertainties regarding the timing or the short period of their expected consumption. Environmental provisions have been estimated based on internal and third-party estimates of contaminations, available remediation technology, and environmental regulations. Estimates are subject to revision as further information develops or circumstances change. Provisions for site restoration are related to costs incurred for dismantling of site facilities, mainly in France. Provisions for staff related obligations primarily concern the United States and Brazil and are related to various employees compensation. Provisions for voluntary separation plans primarily concern plans in Spain, Czech Republic, Belgium and the United States which are expected to be settled within one year. Provisions for litigation include losses relating to a present legal obligation that are considered to be probable. Further detail regarding legal matters is provided in note 8.2. Other mainly includes provisions for technical warranties and guarantees. 8.2 Environmental liabilities, asset retirement obligations and legal proceedings Environmental Liabilities ArcelorMittal s operations are subject to a broad range of laws and regulations relating to the protection of human health and the environment at its multiple locations and operating subsidiaries. As of December 31, 2017, excluding asset retirement obligations, ArcelorMittal had established provisions of 815 for environmental remedial activities and liabilities. The provisions for all operations by geographic area were 473 in Europe, 141 in the United States, 165 in South Africa and 36 in Canada. In addition, ArcelorMittal and the previous owners of its facilities have expended substantial amounts to achieve or maintain ongoing compliance with applicable environmental laws and regulations. ArcelorMittal expects to continue to expend resources in this respect in the future. United States ArcelorMittal s operations in the United States have environmental provisions of 141 (exclusive of asset retirement obligations) to address existing environmental liabilities, of which 16 is expected to be spent in The environmental provisions principally relate to the investigation, monitoring and remediation of soil and groundwater at ArcelorMittal s current and former facilities. ArcelorMittal USA continues to have significant environmental provisions relating to investigation and remediation at Indiana Harbor, Lackawanna, and its closed coal mining operations in southwestern Pennsylvania. ArcelorMittal USA s environmental provisions also include 36, with anticipated spending of 2 during 2018, to specifically address the removal and disposal of asbestoscontaining materials and polychlorinated biphenyls ( PCBs ). All of ArcelorMittal s major operating and former operating sites in the United States are or may be subject to a corrective action program or other laws and regulations relating to environmental remediation, including projects relating to the reclamation of industrial properties. In some cases, soil or groundwater contamination requiring remediation is present at both currently operating and historical sites where ArcelorMittal has a continuing obligation. In other cases, we are required to conduct studies to determine the extent of contamination, if any, that exists at these sites. ArcelorMittal USA s Indiana Harbor facility was party to a lawsuit filed by the United States Environmental Protection Agency (the EPA ) under the United States Resource Conservation and Recovery Act ( RCRA ). An ArcelorMittal USA predecessor company entered into a Consent Decree, which, among other things, requires facility-wide RCRA Corrective Action and sediment assessment and remediation in the adjacent Indiana Harbor Ship Canal. ArcelorMittal USA entered into a Consent Decree Amendment defining the objectives for limited sediment assessment and remediation of a small portion of the Indiana Harbor Ship Canal. The provisions for environmental liabilities include 7 for such sediment assessment and remediation, and 4 for RCRA Corrective Action at the Indiana Harbor facility itself. Remediation ultimately may be necessary for other contamination that may be present at Indiana Harbor, but the potential costs of any such remediation cannot yet be reasonably estimated. ArcelorMittal USA s properties in Lackawanna, New York are subject to an Administrative Order on Consent with the EPA requiring facility-wide RCRA Corrective Action. The Administrative Order requires the Company to perform a Remedial Facilities Investigation ( RFI ) and a Corrective Measures Study, to implement appropriate interim and final remedial measures, and to perform required post-remedial closure activities. The New York State Department of Environmental Conservation and the EPA conditionally approved the RFI. ArcelorMittal USA has executed Orders on Consent to perform certain interim corrective measures while advancing the Corrective Measures Study. These include installation and operation of a ground water treatment system and dredging of a local waterway known as Smokes Creek. A Corrective Measure Order on Consent was executed for other site remediation activities.
170 170 Consolidated financial statements ArcelorMittal USA s provisions for environmental liabilities include 35 for anticipated remediation and post-remediation activities at this site. The provisioned amount is based on the extent of soil and groundwater contamination identified by the RFI and the remedial measures likely to be required, including excavation and consolidation of containment structures in an on-site landfill and continuation of groundwater pump and treatment systems. ArcelorMittal USA is required to prevent acid mine drainage from discharging to surface waters at its closed mining operations in southwestern Pennsylvania. ArcelorMittal USA entered into a revised Consent Order and Agreement outlining a schedule for implementation of capital improvements and requiring the establishment of a treatment trust, estimated by the PaDEP to be the net present value of all future treatment cost. ArcelorMittal USA has been funding the treatment trust, which reached the target value in This target value is based on average spending over the last three years. The trust had a market value of 46 as of December 31, ArcelorMittal can be reimbursed from the fund for the continuing cost of treatment of acid mine drainage. ArcelorMittal USA s provisions for environmental liabilities include 31 for this matter. In 2006, the United States EPA Region V issued ArcelorMittal USA s Burns Harbor, Indiana facility a Notice of Violation ( NOV ) alleging multiple violations of the Clean Air Act s Prevention of Significant Deterioration ( PSD ) air permit requirements, based on alleged failures by Bethlehem Steel (a previous owner) dating back to early Based on recent court decisions and ongoing negotiations with the United States EPA, it is very likely that the United States EPA will not enforce the alleged PSD permit violations by Bethlehem Steel against ArcelorMittal USA. The United States EPA Region V also conducted a series of inspections and issued information requests under the Federal Clean Air Act relating to the Burns Harbor, Indiana Harbor and Cleveland facilities. Some of the EPA s information requests and subsequent allegations relate to recent operations while others relate to historical actions under former facility owners that occurred several years ago. In 2011, the United States EPA issued NOVs to Indiana Harbor, Burns Harbor and Cleveland alleging operational noncompliance based primarily on self-reported Title V permit concerns. Comprehensive settlement discussions with the United States EPA and affected state agencies involving all NOVs are ongoing and a comprehensive settlement with the United States EPA, which is anticipated to encompass self-reported non-compliance through at least December 31, 2015, is being finalized with execution anticipated in The settlement will include payment of penalties and injunctive relief. Efforts to mitigate the total penalty to be paid by proposing a supplemental environmental proposal are also being pursued. Liabilities associated with a comprehensive settlement are estimated at 12. In 2014, the ArcelorMittal Monessen coke plant was restarted after having been idled since Since re-start, state regulatory authorities ( PADEP ) issued numerous NOVs, the majority of which concerns Clean Air Act violations. United States EPA Region 3 also issued an NOV and, in addition, issued an information request seeking detailed testing and information concerning air compliance related issues. PADEP issued a proposed penalty assessment of 1 for alleged violations occurring from April 2014 through May Penalties are being finalized as part of comprehensive Consent Decree negotiations with PADEP and United States EPA enforcement officials and with Penn Environment, a local environmental group which filed a Citizen Suit under the Clean Air Act in The litigation was stayed in 2016 pending a final settlement which is expected in 2018 along with the final Consent Decree. Europe Environmental provisions for ArcelorMittal s operations in Europe total 473 and are mainly related to the investigation and remediation of environmental contamination at current and former operating sites in France (90), Belgium (248), Luxembourg (62), Poland (30), Germany (26), Czech Republic (10) and Spain (6). This investigation and remediation work relates to various matters such as decontamination of water discharges, waste disposal, cleaning water ponds and remediation activities that involve the clean-up of soil and groundwater. These provisions also relate to human health protection measures such as fire prevention and additional contamination prevention measures to comply with local health and safety regulations. France In France, there is an environmental provision of 90, principally relating to the remediation of former sites, including several coke plants, and the capping and monitoring of landfills or basins previously used for residues and secondary materials. The remediation of the coke plants concerns mainly the Thionville, Moyeuvre Grande, Homecourt, Hagondange and Micheville sites, and is related to treatment of soil and groundwater. At Moyeuvre Petite, the recovery of the slag is complete and ArcelorMittal is responsible for closure and final rehabilitation of the site. At other sites, ArcelorMittal is responsible for monitoring the concentration of heavy metals in soil and groundwater. ArcelorMittal Atlantique et Lorraine has an environmental provision that principally relates to the remediation and improvement of storage of secondary materials, the disposal of waste at different ponds and landfills and an action plan for removing asbestos from the installations and
171 Consolidated financial statements 171 mandatory financial guarantees to cover risks of major accident hazard or for gasholders and waste storage. Most of the provision relates to the stocking areas at the Dunkirk site that will need to be restored to comply with local law and to the mothballing of the liquid phase in Florange, including study and surveillance of soil and water to prevent environmental damage, treatment and elimination of waste and financial guarantees demanded by Public Authorities. The environmental provisions also include treatment of slag dumps at Florange and Dunkirk sites as well as removal and disposal of asbestos-containing material at the Dunkirk and Mardyck sites. Industeel France has an environmental provision that principally relates to ground remediation at the Le Creusot site and to the rehabilitation of waste disposal areas at the Châteauneuf site. Belgium In Belgium, there is an environmental provision of 248 of which the most significant elements are legal site remediation obligations linked to the closure of the primary installations at ArcelorMittal Belgium (Liège). The provisions also concern the external recovery and disposal of waste, residues or by-products that cannot be recovered internally on the ArcelorMittal Gent and Liège sites and the removal and disposal of asbestos-containing material. Luxembourg In Luxembourg, there is an environmental provision of 62, which relates to the post-closure monitoring and remediation of former production sites, waste disposal areas, slag deposits and mining sites. In 2007, ArcelorMittal Luxembourg sold the former Ehlerange slag deposit (93 hectares) to the State of Luxembourg. ArcelorMittal Luxembourg is contractually liable to clean the site and move approximately 400,000 cubic meters of material to other sites. ArcelorMittal Luxembourg also has an environmental provision to secure, stabilize and conduct waterproofing treatment on mining galleries and entrances and various dumping areas in Mondercange, Differdange and Dommeldange. In addition, ArcelorMittal Luxembourg has secured the disposal of laddle slag, sludge and certain other residues coming from different sites at the Differdange dump 1,000,000 cubic meters until mid A provision of 53 covers these obligations. ArcelorMittal Belval and Differdange has an environmental provision of 8 to clean historical landfills in order to meet the requirements of the Luxembourg Environment Administration and to cover dismantling and soil cleaning costs of the former PRIMOREC installation. Poland ArcelorMittal Poland S.A. s environmental provision of 30 mainly relates to the obligation to reclaim a landfill site and to dispose of the residues which cannot be internally recycled or externally recovered. The provision also concerns the storage and disposal of iron-bearing sludge which cannot be reused in the manufacturing process. Germany In Germany, the environmental provision of 26 essentially relates to ArcelorMittal Bremen s post-closure obligations mainly established for soil remediation, groundwater treatment and monitoring at the Prosper coke plant in Bottrop. Czech Republic In the Czech Republic, there is an environmental provision of 10, which essentially relates to the post-closure dismantling of buildings and soil remediation at the corresponding areas of the Ostrava site. Spain In Spain, ArcelorMittal España has environmental provisions of 6 due to obligations of sealing landfills basically located in the Asturias site and post-closure obligations in accordance with national legislation. These obligations include the collection and treatment of leachates that can be generated during the operational phase and a period of 30 years after the closure. South Africa AMSA has environmental provisions of 165 to be used over 15 years, mainly relating to environmental remediation obligations attributable to historical or legacy settling/ evaporation dams and waste disposal activities. An important determinant in the final timing of the remediation work relates to the obtaining of the necessary environmental authorizations. A provision of 40 relates to the decommissioned Pretoria Works site. This site is in a state of partial decommissioning and rehabilitation with one coke battery and a smallsections rolling facility still in operation. AMSA transformed this old plant into an industrial hub for light industry since the late 1990s. Particular effort is directed to landfill sites, with sales of slag from legacy disposal sites to vendors in the construction industry continuing unabated, but other remediation works continued at a slow pace as remediation actions for these sites are long-term in nature due to a complex legal process that needs to be followed with authorities and surrounding landowners. The Vanderbijlpark Works site, the main flat carbon steel operation of AMSA, contains a number of legacy facilities and areas requiring remediation. The remediation entails
172 172 Consolidated financial statements the implementation of rehabilitation and decontamination measures of waste disposal sites, waste water dams, ground water and historically contaminated open areas. 21 of the provision is allocated to this site. The Newcastle Works site is the main long carbon steel operation of AMSA. A provision of 34 is allocated to this site. As with all operating sites of AMSA, the above retirement and remediation actions dovetail with numerous large capital expenditure projects dedicated to environmental management. In the case of the Newcastle site, the major current environmental capital project is for air quality improvements. A provision of 67 relates to the environmental rehabilitation of the Thabazimbi Mine. In terms of the Amended and Restated Settlement and Supply Agreement between Sishen Iron Ore Company ("SIOC") and AMSA, AMSA is liable for the costs relating to the rehabilitation of SIOC's Thabazimbi iron ore mine for the period that it was a captive mine. The mine ceased to be a captive mine on December 31, The local board approved the takeover of the Thabazimbi mine from SIOC subject to the approval by the Department of Mineral Resources ("DMR") and a positive taxation ruling by the South African Revenue Services ("SARS"). The tax ruling is expected during the first quarter of AMSA and SIOC have been in discussions and will continue to engage the DMR in regards to the takeover of the mine. The remainder of the obligation of 3 relates to Vereeniging site for the historical pollution that needs to be remediated at waste disposal sites, waste water dams and groundwater aquifers. Canada In Canada, ArcelorMittal Dofasco has an environmental provision of 30 for the expected cost of remediating toxic sediment located in the Company s East Boatslip site, of which 2 is expected to be spent in ArcelorMittal Long Products Canada has an environmental provision of 6 for future disposal of sludge left in ponds after flat mills closure at Contrecoeur. The AROs in Ukraine are legal obligations for site rehabilitation at the iron ore mining site in Kryvyi Rih, upon closure of the mine pursuant to its restoration plan. The AROs in Canada are legal obligations for site restoration and dismantling of the facilities near the mining sites in Mont-Wright and Fire Lake, and the accumulation area of mineral substances at the facility of Port-Cartier in Quebec, upon closure of the mine pursuant to the restoring plan of the mines. The AROs in the United States principally relate to mine closure costs of the Hibbing and Minorca iron ore mines and Princeton coal mines. The AROs in Mexico relate to the restoration costs following the closure of the Las Truchas, El Volcan and the joint operation of Pena Colorada iron ore mines. In Belgium, the AROs are to cover the demolition costs for primary facilities at the Liège sites. In Spain, the AROs relate to the discontinuance of the activities of various assets within the upstream installations. In Germany, AROs principally relate to the Hamburg site, which operates on leased land with the contractual obligation to remove all buildings and other facilities upon the termination of the lease, and to the Prosper coke plant in Bottrop for filling the basin, restoring the layer and stabilizing the shoreline at the harbor. The AROs in South Africa are for the Pretoria, Vanderbijlpark, Saldanha, Newcastle as well as the Coke and Chemical sites, and relate to the closure and clean-up of the plant associated with decommissioned tank farms, tar plants, chemical stores, railway lines, pipelines and defunct infrastructure. In Brazil, the AROs relate to legal obligations to clean and restore the mining areas of Serra Azul and Andrade, both located in the State of Minas Gerais. The related provisions are expected to be settled in 2024 and 2029, respectively. In Kazakhstan, the AROs relate to the restoration obligations of the iron ore and coal mines. Asset Retirement Obligations ( AROs ) AROs arise from legal requirements and represent management s best estimate of the present value of the costs that will be required to retire plant and equipment or to restore a site at the end of its useful life. As of December 31, 2017, ArcelorMittal had established provisions for asset retirement obligations of 427, including 44 for Ukraine, 128 for Canada, 86 for the United States, 46 for Mexico, 15 for Belgium, 38 for Germany, 16 for South Africa, 12 for Spain, 11 for Brazil, 14 for Kazakhstan and 17 for Liberia. In Liberia, the AROs relate to iron ore mine and associated infrastructure and mine related environmental damage and compensation. They cover the closure and rehabilitation plan under both the current operating phase and the not yet completed Phase 2 expansion project. Tax Claims ArcelorMittal is a party to various tax claims. As of December 31, 2017, ArcelorMittal had recorded provisions in the aggregate of 126 for tax claims in respect of which it considers the risk of loss to be probable. Set out below is a summary description of the tax claims (i) in respect of which
173 Consolidated financial statements 173 ArcelorMittal had recorded a provision as of December 31, 2017, (ii) that constitute a contingent liability, or (iii) that were resolved in 2017, in each case involving amounts deemed material by ArcelorMittal. The Company is vigorously defending against the pending claims discussed below. Brazil In 2003, the Brazilian Federal Revenue Service granted ArcelorMittal Brasil (through its predecessor company, then known as CST) a tax benefit for certain investments. ArcelorMittal Brasil had received certificates from SUDENE, the former Agency for the Development of the Northeast Region of Brazil, confirming ArcelorMittal Brasil s entitlement to this benefit. In September 2004, ArcelorMittal Brasil was notified of the annulment of these certificates. ArcelorMittal Brasil has pursued its right to this tax benefit through the courts against both ADENE, the successor to SUDENE, and against the Brazilian Federal Revenue Service. The Brazilian Federal Revenue Service issued a tax assessment in this regard for 451 in December In December 2008, the administrative tribunal of first instance upheld the amount of the assessment. ArcelorMittal Brasil appealed to the administrative tribunal of second instance, and, on August 8, 2012, the administrative tribunal of the second instance found in favor of ArcelorMittal invalidating the tax assessment, thereby ending this case except for 6, which is still pending a final decision. On April 16, 2011, ArcelorMittal Brasil received a further tax assessment for the periods of March, June and September 2007, which, taking into account interest and currency fluctuations, amounted to 185 as of December 31, In October 2011, the administrative tribunal of first instance upheld the tax assessment received by ArcelorMittal Brasil on April 16, 2011, but decided that no penalty (amounting to 77 at that time) was due. Both parties have filed an appeal with the administrative tribunal of second instance. In 2011, SOL Coqueria Tubarão S.A. received 21 tax assessments from the Revenue Service of the State of Espirito Santo for ICMS (a value-added tax) in the total amount of 34 relating to a tax incentive (INVEST) used by the Company. The dispute concerns the definition of fixed assets. In August 2015, the administrative tribunal of first instance upheld 21 of the tax assessments, while also issuing decisions partially favorable to the Company in two of the cases. In September 2015, ArcelorMittal Tubarão filed appeals with respect to each of the administrative tribunal s decisions. As of December 31, 2017, there have been final unfavorable decisions at the administrative tribunal level in 15 of the 21 cases, each of which ArcelorMittal Tubarão is appealing to the judicial instance.the other six cases are pending decisions from the administrative tribunal of third instance. In 2011, ArcelorMittal Brasil received a tax assessment for corporate income tax (known as IRPJ) and social contributions on net profits (known as CSL) in relation to (i) the amortization of goodwill on the acquisition of Mendes Júnior Siderurgia (for the 2006 and 2007 fiscal years), (ii) the amortization of goodwill arising from the mandatory tender offer (MTO) made by ArcelorMittal to minority shareholders of Arcelor Brasil following the two-step merger of Arcelor and Mittal Steel N.V. (for the 2007 tax year), (iii) expenses related to pre-export financing used to finance the MTO, which were deemed by the tax authorities to be unnecessary for ArcelorMittal Brasil since the expenses were incurred to buy shares of its own company and (iv) CSL over profits of controlled companies in Argentina and Costa Rica. The amount claimed totals 589. On January 31, 2014, the administrative tribunal of first instance found in partial favor of ArcelorMittal Brasil, reducing the penalty component of the assessment from, according to ArcelorMittal Brasil s calculations, 266 to 141 (as calculated at the time of the assessment), while upholding the remainder of the assessment. The Brazilian Federal Revenue Service has appealed the administrative tribunal s decision to reduce the amount of the original penalty. ArcelorMittal Brasil has also appealed the administrative tribunal s decision to uphold the tax authority s assessment (including the revised penalty component). In September 2017, the administrative tribunal of second instance found largely in favor of the Federal Revenue. In January 2018, ArcelorMittal Brasil filed a motion for clarification of this decision. In 2013, ArcelorMittal Brasil received a tax assessment in relation to the tax years for IRPJ and CSL in relation to (i) the amortization of goodwill on the acquisition of Mendes Júnior Siderurgia, Dedini Siderurgia and CST, (ii) the amortization of goodwill arising from the mandatory tender offer made by ArcelorMittal to minority shareholders of Arcelor Brasil following the two-step merger of Arcelor and Mittal Steel N.V. and (iii) CSL and IRPJ over profits of controlled companies in Argentina, Costa Rica, Venezuela and the Netherlands. The amount claimed totals 517. In October 2014, the administrative tribunal of first instance found in favor of the Federal Revenue and ArcelorMittal Brasil filed its appeal in November In September 2017, the administrative tribunal of second instance found in favor of the Federal Revenue Service. ArcelorMittal Brasil filed a motion for clarification with respect to this decision, which was denied, and thereafter filed an appeal to the administrative tribunal of third instance In 2013, ArcelorMittal Brasil filed a lawsuit against the Federal Revenue disputing the basis of calculation of a tax called additional freight for the renewal of the Brazilian Merchant Navy ("AFRMM"), amounting to 50. The dispute is related to the inclusion of the unloading and land transport costs of the imported goods after landing to calculate AFRMM. In February 2017, ArcelorMittal Brasil obtained a favorable decision at first instance but this decision is subject to further mandatory review.
174 174 Consolidated financial statements For over 18 years, ArcelorMittal Brasil has been challenging the basis of the calculation of the Brazilian Cofins and Pis social security taxes (specifically, whether Brazilian VAT may be deducted from the base amount on which the Cofins and Pis taxes are calculated), in an amount of 4. ArcelorMittal Brasil deposited the disputed amount in escrow with the relevant Brazilian judicial branch when it became due. Since the principal amount bears interest at a rate applicable to judicial deposits, the amount stood at 55 as of December 31, In March 2017, the Supreme Court decided a separate case, not involving ArcelorMittal Brasil, on the same subject in favor of the relevant taxpayers. Such separate Supreme Court decision, which is of binding precedential value with respect to all similar cases, including those of ArcelorMittal Brasil, is being appealed by the Federal Revenue Service. In the period from 2014 to 2016, ArcelorMittal Brasil received 3 tax assessments from the Federal Revenue in the amount of 53 disputing its use of credits for PIS and COFINS social security taxes in 2010 and The dispute relates to the concept of production inputs in the context of these taxes. In 2017, in two cases, the administrative tribunal of second instance found partially in favor of ArcelorMittal Brasil, and the Company has filed an appeal to the administrative tribunal of third instance. In the third case, the administrative tribunal of first instance upheld the tax assessment, and the Company has appealed to the administrative tribunal of second instance. In May 2014, ArcelorMittal Comercializadora de Energia received a tax assessment from the state of Minas Gerais alleging that the Company did not correctly calculate tax credits on interstate sales of electricity from February 2012 to December The amount claimed totals 57. ArcelorMittal Comercializadora de Energia filed its defense in June Following an unfavorable administrative decision in November 2014, ArcelorMittal filed an appeal in December In March 2015, there was a further unfavorable decision at the second administrative level. Following the conclusion of this proceeding at the administrative level, the Company received the tax enforcement notice in December 2015 and filed its defense in February In April 2016, ArcelorMittal Comercializadora de Energia received an additional tax assessment in the amount, after taking account of a reduction of fines mentioned below, of 64, regarding the same matter, for infractions which allegedly occurred during the 2014 to 2015 period, and filed its defense in May In May 2017, there was a further unfavorable decision at the second administrative level in respect of the tax assessment received in April In June 2017, ArcelorMittal Comercializadora de Energia filed an appeal to the second administrative instance. This appeal was rejected in August In October and November 2017, the Company appealed in relation to both tax assessments to the judicial instance. In November 2017, the Company received a notice from the tax authority informing it of the reduction of the fines element by 18, due to the retroactive application of a new law. In the period from May to July 2015, ArcelorMittal Brasil received nine tax assessments from the state of Rio Grande do Sul alleging that the Company, through its branches in that state, had not made advance payments of ICMS on sales in that state covering the period from May 2010 to April The amount claimed totals 99. The administrative tribunal of first instance upheld the tax assessments in each of the nine cases, and ArcelorMittal Brasil appealed each of the administrative tribunal s decisions. Each case was decided unfavorably to ArcelorMittal Brasil at the administrative tribunal of second instance, and ArcelorMittal Brasil has appealed the cases to the judicial instance. On April 25, 2016, ArcelorMittal Brasil received a tax assessment in relation to (i) the amortization of goodwill resulting from Mittal Steel s mandatory tender offer to the minority shareholders of Arcelor Brasil following Mittal Steel s merger with Arcelor in 2007 and (ii) the amortization of goodwill resulting from ArcelorMittal Brasil s acquisition of CST in While the assessment, if upheld, would not result in a cash payment as ArcelorMittal Brasil did not have any tax liability for the fiscal years in question (2011 and 2012), it would result in the write-off of 292 worth of ArcelorMittal Brasil s net operating loss carryforwards and as a result could have an effect on net income over time. In May 2016, ArcelorMittal Brasil filed its defense, which was not accepted at the first administrative instance. On March 10, 2017, ArcelorMittal Brasil filed an appeal to the second administrative instance. On May 17, 2016, ArcelorMittal Brasil received a tax assessment from the state of Santa Catarina in the amount of 155 alleging that it had used improper methods to calculate the amount of its ICMS credits. ArcelorMittal Brasil filed its defense in July In December 2016, ArcelorMittal Brasil received an unfavorable decision at the first administrative level, in respect of which it has filed an appeal. France Following audits for 2006, 2007 and 2008 of ArcelorMittal France and other French ArcelorMittal entities, URSSAF, the French body responsible for collecting social contributions, commenced formal proceedings for these years alleging that the French ArcelorMittal entities owe 69 in social contributions on various payments, the most significant of which relate to profit sharing schemes, professional fees and stock options. Proceedings were commenced in relation to the 2006 claims in December Proceedings were commenced in relation to the 2007 and 2008 claims in February and March 2010, respectively. In three decisions dated December 10, 2012, the arbitration committee
175 Consolidated financial statements 175 hearing the matter found that social contributions in an amount of 17, 11 and 5 are due in respect of profit-sharing schemes, stock options and professional fees, respectively. These amounts cover the audits for 2006, 2007 and In March 2013, the Company filed appeals against the decisions relating to the profit-sharing schemes and stock options. Following audits for 2009, 2010 and 2011 of ArcelorMittal France and other French ArcelorMittal entities, URSSAF commenced formal proceedings in December 2012 for these years alleging that these entities owe 150 in social contributions (including interest and late fees relating thereto) on various payments, the most significant of which relate to voluntary separation schemes, profit sharing schemes, professional fees and stock options. In its decision dated April 24, 2013, the arbitration committee reduced the amount claimed by 29. The dispute then entered into a judicial phase before the Tribunal des Affaires de Sécurité Sociale ( TASS ). At a hearing on January 12, 2017 before the TASS, the parties signed a conciliation agreement settling the audits covered by the two cases. Mexico constitute a contingent liability, or (iii) that were resolved in 2017, in each case involving amounts deemed material by ArcelorMittal. The Company is vigorously defending against each of the pending claims discussed below. Brazil In September 2000, two construction trade organizations filed a complaint with Brazil s Administrative Council for Economic Defence ( CADE ) against three long steel producers, including ArcelorMittal Brasil. The complaint alleged that these producers colluded to raise prices in the Brazilian rebar market, thereby violating applicable antitrust laws. In September 2005, CADE issued its final decision against ArcelorMittal Brasil, imposing a fine of 61. ArcelorMittal Brasil appealed the decision to the Brazilian Federal Court. In September 2006, ArcelorMittal Brasil offered a guarantee letter and obtained an injunction to suspend enforcement of this decision pending the court s judgment. In September 2017, the Court found against ArcelorMittal Brasil. In October 2017, ArcelorMittal Brasil filed a motion for clarification of this decision, which was denied. In December 2017, ArcelorMittal Brasil filed an appeal to the second judicial instance. In 2015, the Mexican Tax Administration Service issued three tax assessments to ArcelorMittal Mexico, alleging that ArcelorMittal Mexico owes 142 in respect of (i) improper interest deductions relating to certain loans, (ii) unpaid corporate income tax for interest payments improperly categorized as profit, and (iii) improper payment deductions for branding fee services and IT services in ArcelorMittal Mexico filed an annulment complaint in respect of each of the aforementioned assessments in November In November 2017, ArcelorMittal Mexico filed a nullity application before the Tax and Administrative Justice Court. There is also a related class action commenced by the Federal Public Prosecutor of the state of Minas Gerais against ArcelorMittal Brasil for damages in an amount of 67 based on the alleged violations investigated by CADE. In 2007, the Mexican Tax Administration Service issued tax assessments to ArcelorMittal Las Truchas, alleging that ArcelorMittal Las Truchas owes 72 in respect of (i) nonpayment of withholding tax on capitalized interest, (ii) nondeduction of accrual interest regarding certain loans, and (iii) reduction of assets tax taxable basis in ArcelorMittal Las Truchas filed annulment complaints in respect of each of the aforementioned assessments in 2015, which the Tax Authorities dismissed in November Following the dismissal of the annulment complaints, the matter is currently before the Tax and Administrative Justice Court. Romania Competition/Antitrust Claims ArcelorMittal is a party to various competition/antitrust claims. As of December 31, 2017, ArcelorMittal had recorded provisions in the aggregate of 6 for such claims. Set out below is a summary description of competition/ antitrust claims (i) in respect of which ArcelorMittal had recorded a provision as of December 31, 2017, (ii) that A further related lawsuit was commenced in February 2011 by four units of Sinduscons, a civil construction trade organization, in federal court in Brasilia against, inter alia, ArcelorMittal Brasil claiming damages based on an alleged cartel in the rebar market as investigated by CADE and as noted above. In 2010 and 2011, ArcelorMittal Galati entered into high volume electricity purchasing contracts with Hidroelectrica, a partially state-owned electricity producer. Following allegations by Hidroelectrica s minority shareholders that ArcelorMittal Galati (and other industrial electricity consumers) benefited from artificially low tariffs, the European Commission opened a formal investigation into alleged state aid in April The European Commission announced on June 12, 2015 that electricity supply contracts signed by Hidroelectrica with certain electricity traders and industrial customers (including the one entered by ArcelorMittal Galati) did not involve state aid within the meaning of the EU rules. In March 2017, the European Commission's decision was officially published. As no challenge was filed within two months of publication, the decision has become definitive.
176 176 Consolidated financial statements South Africa In February 2007, the complaint previously filed with the South African Competition Commission by Barnes Fencing, a South African producer of galvanized wire, alleging that ArcelorMittal South Africa, as a dominant firm, discriminated in pricing its low carbon wire rod was referred to the Competition Tribunal. The Competition Commission seeks an order declaring that ArcelorMittal South Africa s pricing in in respect of low carbon wire rod amounted to price discrimination and an order that ArcelorMittal South Africa cease its pricing discrimination. In March 2008, the Competition Tribunal accepted the claimants application for leave to intervene. In November 2012, a second complaint alleging price discrimination regarding the same product over the 2004 to 2006 period was referred by the Competition Commission to the Competition Tribunal. ArcelorMittal is unable to assess the outcome of these proceedings or the amount of ArcelorMittal South Africa s potential liability, if any. On September 1, 2009, the South African Competition Commission referred a complaint against four producers of long carbon steel in South Africa, including ArcelorMittal South Africa, and the South African Iron and Steel Institute to the Competition Tribunal. The complaint referral followed an investigation into alleged collusion among the producers initiated in April 2008, on-site inspections conducted at the premises of some of the producers and a leniency application by Scaw South Africa, one of the producers under investigation. The Competition Commission recommended that the Competition Tribunal impose an administrative penalty against ArcelorMittal South Africa, Cape Gate and Cape Town Iron Steel Works in the amount of 10% of their annual revenues in South Africa (in the year preceding any final decision) and exports from South Africa for ArcelorMittal filed an application to access the file of the Competition Commission that was rejected. ArcelorMittal appealed the decision to reject the application, and applied for a review of that decision and a suspension of the obligation to respond to the referral on the substance pending final outcome on the application for access to the documents. The appeal was upheld by the Competition Appeals Court (CAC) and the matter was referred back to the Competition Tribunal for a determination of confidentiality and scope of access to the documents. The Competition Commission appealed the decision of the CAC, and, on May 31, 2013, the Supreme Court of Appeal dismissed the appeal of the Competition Commission and confirmed the decision of the CAC. In 2014, ArcelorMittal South Africa requested the documents from the Competition Commission, which provided an index thereof. On July 7, 2011, ArcelorMittal filed an application before the Competition Tribunal to set aside the complaint referral based on procedural irregularities but this application was withdrawn by notice dated August 7, In March 2012, the South African Competition Commission referred to the Competition Tribunal an allegation that ArcelorMittal South Africa and steel producer Highveld acted by agreement or concerted practice to fix prices and allocate markets in respect of certain flat carbon steel products over a period of 10 years ( ) in contravention of the South African Competition Act. In August 2013, the South African Competition Commission referred a complaint against four scrap metal purchasers in South Africa, including ArcelorMittal South Africa, to the South African Competition Tribunal for prosecution. The complaint alleged collusion among the purchasers to fix the price and other trading conditions for the purchase of scrap over a period from 1998 to at least In relation to all these cases, following an extensive engagement, ArcelorMittal South Africa reached an agreement on an overall settlement with the Competition Commission for an amount of 1.5 billion South African rand (approximately 110). In October 2016, Barnes Fencing filed an application with the Competition Tribunal to review and set aside the said settlement agreement in respect of the Barnes matters. In addition, Barnes filed an objection to the settlement agreement and an application to stay. The settlement agreement, as amended to exclude the Barnes case referred to above, was approved, subject to minor amendments, by the Competition Tribunal, on November 16, Germany In the first half of 2016, the German Federal Cartel Office carried out unannounced investigations of ArcelorMittal Ruhrort GmbH and ArcelorMittal Commercial Long Deutschland GmbH following alleged breaches of antitrust rules concerning (i) collusion regarding scrap and alloy surcharges from the 1990s through November 2015 and (ii) impermissible exchanges of sensitive information between competitors since early ArcelorMittal Ruhrort GmbH and ArcelorMittal Commercial Long Deutschland GmbH are cooperating with the German Federal Cartel Office. In March 2017, the Federal Cartel Office formally notified ArcelorMittal S.A., ArcelorMittal Commercial Sections S.A. and certain other parties that they were also being included in the investigation. The Company received the Federal Cartel Office's Preliminary Statement, setting out its thencurrent view of the facts, in August Since December 2017, ArcelorMittal and the Federal Cartel Office have been engaged in discussions in relation to the Preliminary Statement of Facts and the future course of the investigation including avenues for resolution of the matter. In August 2017, the German Federal Cartel Office carried out unannounced investigations of ArcelorMittal Bremen, ArcelorMittal Eisenhüttenstadt GmbH and ArcelorMittal Berlin Holding GmbH principally relating to alleged breaches of antitrust rules concerning (i) agreement between flat steel
177 Consolidated financial statements 177 producers regarding extras from June March 2016 (ii) impermissible exchanges of sensitive information between competitors from and (iii) agreement to continue market and price structure introduced by the European Coal and Steel Community from ArcelorMittal is reviewing the allegations and, at this time, is unable to assess the outcome of any proceedings or the amount of its potential liability, if any. Other Legal Claims ArcelorMittal is a party to various other legal claims. As of December 31, 2017, ArcelorMittal had recorded provisions of 196 for other legal claims in respect of which it considers the risk of loss to be probable. Set out below is a summary description of the other legal claims (i) in respect of which ArcelorMittal had recorded a provision as of December 31, 2017, (ii) that constitute a contingent liability, (iii) that were resolved in 2017, or (iv) that were resolved and had a financial impact in 2015 or 2016, in each case involving amounts deemed material by ArcelorMittal. The Company is vigorously defending against each of the claims discussed below that remain pending. Argentina Over the course of 2007 to 2017, the Argentinian Customs Office Authority (Aduana) notified the Company of certain inquiries that it is conducting with respect to prices declared by the Company s Argentinian subsidiary, Acindar, related to iron ore imports. The Customs Office Authority is seeking to determine whether Acindar incorrectly declared prices for iron ore imports from several different Brazilian suppliers and from ArcelorMittal Sourcing on 38 different claims concerning several shipments made between 2002 and The aggregate amount claimed by the Customs Office Authority in respect of all of the shipments is 223. The investigations are subject to the administrative procedures of the Customs Office Authority and are at different procedural stages depending on the filing date of the investigation. As of December 31, 2017, in 25 of the total 38 cases, the administrative branch of the Customs Office Authority ruled against Acindar (representing total claims of 69). These decisions have been appealed to the Argentinian National Fiscal Court. In 2017, 3 of the cases were decided by the National Fiscal Court, all in favor of Acindar, representing claims of 10 and one is definitive, not having been appealed by Customs Office Authority. Canada In April 2011, a proceeding was commenced before the Ontario (Canada) Superior Court of Justice under the Ontario Class Proceedings Act, 1992, against ArcelorMittal, Baffinland, and certain other parties relating to the January 2011 take-over of Baffinland by ArcelorMittal, Nunavut Iron Ore Holdings and Ontario Inc. The action seeks the certification of a class comprised of all Baffinland securities holders who tendered their Baffinland securities, and whose securities were taken up, in connection with the take-over between September 22, 2010 and February 17, 2011, or otherwise disposed of their Baffinland securities on or after January 14, The action alleges that the tender offer documentation contained certain misrepresentations and seeks damages in an aggregate amount of 797 (CAD$1 billion) or rescission of the transfer of the Baffinland securities by members of the class. The class certification hearings were held in January 2018, a decision is pending. Italy In January 2010, ArcelorMittal received notice of a claim filed by Finmasi S.p.A. relating to a memorandum of agreement ( MoA ) entered into between ArcelorMittal Distribution Services France ( AMDSF ) and Finmasi in The MoA provided that AMDSF would acquire certain of Finmasi s businesses for an amount not to exceed 112, subject to the satisfaction of certain conditions precedent, which, in AMDSF s view, were not fulfilled. Finmasi sued for (i) enforcement of the MoA, (ii) damages of 17 to 28 or (iii) recovery costs plus quantum damages for Finmasi s alleged lost opportunity to sell to another buyer. In September 2011, the court rejected Finmasi s claims other than its second claim. The court appointed an expert to determine the quantum of damages. In May 2013, the expert s report was issued and valued the quantum of damages in the range of 45 to 71. ArcelorMittal appealed the decision on the merits. In May 2014, the Court of Appeals issued a decision rejecting ArcelorMittal s appeal. On June 20, 2014, ArcelorMittal filed an appeal of the Court of Appeal s judgment with the Italian Court of Cassation. On December 18, 2014, the Court of Milan issued a decision on the quantum of the damages and valued the quantum of damages in the sum of 25 plus interest. In June 2015, both parties served appeals of the decision on the quantum, with ArcelorMittal also seeking the suspension of the enforceability of the decision. On July 1, 2015, Finmasi formally notified to AMDSF the declaration of enforcement of the decision of December 18, On July 28, 2015, AMDSF filed an appeal against such declaration with the Court of Appeal of Reims in France. At a hearing on December 1, 2015, the Italian Court of Appeal accepted the suspension of the enforcement of the decision of December 18, 2014, following the agreement of AMDSF to provide a guarantee for its value. In March 2016, on the joint application of the parties, the Court of Appeal of Reims ordered the suspension of the proceedings. Luxembourg In June 2012, the Company received writs of summons in respect of claims made by 59 former employees of ArcelorMittal Luxembourg. The claimants allege that they are owed compensation based on the complementary pension scheme that went into effect in Luxembourg in January The aggregate amount claimed by such
178 178 Consolidated financial statements former employees (bearing in mind that other former employees may bring similar claims) is 71. Given the similarities in the claims, the parties agreed to limit the pending proceedings to four test claims. In April 2013, the Esch-sur-Alzette labor court rejected two of these test claims. The relevant plaintiffs are appealing these decisions. In November 2013, the Luxembourg city labor court rejected the two other test claims, which are also being appealed. France Certain subsidiaries of the ArcelorMittal group are parties to proceedings, dating from 2010, against Engie and Engie Thermique France which claim damages in the amount of 163 or alternatively 173 for an alleged wrongful termination of a contract for the transformation of steel production gas into electricity. The ArcelorMittal subsidiaries have filed a counterclaim in the amount of 146. The contract had been entered into in 2006 for a term of 20 years. ArcelorMittal Méditerranée terminated it in July 2010 on the basis that Engie was solely responsible for the delay in the commissioning of the power plant (which suffered from significant malfunctions) constructed for the transformation of steel production gas into electricity. Engie claims that ArcelorMittal was in breach of the contract at the time of the termination due to certain alleged issues with the furnishing and quality of its steel production gas, and therefore unable to terminate the contract based on the sole breaches of Engie. The case is before the Commercial Court of Nanterre; pleadings on the substance took place on February 9, ArcelorMittal is vigorously defending itself in this matter and vigorously pursuing its counterclaim. Retired and current employees of certain French subsidiaries of the former Arcelor have initiated lawsuits to obtain compensation for asbestos exposure in excess of the amounts paid by French social security ( Social Security ). Asbestos claims in France initially are made by way of a declaration of a work-related illness by the claimant to the Social Security authorities resulting in an investigation and a level of compensation paid by Social Security. Once the Social Security authorities recognize the work-related illness, the claimant, depending on the circumstances, can also file an action for inexcusable negligence (faute inexcusable) to obtain additional compensation from the company before a special tribunal. Where procedural errors are made by Social Security, it is required to assume full payment of damages awarded to the claimants. Due to fewer procedural errors made by Social Security, changes in the regulations and, consequently, fewer rejected cases, ArcelorMittal has been required to pay some amounts in damages since The number of claims outstanding for asbestos exposure at December 31, 2017 was 404 as compared to 394 at December 31, The range of amounts claimed for the year ended December 31, 2017 was $35,979 to $779,545. The aggregate costs and settlements for the year ended December 31, 2017 were 6.4, of which 0.25 represented legal fees and 6.1 represented damages paid to the claimant. The aggregate costs and settlements for the year ended December 31, 2016 were 7.8, of which 0.22 represented legal fees and 7.6 represented damages paid to the claimant. Minority Shareholder Claims Regarding the Exchange Ratio in the Second-Step Merger of ArcelorMittal into Arcelor ArcelorMittal is the company that results from the acquisition of Arcelor by Mittal Steel N.V. in 2006 and a subsequent two-step merger between Mittal Steel and ArcelorMittal and then ArcelorMittal and Arcelor. Following completion of this merger process, several former minority shareholders of Arcelor or their representatives brought legal proceedings regarding the exchange ratio applied in the second-step merger between ArcelorMittal and Arcelor and the merger process as a whole. ArcelorMittal believes that the allegations made and claims brought by such minority shareholders are without merit and that the exchange ratio and merger process complied with the requirements of applicable law, were consistent with previous guidance on the principles that would be used to determine the exchange ratio in the second-step merger and that the merger exchange ratio was relevant and reasonable to shareholders of both merged entities. Set out below is a summary of ongoing matters in this regard. Several other claims brought before other courts and regulators were dismissed and are definitively closed. On January 8, 2008, ArcelorMittal received a writ of summons on behalf of four hedge fund shareholders of Arcelor to appear before the civil court of Luxembourg. The summons was also served on all natural persons sitting on the Board of Directors of ArcelorMittal at the time of the merger and on the Significant Shareholder. The plaintiffs alleged in particular that, based on Mittal Steel s and Arcelor s disclosure and public statements, investors had a legitimate expectation that the exchange ratio in the secondstep merger would be the same as that of the secondary exchange offer component of Mittal Steel s June 2006 tender offer for Arcelor (i.e., 11 Mittal Steel shares for 7 Arcelor shares), and that the second-step merger did not comply with certain provisions of Luxembourg company law. They claimed, inter alia, the cancellation of certain resolutions (of the Board of Directors and of the Shareholders meeting) in connection with the merger, the grant of additional shares, or damages in an amount of 216. By judgment dated November 30, 2011, the Luxembourg civil court declared all of the plaintiffs claims inadmissible and dismissed them. The judgment was appealed in May By judgment dated February 15, 2017, the Luxembourg Court of Appeal declared all but one of the plaintiffs claims inadmissible, remanded the proceedings on the merits to the lower court with respect to the admissible
179 Consolidated financial statements 179 claimant and dismissed all other claims. In June 2017, the plaintiffs filed an appeal of this decision to the Court of Cassation. On May 15, 2012, ArcelorMittal received a writ of summons on behalf of Association Actionnaires d'arcelor ( AAA ), a French association of former minority shareholders of Arcelor, to appear before the civil court of Paris. In such writ of summons, AAA claimed (on grounds similar to those in the Luxembourg proceedings summarized above) inter alia damages in a nominal amount and reserved the right to seek additional remedies including the cancellation of the 8.3 merger. The proceedings before the civil court of Paris have been stayed, pursuant to a ruling of such court on July 4, 2013, pending a preparatory investigation (instruction préparatoire) by a criminal judge magistrate (juge d instruction) triggered by the complaints (plainte avec constitution de partie civile) of AAA and several hedge funds (who quantified their total alleged damages at 296), including those who filed the claims before the Luxembourg courts described (and quantified) above. Commitments December 31, 2017 Purchase commitments ,734 24,432 Guarantees, pledges and other collateral 5,021 4,424 Non-cancellable operating leases 1,311 1,312 Capital expenditure commitments Other commitments Total Purchase commitments Purchase commitments consist primarily of major agreements for procuring iron ore, coking coal, coke and hot metal. The Company also has a number of agreements for electricity, industrial and natural gas, scrap and freight. In addition to those purchase commitments disclosed above, the Company enters into purchasing contracts as part of its normal operations which have minimum volume requirements but for which there are no take-or-pay or penalty clauses included in the contract. The Company does not believe these contracts have an adverse effect on its liquidity position. Purchase commitments include commitments given to associates for 520 and 480 as of December 31, 2017 and 2016, respectively. Purchase commitments include commitments given to joint ventures for 1,550 and 1,386 as of December 31, 2017 and 2016, respectively. Commitments given to joint ventures include 1,481 and 1,314 related to purchase of the output from Tameh as of December 31, 2017 and 2016, respectively. Guarantees, pledges and other collateral Guarantees related to financial debt and credit lines given on behalf of third parties were 266 and 131 as of December 31, 2017 and 2016, respectively. Additionally, 13 1,206 1,432 33,150 32,066 and 11 were related to guarantees given on behalf of associates as of December 31, 2017 and 2016, respectively. Guarantees of 1,022 and 1,028 were given on behalf of joint ventures as of December 31, 2017 and 2016, respectively. Guarantees given on behalf of joint ventures include 406 and 463 for the guarantees issued on behalf of Calvert and 382 and 403 for the guarantees issued on behalf of Al Jubail as of December 31, 2017 and 2016, respectively. Pledges and other collateral mainly relate to inventories and receivables pledged to secure the South African Rand revolving borrowing base finance facility for the amount drawn of 299, ceded bank accounts to secure environmental obligations, true sale of receivables programs and the revolving base finance facility in South Africa of 169 and mortgages entered into by the Company s operating subsidiaries.pledges of property, plant and equipment were 282 and 256 as of December 31, 2017 and 2016, respectively. Other sureties, first demand guarantees, letters of credit, pledges and other collateral included 419 and nil of commitments given on behalf of associates as of December 31, 2017 and Other sureties, first demand guarantees, letters of credit, pledges and other collateral included 164 and 114 of commitments given on behalf of joint ventures as of December 31, 2017 and 2016, respectively.
180 180 Consolidated financial statements Non-cancellable operating leases The Company leases various facilities, land and equipment under non-cancellable lease arrangements. Future minimum lease payments required under operating leases that have initial or remaining non-cancellable terms as of December 31, 2017 and 2016 according to maturity periods are as follows: December 31, Less than 1 year years years More than 5 years ,311 1,312 Total Non-cancellable operating leases include time charter arrangements for shipping activities. The operating leases expense was 542, 521 and 538 in 2017, 2016 and 2015, respectively. The non-cancellable operating leases commitments at December 31, 2017 are related to plant, machinery and equipment (843), buildings (233), land (187) and other (48). Capital expenditure commitments Capital expenditure commitments mainly relate to commitments associated with investments in expansion and improvement projects by various subsidiaries. In 2014, ArcelorMittal Atlantique et Lorraine committed to investment programs in connection with the Florange site and ArcelorMittal Belgium in connection with the closure of the Liège site. The remaining capital expenditure commitments were 3 and 0 as of December 31, 2017, respectively. In 2016, AMSA committed to an investment program in connection with the competition commission settlement. The remaining capital expenditure commitment was 212 as of December 31, Capital expenditure commitments also include 520 for the $1 billion, three-year investment program at the Company's Mexican operations announced in 2017, which is focused on building ArcelorMittal Mexico s downstream capabilities. The main investment will be the construction of a new hot strip mill with capacity of approximately 2.5 million tonnes. Other commitments Other commitments given comprise mainly commitments incurred for gas supply to electricity suppliers. Commitments to sell In addition to the commitments presented above, the Company has firm commitments to sell for which it also has firm commitments to purchase included in purchase commitments for 286 and 366 as of December 31, 2017 and 2016, respectively, and mainly related to natural gas and electricity. Note 9: Income taxes The current tax payable (recoverable) is based on taxable profit (loss) for the year. Taxable profit differs from profit as reported in the consolidated statements of operations because it excludes items of income or expense that are taxable or deductible in other years or are never taxable or deductible. The Company s current income tax expense (benefit) is calculated using tax rates that have been enacted or substantively enacted as of the date of the consolidated statements of financial position. Tax is charged or credited to the consolidated statements of operations, except when it relates to items charged or credited to other comprehensive income or directly to equity, in which case the tax is recognized in other comprehensive income or in equity. Deferred tax is recognized on differences between the carrying amounts of assets and liabilities, in the consolidated financial statements and the corresponding tax basis used in the computation of taxable profit, and is accounted for using the statements of financial position liability method. Deferred tax liabilities are generally recognized for all taxable temporary differences, and deferred tax assets are generally recognized for all deductible temporary differences and net operating loss carry forwards to the extent that it is probable that taxable profits will be available against which those deductible temporary differences can be utilized. Such assets and liabilities are not recognized if the taxable temporary difference arises from the initial recognition of nondeductible goodwill or if the differences arise from the initial recognition (other than in a business combination) of other assets and liabilities in a transaction that affects neither the taxable profit nor the profit reported in the consolidated statements of operations. Deferred tax liabilities are recognized for taxable temporary differences associated with investments in subsidiaries, associates and joint ventures, except if the Company is able
181 Consolidated financial statements 181 to control the reversal of the temporary difference and it is probable that the temporary difference will not reverse in the foreseeable future. Deferred tax assets arising from deductible temporary differences associated with such investments are only recognized to the extent that it is probable that there will be sufficient taxable profits against which the benefits of the temporary differences can be utilized and are expected to reverse in the foreseeable future. Deferred tax assets and liabilities are measured at the tax rates that are expected to apply in the period in which the liability is settled or the asset realized, based on tax rates (and tax laws) that have been enacted or substantively enacted by the consolidated statements of financial position date. The measurement of deferred tax assets and liabilities reflects the tax consequences that would follow from the manner in which the Company expects, at the reporting date, to recover or settle the carrying amount of its assets and liabilities. reduced to the extent that it is no longer probable that sufficient taxable profits will be available to enable all or part of the asset to be recovered. The Company reviews the deferred tax assets in the different jurisdictions in which it operates to assess the possibility of realizing such assets based on projected taxable profit, the expected timing of the reversals of existing temporary differences, the carry forward period of temporary differences and tax losses carried forward and the implementation of tax-planning strategies. Due to the numerous variables associated with these judgments and assumptions, both the precision and reliability of the resulting estimates of the deferred tax assets are subject to substantial uncertainties. Deferred tax assets and liabilities are offset when there is a legally enforceable right to set off current tax assets against current tax liabilities, when they relate to income taxes levied by the same taxation authority and when the Company intends to settle its current tax assets and liabilities on a net basis. The carrying amount of deferred tax assets is reviewed at each consolidated statements of financial position date and 9.1 Income tax expense (benefit) The components of income tax expense (benefit) are summarized as follows: Year Ended December 31, Total deferred tax expense (benefit) (151) Total income tax expense (benefit) Total current tax expense (benefit) The following table reconciles the expected tax expense (benefit) at the statutory rates applicable in the countries where the Company operates to the total income tax expense (benefit) as calculated: Year Ended December 31, Net income (loss) (including non-controlling interests) ,575 1,734 (8,423) Income (loss) before tax 5,007 2,720 (7,521) Tax expense (benefit) at the statutory rates applicable to profits (losses) in the countries1 1, (2,146) Income tax expense (benefit) Permanent items (522) (5,940) 902 (2,124) (94) 593 Net change in measurement of deferred tax assets (281) 5,344 4,940 Tax effects of foreign currency translation Rate changes (157) Tax credits (66) (21) (13) Other taxes Others Income tax expense (benefit) 1. Tax expense (benefit) at the statutory rates is based on income (loss) before tax excluding income (loss) from investments in associates and joint ventures. ArcelorMittal s consolidated income tax expense (benefit) is affected by the income tax laws and regulations in effect in the various countries in which it operates and the pre-tax results of its subsidiaries in each of these countries, which can change from year to year. ArcelorMittal operates in jurisdictions, mainly in Eastern Europe and Asia, which have a structurally lower corporate
182 182 Consolidated financial statements income tax rate than the statutory tax rate as enacted in Luxembourg (26.01%), as well as in jurisdictions, mainly in Western Europe, Brazil and Mexico, which have a structurally higher corporate income tax rate. Permanent items 2017 Tax deductible write-downs on shares and receivables (652) Year Ended December 31, (5,971) (2,622) Non tax deductible goodwill impairment 250 Non tax deductible hyperinflationary adjustment (34) Taxable income (tax loss) of AMTFS Taxable dividends Other permanent items 73 Total permanent items (522) Tax deductible write-downs on shares and receivables: in connection with the Company's impairment test for goodwill and property, plant and equipment ( PP&E ), the recoverability of the carrying amounts of investments in shares and intragroup receivables is also reviewed annually, resulting in tax deductible write-downs of the values of loans and shares of consolidated subsidiaries in Luxembourg. Non tax deductible goodwill impairment: in 2015 ArcelorMittal impaired the goodwill related to the Mining segment for a total amount of 0.9 billion (see note 5.3). Non tax deductible hyperinflationary adjustment: nonmonetary items in Venezuela are revalued according to the inflation rate for tax purposes. The resulting difference is non-deductible to the extent it generates a tax loss. Taxable income of AMTFS: ArcelorMittal Treasury Financial Services S.à r.l. ( AMTFS ), a subsidiary of ArcelorMittal Treasury Americas LLC ( AMTAUS ), is a limited liability company organized under the laws of Luxembourg subject to taxation in Luxembourg on its worldwide income. AMTFS has filed an election to be treated as a disregarded entity for United States federal income tax purposes. Taxable dividend: the dividends received from some of the ArcelorMittal subsidiaries are subject to tax in the receiving country with the corresponding (foreign) tax credit available. Rate changes The 2017 tax benefit from rate changes of (94) is mainly due to the impact of the decrease in the future income tax rate on deferred tax liabilities in Belgium (60), France (31), Argentina and USA. The 2016 tax expense from rate changes of 593 is mainly due to the impact of the decrease in the future income tax rate on deferred tax assets in Luxembourg resulting in tax expense of 647, partly offset by a tax benefit of (50) in France. (30) (62) (5,940) (2,124) Net change in measurement of deferred tax assets The 2017 net change in measurement of deferred tax assets of (281) primarily consists of tax expense of 652 due to the unrecognized part of deferred tax assets on writedowns of the value of shares and loans of consolidated subsidiaries in Luxembourg, tax expense of 364 due to nonrecognition and derecognition of other deferred tax assets in other tax jurisdictions, partially offset by an additional recognition of deferred tax assets for losses and other deductible temporary differences of previous years of (1,297). In 2017, the Company recognized 1.1 billion of previously unrecognized deferred tax assets relating to the Luxembourg tax integration. The recognition in Luxembourg includes 0.3 billion increase in projections of future taxable income in Luxembourg driven primarily by the improved market conditions of the steel industry and higher financial income mainly from further reduction in the forecasted interest expense following improved credit rating. The 2016 net change in measurement of deferred tax assets of 5,344 primarily consists of tax expense of 5,971 due to the unrecognized part of deferred tax assets on write-downs of the value of shares and loans of consolidated subsidiaries in Luxembourg, tax expense of 285 due to non-recognition and derecognition of other deferred tax assets in other tax jurisdictions, partially offset by an additional recognition of deferred tax assets for losses and other deductible temporary differences of previous years of (912). In 2016, the Company recognized 0.4 billion of previously unrecognized deferred tax assets relating to the Luxembourg tax integration. The recognition in Luxembourg includes a 0.8 billion increase in projections of future taxable income in Luxembourg driven primarily by the improved market conditions of the steel industry and higher interest income from favorable foreign exchange rate relating to the funding of Group subsidiaries as well as further reduction in the forecasted interest expense following debt repayments. This recognition is partially offset by a derecognition of 0.7 billion related to revised expectations of euro denominated deferred tax assets recoverability in U.S. dollars terms.
183 Consolidated financial statements 183 The 2015 net change in measurement of deferred tax assets of 4,940 primarily consists of tax expense of 2,622 due to the unrecognized part of deferred tax assets on write-downs of the value of shares of consolidated subsidiaries in Luxembourg, tax expense of 2,405 due to non-recognition and derecognition of other deferred tax assets in other tax jurisdictions, partially offset by additional recognition of deferred tax assets for losses and other deductible temporary differences of previous years of (87). In 2015, the Company derecognized 0.4 billion of previously recognized deferred tax assets, out of which 0.3 billion relates to the Luxembourg tax integration. The derecognition in Luxembourg represents the net reduction in projections of future taxable income in Luxembourg driven primarily by the challenging market conditions affecting the steel industry and unfavorable foreign exchange movements, partially offset by reductions in forecasted interest expense due to the Company s announced plans in 2016 to repay debt with proceeds from a 3 billion equity rights offering and selling its 35% shareholding in Gestamp for 875 million. The taxable income projection also included the effect of the anticipated elimination of the current USD exposure of Luxembourgish deferred tax assets denominated in euro. Tax effects of foreign currency translation The tax effects of foreign currency translation of (157), 73 and 153 at December 31, 2017, 2016 and 2015 respectively, refer mainly to deferred tax assets and liabilities of certain entities with a different functional currency than the currency applied for tax filing purposes. In 2017, the effects are mainly due to the depreciation of the U.S. dollar against the euro. Tax credits The tax credits are mainly attributable to the Company s operating subsidiaries in Brazil, Mexico and Spain. They relate to credits claimed on foreign investment, credits for research and development and tax sparing credits. Other taxes Other taxes mainly include withholding taxes on dividends, services, royalties and interests as well as mining duties in Canada and Mexico, and state tax in the United States. Others 2017 Year Ended December 31, (8) Prior period taxes (7) (18) 96 Others 55 3 (14) Total Tax contingencies/settlements 74 In 2016, others of 134 primarily consist of uncertain tax positions for 149 mainly related to Europe and North America. In 2015, others of 74 primarily consist of prior period taxes for 96 related mainly to Luxembourg and Mexico. 9.2 Income tax recorded directly in equity Year Ended December 31, Unrealized gain (loss) on derivative financial instruments (77) (1) 4 Recognized actuarial gain (loss) (42) (1) 47 (90) 27 (83) (209) 25 (32) 25 (32) Recognized in other comprehensive income on: Deferred tax expense (benefit) Foreign currency translation adjustments Recognized directly in equity on: Deferred tax expense (benefit) Others Total 9 (200)
184 184 Consolidated financial statements 9.3 Uncertain tax positions The Company operates in multiple jurisdictions with complex legal and tax regulatory environments. In certain of these jurisdictions, ArcelorMittal has taken income tax positions that management believes are supportable and are intended to withstand challenge by tax authorities. Some of these positions are inherently uncertain and include those relating to transfer pricing matters and the interpretation of income tax laws applied in complex transactions. The Company periodically reassesses its tax positions. Changes to the financial statement recognition, measurement, and disclosure of tax positions are based on management s best judgment given any changes in the facts, circumstances, information available and applicable tax laws. Considering all available information and the history of resolving income tax uncertainties, the Company believes that the ultimate resolution of such matters will not have a material effect on the Company s financial position, statements of operations or cash flows (see note 8 Provisions, contingencies and commitments ). 9.4 Deferred tax assets and liabilities The origin of the deferred tax assets and liabilities is as follows: 2017 Assets Liabilities Net (869) (900) (806) (866) Property, plant and equipment (5,334) (5,782) (5,099) (5,325) Inventories (179) (315) Financial instruments (559) (206) (430) (185) Other assets (336) (310) (133) 1,577 1,928 (424) (330) 1, (225) (555) 134 9,275 7, ,365 11,758 (7,994) (8,450) Intangible assets Provisions Other liabilities Tax losses carried forward Tax credits and other tax benefits carried forward Untaxed reserves Deferred tax assets / (liabilities) (3) 1,598 (87) 9,275 7, (68) (52) (68) 4,371 Deferred tax assets Deferred tax liabilities (52) 3,308 7,055 5,837 (2,684) (2,529) The deferred tax assets recognized by the Company as of December 31, 2017 are analyzed as follows: Tax losses carried forward Tax credits and other tax benefits carried forward Other temporary differences Recognized deferred tax assets 9,275 Unrecognized deferred tax assets 19,038 Gross amount Total deferred tax assets 110,855 28,313 1,803 1, ,417 3,978 2,857 1,121 33,325 12,365 20,960 Unrecognized deferred tax assets 17, Total The deferred tax assets recognized by the Company as of December 31, 2016 are analyzed as follows: Tax losses carried forward Tax credits and other tax benefits carried forward Other temporary differences Total As of December 31, 2017, the majority of the deferred tax assets not recognized relates to tax losses carried forward attributable to various subsidiaries located in different jurisdictions (primarily France, Germany, Luxembourg, Spain and the United States) with different statutory tax rates. The amount of the total deferred tax assets is the Gross amount Total deferred tax assets 96,648 25,735 Recognized deferred tax assets 7,906 1,807 1, ,946 5,440 3,582 1,858 32,282 11,758 20,524 aggregate amount of the various deferred tax assets recognized and unrecognized at the various subsidiaries and not the result of a computation with a given blended rate. The utilization of tax losses carried forward is restricted to the taxable income of the subsidiary or tax consolidation group to which it belongs. The utilization of tax losses
185 Consolidated financial statements 185 carried forward also may be restricted by the character of the income, expiration dates and limitations on the yearly use of tax losses against taxable income. As at December 31, 2017 the total amount of accumulated tax losses in Luxembourg with respect to the main tax consolidation amounted to approximately 80.8 billion, of which 30.8 billion was considered realizable, resulting in the recognition of 7.6 billion of deferred tax assets at the applicable income tax rate in Luxembourg. As at December 31, 2016, the total amount of accumulated tax losses in Luxembourg with respect to the main tax consolidation amounted to approximately 70.5 billion, of this amount 23.6 billion was considered realizable, resulting in the recognition of 6.1 billion of deferred tax assets at the applicable income tax rate in Luxembourg. Under the Luxembourg tax legislation tax losses generated before 2017 can be carried forward indefinitely and are not subject to any specific yearly loss utilization limitations. The tax losses carried forward relate primarily to tax deductible write-down charges taken on investments in shares of consolidated subsidiaries recorded by certain of ArcelorMittal s holding companies in Luxembourg. Of the total tax losses carried forward, 30.1 billion may be subject to recapture in the future if the write-downs that caused them are reversed creating taxable income unless the Company converts them to permanent through sales or other organizational restructuring activities. The Company believes that it is probable that sufficient future taxable profits will be generated to support the recognized deferred tax asset for tax losses carried forward in Luxembourg. As part of its recoverability assessment the Company has taken into account (i) its most recent forecast approved by management and the Board of Directors, (ii) the likelihood that the factors that have contributed to past losses in Luxembourg will not recur, (iii) the fact that ArcelorMittal in Luxembourg is the main provider of funding to the Company s consolidated subsidiaries, leading to significant amounts of taxable interest income, (iv) the implementation of an Industrial Franchising Arrangement between ArcelorMittal and numerous worldwide operating subsidiaries, and (v) other significant and reliable sources of operational income earned from ArcelorMittal s European and worldwide operating subsidiaries for centralized distribution and procurement activities performed in Luxembourg. In performing the assessment, the Company estimates at which point in time its earnings projections are no longer reliable, and thus taxable profits are no longer probable. Accordingly, the Company has established consistent forecast periods for its different income streams for estimating probable future taxable profits, against which the unused tax losses can be utilized in Luxembourg. At December 31, 2017, based upon the level of historical taxable income and projections for future taxable income over the periods in which the deductible temporary differences are anticipated to reverse, management believes it is probable that ArcelorMittal will realize the benefits of the deferred tax assets of 7.1 billion recognized. The amount of future taxable income required to be generated by ArcelorMittal s subsidiaries to utilize the deferred tax assets of 7.1 billion is at least 31.3 billion. Historically, the Company has been able to generate sufficient taxable income and believes that it will generate sufficient levels of taxable income in the coming years to allow the Company to utilize tax benefits associated with tax losses carried forward and other deferred tax assets that have been recognized in its consolidated financial statements. Where the Company has had a history of recent losses, it relied on convincing other evidence such as the character of (historical) losses and planning opportunities to support the deferred tax assets recognized. For the period ended December 31, 2017 ArcelorMittal recorded approximately 59 (December 31, 2016: 58) of deferred income tax liabilities in respect of deferred taxation that would arise if temporary differences on investments in subsidiaries, associates and interests in joint ventures were to be realized in the foreseeable future. No deferred tax liability has been recognized in respect of other temporary differences on investments in subsidiaries, associates and interests in joint ventures because the Company is able to control the timing of the reversal of the temporary difference and it is probable that such differences will not reverse in the foreseeable future. The amount of these unrecognized deferred tax liabilities is approximately 875.
186 186 Consolidated financial statements 9.5 Tax losses, tax credits and other tax benefits carried forward At December 31, 2017, the Company had total estimated tax losses carried forward of billion. This amount includes net operating losses of 7.3 billion primarily related to subsidiaries in Basque Country in Spain, Liberia, the Netherlands, Romania and the United States, which expire as follows: Year expiring Recognized Unrecognized Total ,329 5,178 1,233 6,059 7,292 Total The remaining tax losses carried forward for an amount of billion (of which 35.7 billion are recognized and 67.8 billion are unrecognized) are carried forward for unlimited period of time and primarily relate to the Company s operations in Brazil, France, Germany, Luxembourg and Spain. At December 31, 2017, the Company also had total estimated tax credits and other tax benefits carried forward of 1,034 (tax effected). Such amount includes tax credits and other tax benefits of 727 primarily attributable to subsidiaries in Belgium, Basque Country in Spain and the United States of which 80 recognized and 647 unrecognized, which expire as follows: Year expiring Recognized Unrecognized Total Total The remaining tax credits and other tax benefits for an amount of 307 (of which 153 are recognized and 154 are unrecognized) are indefinite and primarily attributable to the Company s operations in Brazil, Belgium and Spain. Tax losses, tax credits and other tax benefits carried forward are denominated in the currency of the countries in which the respective subsidiaries are located and operate. Fluctuations in currency exchange rates could reduce the U.S. dollar equivalent value of these tax losses carried forward in future years. Note 10: Equity 10.1 Share details On May 22, 2017, ArcelorMittal completed the consolidation of each three existing shares in ArcelorMittal without nominal value into one share without nominal value. As a result of this reverse stock split, the number of issued shares decreased from 3,065,710,869 to 1,021,903,623 and all prior periods have been recast in accordance with IFRS. The Company s shares consist of the following: Issued shares Treasury shares Total outstanding shares December 31, 2015 Movement in year 1 December 31, ,130, ,772,882 1,021,903,623 (2,860,363) 552,270, , ,225,765 (2,407,480) 1,019,496, refer to note 10.2 on the mandatorily convertible notes (137,967,116 or 45,989,039 after reverse stock split). Movement in year December 31, ,021,903, , ,644 1,019,916,787 (1,986,836)
187 Consolidated financial statements 187 On January 15, 2016, following the maturity of the mandatorily convertible notes (see 10.2 below), the Company increased share capital by 570 million (622) from 6,883 million (10,011) to 7,453 million (10,633) through the issuance of 137,967,116 (45,989,039 after reverse stock split) new shares fully paid up. The aggregate number of shares issued and fully paid up increased to 1,803,359,338 (601,119,779 after reverse stock split). Following the extraordinary general meeting held on March 10, 2016, ArcelorMittal decreased share capital by 7,273 million (10,376) from 7,453 million (10,633) to 180 million (257) through a reduction of the accounting par value per share to 0.10 without any distribution to shareholders, the balance being allocated to additional paid-in capital. On April 8, 2016, ArcelorMittal completed an equity offering with net proceeds of 3,115 (net of transaction costs of 40) by way of the issuance of 1,803,359,338 (601,119,779 after reverse stock split) non-statutory preferential subscription rights with a subscription price of 2.20 per share at a ratio of 7 shares for 10 rights subsequently to the adoption of enabling resolutions by the extraordinary general meeting of shareholders on March 10, The Company increased share capital by 126 million (144) from 180 million (257) to 306 million (401) through the issuance of 1,262,351,531 (420,783,844 after reverse stock split) new shares fully paid up. The aggregate number of shares issued and fully paid up increased to 3,065,710,869 (1,021,903,623 after reverse stock split). Authorized shares At the Extraordinary General Meeting held on May 8, 2012, the shareholders approved an increase of the authorized share capital of ArcelorMittal by 643 million represented by 156 million shares (52 after reverse stock split), or approximately 10% of ArcelorMittal s outstanding capital. Following this approval, which is valid for 5 years, the total authorized share capital was 7.7 billion represented by 1,773,091,461 (591,030,487 after reverse stock split) shares without par value. At the Extraordinary General Meeting held on May 8, 2013, the shareholders approved an increase of the authorized share capital of ArcelorMittal by 524 million represented by 223 million shares (74 after reverse stock split), or approximately 8% of ArcelorMittal s outstanding capital. Following this approval, which is valid for five years, the total authorized share capital was 8.2 billion represented by 1,995,857,213 (665,285,738 after reverse stock split) shares without par value. At the Extraordinary General Meeting held on March 10, 2016, the shareholders approved a decrease of the authorized share capital of the Company by 8,049 million through a reduction of the accounting par value per share to 0.10 and a subsequent increase by 3 billion. Following the completion of the equity offering on April 8, 2016, the Company s authorized share capital was decreased by 2.9 billion As a result of the approval given by the shareholders on March 10, 2016 and which is valid for five years, the total authorized share capital was 337 million represented by 3,372,281,956 (1,124,093,985 after reverse stock split) shares without par value. At the Extraordinary General Meeting held on May 10, 2017, the shareholders approved a reverse stock split and an increase of the authorized share capital to 345 million. Following this approval, on May 22, 2017 ArcelorMittal completed the consolidation of each three existing shares in ArcelorMittal without nominal value into one share without nominal value. As a result, the authorized share capital increased with a decrease in representative shares from 337 million represented by 3,372,281,956 ordinary shares without nominal value as of December 31, 2016 to 345 million represented by 1,151,576,921 ordinary shares without nominal value. Treasury shares ArcelorMittal held, indirectly and directly, 2.0 million and 2.4 million treasury shares (corresponding to 7.2 million shares prior to the reverse stock split) as of December 31, 2017 and December 31, 2016, respectively Equity instruments and hybrid instruments Mandatorily convertible notes Mandatorily convertible notes issued by the Company were accounted for as compound financial instruments. The net present value of the coupon payments at issuance date was recognized as a long-term obligation and carried at amortized cost. The value of the equity component was determined based upon the difference of the cash proceeds received from the issuance of the notes and the net present value of the financial liability component on the date of issuance and was included in equity. On January 16, 2013, ArcelorMittal issued mandatorily convertible subordinated notes ( MCNs ) with net proceeds of 2,222. The notes had a maturity of 3 years, were issued at 100% of the principal amount and were mandatorily converted into ordinary shares of ArcelorMittal at maturity unless converted earlier at the option of the holders or ArcelorMittal or upon specified events in accordance with the terms of the MCNs. The MCNs paid a coupon of 6.00% per annum, payable quarterly in arrears. The minimum conversion price of the MCNs was set at $16.75 (prior to reverse stock split), corresponding to the placement price of shares in the concurrent ordinary shares offering as described above, and the maximum conversion price was set at approximately 125% of the minimum conversion price (corresponding to $20.94 prior to reverse stock split). The minimum and maximum conversion prices were subject to adjustment upon the occurrence of certain events, and
188 188 Consolidated financial statements were, as of December 31, 2015, $15.98 and $19.98, respectively (prior to reverse stock split). The Company determined the notes met the definition of a compound financial instrument and as such determined the fair value of the financial liability component of the bond was 384 on the date of issuance and recognized it as a long-term obligation. The value of the equity component of 1,838 was determined based upon the difference of the cash proceeds received from the issuance of the bond and the fair value of the financial liability component on the date of issuance and was included in equity. During the fourth quarter of 2015, the Company delivered 2,275,026 treasury shares (758,342 after reverse stock split) against 1,817,869 notes converted at the option of their holders. As a result of such voluntary conversions, the carrying amount of MCNs decreased by 38. On January 15, 2016, upon final maturity of the MCNs, the remaining outstanding 88,182,131 notes were converted into 137,967,116 new common shares (45,989,039 after reverse stock split). Accordingly, share capital and additional paid-incapital increased by 622 and 1,178, respectively and the carrying amount of MCNs decreased by 1,800. Mandatory convertible bonds On December 28, 2009, the Company issued through Hera Ermac, a wholly-owned subsidiary, 750 unsecured and unsubordinated bonds mandatorily convertible into preferred shares of such subsidiary. The bonds were placed privately with a Luxembourg affiliate of Crédit Agricole (formerly Calyon) and are not listed. The Company has the option to call the mandatory convertible bonds until 10 business days before the maturity date. Hera Ermac invested the proceeds of the bonds issuance and an equity contribution by the Company in notes issued by subsidiaries of the Company linked to the values of shares of Erdemir and China Oriental. On April 20, 2011, the Company signed an agreement for an extension of the conversion date of the mandatory convertible bonds to January 31, On September 27, 2011, the Company increased the mandatory convertible bonds from 750 to 1,000. The Company further extended the conversion date for the mandatory convertible bonds on December 18, 2012 and January 17, 2014 to January 31, 2014 and January 29, 2016, respectively. On November 20, 2015, the conversion date of the 1,000 mandatory convertible bonds was extended from January 29, 2016 to January 31, The other main features of the mandatory convertible bonds remained unchanged. The Company determined that this transaction led to the extinguishment of the existing compound instrument and the recognition of a new compound instrument including noncontrolling interests for 880 (net of cumulative tax and fees) and other liabilities for 106. The derecognition of the previous instrument and the recognition at fair value of the new instrument resulted in a 79 expense included in financing costs-net in the consolidated statement of operations and a 20 decrease in non-controlling interests. On December 14, 2017, the conversion date of the 1,000 mandatory convertible bonds was extended from January 31, 2018 to January 29, The other main features of the mandatory convertible bonds remained unchanged. The Company determined that this transaction led to the extinguishment of the existing compound instrument and the recognition of a new compound instrument including noncontrolling interests for 797 (net of cumulative tax and fees) and other liabilities for 184. The derecognition of the previous instrument and the recognition at fair value of the new instrument resulted in a 92 expense included in financing costs-net in the consolidated statement of operations and a 83 decrease in non-controlling interests Earnings per common share Basic earnings per common share is computed by dividing net income (loss) by the weighted average number of common shares outstanding during the year. Net income (loss) attributable to ordinary shareholders takes into consideration dividend rights of preferred shareholders such as holders of subordinated perpetual capital securities. Diluted earnings per share is computed by dividing income (loss) available to equity holders by the weighted average number of common shares and potential common shares from share unit plans and outstanding stock options as well as potential common shares from the conversion of certain convertible bonds whenever the conversion results in a dilutive effect. On April 8, 2016, the Company issued 1,262,351,531 (420,783,844 after reverse stock split) new shares at a subscription price of 2.20 (prior to reverse stock split) per share representing a 35% discount compared to the theoretical ex-right price ( TERP ) of 3.40 (prior to reverse stock split) based on the closing price of ArcelorMittal s shares on Euronext Amsterdam on March 10, In accordance with IFRS, such a rights issue includes a bonus element increasing the number of ordinary shares outstanding to be used in calculating basic and diluted earnings per share for all periods before the rights issue. Accordingly, the table below presents the numerators, a reconciliation of the weighted average common shares outstanding for the purposes of basic and diluted earnings per share for the years ended December 31, 2017 and as retrospectively adjusted for the above mentioned bonus element for the years ended December 31, 2016 and On May 22, 2017, ArcelorMittal completed the consolidation of each three existing shares in ArcelorMittal without nominal value into one share without nominal value. As a result of this reverse stock split, the number of outstanding shares for the prior periods have been recast in accordance with IFRS.
189 Consolidated financial statements Year Ended December 31, Net income (loss) attributable to equity holders of the parent 4,568 1,779 Weighted average common shares outstanding (in millions) for the purposes of basic earnings per share 1, , , Incremental shares from the rights issue on April 8, 2016 retrospectively adjusted for all prior periods Weighted average common shares outstanding (in millions) for the purposes of basic earnings per share (restated) Incremental shares from assumed conversion of restricted share units and performance share units (in millions) Weighted average common shares outstanding (in millions) for the purposes of diluted earnings per share (7,946) For the purpose of calculating earnings per common share, diluted weighted average common shares outstanding excludes 3 million potential common shares from share unit plans for the year ended December 31, 2015, because such share unit plans are anti-dilutive Dividends Calculations to determine the amounts available for dividends are based on ArcelorMittal s financial statements ( ArcelorMittal SA ) which are prepared in accordance with IFRS, as endorsed by the European Union. ArcelorMittal SA has no significant manufacturing operations of its own. Accordingly, it can only pay dividends or distributions to the extent it is entitled to receive cash dividend distributions from its subsidiaries recognized gains, from the sale of its assets or records share premium from the issuance of common shares. Dividends are declared in U.S. dollars and are payable in either U.S. dollars or in euros. Dividend per share (in $) 0.45 June 15, 2015 Total (in millions of $) 331 Dividend for financial year 2015 Annual General Shareholders meeting on May 4, 2016 Dividend for financial year 2016 Annual General Shareholders meeting on May 10, 2017 Description Approved by Dividend for financial year 2014 Annual General Shareholders meeting on May 5, Payout date On May 22, 2017, ArcelorMittal completed the consolidation of each three existing shares in ArcelorMittal without nominal value into one share without nominal value. As a result of this reverse stock split, the dividend per share has been adjusted accordingly. Following the Company s equity offering in April 2016, the dividends declared per share for prior periods has been recast for the year ended December 31, 2014, to include the bonus element derived from the 35% discount to the theoretical ex-right price included in the subscription price. The actual dividends paid were $0.60 per issued share as of December 31, The Board has agreed on a new dividend policy which will be proposed to shareholders at the annual general meeting in May 2018, dividends will begin at $0.10/share in 2018 (paid from 2017 results).
190 190 Consolidated financial statements 10.5 Non-controlling interests Non-wholly owned subsidiaries that have material non-controlling interests The tables below provide a list of the principal subsidiaries which include non-controlling interests at December 31, 2017 and 2016 and for the years ended December 31, 2017, 2016 and Name of Subsidiary AMSA Sonasid1 ArcelorMittal Kryvyi Rih Belgo Bekaert Arames ("BBA") Hera Ermac2 Country of incorporation and operation % of noncontrolling interests and noncontrolling voting rights at December 31, 2017 % of noncontrolling interests and noncontrolling voting rights at December 31, 2016 Net income (loss) attributable to noncontrolling interests for the year ended December 31, 2017 Noncontrolling interests at December 31, % 30.78% 195 (103) 307 (301) Morocco 67.57% 67.57% (5) 95 (6) Ukraine 4.87% 4.87% Brazil 45.00% 45.00% AMMIC3 Canada 15.00% 15.00% Arceo4 Belgium 62.86% 62.86% Liberia 15.00% 15.00% (11) (266) (5) (256) ArcelorMittal Liberia Ltd Other Total 7 2, Net income (loss) attributable to noncontrolling interests for the year ended December 31, 2015 South Africa Luxembourg (124) Noncontrolling interests at December 31, 2017 Net income (loss) attributable to noncontrolling interests for the year ended December 31, (45) 211 2,190 4 (239) 5 (477) Sonasid - ArcelorMittal holds a controlling stake of 50% in Nouvelles Sidérurgies Industrielles. ArcelorMittal controls Nouvelles Sidérurgies Industrielles on the basis of a shareholders agreement which includes deadlock arrangements in favor of the Company. Nouvelles Sidérurgies Industrielles holds a 64.86% stake in Sonasid. The total non-controlling interests in Sonasid of 67.57% are the result of ArcelorMittal s indirect ownership percentage in Sonasid of 32.43% through its controlling stake in Nouvelles Sidérurgies Industrielles. Hera Ermac - The non-controlling interests correspond to the equity component of the mandatory convertible bonds maturing on January 29, 2021 (see note 10.2) AMMIC - On March 15, 2013 and May 30, 2013, a consortium led by POSCO and China Steel Corporation acquired a 15% non-controlling interest in joint venture partnerships holding ArcelorMittal s Labrador Trough iron ore mining and infrastructure assets. Arceo - On June 1, 2015, the Company signed an agreement with Sogepa, an investment fund of the Walloon Region in Belgium, to restructure the research and development activities of their combined investment in Arceo, an investment previously accounted for under the equity method by the Company. On June 11, 2015, Sogepa made a capital injection into Arceo, decreasing the Company s percentage ownership from 50.1% to 37.7%. Following the signed agreement to restructure the activities of Arceo, the Company obtained control and fully consolidated the investment, which resulted in an increase in non-controlling interests by 148. Additionally, on December 13, 2016, Sogepa made a capital injection into Arceo, decreasing the Company's percentage ownership from 37.7% to 37.1%. The tables below provide summarized statements for the above-mentioned subsidiaries of financial position as of December 31, 2017 and 2016 and the summarized statements of operations and summarized statements of cash flows for the year ended December 31, 2017, 2016 and Summarized statements of financial position December 31, 2017 AMSA Sonasid AM Kryvyi Rih BBA Hera Ermac AMMIC Arceo AM Liberia Current assets 1, , , Non-current assets 1, , ,350 3, Total assets 2, , ,560 4, Current liabilities 1, ,783 Non-current liabilities Net assets , ,877 3, (1,618)
191 Consolidated financial statements 191 Summarized statements of operations December 31, 2017 Revenue AMSA Sonasid AM Kryvyi Rih BBA Hera Ermac AMMIC Arceo 2, , ,943 AM Liberia 56 Net income (loss) (403) , (71) Total comprehensive income (loss) (421) , (71) Summarized statements of cash flows December 31, 2017 AMSA Sonasid AM Kryvyi Rih BBA Hera Ermac AMMIC Arceo AM Liberia Net cash provided by / (used in) operating activities (119) (7) (12) (69) Net cash provided by / (used in) investing activities (193) (3) (234) (9) 12 (301) 3 (63) Net cash provided by / (used in) financing activities 330 (4) (61) (656) (8) 132 Impact of currency movements on cash 13 1 (2) At the beginning of the year At the end of the year Dividend to noncontrolling interests (2) (26) (98) (5) Cash and cash equivalents: Summarized statements of financial position December 31, 2016 AMSA Sonasid AM Kryvyi Rih BBA Hera Ermac AMMIC Arceo AM Liberia Current assets 1, , Non-current assets 1, , ,798 3, Total assets 2, , ,019 6, Current liabilities 1, ,081 Non-current liabilities , Net assets , ,827 1, (1,547)
192 192 Consolidated financial statements Summarized statements of operations December 31, 2016 AMSA Sonasid AM Kryvyi Rih BBA Hera Ermac AMMIC Arceo 2, , , Revenue AM Liberia Net income (loss) (335) (7) (66) 7 (29) Total comprehensive income (loss) (349) (8) (74) 7 (29) Summarized statements of cash flows December 31, 2016 AMSA Sonasid AM Kryvyi Rih Net cash provided by / (used in) operating activities (45) Net cash provided by / (used in) investing activities (149) (6) (156) (15) (28) (283) (78) (73) Net cash provided by / (used in) financing activities 80 (32) (50) (24) Impact of currency movements on cash BBA Hera Ermac AMMIC Arceo AM Liberia 29 2 At the beginning of the year At the end of the year (25) (30) Dividend to non-controlling interests (5) (6) Summarized statements of operations December 31, 2015 AMSA Sonasid 2, AM Kryvyi Rih 2,118 BBA AMMIC Arceo AM Liberia 1,432 Net income (loss) (581) (10) (242) (1,516) Total comprehensive income (loss) (516) (14) (242) (1,516) BBA Hera Ermac AMMIC Arceo AM Liberia Revenue 701 Hera Ermac 86 Summarized statements of cash flows December 31, 2015 AMSA Sonasid AM Kryvyi Rih Net cash provided by / (used in) operating activities (85) (103) Net cash provided by / (used in) investing activities (99) (6) (154) (10) (23) (171) (142) (102) Net cash provided by / (used in) financing activities (52) (2) (97) Impact of currency movements on cash (23) (2) (43) (4) (17) (1) (57) Cash and cash equivalents: At the beginning of the year At the end of the year Dividend to non-controlling interests (6) Transactions with non-controlling interests Acquisitions of non-controlling interests, which do not result in a change of control, are accounted for as transactions with owners in their capacity as owners and therefore no goodwill is recognized as a result of such transactions. In such circumstances, the carrying amounts of the controlling and non-controlling interests are adjusted to reflect the
193 Consolidated financial statements 193 changes in their relative interests in the subsidiary. Any difference between the amount by which the non-controlling interests are adjusted and the fair value of the consideration paid or received is recognized directly in equity and attributed to the owners of the parent. On February 23, 2017, ArcelorMittal and Votorantim S.A. announced the signing of an agreement, pursuant to which Votorantim s long steel businesses in Brazil, Votorantim Siderurgia, will become a subsidiary of ArcelorMittal Brasil and Votorantim will hold a non-controlling interest in ArcelorMittal Brasil. The combined operations include ArcelorMittal Brasil s production sites at Monlevade, Cariacica, Juiz de Fora, Piracicaba and Itaúna, and Votorantim Siderurgia s production sites at Barra Mansa, Resende and its participation in Sitrel, in Três Lagoas (see note 2.2.4). Transactions with non-controlling interests in 2016 were as follows: AMSA On January 15, 2016, AMSA completed a rights offering fully underwritten by ArcelorMittal. The total cash proceeds amounted to ZAR 4.5 billion. ArcelorMittal subscribed the capital increase through repayment of an outstanding intragroup loan of ZAR 3.2 billion and an additional cash injection of ZAR 0.5 billion. As a result of the rights issue, ArcelorMittal s shareholding in AMSA increased from 52% to 70.55% and non-controlling interests decreased by 80. Effective October 17, 2016, ArcelorMittal s interest in AMSA decreased to 69.22%. In the framework of AMSA s transformation initiatives in order to maximize its score under the Broad-Based Black Economic Empowerment ( BBBEE ) Codes of Good Practice, it launched on October 1, 2015 an employee share ownership plan following which the Ikageng Broad-Based Employee Share Trust obtained an ownership interest of 1.33% in AMSA to be attributed to qualifying employees upon vesting date of the plan. In addition, on September 28, 2016, AMSA announced that it had entered into agreements to implement a transaction which includes the issuance of a 17% shareholding in AMSA using a new class of notionally funded shares to a special purpose vehicle owned by Likamva Resources Proprietary Limited ( Likamva ). Likamva has undertaken to introduce broad-based social and community development organizations as shareholders to hold an effective 5% interest (of the 17%, leaving Likamva with a 12% shareholding) within 24 months. The transaction also includes the issuance of a 5.1% shareholding in AMSA using another new class of notionally funded shares to the ArcelorMittal South Africa Employee Empowerment Share Trust for the benefit of AMSA employees and AMSA management. All the shares have certain restrictions on disposal for a period of 10 years thereby promoting longterm sustainable B-BBEE in AMSA. The shares were issued on December 7, The Company concluded that the transaction does not correspond to a share issue but qualifies as an in substance option (resulting in the recognition of an expense of 63, which is recognized in financing costs - net and corresponds to the fair value at inception). The shares give the holders rights to notional dividends which will be used to repay the notional funding and voting rights for up to 10 years, resulting in a decrease of ArcelorMittal's voting rights to 53.92%. The Company will recognize non-controlling interests at the end of the 10 year period depending on the value of the shares based on a pre-defined formula Non-controlling interests Purchase price (selling price), net 80 1 Adjustment to equity attributable to the equity holders of the parent (56) Amount paid in by non-controlling shareholders in AMSA following the rights issue Transactions with non-controlling interests include also the mandatory convertible bonds (see note 10.2). There were no transactions with non-controlling interests in Note 11: Related parties The related parties of the Group are predominately subsidiaries, joint operations, joint ventures, associates and key management personnel (see note 7.1) of the Group. Transaction between the parent company, its subsidiaries and joint operations are eliminated on consolidation and are not disclosed in this note. Related parties include the Significant Shareholder, which is a trust of which Mr. Lakshmi N. Mittal and Mrs. Usha Mittal are the beneficiaries and which owns 37.4% of ArcelorMittal s ordinary shares. Transactions with related parties of the Company mainly relate to sales and purchases of raw materials and steel products and were as follows:
194 194 Consolidated financial statements 11.1 Sales and trade receivables Year Ended December 31, Sales Related parties and their subsidiaries where applicable December 31, Trade receivables Category Joint Venture 2,030 1,400 1, Associate 1,666 1,210 1, Macsteel Joint Venture ArcelorMittal CLN Distribuzione Italia S.r.l. Joint Venture Borçelik Joint Venture Bamesa Associate Joint Venture Other Joint Venture Associate Joint Venture Associate Available-for-sale Other Calvert Gonvarri Steel Industries1 I/N Kote L.P. Aperam Société Anonyme ("Aperam") AM RZK C.L.N. Coils Lamiere Nastri S.p.A. 2 Tuper S.A. WDI3 Stalprodukt S.A.4 Gestamp5 Other Total 7,503 5,634 6, Gonvarri Steel Industries includes ArcelorMittal Gonvarri Brasil Productos Siderúrgicos which is a joint venture. The joint venture Tuper S.A. was acquired on October 6, WDI includes Westfälische Drahtindustrie Verwaltungsgesellschaft mbh & Co. KG and Westfälische Drahtindustrie GmbH. ArcelorMittal partially disposed of its former associate Stalprodukt S.A. and was then reclassified as available-for-sale on April 28, 2016 (see note 2). ArcelorMittal disposed of the former associate Gestamp on February 1, 2016 (see note 2) Purchases and trade payables Year Ended December 31, Purchases Related parties and their subsidiaries where applicable Tameh Baffinland1 Aperam Calvert December 31, Trade payables Category Joint Venture Associate Other Joint Venture CFL Cargo S.A. Associate Exeltium S.A.S. Associate Joint Venture Other Associate Baycoat Limited Partnership 2 EIMP Gonvarri Steel Industries3 Other Total 1,033 1,390 1, Baffinland was classified as an associate as of October 31, 2017 (see note 2). In addition to trade payables and purchases with related parties as defined by IAS 24, the Company also discloses this information for EIMP due to the close relationship with this entity. The Company's 21% stake in the EIMP was disposed of on August 7, Gonvarri Steel Industries includes ArcelorMittal Gonvarri Brasil Productos Siderúrgicos which is a joint venture.
195 Consolidated financial statements Other transactions with related parties At December 31, 2017, the shareholder loans granted by the Company to Al Jubail, with different maturity dates, had a carrying value of 140 (see note 2.4). As of March 13, 2017, the Company granted a credit facility to AMTBA bearing compound interest (Libor 3 months + margin) maturing on February 28, 2018 for a maximum aggregated amount of 35. At December 31, 2017, the facility was fully drawn. As of December 3, 2014, ArcelorMittal Calvert LLC signed a member capital expenditure loan agreement with the joint venture Calvert and as of December 31, 2017, the loans amounted to 135 including accrued interest. The loans bear interest from 3% to 3.95% and have various maturity dates range from less than 1 to 25 years. In May 2014, ArcelorMittal entered into a 5-year off take agreement with its associate Baffinland (the "AM Sourcing Contract"), whereby it will buy the lesser of 50% of the annual quantity of iron ore produced by Baffinland or 2 million tonnes of iron ore per year. The AM Sourcing Contract has been extended to December 31, 2021 and the maximum quantity shall increase to the lesser of 50% of the annual quantity of iron ore produced by Baffinland or 4 million tonnes per contract year, after completion of Phase 3. The purchase price includes a premium to reference prices based on high iron ore content. ArcelorMittal paid advances to Baffinland for an amount equivalent to the value of iron ore stockpiled by Baffinland outside the salable season until August 31, From September 1, 2017 to December 31, 2021, ArcelorMittal will not pay advances to Baffinland anymore as payments for the purchases will occur upon loading on vessel for shipment at port of Milne. In May 2014, ArcelorMittal also entered into an additional contract with Baffinland whereby it agreed to act as a sales agent ( Marketing agreement ) for all of Baffinland s iron ore (excluding the shipments subject to the offtake agreement mentioned above). The Company also entered into an agreement to advance 80% of the lesser of 50% of the annual quantity of iron ore produced by Baffinland or 1.5 million tonnes of iron ore per year. The contract expired on the extended maturity at April 30, On August 24, 2016, Baffinland entered into an agreement with a bank to finance an amount which does not exceed the lesser of 50% of iron ore stockpiled by Baffinland outside the salable season and 2.3 million tonnes in any contract year. This agreement expired on the extended maturity at October 20, On December 1, 2017, Baffinland entered into a new agreement with a bank to finance up to 4 million tonnes at 78% of the value of the iron ore produced and hauled to the port by Baffinland (the "EXW Purchase Contract"). The EXW Purchase Contract matures on October 20, Under this agreement, the bank purchases product from Baffinland up to 50% of which is then sold to ArcelorMittal under a separate back-to-back contract ( AM Purchase Contract ). ArcelorMittal contracts with third-party steel mills for onward sale of the product purchased from the bank under the AM Purchase Contract. The remaining 50% of product purchased by the bank under the EXW Purchase Contract is sold to ArcelorMittal under the AM Sourcing Contract as a result of Baffinland assigning its rights under that contract to the bank on December 22, Following the Extraordinary General Meeting held on March 10, 2016, when the final terms of the rights issuance were defined, the Company decided, in accordance with its risk management policies, to hedge part of its foreign exchange exposure arising from the euro denominated proceeds of the rights issuance. Accordingly, on March 10, 2016, the Company entered into currency forward transactions with a credit institution to sell euro and buy U.S. dollar at an amount of 1 billion. The transactions settled on March 30, In parallel, the commitment by the Significant Shareholder to exercise its rights under the eurodenominated rights issuance gave rise to a foreign exchange exposure opposite to the one of the Company. Accordingly, on the same date, the Significant Shareholder entered into currency forward transactions, with the same credit institution as the Company, to hedge its foreign exchange exposure arising from potential fluctuations in the USD/Euro exchange rate. The transactions, which consisted of buying euro and selling U.S. dollar at an amount of 1 billion, settled on March 30, 2016.
196 196 Consolidated financial statements Note 12: Principal accountant fees and services Deloitte Audit S.à r.l. acted as the principal independent registered public accounting firm for ArcelorMittal for the fiscal years ended December 31, 2017 and Set forth below is a breakdown of fees for services rendered in 2017 and Audit fees in 2017 and 2016 included 23.6 and 20.9, respectively, for the audits of financial statements, and 0.2 and 0.6 in 2017 and 2016, respectively, for regulatory filings. Audit-related fees in 2017 and 2016 were 1.0 and 0.9, respectively. Audit-related fees primarily include fees for employee benefit plan audits. Fees relating to tax planning, advice and compliance in 2017 and 2016 were 0.4 and 0.3, respectively. Fees in 2017 and 2016 for all other services were 0.2 and 0.3, respectively. All other fees relate to services not included in the first three categories. Note 13: Subsequent events On February 12, 2018, ArcelorMittal announced that its subsidiary ArcelorMittal India Private Limited ("AMIPL") has submitted an offer for Essar Steel India Limited ("Essar"), an Indian steel company, in the framework of the corporate insolvency resolution process. In its offer, AMIPL set out a detailed industrial plan for Essar aimed at improving its performance and profitability and ensuring it can participate in the anticipated growth of steel demand in India. Essar is an integrated flat steel producer, with its main production facility in Gujarat. It has a nameplate crude steel capacity of 9.6 million tonnes per year, although the current maximum achievable crude steel production level is 6.1 million tonnes per year, due to a bottleneck in the steelmaking and casting process.
197 Report of the réviseur d entreprises agréé 197 To the Shareholders of ArcelorMittal Société Anonyme 24-26, Boulevard d Avranches L-1160 Luxembourg Grand Duchy of Luxembourg REPORT OF THE REVISEUR D ENTREPRISES AGREE Report on the Audit of the Consolidated Financial Statements Opinion We have audited the consolidated financial statements of ArcelorMittal and its subsidiaries (the Group ), which comprise the consolidated statement of financial position as at December 31, 2017, and the consolidated statement of operations, other comprehensive income, changes in equity and cash flows for the year then ended, and notes to the consolidated financial statements, including a summary of significant accounting policies. In our opinion, the accompanying consolidated financial statements give a true and fair view of the consolidated financial position of the Group as of December 31, 2017, and of its consolidated financial performance and its consolidated cash flows for the year then ended in accordance with International Financial Reporting Standards (IFRSs) as adopted by the European Union. Basis for Opinion We conducted our audit in accordance with the EU Regulation N 537/2014, the Law of July 23, 2016 on the audit profession (Law of July 23, 2016) and with International Standards on Auditing (ISAs) as adopted for Luxembourg by the Commission de Surveillance du Secteur Financier (CSSF). Our responsibilities under those Regulation, Law and standards are further described in the Responsibilities of Réviseur d Entreprises Agréé for the Audit of the Consolidated Financial Statements section of our report. We are also independent of the Group in accordance with International Ethics Standards Board for Accountants Code of Ethics for Professional Accountants (IESBA Code) as adopted for Luxembourg by the CSSF together with the ethical requirements that are relevant to our audit of the consolidated financial statements, and have fulfilled our other ethical responsibilities under those ethical requirements. We believe that the audit evidence we have obtained is sufficient and appropriate to provide a basis for our opinion. Key Audit Matters Key audit matters are those matters that, in our professional judgment, were of most significance in our audit of the consolidated financial statements of the current period. These matters were addressed in the context of the audit of the consolidated financial statements as whole, and in forming our opinion thereon, and we do not provide a separate opinion on these matters. Impairment of Goodwill, Property, Plant & Equipment ( PP&E ) Refer to Note 5.3 Annually, as of its selected date of October 31, or more frequently if there are indicators that the carrying amount of goodwill and/ or property, plant and equipment is no longer recoverable, the Group is required to perform an impairment test. The Group manages its goodwill at the group of cash-generating units ( GCGU ) level, while property, plant and equipment is part of a relevant cash-generating unit ( CGU ). Impairment is tested with reference to fair value less cost to sell or the value-in-use, typically based on the cash flow forecasts for each CGU or GCGU. Impairment considerations were significant to our audit because the goodwill and PP&E balances of $5.3 billion and $36.9 billion, respectively, as of December 31, 2017 are material to the consolidated financial statements. In addition, management s assessment process is complex, involves judgment and is based on assumptions, which are affected by expected future market and economic conditions. The key assumptions with the most significant impact on the cash flow forecasts are the discount rate,
198 198 Report of the réviseur d entreprises agréé based on the weighted average cost of capital ( WACC ), and business assumptions, including projected shipments and selling prices. In particular, in the ACIS and Brazil segments, management believes that a reasonably possible change in a key assumption, such as sales volumes, prices and discount rates, could cause an impairment loss to be recognized. The segments are also exposed to volatility in the export markets and international steel prices and macroeconomic trends of emerging markets (such as economic growth). Further considerations include determination of CGUs, whether the value-in-use calculation and valuation method used complied with the requirements of IFRS. How the Matter Was Addressed in the Audit Our procedures included performing sensitivity analyses to identify the assumptions that have the most significant effect on the determination of the recoverable amount of goodwill and PP&E and focusing our procedures on the most sensitive assumptions, including those in ACIS and Brazil. We used internal valuation specialists to assist us in evaluating the methodology and input data used by the management to estimate the WACC used in each CGU s value-in-use estimate. We also tested internal controls over these assumptions and valuation methodologies. We considered management s determination of CGUs and its ability to accurately forecast based on a comparison of actual performance against previous forecasts. We audited the future projected cash flows in the models to determine whether they are reasonable and supportable given the current macroeconomic climate and expected future performance of the applicable CGU, against external data, historical performance and forecasts. We also audited the appropriateness of the related disclosures. Valuation of Deferred Tax Assets Refer to Note 9.4 The Group s Luxembourg tax integration, headed by the parent company ArcelorMittal S.A., has deferred tax assets primarily relating to tax losses carried forward. Under current tax law in Luxembourg, tax losses accumulated before January 1, 2017 never expire. These tax losses are recoverable against future taxable income, and the amount of the deferred tax asset recognized in the Company s consolidated financial statements is based on management s estimates of future taxable income of the tax integration. The Group s future forecasted taxable income in Luxembourg consists mainly of operational and financial income. Financial income is mainly derived from interest earned on financial assets relating to loans from Luxembourg entities to subsidiaries throughout the Group. Operational forecasted taxable income is derived from contractual income expected to be generated under an industrial franchising arrangement and from centralized sourcing activities. Future income is considered only to the extent future income forecasts are considered reliable. In performing the assessment, management estimates at which point in time its future income forecasts are no longer reliable, and thus taxable income is no longer probable. Accordingly, management has established consistent forecast periods for its different income streams for estimating probable future taxable income, against which the unused tax losses can be utilized in Luxembourg. Deferred tax asset valuation is considered a key audit matter due to the complexities of the calculation of future taxable profits, the evaluation of the impact of tax planning opportunities, and the inherent uncertainty involved in forecasting taxable profits available in future periods. Further, deferred tax asset balances of $7,055 million as of December 31, 2017, are material to the consolidated financial statements. How the Matter Was Addressed in the Audit Our procedures included involvement of tax specialists knowledgeable in international tax planning as well as Luxembourgspecific tax legislation and regulatory matters. Tax specialists supported the audit team in testing management s forecasted taxable income projections, including evaluation of available evidence related to management s judgments for the amounts of deferred tax assets recognized. Further, we audited management s estimates of projected taxable income by performing a retrospective review of the projections used in the prior year assessment, and considered the results of this retrospective review in evaluating the current-year taxable income projections. We tested internal controls over management s valuation of deferred tax assets. We also considered the appropriateness of the related disclosures.
199 Report of the réviseur d entreprises agréé 199 Provision for Pension and Other Post-Employment Plan Benefits Refer to Note 7.2 The Company provides employee benefits including defined benefit pension plans and other post-employment plan benefits ( OPEB ) at certain of its locations. The expenses as well as the carrying amount of the related liability/asset associated with these plans are based on a number of assumptions and factors such as discount rates, expected rate of compensation increases, fair value of plan assets, mortality rates, retirement rates and health care cost trend rates (applicable to OPEB plans only). Pension and OPEB valuation was significant to our audit because the balance of $7,630 million as of December 31, 2017 is material to the consolidated financial statements. The assumptions that underpin the valuation of pension and OPEB liabilities, including discount rates, health care cost trend rates and the fair value of plan assets, include subjective judgments. Movements in these assumptions, particularly discount rates, can have a material impact on the determination of the valuation of pension and OPEB liabilities. How the Matter Was Addressed in the Audit Our procedures included evaluating the Group s accounting policy for pension and OPEB plans, understanding management s process for determining the assumptions, including discount rates, health care cost trend rates and the fair value of plan assets, which underpin the valuation of pension and OPEB liabilities and evaluating the reasonableness of management s assumptions. We used our internal actuarial specialists to test the assumptions determined by management by performing an independent valuation based on market indices and other externally derived data. We also tested internal controls over management s process. We also used internal actuarial specialists to evaluate the appropriateness of related disclosures, particularly those related to the sensitivity of the defined benefit obligation to a change of the significant actuarial assumptions. Level 3 Financial Instruments - Call Option on the Mandatory Convertible Bonds Refer to Note The Company has a call option, a Level 3 financial instrument, on its Mandatory Convertible Bonds ( MCB ). The financial instrument is measured at fair value using binomial fair valuation models, which estimate the value of the underlying equity spot price and volatility of Hera Ermac (a subsidiary of the Group). The call option on the MCB valuation is considered a key audit matter due to the significant increase in the balance of the call option on MCB from $175 million as of December 31, 2016 to $984 million as of December 31, 2017, as a result of the significant increase in the underlying equity spot price of Hera Ermac. How the Matter Was Addressed in the Audit Our procedures included the involvement of an internal valuation specialist with expertise in derivative instruments and valuation models. The valuation team supported the audit team in testing the valuation methodology and the assumptions used by management, including those used as inputs to models, by independently developing estimates of the fair value of the call option. We tested internal controls over the valuation. We also evaluated the accounting policy and the appropriateness of the related disclosures. Other information The Board of Directors is responsible for the other information. The other information comprises the information included in the consolidated management report, the Corporate Governance Statement and further information on the risks that the Company is exposed to and details on the Company s Mining business but does not include the consolidated financial statements and our report of Réviseur d'entreprises agréé thereon. Our opinion on the consolidated financial statements does not cover the other information and we do not express any form of assurance conclusion thereon. In connection with our audit of the consolidated financial statements, our responsibility is to read the other information and, in doing so, consider whether the other information is materially inconsistent with the consolidated financial statements or our knowledge obtained in the audit or otherwise appears to be materially misstated. If, based on the work we have performed, we concluded that there is a material misstatement of this other information, we are required to report this fact. We have nothing to report in this regard.
200 200 Report of the réviseur d entreprises agréé Responsibilities of the Board of Directors for the Consolidated Financial Statements The Board of Directors is responsible for the preparation and fair presentation of the consolidated financial statements in accordance with IFRSs as adopted by the European Union and for such internal control as the Board of Directors determines is necessary to enable the preparation of consolidated financial statements that are free from material misstatement, whether due to fraud or error. In preparing the consolidated financial statements, the Board of Directors is responsible for assessing the Group s ability to continue as a going concern, disclosing, as applicable, matters related to going concern and using the going concern basis of accounting unless the Board of Directors either intends to liquidate the Group or to cease operations, or has no realistic alternative but to do so. Responsibilities of the Réviseur d Entreprises Agréé for the Audit of the Consolidated Financial Statements The objectives of our audit are to obtain a reasonable assurance about whether the consolidated financial statements as a whole are free from material misstatement, whether due to fraud or error, and to issue a report of Réviseur d Entreprises Agréé that includes our opinion. Reasonable assurance is a high level of assurance, but is not a guarantee that an audit conducted in accordance with the EU Regulation N 537/2014, the Law of July 23, 2016 and with ISAs as adopted for Luxembourg by the CSSF will always detect a material misstatement when it exists. Misstatements can arise from fraud or error and are considered material if, individually or in the aggregate, they could reasonably be expected to influence the economic decisions of users taken on the basis of these consolidated financial statements. As part of an audit in accordance with the EU Regulation N 537/2014, the Law of July 23, 2016 and with ISAs as adopted for Luxembourg by the CSSF, we exercise professional judgment and maintain professional scepticism throughout the audit. We also: Identify and asses the risks of material misstatement of the consolidated financial statements, whether due to fraud or error, design and perform audit procedures responsive to those risks, and obtain audit evidence that is sufficient and appropriate to provide a basis for our opinion. The risk of not detecting a material misstatement resulting from fraud is higher than for one resulting from error, as fraud may involve collusion, forgery, intentional omissions, misrepresentations, or the override of internal control. Obtain an understanding of internal control relevant to the audit in order to design audit procedures that are appropriate in the circumstances, but not for the purpose of expressing an opinion on the effectiveness of the Group s internal control. Evaluate the appropriateness of accounting policies used and the reasonableness of accounting estimates and related disclosures made by the Board of Directors. Conclude on the appropriateness of Board of Directors use of the going concern basis of accounting and, based on the audit evidence obtained, whether a material uncertainty exists related to events or conditions that may cast significant doubt on the Group s ability to continue as a going concern. If we conclude that a material uncertainty exists, we are required to draw attention in our report of Réviseur d Entreprises Agréé to the related disclosures in the consolidated financial statements or, if such disclosures are inadequate, to modify our opinion. Our conclusions are based on the audit evidence obtained up to the date of our report of Réviseur d Entreprises Agréé. However, future events or conditions may cause the Group to cease to continue as a going concern. Evaluate the overall presentation, structure and content of the consolidated financial statements, including the disclosures, and whether the consolidated financial statements represent the underlying transactions and events in a manner that achieves fair presentation. Obtain sufficient appropriate audit evidence regarding the financial information of the entities and business activities within the Group to express an opinion on the consolidated financial statements. We are responsible for the direction, supervision and performance of the Group audit. We remain solely responsible for our audit opinion. We communicate with those charged with governance regarding, among other matters, the planned scope and timing of the audit and significant audit findings, including any significant deficiencies in internal control that we identify during our audit.
201 Report of the réviseur d entreprises agréé 201 We also provide those charged with governance with a statement that we have complied with relevant ethical requirements regarding independence, and to communicate with them all relationships and other matters that may reasonably be thought to bear on our independence, and where applicable, related safeguards. From the matters communicated with those charged with governance, we determine those matters that were of most significance in the audit of the consolidated financial statements of the current period and are therefore the key audit matters. We describe these matters in our report unless law or regulation precludes public disclosure about the matter or when, in extremely rare circumstances, we determine that a matter should not be communicated in our report because the adverse consequences of doing so would reasonably be expected to outweigh the public interest benefits of such communication. Report on Other Legal and Regulatory Requirements We have been appointed as Réviseur d Entreprises Agréé by the General Meeting of the Shareholders on May 10, 2017 and the duration of our uninterrupted engagement, including previous renewals and reappointments, is 11 years. The consolidated management report, which is the responsibility of the Board of Directors, is consistent with the consolidated financial statements and has been prepared in accordance with applicable legal requirements. We confirm that the audit opinion is consistent with the additional report to the audit committee. We confirm that the prohibited non-audit services referred to in the EU Regulation N 537/2014, on the audit profession were not provided and that we remain independent of the Group in conducting the audit. Other matter The Corporate Governance Statement includes information required by Article 68ter paragraph (1) of the Law of December 19, 2002 on the commercial and companies register and on the accounting records and annual accounts of undertakings, as amended. For Deloitte Audit, Cabinet de Révision Agréé Jean-Pierre Agazzi, Réviseur d Entreprises Agréé Partner February 16, 2018
202
203 Management report 203 Management report of ArcelorMittal as parent company: Please refer to pages 4 to 84 and the following: ArcelorMittal as Parent Company ArcelorMittal (the Parent Company ) was incorporated as a Société Anonyme under Luxembourg law on June 8, 2001 for an unlimited period. The Parent Company has its registered office in boulevard d Avranches, Luxembourg City and is registered at the Register of Trade and Commerce of Luxembourg under the number B The Parent Company s corporate goal is the manufacturing, processing and marketing of steel products, all other metallurgical products, mining products and any other activity directly or indirectly related thereto. The Parent Company realizes its corporate goal either directly or through the creation of companies or the acquisition and holding of interests in companies, partnerships, associations, consortia and joint ventures. In addition, ArcelorMittal is the head of the main tax integration in Luxembourg and the main funding vehicle of ArcelorMittal group. Also, ArcelorMittal implemented an industrial franchise agreement with group subsidiaries whereby the Parent Company licenses its business model for manufacturing, processing and distributing steel to group subsidiaries. The business model includes the ArcelorMittal business intelligence, which is a package of business solutions and implementation support combined with the development and maintenance of intangibles such as the ArcelorMittal brand, ArcelorMittal global information technology solutions, ArcelorMittal global research & development and ArcelorMittal global purchase agreements. ArcelorMittal generated net income of $8,162 million and $4,723 million in 2017 and 2016, respectively. Operating income amounted to $326 million in 2017 as compared to operating income of $214 million in Operating income is mainly related to income from industrial franchise agreement fees ($916 million and $722 million for the years ended December 31, 2017 and 2016, respectively). Income from subsidiaries and associates amounted to $836 million in 2017 as compared to $14,108 million in Income from subsidiaries and associates included in 2016 dividends in kind of $11,369 million as a result of the transfer of several investments to ArcelorMittal Parent Company and cash dividends of $2,739 million. The Company recognized a $5,086 million net impairment reversal in 2017 as compared to a $8,817 million net impairment loss in The 2017 net impairment reversal reflected higher future cash flow projections due to improved market conditions and the increase in the value in use of euro denominated investments in connection with the appreciation of the euro against the U.S. dollar. The 2016 impairment loss was mainly related to the dividends in kind mentioned above. Impairment of loans amounted to $129 million and $114 million for the years ended December 31, 2017 and 2016, respectively, and were mainly related to the Company's mining operations in Liberia. Financing costs-net were a $1,101 million income in 2017 as compared to a $338 million expense in Financing costs-net included in 2017 a $809 million gain related to the change in fair value of the call option on the mandatory convertible bonds. Updates on recent developments for ArcelorMittal group and Parent Company On March 5, 2018, ArcelorMittal announced that Aditya Mittal, Group CFO and CEO of ArcelorMittal Europe, has been appointed as President, ArcelorMittal, in addition to his current responsibilities. As President and CFO, he will continue to report to the Chairman and CEO, Mr Lakshmi Mittal. On March 2, 2018, ArcelorMittal signed a joint venture formation agreement with Nippon Steel & Sumitomo Metal Corporation ("NSSMC") in relation to its offer to acquire Essar Steel India Limited ("Essar Steel"). The Company s subsidiary ArcelorMittal India Private Limited ("AMIPL") submitted a resolution plan for Essar on February 12, 2018, which outlined the intention to have NSSMC formally join its bid for Essar Steel.
204 204 Management report Chief executive officer and chief financial officer s responsibility statement We confirm, to the best of our knowledge, that: 1. the financial statements of ArcelorMittal parent company presented in this Annual Report and prepared in conformity with International Financial Reporting Standards as issued by the International Accounting Standards Board and as adopted by the European Union, give a true and fair view of the assets, liabilities, financial position, profit or loss of ArcelorMittal; and 2. the management report includes a fair review of the development and performance of the business and position of ArcelorMittal and undertakings included within the consolidation taken as a whole, together with a description of the principal risks and uncertainties they face. Chief executive officer Chief financial officer Lakshmi N. Mittal Aditya Mittal March 12, 2018 March 12, 2018
205 Financial statements 205
206 206 Financial statements ArcelorMittal Statements of financial position ASSETS December 31, 2017 December 31, ,039 Current loans to related parties (note 11) 1,749 2,099 Prepaid expenses and other current assets, including 1,035 and 1,050 with related parties at December 31, 2017 and 2016, respectively (notes 5 and 11) 1,064 1,148 Current assets: Cash and cash equivalents (note 4) Assets held for sale (note 9) Total current assets 48 3,660 4,286 Non-current assets: Tangible and intangible assets (note 6) Investments in subsidiaries (note 7) Investments in associates and joint ventures (note 8) ,659 44, ,493 8,754 Deferred tax assets (note 17) 7,517 6,110 Other assets (note 10) 1, Total non-current assets 70,152 60,316 Total assets 73,812 64,602 December 31, 2017 December 31, 2016 Non-current loans to related parties (note 11) LIABILITIES AND EQUITY Current liabilities: Short-term debt and current portion of long-term debt (note 12) 2, Current loans from related parties (note 11) 6,499 3,866 Accrued expenses and other liabilities, including 240 and 465 with related parties at December 31, 2017 and 2016, respectively (notes 11 and 18) ,225 5,574 Long-term debt, net of current portion (note 12) 9,563 11,197 Non-current loans from related parties (note 11) 3,418 4, Total current liabilities Non-current liabilities: Deferred employee benefits (note 21) Total non-current liabilities 13,246 15,869 Total liabilities 22,471 21, Long-term provisions and other obligations (note 19) Commitments and contingencies (notes 20 and 22) Equity: (note 14) Common shares Treasury shares (7) (7) Additional paid-in capital 33,835 33,813 Retained earnings 17,072 7,951 Legal reserve 40 1,001 Total equity 51,341 43,159 Total liabilities and equity 73,812 64,602 The accompanying notes are an integral part of these financial statements.
207 Financial statements 207 ArcelorMittal Statements of operations and statements of other comprehensive income Income from industrial franchise agreement fees (note 11) General and administrative expenses, including 472 and 454 with related parties in 2017 and 2016 (note 11) Operating income Income from subsidiaries and associates (note 16) (Impairment) reversal of investments (notes 7 and 8) Impairment of loans (note 11) Year ended December 31, 2017 Year ended December 31, (590) (508) ,108 5,086 (129) Financing costs - net, including 590 and 391 from related parties in 2017 and 2016, respectively (notes 11 and 15) 1,101 Income (loss) before taxes 7,220 Income tax (expense) benefit (note 17) 942 (8,817) (114) (338) 5,053 (330) 8,162 4,723 Year ended December 31, 2017 Year ended December 31, 2016 Basic Diluted Basic 1, Diluted 1, Net income Earnings (loss) per common share (in U.S. dollars) 1 Weighted average ordinary shares outstanding (in millions) 1. Following ArcelorMittal's completion of the share consolidation of each three existing shares into one share without nominal value on May 22, 2017, the earnings (loss) per common share and corresponding basic and diluted weighted average common shares outstanding for prior periods has been recast in accordance with IFRS. Please refer to note 14 for more information. Year ended December 31, 2017 Year ended December 31, ,162 4,723 Gain (loss) arising during the period 12 Reclassification adjustments for loss (gain) included in the statements of operations (74) (62) Net income Items that can be recycled to the statements of operations Available-for-sale investments: Items that cannot be recycled to the statements of operations Employee benefits Other comprehensive income (loss) Total comprehensive income (loss) The accompanying notes are an integral part of these financial statements. 8,162 (62) 4,661
208 208 Financial statements ArcelorMittal Statements of Changes in Equity Reserves Items that can be recycled to the statements of operations Shares 1 Share capital 1,001 4, ,971 10,376 Other comprehensive income (loss) 421 Reduction of the share capital par value (note 14) Legal reserve 3,229 Net income Equity offering (note 14) Retained earnings 19,291 10,011 Total comprehensive income (loss) Additional paid-in capital 1, Balance at December 31, 2015 Mandatorily convertible notes Treasury shares Unrealized gains (losses) on availablefor-sale financial assets (10,376) (11) Recognition of share-based payments (note 14) Conversion of mandatorily convertible notes (note 14) Other (1,800) (7) 1,178 (2) 4 Total Equity 62 35,383 4,723 (62) 4,723 (62) 4,661 3,115 (1) (1) 1 (62) 1, (7) 33,813 7,951 1,001 43,159 Net income 8,162 8,162 Other comprehensive income (loss) Total comprehensive income (loss) 8,162 8,162 Reduction of legal reserve (note 14) 961 Acquisition of treasury shares (9) (9) Recognition of share-based payments (note 14) Other (2) (2) 1, (7) 33, Balance at December 31, 2016 Balance at December 31, ,072 (961) 51,341 Amounts are in millions of shares (treasury shares are excluded). On May 22, 2017, ArcelorMittal completed the consolidation of each three existing shares in ArcelorMittal without nominal value into one share without nominal value. As a result of this reverse stock split, the number of outstanding shares decreased from 3,065 to 1,022 and all prior periods have been recast in accordance with IFRS. Please refer to note 14 for further information. The accompanying notes are an integral part of these financial statements.
209 Financial statements 209 ArcelorMittal Statements of Cash Flows Year ended December 31, ,162 4,723 Operating activities: Net income Adjustments to reconcile net income to net cash provided by operations: Depreciation of intangible and tangible assets (note 6) Impairment (reversal) of investments (notes 7 and 8) 9 (5,086) 9 8, Interest expense (note 15) 998 1,337 Interest income (note 15) (985) Income tax expense (benefit) (note 17) (942) 330 Change in fair value adjustments on call option on the mandatory convertible bonds (note 13) (809) (171) Impairment of financial loans (note 11) (Gain) on disposal of financial assets (note 15) Income from subsidiaries and associates (note 16) Net (gain) loss on other derivative instruments (note 15) Unrealized foreign exchange effects, other provisions and non-cash operating expenses, net (802) (46) (73) (836) (14,108) 132 (17) 94 (131) Changes in assets and liabilities that provided (required) cash: Interest paid (939) (1,459) Interest received Taxes received ,761 Dividends received Payables for services related to industrial franchise agreement Receivables for industrial franchise agreement fees Premiums and fees related to early redemption of bonds Other working capital and provisions movements Net cash provided by operating activities (169) (389) (399) 44 1,702 (108) 2,105 Investing activities: Purchase of property, plant and equipment and intangibles (note 6) Investments in subsidiaries (note 7) Disposals of financial assets (1) (272) 488 (2) (9) 367 4,262 2,459 Loans granted to related parties (6,366) (2,838) Net cash used in investing activities (1,889) (23) Proceeds from loans granted to related parties Financing activities: Equity offering Proceeds from short-term debt 3,115 3,709 1,899 1,378 1,215 Payments of short-term debt (2,449) (2,676) Payments of long-term debt (2,689) (7,196) Other financing activities net (2) (2) (53) (3,645) (240) (1,563) Proceeds from long-term debt Net cash used in financing activities Net decrease in cash and cash equivalents Cash and cash equivalents: At the beginning of the year At the end of the year The accompanying notes are an integral part of these financial statements. 1,039 2, ,039
210 210 Financial statements Amendments to IAS 12 Income Taxes issued on January 19, 2016, which clarify how to account for deferred tax assets related to debt instruments measured at fair value and how to recognize deferred tax assets for unrealized losses. Annual Improvements published on December 8, 2016, which amended IFRS 12 Disclosure of Interests in Other Entities and clarifies the scope of the standard by specifying that the disclosure requirements in the standard apply to an entity s interests that are classified as held for sale, as held for distribution or as discontinued operations in accordance with IFRS 5 Non-current Assets Held for Sale and Discontinued Operations. Note 1: General ArcelorMittal (the Company ) was incorporated as a Société Anonyme under Luxembourg law on June 8, 2001 for an unlimited period. The Company has its registered office in boulevard d Avranches, Luxembourg City and is registered at the Register of Trade and Commerce of Luxembourg under the number B The financial year of the Company starts on January 1 and ends on December 31 each year. The Company s corporate goal is the manufacturing, processing and marketing of steel products, all other metallurgical products, mining products and any other activity directly or indirectly related thereto. The Company realizes its corporate goal either directly or through the creation of companies or the acquisition and holding of interests in companies, partnerships, associations, consortia and joint ventures. These financial statements correspond to the separate financial statements of the parent company, ArcelorMittal, and were authorized for issuance on March 12, 2018 by the Company s Board of Directors. In conformity with the requirements of Luxembourg laws and regulations, the Company publishes consolidated financial statements in accordance with International Financial Reporting Standards ( IFRS ) as issued by the International Accounting Standards Board ( IASB ) and as adopted by the European Union. Note 2: Basis of Presentation Statement of compliance The financial statements have been prepared in accordance with IFRS as adopted by the European Union and in particular with IAS 27 Separate Financial Statements as well as in accordance with chapter IIbis and art 72bis of the Luxembourg amended law of December 19, Adoption of new IFRS standards, amendments and interpretations applicable from January 1, 2017 On January 1, 2017, the Company adopted amendments to IAS 7 Statement of Cash Flows issued on January 29, 2016, which clarify that entities shall provide disclosures (see note 4) that enable users of financial statements to evaluate changes in liabilities arising from financing activities, including non-cash changes and changes arising from cash flows. On January 1, 2017, the Company adopted the following amendments which did not have any material impact on the financial statements of the Company: New IFRS standards, amendments and interpretation applicable from 2018 onward On May 28, 2014, the IASB issued IFRS 15 Revenue from Contracts with Customers which provides a unified fivestep model for determining the timing, measurement and recognition of revenue. The focus of the new standard is to recognize revenue as performance obligations are met rather than based on the transfer of risks and rewards. IFRS 15 includes a comprehensive set of disclosure requirements including qualitative and quantitative information about contracts with customers to understand the nature, amount, timing and uncertainty of revenue. The standard supersedes IAS 18 Revenue, IAS 11 Construction Contracts and a number of revenue-related interpretations. On September 11, 2015, the IASB issued an amendment formalizing a oneyear deferral of the effective date for annual periods beginning on or after January 1, 2018, with early application permitted. On April 12, 2016, the IASB issued amendments to IFRS 15 which clarify how to identify a performance obligation, determine whether a company is a principal or an agent and determine when the revenue from granting a license should be recognized. These amendments are also effective for annual periods beginning on or after January 1, 2018, with early application permitted. The Company s revenue corresponds only to income from industrial franchise agreement fees resulting from the licensing of its business model for manufacturing, processing and distributing steel to group subsidiaries. The Company concluded that there will not be a material impact from the adoption of IFRS 15 as of January 1, 2018, and it intends to apply the full retrospective transition approach without any practical expedients. On July 24, 2014, the IASB issued the final version of IFRS 9 Financial Instruments (2014) which replaces IAS 39 and modifies substantially the classification and measurement of financial instruments. The final version of the standard contains requirements in the following areas: Classification and measurement: Financial assets are classified and measured by reference to the business
211 Financial statements 211 model within which they are held and their contractual cash flow characteristics. Financial liabilities are classified in a similar manner to IAS 39, however there are differences in the requirements regarding the measurement of an entity's own credit risk. Impairment: The standard introduces an 'expected credit loss' model replacing the current incurred loss model for the measurement of the impairment of financial assets; it is therefore no longer necessary for a credit event to have occurred before a credit loss is recognized. Hedge accounting: The standard introduces a new hedge accounting model that is designed to more closely align with how entities undertake risk management activities when hedging financial and nonfinancial risk exposures, which may result in the increased application of hedge accounting. Derecognition: The requirements for derecognition of financial assets and liabilities are carried forward from IAS 39. IFRS 9 is effective for annual periods beginning on or after January 1, 2018, with early application permitted and is applied retrospectively, except for the hedge accounting requirements which are applied prospectively. The Company has substantially finalized its assessment of the impact upon adoption of IFRS 9 and does not expect this impact to be material. While ArcelorMittal will provide additional disclosures as required by the new standard, the Company does not expect the standard to materially impact the measurement of either its financial liabilities, which are mainly carried at amortized cost or its financial assets, which are mainly comprised of cash and cash equivalents and loans and receivables. On January 13, 2016, the IASB issued IFRS 16 Leases which will replace IAS 17 Leases. This new standard specifies how to recognize, measure, present and disclose leases. The standard provides a single lessee accounting model, requiring lessees to recognize assets and liabilities for all leases unless the lease term is 12 months or less or the underlying asset has a low value. This standard is effective for annual periods beginning on or after January 1, 2019, with early application permitted if IFRS 15 has also been applied. At December 31, 2017 and 2016, the Company has non-cancellable operating lease commitments on an undiscounted basis of 25 and 37, respectively. The Company does not expect that the adoption of IFRS 16 will have a material impact to its financial statements. On September 12, 2016, the IASB issued amendments to IFRS 4 Insurance Contracts. These amendments propose two approaches (an overlay approach and a deferral approach) in order to address temporary volatility in reported results arising from implementing the new financial instruments Standard IFRS 9 before implementing the replacement standard that the board is developing for IFRS 4. These amendments to IFRS 4 supplement existing options in the Standard that can already be used to address the temporary volatility. These amendments are effective when an insurer first applies IFRS 9 (overlay approach) or during the three years period beginning on January 1, 2018 (deferral approach). The Company does not expect that the adoption of these amendments will have a material impact to its financial statements. On June 20, 2016, the IASB issued amendments to IFRS 2 Share-based Payment. These amendments clarify the effects of vesting and non-vesting conditions on the measurement of cash-settled share-based payments; the treatment of share-based payment transactions with a net settlement feature for withholding tax obligations; and the treatment of a modification to the terms and conditions of a share-based payment that changes the classification of the transaction from cash-settled to equity-settled. These amendments are effective for annual periods beginning on or after January 1, 2018, with early application permitted. The Company does not expect that the adoption of these amendments will have a material impact to its financial statements. The Company does not plan to early adopt the new accounting standards, amendments and interpretations. New IFRS standards, amendments and interpretations not yet endorsed by the European Union On December 8, 2016, the IASB issued IFRIC 22 Foreign Currency Transactions and Advance Consideration. This interpretation provides guidance about which exchange rate to use in reporting foreign currency transactions (such as revenue transactions) when payment is made or received in advance. This interpretation is effective for annual periods beginning on or after January 1, 2018, with early application permitted. The Company does not expect that the adoption of this interpretation will have a material impact to its financial statements. On May 18, 2017, the IASB issued IFRS 17 "Insurance Contracts", which is designed to achieve the goal of a consistent, principle-based accounting for insurance contracts. IFRS 17 requires insurance liabilities to be measured at a current fulfillment value and provides a more uniform measurement and presentation approach for all insurance contracts. IFRS 17 supersedes IFRS 4 "Insurance Contracts" and related interpretations and is effective for periods beginning on or after January 1, 2021, with earlier adoption permitted if both IFRS 15 "Revenue from Contracts with Customers" and IFRS 9 "Financial Instruments" have also been applied. The adoption of this new standard will not impact the financial statements of the Company.
212 212 Financial statements On June 7, 2017, the IASB issued IFRIC 23 Uncertainty over Income Tax Treatments. This interpretation addresses the determination of taxable profit (tax loss), tax bases, unused tax losses, unused tax credits and tax rates when there is uncertainty over income tax treatments under IAS 12. This interpretation is effective for annual periods beginning on or after January 1, 2019, with early application permitted. The Company does not expect that the adoption of this interpretation will have a material impact to its financial statements. On October 12, 2017, the IASB issued an amendment to IFRS 9 in respect of prepayment features with negative compensation, which amends the existing requirements in IFRS 9 regarding termination rights in order to allow measurement at amortized cost (or, depending on the business model, at fair value through other comprehensive income) even in the case of negative compensation payments. This amendment is effective for annual periods beginning on or after January 1, 2019, with early application permitted. The Company does not expect that the adoption of this amendment will have a material impact to its financial statements. Also, on October 12, 2017, the IASB issued an amendment to IAS 28 Investments in Associates and Joint Ventures in relation to long-term interests in associates and joint ventures. The amendment clarifies that an entity applies IFRS 9 to long-term interests in an associate or joint venture that form part of the net investment in the associate or joint venture but to which the equity method is not applied. This amendment is effective for annual periods beginning on or after January 1, 2019, with early application permitted. The Company does not expect that the adoption of this amendment will have a material impact to its financial statements. On December 12, 2017 the IASB issued Annual Improvements to make amendments to the following standards: IFRS 3 "Business Combinations" clarifies that when an entity obtains control of a business that is a joint operation, it remeasures previously held interests in that business. IFRS 11 "Joint Arrangements" clarifies that when an entity obtains joint control of a business that is a joint operation, the entity does not remeasure previously held interests in that business. IAS 12 "Income Taxes" clarifies that all income tax consequences of dividends should be recognized in profit or loss, regardless of how the tax arises. IAS 23 "Borrowing Costs" clarifies that if any specific borrowing remains outstanding after the related asset is ready for its intended use or sale, that borrowing becomes part of the funds that an entity borrows generally when calculating the capitalization rate on general borrowings. These amendments are effective for annual periods beginning on or after January 1, 2019, with early application permitted. The Company does not expect that the adoption of these amendments will have a material impact to its financial statements. On February 7, 2018, the IASB issued amendments to IAS 19 Employee benefits which clarify that current service cost and net interest after a remeasurement resulting from a plan amendment, curtailment or settlement should be determined using the assumptions applied for the remeasurement. In addition, the amendments clarify the effect of a plan amendment, curtailment or settlement on the requirements regarding the asset ceiling. These amendments are effective for annual periods beginning on or after January 1, 2019, with early application permitted. The Company does not expect that the adoption of these amendments will have a material impact to its financial statements. The Company does not plan to early adopt the new accounting standards, amendments and interpretations. Basis of measurement The financial statements have been prepared on a historical cost basis, except for derivative financial instruments which are measured at fair value. Functional and presentation currency These financial statements are presented in US dollars which is the Company s functional currency. Unless otherwise stated, all amounts are rounded to the nearest million, except share and earnings per share data. Use of estimates and judgments The preparation of financial statements in conformity with IFRS requires management to make judgments, estimates and assumptions that affect the application of accounting policies and the reported amounts of assets, liabilities, income and expenses. Actual results may differ from these estimates. Estimates and underlying assumptions are reviewed on an ongoing basis. Revisions to accounting estimates are recognized in the period in which the estimates are revised and in any future periods affected. Information about critical judgments in applying accounting policies that have the most significant effect on the amounts recognized in the financial statements is included in the following note.
213 Financial statements 213 Note 3: Significant accounting policies The accounting policies set out below have been applied consistently by the Company to all periods presented in these financial statements. (a) Foreign currency Transactions in foreign currencies are translated to the functional currency of the Company at exchange rates at the dates of the transactions. Monetary assets and liabilities denominated in foreign currencies at the reporting date are translated to the functional currency at the exchange rate at that date and the related foreign currency gain or loss are reported within financing costs in the statements of operations. Non-monetary assets and liabilities denominated in foreign currencies that are measured at fair value are translated to the functional currency at the exchange rate at the date that the fair value was determined and the related gains and losses are reported in the statements of other comprehensive income. Non-monetary items in a foreign currency that are measured at historical cost are translated using the exchange rate at the date of the transaction. Foreign currency differences arising from translation of nonmonetary assets and liabilities are recognized in the statements of operations. (b) Fair value The Company classifies the bases used to measure certain assets and liabilities at their fair value. Assets and liabilities carried or measured at fair value have been classified into three levels based upon a fair value hierarchy that reflects the significance of the inputs used in making the measurements. The levels are as follows: Level 1: Quoted prices in active markets for identical assets or liabilities that the entity can access at the measurement date; Level 2: Significant inputs other than within Level 1 that are observable for the asset or liability, either directly (i.e.: as prices) or indirectly (i.e.: derived from prices); Level 3: Inputs for the assets or liabilities that are not based on observable market data and require management assumptions or inputs from unobservable markets. (c) Financial instruments (i) Non-derivative financial assets The Company initially recognizes non-derivative financial assets on the date that they are originated, which is the date that the Company becomes a party to the contractual provisions of the instrument. The Company derecognizes a financial asset when the contractual rights to the cash flows from the asset expire, or it transfers the right to receive the contractual cash flows from the financial asset in a transaction in which substantially all the risks and rewards of ownership of the financial asset are transferred. Any interest in transferred financial assets that is created or retained by the Company is recognized as a separate asset or liability. Financial assets and liabilities are offset and the net amount presented in the statements of financial position when, and only when, the Company has legal right to offset the amounts and intends either to settle on a net basis or to realize the asset and settle the liability simultaneously. The Company has the following non-derivative financial assets: Loans and other financial assets Loans and other financial assets are financial assets with fixed or determinable payments that are not quoted in an active market. Such assets are recognized initially at fair value plus any directly attributable transaction costs. Subsequent to initial recognition, loans and other financial assets are measured at amortized cost using the effective interest method, less any impairment losses. Loans and other financial assets comprise receivables from other ArcelorMittal group entities, advances to suppliers and other receivables. Cash and cash equivalents Cash and cash equivalents consist of cash and short-term highly liquid investments that are readily convertible to cash with original maturities of three months or less at the time of purchase and are carried at cost plus accrued interest, which approximates fair value. (ii) Non-derivative financial liabilities and equity instruments Classification as debt or equity Debt and equity instruments are classified as either financial liabilities or as equity in accordance with the substance of the contractual arrangement. Equity instruments Any contract that evidences a residual interest in the assets of an entity after deducting all of its liabilities is accounted for as an equity instrument. Equity instruments issued by the Company are recorded at the proceeds received, net of direct issuance costs. A contract that is settled by the Company receiving or delivering a fixed number of its own shares for no future consideration, or exchanging a fixed number of its own shares for a fixed amount of cash or another financial asset, is also recognized as an equity instrument.
214 214 Financial statements Mandatorily convertible notes Mandatorily convertible notes issued by the Company are accounted for as compound financial instruments. The net present value of the coupon payments at issuance date is recognized as long-term obligation and carried at amortized cost. The value of the equity component is determined based upon the difference of the cash proceeds received from the issuance of the notes and the net present value of the financial liability component on the date of issuance and is included in equity. Financial liabilities Financial liabilities such as loans and borrowings and other payables are recognized initially on the trade date, which is the date that the Company becomes a party to the contractual terms of the instrument. Financial liabilities are recognized initially at fair value less any directly attributable transaction costs. Subsequent to initial recognition, these financial liabilities are measured at amortized cost using the effective interest method. The Company derecognizes a financial liability when its contractual obligations are settled or cancelled or expired. Loans and borrowings are classified as current liabilities unless the Company has an unconditional right to defer settlement of the liability for at least twelve months after the financial position date. (iii) Derivative financial instruments The Company enters into derivative financial instruments principally to manage its exposure to fluctuations in exchange rates. Derivative financial instruments are classified as current assets or liabilities based on their maturity dates and are accounted for at trade date. Embedded derivatives are separated from the host contract and accounted for separately if they are not closely related to the host contract. The Company measures all derivative financial instruments based on fair values derived from market prices of the instruments or from option pricing models, as appropriate. Gains or losses arising from changes in fair value of derivatives are recognized in the statements of operations. (d) Investments in subsidiaries, associates, joint ventures and other investments Subsidiaries are those companies over which the Company exercises control. The Company controls an entity when it is exposed to or has rights to variable returns from its involvement with the entity and has the ability to affect those returns through its power over the entity. Investments in subsidiaries are accounted for under the cost method. Associated companies are those companies over which the Company has the ability to exercise significant influence on the financial and operating policy decisions and which are not subsidiaries. Generally, significant influence is presumed to exist when the Company holds more than 20% of the voting rights. Joint ventures are those companies over which the Company exercises joint control and has rights to the net assets of the arrangement. Investments in associates in which ArcelorMittal has the ability to exercise significant influence and joint ventures are accounted for at cost. Investments in other entities, over which the Company does not have the ability to exercise significant influence and have a readily determinable fair value are accounted for at fair value with any resulting gain or loss recognized in the reserves in other comprehensive income. To the extent that these investments do not have a readily determinable fair value, they are accounted for under the cost method. The Company reviews all its investments at each reporting date to determine whether there is an indicator that the investment may be impaired. If evidence indicates that the investment is impaired, ArcelorMittal calculates the amount of the impairment of the investment as being the difference between the higher of the fair value less costs to sell or its value in use and its carrying value. (e) Impairment Financial assets are assessed at each reporting date to determine whether there is any evidence that it is impaired or whenever changes in circumstances indicate that the carrying amount may not be recoverable. A financial asset is impaired if evidence indicates that a loss event has occurred after the initial recognition of the asset, and that the loss event had a negative effect on the estimated future cash flows of that asset that can be estimated reliably. Evidence that financial assets are impaired can include default or delinquency by a debtor, restructuring of an amount due to the Company on terms that the Company would not consider otherwise, indications that a debtor or issuer will enter bankruptcy, adverse changes in the payment status of borrowers, economic conditions that correlate with defaults or the disappearance of an active market for a security.
215 Financial statements 215 The recoverable amount of investments is the greater of value in use and fair value less costs to sell. In assessing value in use, the estimated future cash flows are discounted to their present value using a pre-tax discount rate that reflects current market assessments of the time value of money and the risks specific to the investment. An impairment loss in respect of a financial asset measured at amortized cost is calculated as the difference between its carrying amount and the present value of the estimated future cash flows discounted at the asset s original effective interest rate. Losses are recognized in the statements of operations and reflected in an allowance account against receivables. Interest on the impaired asset continues to be recognized. When a subsequent event causes the amount of impairment loss to decrease or if there has been a change in the estimates used to determine the recoverable amount, the decrease in impairment loss is reversed through the statements of operations. (f) Assets held for sale Non-current assets that are classified as held for sale are measured at the lower of carrying amount and fair value less cost to sell. Assets are classified as held for sale if their carrying amount will be recovered through a sale transaction rather than through continuing use. This condition is regarded as met only when the sale is highly probable and the asset is available for immediate sale in its present condition and is marketed for sale at a price that is reasonable in relation to its current fair value. Assets held for sale are presented separately in the statement of financial position. Gains (losses) on disposal are presented in financing costs-net. (g) Intangible assets Intangible assets are recognized only when it is probable that the expected future economic benefits attributable to the assets will accrue to the Company and the cost can be reliably measured. Intangible assets acquired separately by the Company are initially recorded at cost; they include primarily the cost of technology and licenses purchased from third parties. Intangible assets are amortized on a straight-line basis over their estimated economic useful lives, which typically do not exceed five years. Amortization is included in the statements of operations as part of general and administrative expenses. Amortization methods applied to intangible assets are reviewed at each reporting date and changed if there has been a significant change in the expected pattern of consumption of the future economic benefits embodied in the assets. (h) Provisions and accruals The Company recognizes provisions for liabilities and probable losses that have been incurred when it has a present legal or constructive obligation as a result of past events and it is probable that the Company will be required to settle the obligation and a reliable estimate of the amount of the obligation can be made. If the effect of the time value of money is material, provisions are discounted using a current pre-tax rate that reflects, where appropriate, the risks specific to the liability. When discounting is used, the increase in the provision due to the passage of time is recognized as a financing cost. Provisions for onerous contracts are recorded in the statements of operations when it becomes known that the unavoidable costs of meeting the obligations under the contract exceed the economic benefits expected to be received. (i) Income taxes The Company is the head of a tax integration and is fully liable for the overall tax liability of the tax integration. Each of the entities included in the tax integration is charged with the amount of tax that relates to its individual taxable profit and this tax is paid to ArcelorMittal. Tax losses at entity level are transferred to the Company where they are offset with taxable profits for the determination of the net taxable income of the tax integration. Entities do not pay any tax expense to ArcelorMittal on their individual taxable profits prior to full utilization of their individual cumulative tax losses. The tax currently payable is based on taxable profit for the year. Taxable profit differs from profit as reported in the statements of operations because it excludes items of income or expense that are never taxable or deductible. The Company s current income tax expense (benefit) is calculated using tax rates that have been enacted or substantively enacted as of the statements of financial position date. Deferred tax is recognized on differences between the carrying amounts of assets and liabilities, in the financial statements and the corresponding tax basis used in the computation of taxable profit, and is accounted for using the statements of financial position liability method. Deferred tax liabilities are generally recognized for all taxable temporary differences, and deferred tax assets are generally recognized for all deductible temporary differences. Deferred tax assets are recognized for net operating loss carry forwards of all entities within the tax integration to the extent that it is probable that taxable profits will be available against which those carry forwards can be utilized. Deferred tax assets and liabilities are measured at the tax rates that are expected to apply in the period in which the liability is settled or the asset realized, based on tax rates (and tax laws) that have been enacted or substantively
216 216 Financial statements enacted by the statement of financial position date. The measurement of deferred tax liabilities and assets reflects the tax consequences that would follow from the manner in which the Company expects, at the reporting date, to recover or settle the carrying amount of its assets and liabilities. The carrying amount of deferred tax assets is reviewed at each statement of financial position date and reduced to the extent that it is no longer probable that sufficient taxable profits will be available to enable all or part of the asset to be recovered. (j) Financing costs-net Financing costs-net include mainly interest income and expense, gains (losses) on disposal of investments, fair value adjustments of the call option on mandatory convertible bonds, gains (losses) on other derivative instruments, premiums and fees on borrowings and foreign exchange gains and losses. (k) Income from investments and from industrial franchise agreement Dividend income is recognized when the shareholders rights to receive payment have been established. Interest income is accrued as earned, by reference to the principal outstanding and at the prevailing effective interest rate. Income from contractually arranged corporate services is deducted from general and administrative expenses. In connection with an industrial franchise agreement ("IFA") with group subsidiaries, the Company licenses its business model for manufacturing, processing and distributing steel to group subsidiaries. The business model includes the ArcelorMittal business intelligence, which is a package of business solutions and implementation support combined with the development and maintenance of intangibles such as the ArcelorMittal brand, ArcelorMittal global information technology solutions, ArcelorMittal global research & development and ArcelorMittal global purchase agreements. The industrial franchise fee is calculated as a percentage of the steel sales of the franchisee entities after deduction of purchases of steel products from other franchisee entities. (l) Earnings per common share Basic earnings per common share is computed by dividing net income (loss) available to equity holders as per the consolidated financial statements by the weighted average number of common shares outstanding during the year. Diluted earnings per share is computed by dividing net income (loss) available to equity holders as per the consolidated financial statements by the weighted average number of common shares and potential common shares from share unit plans and outstanding stock options as well as potential common shares from the conversion of certain convertible bonds whenever the conversion results in a dilutive effect. (m) Equity settled share-based payments The Company issues equity-settled share-based payments to certain of its employees and employees of its subsidiaries, including stock options and restricted share units. Equity-settled share-based payments are measured at fair value (excluding the effect of non market-based vesting conditions) at the date of grant. The fair value determined at the grant date of the equity-settled sharebased payments is recognized on a graded vesting basis over the vesting period, based on the Company s estimate of the shares that will eventually vest and adjusted for the effect of non market-based vesting conditions. Such fair value is expensed with respect to share-based payments issued to the Company s employees and recognized as a capital contribution for share-based payments issued to employees of subsidiaries. For stock options and restricted share units, fair value is measured using the Black-ScholesMerton pricing model and the market value of the shares at the date of the grant after deduction of dividend payments during the vesting period, respectively. The expected life used in the model has been adjusted, based on management s best estimate, for the effects of nontransferability, exercise restrictions and behavioral considerations.
217 Financial statements 217 Note 4: Cash, cash equivalents and reconciliation of cash flows Cash and cash equivalents consisted of the following: 2017 December 31, 2016 Cash at bank interest bearing Money market funds Total 799 1, Money market funds are highly liquid investments with a maturity of 3 months or less from the date of acquisition. Reconciliation of liabilities arising from financing activities The table below details changes in the Company's liabilities arising from financing activities, including both cash and non-cash changes. Liabilities arising from financing activities are those for which cash flows were, or future cash flows will be classified in the Company's statement of cash flows from financing activities. Third parties Balance as of December 31, 2016 (see notes 11 and 12) Proceeds from long-term debt Payments of long-term debt Long-term debt, net of current portion Non-current loans from related parties Current loans from related parties 11, ,543 3,866 1,378 (2,689) ,405 2,304 (1,239) (1,210) Amortized cost 19 Unrealized foreign exchange effects Proceeds from short-term debt Payments of short-term debt Current portion of long-term debt (907) Other movements Balance as of December 31, 2017 (see notes 11 and 12) Related parties Short-term debt and current portion of long term debt (1) 9, (1,539) 1,539 2,263 3,418 6,499 Note 5: Prepaid expenses and other current assets Prepaid expenses and other current assets consisted of the following: 2017 December 31, 2016 Receivables from related parties - tax integration Receivables from related parties - corporate services Other Total ,064 1,148 Receivables from related parties on tax integration correspond to income tax receivables from entities included in the tax integration headed by the Company. Receivables from related parties for corporate services are mainly related to income from IFA fees. Balances with related parties are detailed in note 11.
218 218 Financial statements Note 6: Tangible and intangible assets Property, plant and equipment are summarized as follows: Land, buildings and improvements Other fixtures and fittings, tools and equipment Total Cost December 31, 2015 Disposal (1) (1) December 31, Disposal (1) (1) December 31, Accumulated depreciation and impairment (35) (11) (46) Depreciation charge for the year (1) (1) Disposal 1 1 December 31, 2015 (36) (10) (46) Depreciation charge for the year (1) (1) Disposal 1 1 (36) (10) (46) December 31, 2016 December 31, 2017 Carrying amount December 31, December 31, Intangible assets are summarized as follows: Patents and licenses Cost December 31, Additions 2 Disposal (62) December 31, 2016 Additions December 31, Accumulated amortization and impairment December 31, 2015 Amortization charge for the year Disposal December 31, 2016 Amortization charge for the year December 31, 2017 (85) (9) 62 (32) (8) (40) Carrying amount December 31, December 31,
219 Financial statements 219 Note 7: Investments in subsidiaries Investments in subsidiaries are summarized as follows: Cost December 31, 2015 Acquisition in kind 1, 2, 4 Acquisition in cash 8 Disposals 3 Other 135,382 11,369 9 (1,171) 13 December 31, 2016 Acquisition in cash 6, 7 Disposals 3 Asset held for sale 4 Other 145, (2,450) (44) 26 December 31, ,406 Accumulated impairment December 31, 2015 Impairment charge for the year Disposal 3 December 31, 2016 Impairment reversal for the year Disposal 3 December 31, 2017 (92,990) (8,723) 968 (100,745) 4,990 2,008 (93,747) Carrying amount December 31, ,857 December 31, ,659
220 220 Financial statements Subsidiary ArcelorMittal Spain Holding S.L. 1 ArcelorMittal Poland S.A. 2 Arcelor Investment SA 3 Ispat Inland S.à.r.l. ArcelorMittal Ostrava AS 4 Hera Ermac S.A. ArcelorMittal Tubular Products Ostrava a.s. 6 5 ArcelorMittal Tubular Products Karvina a.s. 7 ArcelorMittal Cyprus Holding Limited ArcelorMittal Canada Holding Inc. ArcelorMittal Italy Holding S.r.l. Other subsidiaries % 35,408 30,011 28, % 4,897 5,486 4, % 3,395 3,473 2, % 2,517 2,551 2, % 1,194 1, (214) % 1,013 1, % ,063 1, % (10) % % Nicosia (Cyprus) % Contrecoeur (Canada) 1.18% Piombino (Italy) 62.03% (4) ,659 44,857 Registered office AM Global Holding S.à.r.l. Oakey Holding BV 2017 Capital and reserves (including result for 2017)* and based on % of ownership Luxembourg (Luxembourg) Madrid (Spain) Ownership (%) as of December 31, 2017 Dabrowa Gornicza Luxembourg (Luxembourg) Luxembourg (Luxembourg) Ostrava (Czech Republic) Luxembourg (Luxembourg) Ostrava (Czech Republic) Amsterdam (The Netherlands) Ostrava (Czech Republic) 8 Total Carrying amount December 31, Result for 2017* and based on % of ownership (1,437) *In accordance with unaudited annual accounts and IFRS reporting packages. 1. ArcelorMittal Spain Holding S.L. On July 1, 2016, the Company received from AM Global Holding S.àr.l. an interim dividend in kind by means of a 100% interest in ArcelorMittal Spain Holding S.L. for a total consideration of 6,142 (6,839). 2. ArcelorMittal Poland S.A. On March 25, 2016, the Company received from AM Global Holding S.àr.l. an interim dividend in kind by means of a 100% interest in ArcelorMittal Poland S.A. for a total consideration of 3,113 (3,473). 3. Arcelor Investment SA On December 15, 2017, the Company sold a 2.8% interest in Arcelor Investment S.A. with a net carrying amount of 425 to various group subsidiaries. The total consideration received amounted to 403 (477) and resulted in a gain on disposal of 52. On December 15, 2016, the Company sold a 1.34 % interest in Arcelor Investment S.A. with a net carrying amount of 203 to various group subsidiaries. The total consideration received amounted to 192 (202) and resulted in a loss on disposal of ArcelorMittal Ostrava a.s. The Company's investment in ArcelorMittal Ostrava AS decreased by 44 on December 1, 2017 following a spin off resulting in the incorporation of Go Steel Frydek Místek ("Frydek Místek"). At December 31, 2017, the investment in Frydek Místek was classified as held for sale (see note 9). On June 29, 2016, the Company received from AM Global Holding S.à.r.l. an interim dividend in kind by means of a 100% interest in ArcelorMittal Ostrava AS for 953 (1,057). 5. Oakey Holding BV On February 7, 2018, the Company sold its investment in Oakey Holding BV to ArcelorMittal Belval and Differdange for ArcelorMittal Tubular Products Ostrava a.s. On January 20, 2017, the Company acquire 100% AM Tubular Products Ostrava a.s shares from ArcelorMittal Ostrava AS for CZK million (180). 7. ArcelorMittal Tubular Products Karvina a.s. On January 20, 2017, the Company acquire 100% AM Tubular Products Karvina a.s shares from ArcelorMittal Ostrava AS for CZK million (92). 8. Other subsidiaries On December 22, 2016, the Company acquired a 25 % interest in ArcelorMittal Germany Holding GmbH from Quadra International Services B.V. for an amount of 8 (9).
221 Financial statements 221 Impairment The Company assesses at the end of each reporting period whether there is any indication that its investments in subsidiaries may be impaired. As the Company s investments in subsidiaries correspond mainly to holding companies, in making this assessment, the Company considered indicators of impairment of steel and mining operations held directly and indirectly by such holding companies such as significant declines in operational results or changes in the outlook of future profitability, among other potential indicators. As of December 31, 2017, the Company determined that there was an indication that its investments in subsidiaries may be impaired or subject to an impairment reversal. When an indication of impairment exists, the Company estimates the recoverable amount of the investments in subsidiaries measured based on the value in use of underlying steel and mining operations. The value in use was determined by estimating cash flows for a period of five years for subsidiaries holding businesses engaged in steel operations and over the life of the mines for those holding businesses engaged in mining operations. With respect to steel operations, the key assumptions for the value in use calculations are primarily the discount rates, growth rates, expected changes to average selling prices, shipments and direct costs during the period. Assumptions for average selling prices and shipments are based on historical experience and expectations of future changes in the market. Cash flow forecasts are derived from the most recent financial plans approved by management. Beyond the specifically forecasted period of five years, the Company extrapolates cash flows for the remaining years based on an estimated constant growth rate of 2%. This rate does not exceed the average longterm growth rate for the relevant markets. Regarding mining operations, the key assumptions for the value in use calculations are primarily the discount rates, capital expenditure, expected changes to average selling prices, shipments and direct costs during the period. Management estimates discount rates using pre-tax rates that reflect current market rates for investments of similar risk. The rate for each investment was estimated from the weighted average cost of capital of producers, which operate a portfolio of assets similar to those of the Company s assets. The weighted average pre-tax discount rates used for the Company's steel business range from 11.0% to 16.3% and vary by geographic location. In 2017, the Company recognized a total net impairment reversal of 4,990 with respect to investments in subsidiaries based on value in use as a result of higher future cash flow projections due to improved market conditions and the increase in the value in use of euro denominated investments in connection with the appreciation of the euro against the U.S. dollar. The total net impairment reversal included 5,372 related to the Company s investment in AM Global Holding S.à.r.l. It included also impairment reversals of 390, 69, 27 and 23 related to the Company s investments in Arcelor Investment S.A., Oakey Holding BV, ArcelorMittal Cyprus Holding Limited and ArcelorMittal Canada Holdings Inc., respectively. The Company also recognized impairment losses of 589, 214, 78 and 10 related to its investments in ArcelorMittal Spain Holding S.L., Ispat Inland S.à.r.l., ArcelorMittal Poland S.A. and ArcelorMittal Italy Holding S.r.l., respectively. The impairment charge is the amount by which the carrying amount of the Company s investments in these subsidiaries exceeded their respective estimated recoverable amounts as of December 31, In 2016, the Company recognized a total impairment charge of 10,176 with respect to investments in subsidiaries largely resulting from the dividends in kind it received (see note 16). The total impairment charge included 8,718 and 1,353 related to the Company s investments in AM Global Holding S.à.r.l. and ArcelorMittal Spain Holding S.L., respectively. It included also 44, 43 and 18 related to the Company s investments in ArcelorMittal Italy Holding S.r.l., ArcelorMittal Cyprus Holding Limited and Arcelor Investment S.A., respectively. The impairment charge is the amount by which the carrying amount of the Company s investments in these subsidiaries exceeded their respective estimated recoverable amounts as of December 31, Additionally, the Company recognized impairment reversals for 1,453, of which 1,408 related to ArcelorMittal s investment in Ispat Inland S.à.r.l as a result of an improved economic outlook for U.S. operations and 45 with respect to Hera Ermac S.A.
222 222 Financial statements Note 8: Investments in associates, joint ventures and other investments Investments in associates, joint ventures and other investments are summarized as follows: Investments accounted for at cost Available-for-sale investments 3 Total 2017 December 31, Investments accounted for at cost Cost 1,047 December 31, 2015 (433) Reclassification to assets held for sale (note 9) December 31, December 31, Accumulated impairment (588) December 31, 2015 Impairment charge for the year (94) Reclassification to assets held for sale (note 9) 433 (249) December 31, 2016 Impairment reversal for the year 96 (153) December 31, 2017 Carrying amount December 31, December 31, Investee VAMA1 China Oriental 2 Total Category Registered office 2017 Carrying amount December 31, 2016 Joint venture Loudi (China) 49.00% Associate Wanchan (Hong Kong) 14.44% Ownership (%) as of December 31, VAMA Valin ArcelorMittal Automotive Steel Co. Ltd. ( VAMA ) is a joint venture between the Company and Hunan Valin which produces steel for high-end applications in the automobile industry. VAMA supplies international automakers and first-tier suppliers as well as Chinese car manufacturers and their supplier networks. The plant was inaugurated on June 15, The Company assessed the recoverability of its investment and recognized a 11 impairment reversal and a 94 impairment loss as of December 31, 2017 and 2016, respectively. 2. China Oriental China Oriental Group Company Limited ( China Oriental ) is a Chinese integrated iron and steel conglomerate listed on the Hong Kong Stock Exchange ( HKEx ). In 2016, the Company assessed the recoverability of its investment and concluded that the recoverable amount exceeded the carrying amount. On January 27, 2017, in order to restore the minimum free float requirement, China Oriental issued 586,284,000 new shares resulting in a decrease of the Company s interest from 17.39% to 14.44%. Public trading resumed on February 1, In 2017, the Company assessed the recoverability of its investment and recognized an impairment reversal of 85.
223 Financial statements Hunan Valin On September 14, 2016, the Company sold its 10.08% stake in Hunan Valin to a private equity fund for a total consideration of 165. The sale resulted in a gain on disposal of 74 which correspond to the reclassification of accumulated unrealized gains from other comprehensive income to the statement of operations. Note 9: Assets held for sale On December 15, 2017, ArcelorMittal committed to a plan to sell its wholly owned subsidiary Go Steel Frýdek Místek ("Frýdek Místek"). Accordingly, the Company classified the investment as held for sale at December 31, The fair value measurement was determined using the contract price, a Level 3 unobservable input. On August 25, 2017, ArcelorMittal completed the sale of its 50% investment in Kalagadi Manganese following the signature of a sale and purchase agreement with Kgalagadi Alloys (Proprietary) on October 21, The consideration is deferred and to be paid during the life of the mine; it is capped at 150 contingent upon financial performance of the mine and cash flow availability. The investment in Kalagadi Manganese was classified as held for sale at December 31, The carrying amount of the investment and related loans was nil as of December 31, Note 10: Other assets Other assets are summarized as follows: Call option on mandatory convertible bonds December 31, Other derivative financial instruments 3 Other , Total 1. The Company holds the option to call the mandatory convertible bonds (see note 13).
224 224 Financial statements Note 11: Balances and transactions with related parties The Company entered into transactions with related parties that include companies and entities under common control and/or common management, companies under control (directly or indirectly) including their associates and joint ventures, their shareholders and key management personnel. Related parties include the Significant Shareholder, which is a trust of which Mr. Lakshmi N. Mittal and Mrs. Usha Mittal are the beneficiaries and which owns 37.4% of ArcelorMittal s ordinary shares. Transactions with related parties were as follows: Current loans to related parties Category 2017 December 31, 2016 Quadra International Services B.V. Subsidiary 1,260 1,114 Global Chartering Limited Subsidiary 220 ArcelorMittal Brasil S.A. Subsidiary ArcelorMittal Canada Holdings Inc. Subsidiary 84 ArcelorMittal South Africa Limited Subsidiary 6 88 JSC ArcelorMittal Temirtau Subsidiary 524 Related party Other Total ,749 2,099 The following table presents the current loan to related parties in original currencies: Presented in USD by original currency as at December 31, 2017 Current loans to related parties Total USD EUR USD BRL CAD Other 1,749 1, Accrued interests associated with the loans to related parties are also included in the above table. In 2017 and 2016, the Company assessed the recoverability of loans granted to related parties and recorded accordingly impairment losses of 129 and 114, of which 129 and 107 relating to loans granted to ArcelorMittal Liberia Holdings Limited, respectively. Other current assets Category 2017 December 31, 2016 PJSC ArcelorMittal Kryvyi Rih Subsidiary ArcelorMittal Germany Holding GmbH Subsidiary ArcelorMittal Atlantique et Lorraine Subsidiary ArcelorMittal Sourcing Subsidiary JSC ArcelorMittal Temirtau Subsidiary ArcelorMittal Belgium Subsidiary ArcelorMittal España, S.A. Subsidiary ArcelorMittal South Africa Limited Subsidiary Arcelor Investment SA Subsidiary ArcelorMittal USA LLC Subsidiary 168 Related party Other Total ,035 1,050
225 Financial statements 225 Non-current loans to related parties Related party December 31, 2016 Category 2017 ArcelorMittal Canada Holdings Inc. Subsidiary 3,163 ArcelorMittal Brasil S.A. Subsidiary 2,748 1,708 ArcelorMittal Treasury Americas LLC Subsidiary 2,298 5,094 ArcelorMittal USA Holdings Inc. Subsidiary 1,700 1,700 ArcelorMittal Tesoreria, S.A. de C.V., Sofom, E.N.R. Subsidiary 754 JSC ArcelorMittal Temirtau Subsidiary 447 ArcelorMittal South Africa Limited Subsidiary 218 ArcelorMittal Poland S.A. Subsidiary 108 Global Chartering Limited Subsidiary ,493 8,754 Other Total The following table presents the non-current loan to related parties in original currencies: Presented in USD by original currency as at December 31, 2017 Non-current loans to related parties Total USD 11,493 USD BRL CAD KZT MXN PLN ZAR 1,757 2,748 5, Current loans from related parties Category 2017 December 31, 2016 ArcelorMittal Treasury1 Subsidiary 3,833 2,502 ArcelorMittal Holdings AG Subsidiary 840 ArcelorMittal International FZE Subsidiary Ferrosure (Isle of Man) Insurance Co. Ltd Subsidiary Expert Placement Services Limited Subsidiary 425 ArcelorMittal Treasury Financial Services S.à r.l. Subsidiary 324 ArcelorMittal Luxembourg Subsidiary ArcelorMittal USA LLC Subsidiary 500 6,499 3,866 Related party Total 1. Current loans correspond to cash pooling balances. The following table presents the current loan from related parties in original currencies: Presented in USD by original currency as at December 31, 2017 Current loans from related parties Total USD EUR USD Other 6, ,481 1
226 226 Financial statements Accrued expenses and other liabilities Accrued expenses and other liabilities with related parties correspond mainly to payables to IFA service provided (research & development, IT, purchasing and segment costs). Category 2017 December 31, 2016 ArcelorMittal Europe Subsidiary ArcelorMittal Maizières Research SA Subsidiary Other Total Category 2017 December 31, 2016 ArcelorMittal Finance Subsidiary 3,418 3,004 ArcelorMittal Holdings AG Subsidiary 840 Expert Placement Services Limited Subsidiary 375 ArcelorMittal Treasury Financial Services S.à r.l. Subsidiary Related party Non-current loans from related parties Related party Total 324 3,418 4,543 The original currency of the non-current loans from related parties is euro. IFA fees Related party Category Year ended December 31, ArcelorMittal USA LLC Subsidiary ArcelorMittal Germany Holding GmbH Subsidiary ArcelorMittal Atlantique et Lorraine Subsidiary ArcelorMittal Belgium Subsidiary ArcelorMittal Poland S.A. Subsidiary ArcelorMittal Dofasco G.P. Subsidiary ArcelorMittal España, S.A. Subsidiary Other Total General and administrative expenses General and administrative expenses are net of income from contractually arranged corporate services. Related party Category Year ended December 31, ArcelorMittal Europe Subsidiary ArcelorMittal Maizières Research SA Subsidiary Other Total
227 Financial statements 227 Financing costs net Financing costs net included the following income from related parties for the year ended December 31, 2017 and 2016: Related party (income)/expenses Year ended December 31, 2016 Category 2017 ArcelorMittal Treasury S.N.C. Subsidiary ArcelorMittal Finance Subsidiary ArcelorMittal Canada Holdings Inc. Subsidiary (59) JSC ArcelorMittal Temirtau Subsidiary (64) (25) Quadra International Services B.V. Subsidiary (70) (69) ArcelorMittal USA Holdings Inc. Subsidiary (94) (94) ArcelorMittal Treasury Americas LLC Subsidiary (294) (293) ArcelorMittal Brasil S.A. Subsidiary (314) (242) Other (16) 32 Total (590) (391) Note 12: Short-term and long-term debt Short-term debt, including the current portion of long-term debt, consisted of the following: Short-term bank loans and other credit facilities including commercial paper Current portion of long-term debt Total 2017 December 31, , , In 2014, ArcelorMittal entered into certain short-term committed bilateral credit facilities. The facilities were extended in 2015, 2016 and As of December 31, 2017, the facilities, totaling approximately 0.6 billion, remain fully available. On September 15, 2017, ArcelorMittal entered into a short-term borrowing with a financial institution for CAD 936 million (771) with repayment over several dates in 2017 and As of December 31, 2017, CAD 236 million (188) was outstanding. Commercial paper The Company has a commercial paper program enabling borrowings of up to 1 billion. As of December 31, 2017, and 2016, the outstanding amount was 1,125 and 392, respectively.
228 228 Financial statements Long-term debt is comprised of the following: December 31, Year of maturity Type of Interest 5.5 billion Revolving Credit Facility billion tranche 2019 Floating 5.5 billion Revolving Credit Facility billion tranche 2021 Floating 1.0 billion Unsecured Bonds Fixed 5.88 % million Unsecured Notes 2018 Fixed 5.75 % million Unsecured Notes 2018 Floating 1.70 % Interest rate Fixed 6.13 % million Unsecured Notes 2019 Fixed 3.00 % billion Unsecured Notes Fixed % Unsecured Notes 2020 Fixed 5.13 % CHF 225 million Unsecured Notes 2020 Fixed 2.50 % million Unsecured Notes 2020 Fixed 2.88 % billion Unsecured Bonds 2020 Fixed 5.75 % billion Unsecured Notes 2021 Fixed 6.00 % million Unsecured Notes 2021 Fixed 3.00 % million Unsecured Notes 2022 Fixed 3.13 % billion Unsecured Notes Fixed 6.75 % 655 1, million Unsecured Notes 2023 Fixed 0.95 % Unsecured Notes 2025 Fixed 6.13 % billion Unsecured Bonds Fixed 7.50 % 1,092 1, % billion Unsecured Notes 1.0 billion Unsecured Notes Fixed Other loans Fixed EIB loan Fixed 1.16 % 420 ICO loan 2017 Floating 2.18 % Floating ,513 11,794 Other loans Total 1.25% % 0.01% % (950) Less current portion of long-term debt 9,563 Total long-term debt, net of current portion (597) 11, Rates applicable to balances outstanding at December 31, 2017, including the effect of step-ups and step-downs following rating changes. For debt that has been redeemed in its entirety during 2017, the interest rates refer to the rates at repayment date 2. Amount outstanding was repaid at the original maturity, November 17, Early redeemed on December 28, Early redeemed on April 3, Bonds or Notes partially repurchased on October 16, 2017, pursuant to cash tender offer. 5.5 billion Revolving Credit Facility Bonds On December 21, 2016, ArcelorMittal signed an agreement for a $5.5 billion revolving credit facility (the "Facility"). This Facility amends and restates the $6 billion revolving credit facility dated April 30, The amended agreement incorporates a first tranche of $2.3 billion maturing on December 21, 2019, and a second tranche of $3.2 billion maturing on December 21, 2021, restoring the Facility to the original tenors of 3 years and 5 years. The Facility may be used for general corporate purposes. As of December 31, 2017, the $5.5 billion revolving credit facility was fully available. On December 28, 2017, ArcelorMittal redeemed 644 (the remaining outstanding balance) of its 1.5 billion 6.125% Notes due June 1, 2018 for a total aggregate purchase price including accrued interest and premium on early repayment of 658, which was financed with existing cash and liquidity. On December 4, 2017, ArcelorMittal issued 500 million (600) 0.95% Notes due January 17, 2023, under its wholesale Euro Medium Term Notes Program. On November 17, 2017, at maturity, ArcelorMittal repaid the 540 million (647) principal amount that remained
229 Financial statements 229 outstanding, following the cash tender offers in April 2016, of its 1 billion 4.625% unsecured bonds. On October 16, 2017, pursuant to cash tender offers and financed with existing cash and liquidity, ArcelorMittal purchased: 441 of its U.S. dollar denominated 6.25% Notes due February 25, 2022 (the USD 2022 Notes ) for a total aggregate purchase price (including premiums and accrued interest) of 510. Following this purchase, 659 principal amount of the USD 2022 Notes remained outstanding. 371 of its U.S. dollar denominated 6.75% Notes due March 1, 2041 (the USD 2041 Notes ) for a total aggregate purchase price (including premiums and accrued interest) of 445. Following this purchase, 629 principal amount of the USD 2041 Notes remained outstanding. 383 of its U.S. dollar denominated 7.00% Notes due October 15, 2039 (the 2039 Notes ) for a total Nominal value Date of issuance aggregate purchase price (including premiums and accrued interest) of 464. Following this purchase, 1,117 principal amount of the USD 2039 Notes remained outstanding. On April 3, 2017, ArcelorMittal redeemed all of its outstanding 1.5 billion 9.85% Notes due June 1, 2019 for a total aggregate purchase price including accrued interest and premium on early repayment of 1,040, which was financed with existing cash and liquidity. As a result of the above mentioned redemptions, financing costs-net included 389 of premiums and other fees for the year ended December 31, The margin applicable to ArcelorMittal s principal credit facilities ($5.5 billion revolving credit facility and certain other credit facilities) and the coupons on certain of its outstanding bonds are subject to adjustment in the event of a change in its long-term credit ratings. The following table provides details of the outstanding bonds on maturity, the original coupons and the current interest rates for the bonds impacted by changes in the long-term credit rating: Repayment date Original interest rate Current interest rate 1 Euribor 3M % Euribor 3M % Issued at 400 million Unsecured Notes April 9, 2015 April 9, million Unsecured Notes March 29, 2012 March 29, % 5.75% 99.71% 750 million Unsecured Notes March 25, 2014 March 25, % 3.00% 99.65% June 1, 2015 June 1, % 5.13% 100% CHF 225 million Unsecured Notes July 3, 2015 July 3, % 2.50% 100% 600 million Unsecured Notes July 4, 2014 July 6, % 2.88% 99.18% 1.0 billion Unsecured Bonds August 5, 2010 August 5, % 5.75% 98.46% 1.5 billion Unsecured Notes March 7, 2011 March 1, % 6.00% 99.36% 500 million Unsecured Notes 100% 500 million Unsecured Notes April 9, 2015 April 9, % 3.00% 99.55% 750 million Unsecured Notes January 14, 2015 January 14, % 3.13% 99.73% 1.1 billion Unsecured Notes February 28, 2012 February 25, % 6.75% 98.28% 500 million Unsecured Notes December 4, 2017 January 17, % 0.95% 99.38% 500 million Unsecured Notes 1.0 billion Unsecured Bonds 500 Unsecured Bonds June 1, 2015 June 1, % 6.13% 100% October 8, 2009 October 15, % 7.50% 95.2% August 5, 2010 October 15, % 7.50% % March 7, 2011 March 1, % 7.25% 99.18% 1.0 billion Unsecured Notes 1. Rates applicable at December 31, European Investment Bank ( EIB ) Loan On December 16, 2016, ArcelorMittal signed a 350 million finance contract with the European Investment Bank in order to finance European research, development and innovation projects over the period within the European Union, namely predominantly France, Belgium and Spain, but also in Czech Republic, Poland, Luxembourg and Romania. This operation benefits from a guarantee from the European Union under the European Fund for Strategic Investments. As of December 31, 2016, the facility remains fully available. This operation benefits from a guarantee from the European Union under the European Fund for Strategic Investments. As of December 31, 2017, 350 million (420) was fully drawn. Instituto de Crédito Oficial ( ICO ) Loan The Company entered into an agreement with the ICO on April 9, 2010, for the financing of the Company investment plan in Spain for the period The last installment under this agreement was due on April 7, The outstanding amount at maturity was 7. The facility was repaid at maturity.
230 230 Financial statements Other loans ability to dispose of assets in certain circumstances. Certain of these agreements also require compliance with a financial covenant. Other loans relate to various debt with banks and public institutions. As of December 31, 2017 the scheduled maturities of shortterm debt and long-term debt including its current portion are as follows: On October 9, 2017, ArcelorMittal completed the offering of 300 million (360) variable rate loan in the German Schuldschein market. The proceeds of the issuance were used to repay or prepay existing indebtedness. Other Certain debt agreements of the Company or its subsidiaries contain certain restrictive covenants. Among other things, these covenants limit encumbrances on the assets of ArcelorMittal and its subsidiaries, the ability of ArcelorMittal s subsidiaries to incur debt and ArcelorMittal s , , , , ,621 3,131 Subsequent 11,826 Total The Company monitors its net debt in order to manage its capital. The following table presents the structure of the Company s net debt by original currencies: Presented in USD by original currency as at December 31, 2017 Total USD EUR USD CHF Other Short-term debt including the current portion of long-term debt 2,263 1, Long-term debt 9,563 4,658 4, Cash and cash equivalents Net debt (799) 11,027 (300) 6,182 (490) 4,407 (9) The carrying value of short-term bank loans and commercial paper approximate their fair value. The carrying amount and the estimated fair value of the Company s short and long-term debt is: Instruments payable bearing interest at fixed rates Instruments payable bearing interest at variable rates Total long-term debt, including current portion Short term bank loans and other credit facilities including commercial paper December 31, 2017 Carrying Fair Amount Value 9,363 10,420 December 31, 2016 Carrying Fair Amount Value 11,116 11,966 1,150 1, ,513 11,539 11,794 12,614 1,313 1, The following tables summarize the Company s bases used to measure its debt at fair value. Fair value measurement has been classified into three levels based upon a fair value hierarchy that reflects the significance of the inputs used in making the measurements.
231 Financial statements 231 As of December 31, 2017 Carrying amount Fair Value Level 1 Level 2 Level 3 Total Instruments payable bearing interest at fixed rates 9,363 9, ,420 Instruments payable bearing interest at variable rates 1, ,119 10,513 10,427 1,112 11,539 Total long-term debt, including current portion Short term bank loans and other credit facilities including commercial paper 1,313 1,313 1,313 As of December 31, 2016 Carrying amount Fair Value Level 1 Instruments payable bearing interest at fixed rates Level 3 Total 11,966 11,116 11, ,794 12, ,614 Instruments payable bearing interest at variable rates Total long-term debt, including current portion Level 2 Short term bank loans and other credit facilities including commercial paper Instruments payable classified as Level 1 refer to the Company s listed bonds quoted in active markets. The total fair value is the official closing price as defined by the exchange on which the instrument is most actively traded on the last trading day of the period, multiplied by the number of units held without consideration of transaction costs. Instruments payable classified as Level 2 refer to all debt instruments not classified as Level 1. The fair value of the debt is based on estimated future cash flows converted into U.S. dollar at the forward rate and discounted using current U.S. dollar zero coupon rates and ArcelorMittal s credit spread quotations for the relevant maturities. There were no instruments payable classified as Level 3.
232 232 Financial statements Note 13: Financial instruments The Company enters into derivative financial instruments to manage its exposure to fluctuations in exchange rates and hedge its obligations arising out of the potential conversion of the convertible bonds in connection with financing and investment activities. Fair values versus carrying amounts The estimated fair values of certain financial instruments have been determined using available market information or other valuation methodologies that require judgment in interpreting market data and developing estimates. The following tables summarize assets and liabilities based on their categories at December 31, 2017: Carrying amount in statement of financial position Non-financial assets and liabilities Loan and receivables Liabilities at amortized cost Derivatives ASSETS Current assets: Cash and cash equivalent Current loans to related parties 1,749 1,749 Prepaid expenses and other current assets 1, Assets held for sale Total current assets 3, ,852 3 Non-current assets: ,659 49, ,493 11,493 Deferred tax assets 7,517 7,517 Other assets 1, Total non-current assets 70,152 57,654 11, Total assets 73,812 58,459 14, Short-term debt and current portion of long-term debt 2,263 2,263 Current loans from related parties 6,499 6,499 Tangible and intangible assets Investments in subsidiaries Investments in associates and joint ventures Non-current loans to related parties LIABILITIES AND EQUITY Current liabilities: , ,061 2 Long-term debt, net of current portion 9,563 9,563 Non-current loans from related parties 3,418 3,418 Accrued expenses and other liabilities Total current liabilities Non-current liabilities: Total non-current liabilities 13, , Total equity 51,341 51,341 Total liabilities and equity 73,812 51,611 22, Deferred employee benefits Long-term provisions and other obligations
233 Financial statements 233 The following table summarizes assets and liabilities based on their categories at December 31, 2016: Carrying amount in statement of financial position Non-financial assets and liabilities Loan and receivables Liabilities at amortized cost Derivatives Cash and cash equivalent 1,039 1,039 Current loans to related parties 2,099 2,099 Prepaid expenses and other current assets 1, Total current assets 4, , ,857 44,857 ASSETS Current assets: Non-current assets: Intangibles assets Property, plant and equipment Investments in subsidiaries Non-current loans to related parties 8,754 8,754 Deferred tax 6,110 6,110 Other assets Total non-current assets 60,316 51,357 8, Total assets 64,602 52,230 12, Investments in associates and joint ventures LIABILITIES AND EQUITY Current liabilities: ,866 3, , , Long-term debt, net of current portion 11,197 11,197 Non-current loans from related parties 4,543 4,543 Deferred employee benefits Other long-term obligations Total non-current liabilities 15, , Total equity 43,159 43,159 Total liabilities and equity 64,602 43,604 20, Short-term debt and current portion of long-term debt Current loans from related parties Accrued expenses and other liabilities Total current liabilities Non-current liabilities: The Company classifies the bases used to measure certain assets and liabilities at their fair value. Assets and liabilities carried or measured at fair value have been classified into three levels based upon a fair value hierarchy that reflects the significance of the inputs used in making the measurements. The levels are as follows: Level 1: Quoted prices in active markets for identical assets or liabilities that the entity can access at the measurement date; Level 2: Significant inputs other than within Level 1 that are observable for the asset or liability, either directly (i.e.: as prices) or indirectly (i.e.: derived from prices); Level 3: Inputs for the assets or liabilities that are not based on observable market data and require management assumptions or inputs from unobservable markets.
234 234 Financial statements The following tables summarize the bases used to measure certain assets and liabilities at their fair value. As of December 31, 2017 Level 1 Level 2 Level 3 Total Derivative financial current assets 3 3 Derivative financial non-current assets Total assets at fair value Assets at fair value: Liabilities at fair value: Derivative financial current liabilities (2) (2) Derivative financial non-current liabilities (157) (157) Total liabilities at fair value (159) (159) Level 1 Level 2 Level 3 Total Derivative financial current assets 1 1 Derivative financial non-current assets Total assets at fair value Derivative financial current liabilities (75) (75) Derivative financial non-current liabilities (24) (24) Total liabilities at fair value (99) (99) As of December 31, 2016 Assets at fair value: Liabilities at fair value: Derivative financial assets and liabilities classified as Level 2 refer to instruments to hedge fluctuations in interest rates, foreign exchange rates, raw materials (base metal), freight, energy and emission rights. The total fair value is based on the price a dealer would pay or receive for the security or similar securities, adjusted for any terms specific to that asset or liability. Market inputs are obtained from well-established and recognized vendors of market data and the fair value is calculated using standard industry models based on significant observable market inputs such as foreign exchange rates, commodity prices, swap rates and interest rates. Derivative financial non-current assets classified as Level 3 refer to the call option on the 1,000 mandatory convertible bonds (see below). The fair valuation of Level 3 derivative instruments is established at each reporting date in relation to which an analysis is performed in respect of changes in the fair value measurement since the last period. ArcelorMittal s valuation policies for Level 3 derivatives are an integral part of its internal control procedures and have been reviewed and approved according to the Company s principles for establishing such procedures. In particular, such procedures address the accuracy and reliability of input data, the accuracy of the valuation model and the knowledge of the staff performing the valuations. ArcelorMittal establishes the fair valuation of the call option on the 1,000 mandatory convertible bonds through the use of binomial valuation models based on the estimated values of the underlying equity spot price of $299 and volatility of 12.65%. Binomial valuation models use an iterative procedure to price options, allowing for the specification of nodes, or points in time, during the time span between the valuation date and the option s expiration date. In contrast to the Black-Scholes model, which provides a numerical result based on inputs, the binomial model allows for the calculation of the asset and the option for multiple periods along with the range of possible results for each period. Observable input data used in the valuations include zero coupon yield curves, stock market prices, European Central Bank foreign exchange fixing rates and Libor interest rates. Unobservable inputs are used to measure fair value to the extent that relevant observable inputs are not available. Specifically the Company computes unobservable volatility data based mainly on the movement of stock market prices observable in the active market over 90 working days.
235 Financial statements 235 The following table summarizes the reconciliation of the fair value of the conversion option classified as Level 3 with respect to the call option on the 1,000 mandatory convertible bonds for the year ended December 31, 2017 and 2016, respectively: Call option on 1,000 mandatory convertible bonds 4 Balance as of December 31, 2015 Change in fair value 171 Balance as of December 31, Change in fair value 809 Balance as of December 31, The fair value movement on Level 3 derivative instruments is recorded in the statements of operations. The increase in the fair value of the call option on 1,000 mandatory convertible bonds is due to an increase in the share price of Eregli Demir ve Celik Fab. T.A.S. ("Erdemir") and China Oriental, which impacts the value of the notes in which Hera Ermac, a wholly-owned subsidiary, invested the bonds proceeds. Portfolio of Derivatives Except for the call options on the 1,000 mandatory convertible bond, certain cross currency swaps and some other limited exceptions, the Company s portfolio of derivatives consists of transactions with ArcelorMittal Treasury, which in turn enters into offsetting position with counterparties external to ArcelorMittal. The portfolio associated with derivative financial instruments as of December 31, 2017 is as follows: Notional Amount Assets Fair Value (2) 1,000 (157) Notional Amount Liabilities Fair Value Foreign exchange rate instruments Forward sale of contracts Currency swaps sales Total (159) 3 The portfolio associated with derivative financial instruments as of December 31, 2016 is as follows: Notional Amount Assets Fair Value Notional Amount Liabilities Fair Value (75) (24) Foreign exchange rate instruments Forward sales of contracts Currency swap sales Total 4 (99) Risk management policy The Company's operations expose it to a variety of financial risks including interest rate risk, foreign exchange risk and liquidity risk. The Company actively monitors and seeks to reduce volatility of these exposures through a diversity of financial instruments, where considered appropriate. The Company has formalized how it manages these risks within the Treasury and Financial Risk Management Policy, which has been approved by Management. Capital management The Company's objective when managing capital are to safeguard continuity, maintain a strong credit rating and healthy capital ratios to support its business and provide adequate return to shareholders through continuing growth. The Company sets the amount of capital required on the basis of annual business and long-term operating plans which include capital and other strategic investments. The funding requirement is met through a combination of equity, bonds and other longterm and short-term borrowings.
236 236 Financial statements The Company monitors capital using a gearing ratio, being the ratio of net debt as a percentage of total equity ,341 11, % Total equity Net debt Gearing Interest rate risk The Company is exposed to interest rate risk on short-term and long-term floating rate instruments and on refinancing of fixed rate debt. The Company's policy is to maintain a balance of fixed and floating interest rate borrowings, which is adjusted depending on the prevailing market interest rates and outlook. As at December 31, 2017, the long-term debt was comprised of 89% fixed rate debt and 11% variable rate debt (see note 12). The Company may utilize certain instruments to manage interest rate risks. Interest rate instruments allow the Company to borrow long-term at fixed or variable rates, and to swap the rate of this debt either at inception or during the lifetime of the borrowing. The Company and its counterparties exchange, at predefined intervals, the difference between the agreed fixed rate and the variable rate, calculated on the basis of the notional amount of the swap. Similarly, swaps may be used for the exchange of variable rates against other variable rates. Foreign exchange rate risk The Company is exposed to changes in values arising from foreign exchange rate fluctuations generated by its operating activities. Because of a substantial portion of ArcelorMittal s assets, liabilities, income and expenses are denominated in currencies other than the U.S. dollar (its reporting currency), ArcelorMittal has an exposure to fluctuations in the values of these currencies relative to the U.S. dollar. These currency fluctuations, especially the fluctuation of the value of the U.S. dollar relative to the euro and the Canadian dollar, could have a material impact on its financial position and results of operations. ArcelorMittal faces transaction risk, which arises when ArcelorMittal translates its net debt (see note 12) and other items denominated in currencies other than the U.S. dollars. December 31, ,159 11, % The Company may enter into derivative transactions to hedge the residual exposure, and currently designated an EUR/USD cross currency swaps with a notional of 1,000 to hedge euro denominated net investments in foreign operations (see Net investment hedge ). The Company also uses the derivative instruments, described above to hedge debt recorded in foreign currency other than the functional currency or the balance sheet risk associated with certain monetary assets denominated in a foreign currency other than the functional currency. Liquidity Risk Liquidity risk is the risk that the Company may encounter difficulties in meeting its obligations associated with financial liabilities that are settled by delivering cash. ArcelorMittal Treasury is responsible for the Company's funding and liquidity management. ArcelorMittal s principal sources of liquidity are cash generated from its operations and its credit lines. The Company actively manages its liquidity. Following the Company's Treasury and Financial Risk Management Policy, the levels of cash, credit lines and debt are closely monitored and appropriate actions are taken in order to comply with the covenant ratios, leverage, fixed/floating ratios, maturity profile and currency mix. The contractual maturities of the below financial liabilities include estimated loan repayments, interest payments and settlement of derivatives, excluding any impact of netting agreements. The cash flows are calculated based on market data as of December 31, 2017, and as such are sensitive to movements in mainly forex exchange rates and interest rates. The cash flows are non-discounted, except for derivative financial liabilities where the cash flows equal their fair values.
237 Financial statements 237 Carrying amount Contractual Cash Flow December 31, 2017 from 2020 to After Non-derivative financial liabilities (9,458) (13,514) (1,309) (1,306) (5,658) (5,241) (892) (931) (206) (61) (504) (160) Other non-derivative financial liabilities (1,476) (1,496) (1,200) (163) (50) (83) Loans from related parties (6,067) (6,670) (2,020) (190) (4,460) Cash pooling (3,850) (3,850) (3,850) (21,743) (26,461) (8,585) Foreign exchange contracts (159) (159) (2) Total (159) (159) (2) Bonds Loans over 100 Total (10,672) (5,484) (64) (93) (64) (93) (1,720) Derivative financial liabilities Carrying amount Contractual Cash Flow December 31, 2016 from 2019 to After Non-derivative financial liabilities (11,597) (18,228) (1,261) (2,076) (6,093) (588) (600) (426) (15) (159) Loans from related parties (5,893) (6,456) (1,547) (1,665) (3,244) Cash pooling (2,516) (2,516) (2,516) (20,594) (27,800) (5,750) Foreign exchange contracts (99) (99) (75) (24) Total (99) (99) (75) (24) Bonds Other non-derivative financial liabilities Total (3,756) (9,496) (8,798) (8,798) Derivative financial liabilities Cross currency swaps In December 2014, the Company entered into EUR/USD cross currency swaps ( CCS ) to hedge an euro denominated net investment in foreign operations amounting to 303 million in the Company's consolidated financial statements, and designated them as a net investment hedge. The EUR/USD CCS with a notional of 375 were unwound on January 14, On May 27, 2015, the Company entered into additional EUR/USD CCS with a notional of 1,000 to hedge an euro denominated net investment in foreign operations amounting to 918 million in the Company's consolidated financial statements, and designated them as a net investment hedge. As of December 31, 2017 and 2016, the EUR/USD CCS have a fair value loss of 157 and a fair value loss of 21, respectively. The variation of 136 was recorded in the statements of operations. The fair value of the net investment hedge is included in long-term provisions and other obligations in the statements of financial position. The CCS is categorized as Level 2.
238 238 Financial statements Cross currency swaps are as follows: Derivatives Fair value at December 31, Change in fair value (67) December 31, 2017 Fair value as of December 31, 2017 (64) Notional amount Date traded CCS 5Y 500 May 27, 2015 CCS 10Y 300 May 27, 2015 (14) (42) (56) CCS 10Y 160 May 27, 2015 (8) (22) (30) 40 May 27, 2015 CCS 10Y Total 1,000 (2) (5) (7) (21) (136) (157) Change in fair value (56) December 31, 2016 Fair value as of December 31, 2016 Notional amount Date traded CCS 30Y 250 December 3, 2014 Fair value at December 31, CCS 30Y 125 December 12, (29) CCS 5Y 500 May 28, 2015 (7) 10 3 CCS 10Y 300 May 28, 2015 (10) (4) (14) CCS 10Y 160 May 28, 2015 (6) (2) (8) CCS 10Y 40 May 28, 2015 (1) (1) (2) 61 (82) (21) Derivatives Total 1,375 Sensitivity analysis Foreign currency sensitivity The following tables detail the Company s derivative financial instruments sensitivity as it relates to derivative financial instruments to a 10% strengthening and a 10% weakening in the U.S. dollar against the euro. A positive number indicates an increase in profit or loss and other equity, where a negative number indicates a decrease in profit or loss and other equity. The sensitivity analysis includes the Company s complete portfolio of foreign currency derivatives outstanding. The impact on the non /$ derivatives reflects the estimated move of such currency pairs, when the U.S. dollar appreciates or depreciates 10% against the euro, based on computations of correlations in the foreign exchange markets in December 31, 2017 Income (27) 10% strengthening in U.S. dollar 10% weakening in U.S. dollar 28 Cash flow sensitivity analysis for variable rate instruments The following table details the Company s sensitivity as it relates to variable interest rate instruments. A change of 100 basis points ( bp ) in interest rates during the period would have increased (decreased) profit or loss by the amounts presented below. This analysis assumes that all other variables, in particular foreign currency rates, remain constant. Floating portion of net debt1 100 bp increase (4) 100 bp decrease 4 1. December 31, 2017 Interest Rate Swaps/Forward Rate Agreements Please refer to note 12 for a description of total net debt (including fixed and floating portion) Note 14: Equity On May 22, 2017, ArcelorMittal completed the consolidation of each three existing shares in ArcelorMittal without nominal value into one share without nominal value. As a result of this reverse stock split, the number of issued shares decreased from 3,065,710,869 to 1,021,903,623 and all prior periods have been recast in accordance with IFRS.
239 Financial statements 239 The Company s shares consist of the following: Issued shares Treasury shares 1. December 31, 2015 Movement in year 1 December 31, 2016 Movement in year December 31, ,130, ,772,882 1,021,903,623 1,021,903,623 (519,278) 116,175 (403,103) 120,644 (282,459) Refer to the mandatorily convertible notes described below (137,967,116 or 45,989,039 after reverse stock split). Authorized shares Share capital At the Extraordinary General Meeting held on May 8, 2012, the shareholders approved an increase of the authorized share capital of ArcelorMittal by 643 million represented by 156 million shares (52 after reverse stock split), or approximately 10% of ArcelorMittal s outstanding capital. Following this approval, which is valid for 5 years, the total authorized share capital was 7.7 billion represented by 1,773,091,461 (591,030,487 after reverse stock split) shares without par value. On January 15, 2016, following the maturity of the mandatorily convertible notes (see below), the Company increased share capital by 570 million (622) from 6,883 million (10,011) to 7,453 million (10,633) through the issuance of 137,967,116 (45,989,039 after reverse stock split) new shares fully paid up. The aggregate number of shares issued and fully paid up increased to 1,803,359,338 (601,119,779 after reverse stock split). At the Extraordinary General Meeting held on May 8, 2013, the shareholders approved an increase of the authorized share capital of ArcelorMittal by 524 million represented by 223 million shares (74 after reverse stock split), or approximately 8% of ArcelorMittal s outstanding capital. Following this approval, which is valid for five years, the total authorized share capital was 8.2 billion represented by 1,995,857,213 (665,285,738 after reverse stock split) shares without par value. At the Extraordinary General Meeting held on March 10, 2016, the shareholders approved a decrease of the authorized share capital of the Company by 8,049 million through a reduction of the accounting par value per share to 0.10 and a subsequent increase by 3 billion. Following the completion of the equity offering on April 8, 2016, the Company s authorized share capital was decreased by 2.9 billion. As a result of the approval given by the shareholders on March 10, 2016 and which is valid for five years, the total authorized share capital was 337 million represented by 3,372,281,956 shares (1,124,093,985 after reverse stock split) without par value. At the Extraordinary General Meeting held on May 10, 2017, the shareholders approved a reverse stock split and an increase of the authorized share capital to 345 million. Following this approval, on May 22, 2017 ArcelorMittal completed the consolidation of each three existing shares in ArcelorMittal without nominal value into one share without nominal value. As a result, the authorized share capital increased with a decrease in representative shares from 337 million represented by 3,372,281,956 ordinary shares without nominal value as of December 31, 2016 to 345 million represented by 1,151,576,921 ordinary shares without nominal value. Following the extraordinary general meeting held on March 10, 2016, ArcelorMittal decreased share capital by 7,273 (10,376) from 7,453 (10,633) to 180 (257) through a reduction of the accounting par value per share to 0.10 without any distribution to shareholders, the balance being allocated to additional paid-in capital. On April 8, 2016, ArcelorMittal completed an equity offering with net proceeds of 3,115 (net of transaction costs of 40) by way of the issuance of 1,803,359,338 (601,119,779 after reverse stock split) non-statutory preferential subscription rights with a subscription price of 2.20 per share at a ratio of 7 shares for 10 rights subsequently to the adoption of enabling resolutions by the extraordinary general meeting of shareholders on March 10, The Company increased share capital by 126 (144) from 180 (257) to 306 (401) through the issuance of 1,262,351,531 new shares fully paid up. The aggregate number of shares issued and fully paid up increased to 3,065,710,869 (1,021,903,623 after reverse stock split). Treasury shares As of December 31, 2017 and 2016, the Company held 282,459 and 403,103 (1,209,308 prior to the reverse stock split) treasury shares, respectively. Legal reserve In accordance with Luxembourg Company Law, the Company is required to transfer a minimum of 5% of its net profit for each financial year to a legal reserve. This requirement ceases to be necessary once the balance of the legal reserve reaches 10% of the subscribed capital. Following the annual general meeting held on May 10, 2017, the legal reserve decreased by 961 to 40 corresponding to 10% of the subscribed capital.
240 240 Financial statements Mandatorily convertible notes On January 16, 2013, ArcelorMittal issued mandatorily convertible subordinated notes ( MCNs ) with net proceeds of 2,222. The notes had a maturity of 3 years, were issued at 100% of the principal amount and were mandatorily converted into ordinary shares of ArcelorMittal at maturity unless converted earlier at the option of the holders or ArcelorMittal or upon specified events in accordance with the terms of the MCNs. The MCNs paid a coupon of 6.00% per annum, payable quarterly in arrears. The minimum conversion price of the MCNs was set at $16.75 (prior to reverse stock split), corresponding to the placement price of shares in the concurrent ordinary shares offering as described above, and the maximum conversion price was set at approximately 125% of the minimum conversion price (corresponding to $20.94 prior to reverse stock split). The minimum and maximum conversion prices were subject to adjustment upon the occurrence of certain events, and were, as of December 31, 2015, $15.98 and $19.98, respectively (prior to reverse stock split). The Company determined the notes met the definition of a compound financial instrument and as such determined the fair value of the financial liability component of the bond was 384 on the date of issuance and recognized it as a long-term obligation. The value of the equity component of 1,838 was determined based upon the difference of the cash proceeds received from the issuance of the bond and the fair value of the financial liability component on the date of issuance and was included in equity. During the fourth quarter of 2015, the Company delivered 2,275,026 treasury shares (758,342 after reverse stock split) against 1,817,869 notes converted at the option of their holders. As a result of such voluntary conversions, the carrying amount of MCNs decreased by 38. On January 15, 2016, upon final maturity of the MCNs, the remaining outstanding 88,182,131 notes were converted into 137,967,116 new common shares (45,989,039 after reverse stock split). Accordingly, share capital and additional paid-incapital increased by 622 and 1,178, respectively and the carrying amount of MCNs decreased by 1,800. Earnings per common share On April 8, 2016, the Company issued 1,262,351,531 (420,783,844 after reverse stock split) new shares at a subscription price of 2.20 (prior to reverse stock split) per share representing a 35% discount compared to the theoretical ex-right price ( TERP ) of 3.40 (prior to reverse stock split) based on the closing price of ArcelorMittal s shares on Euronext Amsterdam on March 10, In accordance with IFRS, such a rights issue includes a bonus element increasing the number of ordinary shares outstanding to be used in calculating basic and diluted earnings per share for all periods before the rights issue. Accordingly, the table below presents the numerators, a reconciliation of the weighted average common shares outstanding for the purposes of basic and diluted earnings per share for the year ended December 31, 2017 and as retrospectively adjusted for the above mentioned bonus element for the year ended December 31, On May 22, 2017, ArcelorMittal completed the consolidation of each three existing shares in ArcelorMittal without nominal value into one share without nominal value. As a result of this reverse stock split, the number of outstanding shares for the prior periods have been recast in accordance with IFRS. Year ended December 31, Net income (loss) attributable to equity holders of the parent 4,568 1,779 Weighted average common shares outstanding (in millions) for the purposes of basic earnings per share 1, Incremental shares from assumed conversion of restricted share units and performance share units (in millions) Weighted average common shares outstanding (in millions) for the purposes of diluted earnings per share 4 2 1, Dividends The Company has no significant manufacturing operations of its own. Accordingly, it can only pay dividends or distributions to the extent it is entitled to receive cash dividend distributions from its subsidiaries recognized gains, from the sale of its assets or from the share premium received from the issuance of ordinary shares. Dividends are declared in U.S. dollars and are payable in either U.S. dollars or in euros. There was no dividend paid for the financial year 2015 and The Board has agreed on a new dividend policy which will be proposed to shareholders at the annual general meeting in May 2018, dividends will begin at $0.10/share in 2018 (paid from 2017 results). Stock Option Plans Prior to the May 2011 annual general shareholders meeting adoption of the ArcerlorMittal Equity Incentive Plan described below, ArcelorMittal s equity-based incentive plan took the form of a stock option plan known as the Global Stock Option Plan.
241 Financial statements 241 Under the terms of the ArcelorMittal Global Stock Option Plan (which replaced the ArcelorMittal Shares plan that expired in 2009), ArcelorMittal may grant options to purchase common shares to senior management of ArcelorMittal and its associates for up to 100,000,000 (33,333,333 shares after reverse stock split) shares of common shares. The exercise price of each option equals not less than the fair market value of ArcelorMittal shares on the grant date, with a maximum term of 10 years. Options are granted at the discretion of ArcelorMittal s Appointments, Remuneration and Corporate Governance ("ARCG") Committee, or its delegate. The options vest either ratably upon each of the first three anniversaries of the grant date, or, in total, upon the death, disability or retirement of the participant. Dates of grant and exercise prices are as follows: August 2010 Exercise prices (per option) August Date of grant November August 2008 No options were granted during the years ended December 31, 2017 and The compensation expense recognized for stock option plans was nil for each of the years ended December 31, 2017 and 2016, respectively. Option activity with respect to ArcelorMittal Shares and ArcelorMittal Global Stock Option Plan is summarized below as of and for each of the years ended December 31, 2017 and 2016: Outstanding, December 31, 2015 Expired Number of Options Range of Exercise Prices (per option) Weighted Average Exercise Price (per option) 5,730, (1,048,266) ,682, (1,397,659) Outstanding, December 31, ,284, Exercisable, December 31, ,682, Exercisable, December 31, ,284, Outstanding, December 31, 2016 Expired The following table summarizes information about total stock options of the Company outstanding as of December 31, 2017: Options Outstanding $91.98 Number of options 1,117,757 Weighted average contractual life (in years) 2.59 Options exercisable (number of options) 1,117,757 August 3, ,058, ,058,014 August 4, 2019 Exercise Prices (per option) Maturity November 10, ,108, ,108,242 August 5, 2018 $ $ ,284, ,284,875 Long-Term Incentives: Equity-Based Incentives (Share Unit Plans) On May 10, 2011, the annual general meeting of shareholders approved the ArcelorMittal Equity Incentive Plan, a new equitybased incentive plan that replaced the Global Stock Option Plan. The ArcelorMittal Equity Incentive Plan is intended to align the interests of the Company s shareholders and eligible employees by allowing them to participate in the success of the Company. The ArcelorMittal Equity Incentive Plan provides for the grant of RSUs and PSUs to eligible Company employees (including the Executive Officers) and is designed to incentivize employees, improve the Company s long-term performance and retain key employees. On May 8, 2013, the annual general meeting of shareholders approved the GMB PSU Plan, which provides for the grant of PSUs to GMB members (and is now applicable to the CEO Office). Until the introduction of the GMB PSU Plan in 2013,
242 242 Financial statements GMB members were eligible to receive RSUs and PSUs under the ArcelorMittal Equity Incentive Plan. In 2016, a special grant was approved in order to align the grant with the Action 2020 plan put in place by ArcelorMittal. The maximum number of PSUs (and RSUs previously) available for grant during any given year is subject to the prior approval of the Company s shareholders at the annual general meeting. The annual shareholders meeting on May 4, 2016 approved the maximum to be granted until the next annual shareholders meeting. For the period from the May 2016 annual general shareholders meeting to the May 2017 annual general shareholders meeting, a maximum of 30,000,000 PSUs (10,000,000 PSU's after the reverse stock split) may be allocated to eligible employees under the ArcelorMittal Equity Incentive Plan and the GMB PSU Plan combined. The 2017 Cap for the number of PSUs that may be allocated to the CEO Office and other retention based grants below the CEO Office level was approved at the annual shareholders' meeting on May 10, 2017 at a maximum of 3,000,000 shares. ArcelorMittal Equity Incentive Plan RSUs granted under the ArcelorMittal Equity Incentive Plan are designed to provide a retention incentive to eligible employees. RSUs are subject to cliff vesting after three years, with 100% of the grant vesting on the third anniversary of the grant contingent upon the continued active employment of the eligible employee within the Company. The grant of PSUs under the ArcelorMittal Equity Incentive Plan aims to serve as an effective performance-enhancing scheme based on the employee s contribution to the eligible achievement of the Company s strategy. Awards in connection with PSUs are subject to the fulfillment of cumulative performance criteria (such as return on capital employed ("ROCE"), total shareholders return ("TSR"), earnings per share ("EPS") and gap to competition) over a three year period from the date of the PSU grant. The employees eligible to receive PSUs are a sub-set of the group of employees eligible to receive RSUs. The target group for PSU grants initially included the Chief Executive Officer and the other GMB members. However, from 2013 onwards, the Chief Executive Officer and other GMB members (and in 2016, the CEO Office) received PSU grants only under the GMB PSU Plan instead of the ArcelorMittal Equity Incentive Plan. Conditions of the 2017 grant were as follows: CEO Office Executive Officers and other qualifying employees PSUs with a three-year performance period PSUs with a three-year performance period Performance criteria: 50% TSR (½ vs. S&P 500 and ½ vs. peer group) and 50% EPS vs. peer group Performance criteria: TSR and Gap to competition in some areas Value at grant: 100% of base salary for the CEO and the CFO Vesting conditions: Vesting conditions: 2017 Grant Threshold Target TSR/EPS vs. peer group 100% median 120% median TSR vs. S&P 500 Performance equal to Index Performance equal to Index + 2% outperformance 50% 100% Vesting percentage Threshold Target TSR vs. peer group 100% median 50% vesting 120% median 100% vesting Gap to competition (where applicable) - 100% target 100% vesting Awards made in previous financial years which have not yet reached the end of the vesting period The Company's Long-Term Incentive Plan for senior management including Executive Officers follows the Company's strategy. In 2014 and 2015, the Company's goal was to achieve ROCE and Mining volume for the Mining segment and therefore the target was based on these performance measures. In 2016, in order to ensure achievement of the Action 2020 plan, ArcelorMittal made a special grant ( Special Grant ) to qualifying employees (including the Executive Officers), instead of the standard grant. The value of the Special Grant at grant date is based generally on a specified percentage of the base salary depending on the position of the employee at grant date. The vesting is subject to continued active employment within the ArcelorMittal group and to yearly performance of ROCE targets and other strategic objectives within the business units.
243 Financial statements 243 The plans in 2016, 2015 and 2014 are summarized below: CEO Office Executive Officers and other qualifying employees PSUs with a three-year performance period RSUs with a three-year vesting period (2014 grant vested in December 2017) Performance criteria: 50% TSR (½ vs. S&P 500 and ½ vs. peer group) and 50% EPS vs. peer group PSUs with a three-year performance period Value at grant: 100% of base salary for the CEO and 80% for the CFO Performance target: mainly ROCE and mining volume plan for the Mining segment Vesting conditions: One PSU can give right to 0 shares up to 1.5 shares Vesting conditions: 2014 Grant TSR/EPS vs. peer group TSR vs. S&P 500 Threshold Target 80% median 100% median Performance equal to 80% of Index Performance equal to Index equal to Index + 2% outperformance 50% 100% 150% Vesting percentage 2015 Grant 2016 Special Grant Stretch Threshold Target Performance 80% 100% Vesting 50% 100% Stretch 150% Same as in 2014 Same as in 2014 PSUs with a five-year performance period, 50% vesting after three-year performance period and 50% after additional two-year performance period PSUs with a five-year performance period, 50% vesting after threeyear performance period and 50% after additional two-year performance period Performance criteria: 50% TSR (½ vs. S&P 500 and ½ vs. peer group) and 50% EPS vs. peer group Performance criteria: ROCE and Gap to competition in some areas one target grant: a share will vest if performance is met at target one overperformance grant: a share will vest if performance exceeds 120% Value at grant: 150% of base salary for the CEO and the CFO Vesting conditions: Vesting conditions: Threshold Target TSR/EPS vs. peer group 100% median TSR vs. S&P 500 Performance equal to Index equal to Index + 2% outperformance 50% 100% Vesting percentage Performance 100% Target award vesting 100% 100% 100% Overperformance award (=20% of target award) The following table summarizes the Company s share unit plans outstanding December 31, 2017: Number of shares as of December 31, 2017 At Grant date Type of plan Number of shares Number of beneficiaries Maturity Fair value per share Shares outstanding Shares exited Shares forfeited December 20, 2017 PSU 1,081, January 1, ,081,447 December 20, 2017 CEO Office 90,084 2 January 1, ,084 June 30, 2016 PSU II 3,472, January 1, ,238, ,425 June 30, 2016 CEO PSU II 153,268 2 January 1, ,268 June 30, 2016 PSU I 3,472, January 1, ,238, ,425 June 30, 2016 CEO PSU I 153,268 2 January 1, ,268 December 18, 2015 PSU 295, January 1, ,661 49,274 December 18, 2015 RSU 368, December 18, ,005 3,138 59,391 GMB PSU 154,767 4 June 30, ,767 PSU 326, January 1, ,481 87,197 $10.68 $ ,902,841 3, ,712 Grant date June 30, 2015 December 17, 2014 Total 9,568,691 The compensation expense recognized for RSUs and PSUs was immaterial for the years ended December 31, 2017 and 2016.
244 244 Financial statements Share unit plan activity is summarized below as of and for each year ended December 31, 2017 and 2016: Outstanding, December 31, 2015 Granted 1 Restricted share unit (RSU) Number of Fair value per shares share 1,320, Performance share unit (PSU) Number of Fair value per shares share 1,370, ,252, Exited (564,679) Forfeited (105,721) , ,039, ,199, Outstanding, December 31, 2016 Granted 1 (303,550) Forfeited (40,699) Outstanding, December 31, , Exited 1. (19,816) (564,179) 37.8 (204,855) (437,141) ,596, Including 27,807 over-performance shares granted for the targets achievement of the PSU grant September 27, 2013 (1,567 over-performance shares for the PSU grant March 29, 2013 in 2016). Note15: Financing costs-net Financing costs-net were as follows: Interest expense Interest income Gain on disposal of investments 1 Change in fair value adjustment on call option on mandatory convertible bonds (note 13) Net gain (loss) on other derivative instruments Net foreign exchange result Premiums and fees 2 Provision for financial guarantee 3 Other Total (998) (132) 755 (389) 25 1,101 (1,337) (399) (88) 35 (338) Includes mainly a 52 gain related to the disposal of a 2.8% interest in Arcelor Investment S.A. (see note 7) and a 74 gain related to the disposal of the Company's interest in Hunan Valin for the year ended December 31, 2017 and 2016, respectively (see note 8). Premiums and fees are mainly related to early redemption of bonds. See note 19. Transactions with related parties are detailed in note 11. Note 16: Income from subsidiaries and associates Income from subsidiaries and associates of 836 in 2017 are dividends received in cash mainly from ArcelorMittal Canada Holdings Inc. for CAD 559 million (436), ArcelorMittal Ostrava a.s. for CZK 6,760 million (308), ArcelorMittal Poland S.A. for PLN 250 million (69) and from China Oriental Group Company Limited for HKD 143 million (18). Income from subsidiaries and associates of 14,108 in 2016 included dividends in kind of 11,369 and cash dividends of 2,739. Dividends in kind of 10,208 (11,369) were received from AM Global Holding S.à.r.l. by means of a 100% interest in ArcelorMittal Poland for 3,113 (3,473), 100% interest in ArcelorMittal Spain Holding for 6,142 (6,839) and 100% interest in ArcelorMittal Ostrava for 953 (1,057). The cash dividends received were mainly paid by ArcelorMittal Global Holding S.à.r.l. and by ArcelorMittal Poland S.A for 2,150 (2,288) and PLN 1,714 (429), respectively.
245 Financial statements 245 Note 17: Income tax Income tax expense (benefit) The components of the income tax expense (benefit) for each of the years ended December 31, 2017 and 2016 are summarized below: Total current tax expense (benefit) (381) (203) Total deferred tax expense (benefit) (561) 533 Total income tax expense (benefit) (942) 330 The following table reconciles the income tax expense (benefit) to the statutory tax expense (benefit) as calculated: Year ended December 31, Net income (loss) Income tax expense (benefit) 8,162 4,723 (942) 330 Income (loss) before tax : 7,220 Tax expense (benefit) at the statutory rate* 1,878 1,315 (1,651) (1,802) Permanent items Taxable results transferred from subsidiaries included in the tax integration Rate changes 5,053 (81) Net change in measurement of deferred tax assets (916) (27) Effects of foreign currency translation (220) (942) 330 Other taxes Income tax expense (benefit) * Tax expense (benefit) at the statutory rates is based on income (loss) before tax. The future statutory tax rate of 26,01%, as enacted in 2016, has been used. Permanent items The permanent items consist of: Non-tax deductible impairment charges (reversals) Exempted dividend income Other permanent items Total permanent items (1,425) 1,894 (213) (3,670) (13) (26) (1,651) (1,802) Non tax-deductible impairment charges (reversals): Write-down charges taken on investments in shares of subsidiaries are generally tax deductible under the Luxembourg tax legislation. However the write-down charges are not tax-deductible if they (i) are neutralized with exempt dividend income, exempt capital gains and mark to market valuation, or (ii) arise within the tax consolidation. Similarly, write-backs of previously recorded charges are generally taxable, unless they relate to impairments that arose within the tax consolidation. These non tax-deductible charges (reversals) for 2017 and 2016 amount to (5,480) and 7,283, respectively. Exempted dividend income: Under Article 166 of the Luxembourg tax law, dividend income, liquidation proceeds, and capital gains may be treated as tax-exempt so long as certain requirements are met relating to the parent s participation in the subsidiary. The participation exemption applies if the Luxembourg parent maintains (or commits to hold) a minimum holding in a qualified subsidiary company (generally a shareholding of at least 10% or having an acquisition cost of at least EUR 1.2m) for an uninterrupted period of at least 12 months.
246 246 Financial statements Net change in measurement of deferred tax assets The 2017 net change in measurement of deferred tax assets of (916) consists of (i) tax benefit of (641) related to the recognition of additional deferred tax assets up to the amount utilized during the year and (ii) recognition of deferred tax assets for (275) resulting from the increase in projections of future taxable income driven primarily by improved market conditions in the steel industry and higher financial income mainly from further reduction in the forecasted interest expense following improved credit rating. The 2016 net change in measurement of deferred tax assets of (27) consists of tax expense of 131 due to the unrecognized tax loss for the period and de-recognition of DTA for (158). The recognition in Luxembourg includes a $0.8 billion increase in projections of future taxable income in Luxembourg driven primarily by the improved market conditions of the steel industry and higher interest income from favorable foreign exchange rate relating to the funding of Group subsidiaries as well as further reduction in the forecasted interest expense following debt repayments. This recognition is partially offset by a derecognition of $0.7 billion related to revised expectations of euro denominated deferred tax assets recoverability in U.S. dollars terms. Rates changes The 2016 tax expense from rate changes of 690 is the result of the decrease in the future income tax rate from 29.22% to 26.01% as enacted in law end of Effects of foreign currency translation The effects of foreign currency translation of (220) and 42 for 2017 and 2016, respectively, are related to the different functional currency of the Company than the currency applied for tax filing purposes. Uncertain tax positions ArcelorMittal takes income tax positions that management believes are supportable and are intended to withstand challenge by tax authorities. Some of these positions are inherently uncertain and include those relating to transfer pricing matters and the interpretation of income tax laws applied to complex transactions. The Company periodically reassesses its tax positions. Changes to the financial statement recognition, measurement, and disclosure of tax positions is based on management s best judgment given any changes in the facts, circumstances, information available and applicable tax laws. Considering all available information and the history of resolving income tax uncertainties, the Company believes that the ultimate resolution of such matters will not have a material effect on the Company s financial position, statements of operations or cash flows. Deferred tax assets and liabilities The origin of deferred tax assets and liabilities is as follows: 2017 Assets December 31, Liabilities December 31, Net December 31, 2016 Concession, patents, licenses 5 5 Provisions (1) (1) Tax losses carried forward 7,517 6,106 7,517 6,106 Deferred tax assets / (liabilities) 7,517 6,111 (1) 7,517 6,110 Deferred tax assets not recognized by the Company as of December 31, 2017 were as follows: Tax losses carried forward Other temporary differences Total Gross amount Total deferred tax assets Recognized deferred tax assets Unrecognized deferred tax assets 80,454 20,481 7,517 12,964 20,481 7,517 12,964 Deferred tax assets not recognized by the Company as of December 31, 2016 were as follows:
247 Financial statements 247 Gross amount Total deferred tax assets Recognized deferred tax assets Unrecognized deferred tax assets 72,047 18,746 6,106 12, ,751 6,111 12,640 Tax losses carried forward Other temporary differences Total As of December 31, 2017, deferred tax assets not recognized relate only to tax losses carried forward. The utilization of tax losses carried forward is restricted to the taxable income of the Luxembourg tax consolidated group. The utilization of tax losses carried forward also may be restricted by the character of the income. The total amount of accumulated tax losses in Luxembourg with respect to the main tax consolidation amounts to 80,454 as of December 31, Of this amount 30,613 is considered realizable, resulting in the recognition of 7,517 of deferred tax assets at the applicable income tax rate in Luxembourg. As at December 31, 2016 the total amount of accumulated tax losses in Luxembourg with respect to the main tax consolidation amounted to 72,047, of this amount 23,449 is considered realizable, resulting in the recognition of 6,106 of deferred tax assets at the applicable income tax rate in Luxembourg. Under the Luxembourg tax legislation the tax losses generated until the end of 2016 and before can be carried forward indefinitely and are not subject to any specific yearly loss utilization limitations. The tax losses carried forward relate primarily to tax deductible write-down charges taken on investments in shares of consolidated subsidiaries recorded by certain of the ArcelorMittal group s holding companies in Luxembourg. Of the total tax losses carried forward, 24,777 may be subject to recapture in the future if the write-downs that caused them are reversed creating taxable income unless the Company converts them to permanent through sales or other organizational restructuring activities. The Company believes that it is probable that sufficient future taxable profits will be generated to support the recognized deferred tax asset for tax losses carried forward in Luxembourg. As part of its recoverability assessment the Company has taken into account (i) its most recent forecast approved by management and the Board of Directors, (ii) the likelihood that the factors that have contributed to past losses in Luxembourg will not recur, (iii) the fact that ArcelorMittal in Luxembourg is the main provider of funding to the Group s consolidated subsidiaries, leading to significant amounts of taxable interest income, (iv) the implementation in 2015 of an Industrial Franchising Arrangement between ArcelorMittal and numerous worldwide operating subsidiaries, and (v) other significant and reliable sources of operational income earned from ArcelorMittal s European and worldwide operating subsidiaries for centralized distribution and procurement activities performed in Luxembourg. In performing the assessment, the Company estimates at which point in time its earnings projections are no longer reliable, and thus taxable profits are no longer probable. Accordingly, the Company has established consistent forecast periods for its different income streams for estimating probable future taxable profits, against which the unused tax losses can be utilized in Luxembourg. At December 31, 2017, based upon the level of historical taxable income and projections for future taxable income over the periods in which the deductible temporary differences are anticipated to reverse, management believes it is probable that ArcelorMittal will realize the benefits of the deferred tax assets of 7,517 recognized. The amount of future taxable income required to be generated by ArcelorMittal s subsidiaries to utilize the deferred tax assets of 7,517 is at least 30,075. Historically, the Company has been able to generate taxable income in sufficient amounts and believes that it will generate sufficient levels of taxable income in upcoming years to permit the Company to utilize tax benefits associated with tax losses carried forward and other deferred tax assets that have been recognized in its financial statements. In the event that a history of recent losses is present, the Company relied on convincing other positive evidence such as the character of (historical) losses and tax planning to support the deferred tax assets recognized.
248 248 Financial statements Note 18: Accrued expenses and other liabilities Accrued expenses and other liabilities are summarized as follows: Accrued interest Accrued payroll and employee related expenses 2017 December 31, Derivative instruments (note 13) Payable on R&D and other IFA expenses Suppliers and other December 31, 2016 Derivative instruments (note 13) Provision for financial guarantee Total Amounts with related parties are detailed in note 11. Note 19: Long-term provisions and other obligations Other long-term provisions and other obligations are summarized as follows: Other Total 1. The provision for financial guarantee is related to the unrecoverable overdraft of a subsidiary of ArcelorMittal group in the framework of the guarantee issued by the Company in favor of ArcelorMittal Treasury in relation with bilateral cash management and financial transactions (see note 20). Note 20: Commitments Commitments given are summarized as follows: December 31, Credit lines granted to subsidiaries and associates 1, Guarantees given to third parties on behalf of subsidiaries, associates and joint ventures 3,386 3,194 Guarantees given to third parties Letter of credit facilities1 Total ,883 4,575 The notional amount of the letter of credit facilities amounted to 475 and 475 as of December 31, 2017 and 2016, respectively. The Company is jointly and severally liable for the following entities: ArcelorMittal Finance, ArcelorMittal Treasury, ArcelorMittal Sourcing and ArcelorMittal Energy S.C.A. Guarantees given Guarantees given on the behalf of joint ventures include 406 and 463 for the guarantees issued on behalf of Calvert and 306 and 323 for the guarantees issued on behalf of ArcelorMittal Tubular Products Jubail s as of December 31, 2017 and 2016, respectively. On October 30, 2017, the Company issued a 281 guarantee covering various capital expenditure obligations of ArcelorMittal Mexico SA de C.V. regarding the construction of a new Hot Strip Mill at Lazaro Cardenas, Michoacán, Mexico. Corporate guarantee letter On May 28, 2009, in the framework of a legal reorganization in Canada, the Company entered into a support agreement with ArcelorMittal Canada Holdings Inc. whereby it undertakes to take all such actions as necessary to enable ArcelorMittal Canada Holdings Inc. to reacquire the preferred shares held by its shareholder Mittal Steel International Holdings B.V. upon exercise of such right by the latter.
249 Financial statements 249 Others On April 3, 2014, the Company issued a guarantee in relation with bilateral cash management and financial transaction in favor of ArcelorMittal Treasury for a maximum amount of 20 billion, covering overdraft granted by ArcelorMittal Treasury to ArcelorMittal group subsidiaries for 8,768 and 7,142 as of December 31, 2017 and 2016, respectively. On December 28, 2009 and January 17, 2012, a whollyowned subsidiary of the Company used the proceeds from the issuance of an unsecured and unsubordinated bonds mandatorily convertible into preferred shares of such subsidiary to acquire notes linked to shares of the listed related parties Erdemir and China Oriental. The notes were issued by the Company s affiliates Arcelor Investment Services S.A., Expert Placement Services Ltd and ArcelorMittal Holdings AG. The Company warrants to own directly or indirectly the entire legal and beneficial interest in the share capital of such companies for so long as any notes remain outstanding. ArcelorMittal also undertakes to provide any funding which would be necessary to these affiliates to meet their obligations with respect to the notes. Note 21: Deferred employee benefits Certain employees of ArcelorMittal are included in the unfunded defined benefit pension plan managed by the Company s affiliate ArcelorMittal Luxembourg. The Company has a defined benefit obligation with respect to this plan by virtue of a contractual arrangement with ArcelorMittal Luxembourg. Benefits are based on such employees length of service and applicable pension table under the terms of the agreement. This defined benefit pension plan was closed to new entrants on December 31, 2007 and replaced by a defined contribution pension plan for active members financed by employer and employee contributions. As of December 31, 2017 and 2016, the pension plan benefits were 20 and 17 respectively. The following table details the reconciliation of the defined benefit pension obligation: Year ended December 31, Change in benefit obligation Benefit obligation at beginning of period Service cost 1 1 Interest cost Actuarial (gain) loss Experience adjustment Financial assumptions 3 Benefits paid (1) (1) Benefit obligation at end of period Foreign currency exchange rate differences and other movements The following table details the components of the pension cost recognized in the statements of operations: Year ended December 31, Net periodic pension cost Service cost 1 1 Interest cost 1 1 Total Service cost is included in general administrative expense. Interest cost is included in financing costs net.
250 250 Financial statements Assumptions used to determine benefit obligations December 31, Discount rate 1.50% 1.60% Rate of compensation increase 2.71% 2.71% Cash contributions and maturity profile of the plans In 2018, the Company expects its cash contributions to amount to 2 for pension plans. At December 31, 2017, the duration of the liabilities related to the pension plan was 9 years (2016: 8 years). Risks associated with defined benefit plans Through its defined benefit pension plans, ArcelorMittal is exposed to a number of risks, the most significant of which is the change in bond yields. A decrease in corporate bond yields will increase plan liabilities. Sensitivity analysis The following information illustrates the sensitivity to a change in certain assumptions related to ArcelorMittal s pension plan (as of December 31, 2017, the defined benefit obligation ( DBO ) for pension was 20): Effect on 2018 Pre-Tax Pension Expense (sum of service cost and interest cost)1 Effect on December 31, 2017 DBO Change in assumption 100 basis point decrease in discount rate basis point increase in discount rate (2) 100 basis point decrease in rate of compensation (2) 100 basis point increase in rate of compensation 2 1. Amounts are not disclosed as they are below 1 and rounded to nearest million. The above sensitivities reflect the effect of changing one assumption at a time. Actual economic factors and conditions often affect multiple assumptions simultaneously, and the effects of changes in key assumptions are not necessarily linear. Note 22: Contingencies The Company is currently and may in the future be involved in litigation, arbitration or other legal proceedings. Provisions related to legal and arbitration proceedings are recorded in accordance with the principles described in note 3. On January 8, 2008, ArcelorMittal received a writ of summons on behalf of four hedge fund shareholders of Arcelor to appear before the civil court of Luxembourg. The summons was also served on all natural persons sitting on the Board of Directors of ArcelorMittal at the time of the merger and on the Significant Shareholder. The plaintiffs alleged in particular that, based on Mittal Steel s and Arcelor s disclosure and public statements, investors had a legitimate expectation that the exchange ratio in the secondstep merger would be the same as that of the secondary exchange offer component of Mittal Steel s June 2006 tender offer for Arcelor (i.e., 11 Mittal Steel shares for 7 Arcelor shares), and that the second-step merger did not comply with certain provisions of Luxembourg company law. They claimed, inter alia, the cancellation of certain resolutions (of the Board of Directors and of the Shareholders meeting) in connection with the merger, the grant of additional shares, or damages in an amount of 216. By judgment dated November 30, 2011, the Luxembourg civil court declared all of the plaintiffs claims inadmissible and dismissed them. The judgment was appealed in May By judgment dated February 15, 2017, the Luxembourg Court of Appeal declared all but one of the plaintiffs claims inadmissible, remanded the proceedings on the merits to the lower court with respect to the admissible claimant and dismissed all other claims. In June 2017, the plaintiffs filed an appeal of this decision to the Court of Cassation. On May 15, 2012, ArcelorMittal received a writ of summons on behalf of Association Actionnaires d'arcelor ( AAA ), a French association of former minority shareholders of Arcelor, to appear before the civil court of Paris. In such writ of summons, AAA claimed (on grounds similar to those in the Luxembourg proceedings summarized above) inter alia damages in a nominal amount and reserved the right to
251 Financial statements 251 seek additional remedies including the cancellation of the merger. The proceedings before the civil court of Paris have been stayed, pursuant to a ruling of such court on July 4, 2013, pending a preparatory investigation (instruction préparatoire) by a criminal judge magistrate (juge d instruction). The dismissal of charges (non-lieu) ending the preparatory investigation became final in March In April 2011, a proceeding was commenced before the Ontario (Canada) Superior Court of Justice under the Ontario Class Proceedings Act, 1992, against ArcelorMittal, Baffinland, and certain other parties relating to the January 2011 take-over of Baffinland by ArcelorMittal, Nunavut Iron Ore Holdings and Ontario Inc. The action seeks the certification of a class comprised of all Baffinland securities holders who tendered their Baffinland securities, and whose securities were taken up, in connection with the take-over between September 22, 2010 and February 17, 2011, or otherwise disposed of their Baffinland securities on or after January 14, The action alleges that the tender offer documentation contained certain misrepresentations and seeks damages in an aggregate amount of 797 (CAD$1 billion) or rescission of the transfer of the Baffinland securities by members of the class. The class certification hearings were held in January 2018, a decision is pending. In the first half of 2016, the German Federal Cartel Office carried out unannounced investigations of ArcelorMittal Ruhrort GmbH and ArcelorMittal Commercial Long Deutschland GmbH following alleged breaches of antitrust rules concerning (i) collusion regarding scrap and alloy surcharges from the 1990s through November 2015 and (ii) impermissible exchanges of sensitive information between competitors since early ArcelorMittal Ruhrort GmbH and ArcelorMittal Commercial Long Deutschland GmbH are cooperating with the German Federal Cartel Office. In March 2017, the Federal Cartel Office formally notified ArcelorMittal, ArcelorMittal Commercial Sections S.A. and certain other parties that they were also being included in the investigation. The Company received the Federal Cartel Office's Preliminary Statement, setting out its then-current view of the facts, in August Since December 2017, ArcelorMittal and the Federal Cartel Office have been engaged in discussions in relation to the Preliminary Statement of Facts and the future course of the investigation including avenues for resolution of the matter. Note 23: Employee and key management personnel As of December 31, 2017, the Company employed 203 people and the total annual compensation of the Company s employees paid in 2017 and 2016 was as follows: Year ended December 31, Wages and salaries Social security costs 3 3 Other staff expenses 14 7 Total Employee Information The total annual compensation of ArcelorMittal s key management personnel, including its Board of Directors, paid in 2017 and 2016 was as follows: Year ended December 31, Short-term performance-related bonus Post-employment benefits Share based compensation Base salary and/or directors fees The fair value of the stock options granted and shares allocated based on RSU and PSU plans to the ArcelorMittal s key management personnel is recorded as an expense in the statements of operations over the relevant vesting periods (see note 14). As of December 31, 2017 and 2016, ArcelorMittal did not have outstanding any loans or advances to members of its Board of Directors or key management personnel, and had not given any guarantees for the benefit of any member of its Board of Directors or key management personnel.
252 252 Financial statements Note 24: Expenses related to the réviseur d entreprises agréé In 2017 and 2016, expenses related to the réviseur d entreprises agréé amounted to 8 and 8, respectively. Note 25: Subsequent event On March 2, 2018, ArcelorMittal signed a joint venture formation agreement with Nippon Steel & Sumitomo Metal Corporation ("NSSMC") in relation to its offer to acquire Essar Steel India Limited ("Essar Steel"). The Company s subsidiary ArcelorMittal India Private Limited ("AMIPL") submitted a resolution plan for Essar on February 12, 2018, which outlined the intention to have NSSMC formally join its bid for Essar Steel. ArcelorMittal will guarantee the performance obligations of the ArcelorMittal shareholder under the joint venture agreement.
253 Report of the réviseur d entreprises agréé 253 To the Shareholders of ArcelorMittal Société Anonyme 24-26, Boulevard d Avranches L-1160 Luxembourg Grand Duchy of Luxembourg REPORT OF THE REVISEUR D ENTREPRISES AGREE Report on the Audit of the Financial Statements of ArcelorMittal Société Anonyme Opinion We have audited the financial statements of ArcelorMittal SA (the Company ), which comprise the statement of financial position as at December 31, 2017, and the statement of operations, other comprehensive income, statement of changes in equity and statement of cash flows for the year then ended, and notes to the financial statements, including a summary of significant accounting policies. In our opinion, the accompanying financial statements give a true and fair view of the financial position of the Company as at December 31, 2017, and of its financial performance and its cash flows for the year then ended in accordance with International Financial Reporting Standards (IFRSs) as adopted by the European Union. Basis for Opinion We conducted our audit in accordance with the EU Regulation N 537/2014, the Law of 23 July 2016 on the audit profession (Law of 23 July 2016) and with International Standards on Auditing (ISAs) as adopted for Luxembourg by the Commission de Surveillance du Secteur Financier (CSSF). Our responsibilities under those Regulation, Law and standards are further described in the Responsibilities of Réviseur d Entreprises Agréé for the Audit of the Financial Statements section of our report. We are also independent of the Company in accordance with International Ethics Standards Board for Accountants Code of Ethics for Professional Accountants (IESBA Code) as adopted for Luxembourg by the CSSF together with the ethical requirements that are relevant to our audit of the financial statements, and have fulfilled our other ethical responsibilities under those ethical requirements. We believe that the audit evidence we have obtained is sufficient and appropriate to provide a basis for our opinion. Key Audit Matters Key audit matters are those matters that, in our professional judgment, were of most significance in our audit of the financial statements of the current period. These matters were addressed in the context of the audit of the financial statements as whole, and in forming our opinion thereon, and we do not provide a separate opinion on these matters. Valuation of investments in subsidiaries Refer to Note 7 Investments in subsidiaries. Management s assessment of the recoverable amount of investments in subsidiaries requires estimation and judgment around the assumptions used in the valuation. The determination of the recoverable amount of investments mainly depends on the estimation of the values of the underlying steel and mining operations which are directly and indirectly held by the Company and its subsidiaries. Recoverable amounts of steel and mining operations are based on assumptions related to future cash flow forecasts, which are affected by, amongst others, expected future market and economic conditions. The key assumptions with the most significant impact were: Recoverable amounts of steel and mining operations are based on assumptions related to future cash flow forecasts, which are affected by, amongst others, expected future market and economic conditions. The key assumptions with the most significant impact were: The discount rate, which is based on the weighted average cost of capital ( WACC ); Business assumptions, including but not limited to projected shipments and selling prices.
254 254 Report of the réviseur d entreprises agréé Changes to the assumptions could lead to material changes in estimated recoverable amounts, and could result in either impairment or reversal of impairment taken in prior years. The valuation of investments in subsidiaries was significant to our audit because of the amounts of investments in subsidiaries of $49.7 billion as of December 31, 2017, which are material to the financial statements. How the Matter Was Addressed in the Audit Our procedures included the assessment of the methodology used by management to estimate the recoverable value of each investment in subsidiaries for which an impairment test was performed. This included the testing of the valuation of the underlying steel and mining assets. We used internal valuation specialists to assist us in the evaluation of the assumptions and valuation methodologies, in particular those relating to the methodology and data used to estimate the WACC used in the determination of the recoverable amounts. We audited the future projected cash flows forecasts to determine whether they are reasonable and supportable given the current macroeconomic climate and expected future performance of the operations, against external data, historical performance and forecasts. We also tested internal controls over these assumptions and valuation methodologies. We also audited the appropriateness of the related disclosures. Valuation of Deferred Tax Assets Refer to Note 17 Income Tax. The main Luxembourg tax integration, headed by the Company, has material deferred tax assets primarily relating to tax losses carried forward. Under current tax law in Luxembourg, tax losses accumulated before January 1, 2017 never expire. These tax losses are recoverable against future taxable income, and the amount of the deferred tax asset recognized in the Company s financial statements is based on management s estimates of future taxable income of the tax integration The Company tax integration s future forecasted taxable income in Luxembourg consists mainly of operational and financial income. Financial income is mainly derived from interest earned on financial assets relating to loans from Luxembourg entities to other subsidiaries of related parties. Operational forecasted taxable income is derived from contractual income expected to be generated under an industrial franchising arrangement and from centralized sourcing activities. Future income is considered only to the extent future income forecasts are considered reliable. In performing the assessment, management estimates at which point in time its future income forecasts are no longer reliable, and thus taxable income is no longer probable. Accordingly, management has established consistent forecast periods for its different income streams for estimating probable future taxable income, against which the unused tax losses can be utilized in Luxembourg. Deferred tax asset valuation is considered a key audit matter due to the complexities of the calculation of future taxable profits, the evaluation of the impact of tax planning opportunities, and the inherent uncertainty involved in forecasting taxable profits available in future periods. Further, deferred tax asset balances of $7,517 million as of December 31, 2017, are material to the financial statements. How the Matter Was Addressed in the Audit Our procedures included involvement of tax specialists knowledgeable in international tax planning as well as Luxembourgspecific tax legislation and regulatory matters. Tax specialists supported the audit team in testing management s forecasted taxable income projections, including evaluation of available evidence related to management s judgments for the amounts of deferred tax assets recognized. Further, we audited management s estimates of projected taxable income by performing a retrospective review of the projections used in the prior year assessment, and considered the results of this retrospective review in evaluating the current-year taxable income projections. We tested internal controls over management s valuation of deferred tax assets. We also audited the appropriateness of the related disclosures. Level 3 Financial Instruments - Call option on the Mandatory Convertible Bonds Refer to Note 13 Financial instruments. The Company has a call option, a Level 3 financial instrument, on the Mandatory Convertible Bonds ( MCB ). MCB were issued in 2009 through Hera Ermac (a fully-owned subsidiary).
255 Report of the réviseur d entreprises agréé 255 The financial instrument is measured at fair value using binomial fair valuation models, which estimate the value of the underlying equity spot price and volatility of Hera Ermac. The call option on the MCB valuation is considered a key audit matter due to the significant increase in the balance of the call option on MCB from $175 million as of December 31, 2016 to $984 million as of December 31, 2017, as a result of the significant increase in the underlying equity spot price of Hera Ermac. How the Matter Was Addressed in the Audit Our procedures included the involvement of an internal valuation specialist with expertise in derivative instruments and valuation models. The valuation team supported the audit team in testing the valuation methodology and the assumptions used by management, including those used as inputs to models, by independently developing estimates of the fair value of the call option. We tested internal controls over the valuation. We also evaluated the accounting policy and audited the appropriateness of the related disclosures. Other information The Board of Directors is responsible for the other information. The other information comprises the information included in the management report and the Corporate Governance Statement but does not include the financial statements and our report of "Réviseur d'entreprises Agréé" thereon. Our opinion on the financial statements does not cover the other information and we do not express any form of assurance conclusion thereon. In connection with our audit of the financial statements, our responsibility is to read the other information and, in doing so, consider whether the other information is materially inconsistent with the financial statements or our knowledge obtained in the audit or otherwise appears to be materially misstated. If, based on the work we have performed, we conclude that there is a material misstatement of this other information, we are required to report this fact. We have nothing to report in this regard. Responsibilities of the Board of Directors and Those Charged with Governance for the Financial Statements The Board of Directors is responsible for the preparation and fair presentation of the financial statements in accordance with IFRSs as adopted by the European Union, and for such internal control as the Board of Directors determines is necessary to enable the preparation of financial statements that are free from material misstatement, whether due to fraud or error. In preparing the financial statements, the Board of Directors is responsible for assessing the Company s ability to continue as a going concern, disclosing, as applicable, matters related to going concern and using the going concern basis of accounting unless the Board of Directors either intends to liquidate the Company or to cease operations, or has no realistic alternative but to do so. Responsibilities of the «Réviseur d Entreprises Agréé» for the Audit of the Financial Statements The objectives of our audit are to obtain a reasonable assurance about whether the financial statements as a whole are free from material misstatement, whether due to fraud or error, and to issue a report of Réviseur d Entreprises Agréé that includes our opinion. Reasonable assurance is a high level of assurance, but is not a guarantee that an audit conducted in accordance with the EU Regulation N 537/2014, the Law of 23 July 2016 and with ISAs as adopted for Luxembourg by the CSSF will always detect a material misstatement when it exists. Misstatements can arise from fraud or error and are considered material if, individually or in the aggregate, they could reasonably be expected to influence the economic decisions of users taken on the basis of these financial statements. As part of an audit in accordance with the EU Regulation N 537/2014, the Law of 23 July 2016 and with ISAs as adopted for Luxembourg by the CSSF, we exercise professional judgment and maintain professional scepticism throughout the audit. We also: Identify and assess the risks of material misstatement of the financial statements, whether due to fraud or error, design and perform audit procedures responsive to those risks, and obtain audit evidence that is sufficient and appropriate to provide a basis for our opinion. The risk of not detecting a material misstatement resulting from fraud is higher than for one resulting from error, as fraud may involve collusion, forgery, intentional omissions, misrepresentations, or the override of internal control. Obtain an understanding of internal control relevant to the audit in order to design audit procedures that are appropriate in the circumstances, but not for the purpose of expressing an opinion on the effectiveness of the Company s internal control.
256 256 Report of the réviseur d entreprises agréé Evaluate the appropriateness of accounting policies used and the reasonableness of accounting estimates and related disclosures made by the Board of Directors. Conclude on the appropriateness of Board of Directors use of the going concern basis of accounting and, based on the audit evidence obtained, whether a material uncertainty exists related to events or conditions that may cast significant doubt on the Company s ability to continue as a going concern. If we conclude that a material uncertainty exists, we are required to draw attention in our report of Réviseur d Entreprises Agréé to the related disclosures in the financial statements or, if such disclosures are inadequate, to modify our opinion. Our conclusions are based on the audit evidence obtained up to the date of our report of Réviseur d Entreprises Agréé. However, future events or conditions may cause the Company to cease to continue as a going concern. Evaluate the overall presentation, structure and content of the financial statements, including the disclosures, and whether the financial statements represent the underlying transactions and events in a manner that achieves fair presentation. We communicate with those charged with governance regarding, among other matters, the planned scope and timing of the audit and significant audit findings, including any significant deficiencies in internal control that we identify during our audit. We also provide those charged with governance with a statement that we have complied with relevant ethical requirements regarding independence, and to communicate with them all relationships and other matters that may reasonably be thought to bear on our independence, and where applicable, related safeguards. From the matters communicated with those charged with governance, we determine those matters that were of most significance in the audit of the financial statements of the current period and are therefore the key audit matters. We describe these matters in our report unless law or regulation precludes public disclosure about the matter or when, in extremely rare circumstances, we determine that a matter should not be communicated in our report because the adverse consequences of doing so would reasonably be expected to outweigh the public interest benefits of such communication. Report on Other Legal and Regulatory Requirements We have been appointed as Réviseur d Entreprises Agréé by the General Meeting of the Shareholders on May 10, 2017 and the duration of our uninterrupted engagement, including previous renewals and reappointments, is 11 years. The management report, which is the responsibility of the Board of Directors, is consistent with the financial statements and has been prepared in accordance with applicable legal requirements. The Corporate Governance Statement, included in the management report, is the responsibility of the Board of Directors. The information required by Article 68ter paragraph (1) letters c) and d) of the law of 19 December 2002 on the commercial and companies register and on the accounting records and annual accounts of undertakings, as amended, is consistent with the financial statements and has been prepared in accordance with applicable legal requirements. We confirm that the audit opinion is consistent with the additional report to the audit committee or equivalent. We confirm that the prohibited non-audit services referred to in the EU Regulation N 537/2014, on the audit profession were not provided and that we remain independent of the Company in conducting the audit. Other matter The Corporate Governance Statement includes information required by Article 68ter paragraph (1) of the law of 19 December 2002 on the commercial and companies register and on the accounting records and annual accounts of undertakings, as amended. For Deloitte Audit, Cabinet de Révision Agréé Jean-Pierre Agazzi, Réviseur d Entreprises Agréé Partner March 12, 2018

257
Annual Report Management report 1
 Annual Report 2016 Management report 1 2 Management report Management report 3 Table of contents Management Report Company overview 4 Business overview 5 Disclosures about market risks 28 Group operational
Table of content. Risks related to the global economy and the steel industry 291. Mining 237
 Table of content Management Report Company overview 3 Business overview 5 Disclosures about market risks 42 Group operational structure 46 Key transactions and events in 2015 48 Recent developments 49
EU steel market situation and outlook. Key challenges
 70th Session of the OECD Steel Committee Paris, 12 13 May 2011 EU steel market situation and outlook http://www.eurofer.org/index.php/eng/issues-positions/economic-development-steel-market Key challenges
Interim Management Report 1. Interim Financial Report
 Interim Management Report 1 Interim Financial Report Half Year ended June 30, 2017 2 Interim Management Report 2 Table of contents Interim Management Report Company overview 3 Message from the Chairman
Table of contents. Risks related to the global economy and the steel industry 203. Mining 213
 Annual Report 2014 Table of contents Management Report Company overview 4 Business overview 4 Disclosures about market risks 25 Summary of risks and uncertainties 27 Group structure 29 Key transactions
OVERVIEW. The EU recovery is firming. Table 1: Overview - the winter 2014 forecast Real GDP. Unemployment rate. Inflation. Winter 2014 Winter 2014
 OVERVIEW The EU recovery is firming Europe's economic recovery, which began in the second quarter of 2013, is expected to continue spreading across countries and gaining strength while at the same time
1 World Economy. Value of Finnish Forest Industry Exports Fell by Almost a Quarter in 2009
 1 World Economy The recovery in the world economy that began during 2009 has started to slow since spring 2010 as stocks are replenished and government stimulus packages are gradually brought to an end.
The international environment
 The international environment This article (1) discusses developments in the global economy since the August 1999 Quarterly Bulletin. Domestic demand growth remained strong in the United States, and with
U.S. Steel Market Outlook. Amy Ebben ArcelorMittal USA November 30, 2018
 U.S. Steel Market Outlook Amy Ebben ArcelorMittal USA November 30, 2018 Agenda ArcelorMittal introduction U.S. steel industry performance and trade Global steel industry Review of steel markets 1 About
HSBC Trade Connections: Trade Forecast Quarterly Update October 2011
 HSBC Trade Connections: Trade Forecast Quarterly Update October 2011 New quarterly forecast exploring the future of world trade and the opportunities for international businesses World trade will grow
First Quarter Questions and Answers
 First Quarter 2015 Questions and Answers Forward-Looking Statements This document may contain forward-looking information and statements about ArcelorMittal and its subsidiaries. These statements include
Economic Outlook. Global And Finnish. Technology Industries In Finland Turnover and orders picking up s. 5. Economic Outlook
 Economic Outlook Technology Industries of Finland 2 217 Global And Finnish Economic Outlook Broad-Based Global Economic Growth s. 3 Technology Industries In Finland Turnover and orders picking up s. 5
Emerging markets and mining growth
 Emerging markets and mining growth Aditya Mittal CFO and member of Group Management Board Plant Tour Brazil - 24-26 March 21 Disclaimer Forward-Looking Statements This document may contain forward-looking
Interim Financial Report. Half Year ended June 30, Interim Management Report 1
 Interim Financial Report Half Year ended June 30, 2016 Interim Management Report 1 2 Interim Management Report 2 Table of contents Interim Management Report Company Overview 3 Message from the Chairman
The Turkish Economy. Dynamics of Growth
 The Economy in Turkey in 2018 2018 1 The Turkish Economy The Turkish economy grew at a rate of 3.2% in 2016, largely due to the attempted coup and terror attacks. The outlook was negative in the beginning
North American Steel Industry Recent Market Developments, Future Prospects and Key Challenges
 North American Steel Industry Recent Market Developments, Future Prospects and Key Challenges OECD Steel Committee December 1-11, 29 Paris, France * American Iron and Steel Institute (AISI) Steel Manufacturers
FY 2017 RESULTS PRESENTATION
 FY 2017 RESULTS PRESENTATION April 5, 2018 Disclaimer This presentation does not constitute or form part of and should not be construed as, an offer to sell or issue or the solicitation of an offer to
Summary. Economic Update 1 / 7 December 2017
 Economic Update Economic Update 1 / 7 Summary 2 Global Strengthening of the pickup in global growth, with GDP expected to increase 2.9% in 2017 and 3.1% in 2018. 3 Eurozone The eurozone recovery is upholding
Third-quarter earnings burdened by raw material-related losses. Group adjusted EBITDA at EUR 56 million
 1 (23) Contents Highlights in the third quarter of 2017... 2 Highlights during the first nine months of 2017... 2 Business and financial outlook for the fourth quarter of 2017... 3 CEO Roeland Baan...
PMI and economic outlook
 PMI and economic outlook Chris Williamson Chief Business Economist, IHS Markit 1 st November 2017 2 PMI coverage Current coverage Expansion pipeline 40+ Countries covered 27,000+ Companies surveyed every
Antonio Fazio: Overview of global economic and financial developments in first half 2004
 Antonio Fazio: Overview of global economic and financial developments in first half 2004 Address by Mr Antonio Fazio, Governor of the Bank of Italy, to the ACRI (Association of Italian Savings Banks),
QUARTERLY REPORT. 30 September 2017
 QUARTERLY REPORT 2017 CONTENTS 1 Page 4 BMW GROUP IN FIGURES 2 INTERIM GROUP MANAGEMENT REPORT Page 11 Page 11 Page 13 Page 18 Page 19 Page 21 Page 31 Page 31 Page 38 Page 39 Report on Economic Position
Flat Steel Product Prices - A Review
 Flat Steel Product Prices - A Review - Namita Naik he recession has resulted in desperate efforts made by steelmakers to support prices by rebalancing the Tmarket through production cuts. It is a usual
South African Reserve Bank STATEMENT OF THE MONETARY POLICY COMMITTEE. Issued by Lesetja Kganyago, Governor of the South African Reserve Bank
 South African Reserve Bank PRESS STATEMENT EMBARGO DELIVERY 20 November 2014 STATEMENT OF THE MONETARY POLICY COMMITTEE Issued by Lesetja Kganyago, Governor of the South African Reserve Bank Since the
Insolvency forecasts. Economic Research August 2017
 Insolvency forecasts Economic Research August 2017 Summary We present our new insolvency forecasting model which offers a broader scope of macroeconomic developments to better predict insolvency developments.
ArcelorMittal Fact Book
 ArcelorMittal Fact Book 2006 ArcelorMittal Fact Book 2006 01 02 At a glance 04 Company Profile 08 Highlights 10 Market and Industry 12 Key Figures 13 Steel Consumption and Markets 15 Steel Production by
Finland falling further behind euro area growth
 BANK OF FINLAND FORECAST Finland falling further behind euro area growth 30 JUN 2015 2:00 PM BANK OF FINLAND BULLETIN 3/2015 ECONOMIC OUTLOOK Economic growth in Finland has been slow for a prolonged period,
LESS DYNAMIC GROWTH AMID HIGH UNCERTAINTY
 OVERVIEW: The European economy has moved into lower gear amid still robust domestic fundamentals. GDP growth is set to continue at a slower pace. LESS DYNAMIC GROWTH AMID HIGH UNCERTAINTY Interrelated
Austria s economy set to grow by close to 3% in 2018
 Austria s economy set to grow by close to 3% in 218 Gerhard Fenz, Friedrich Fritzer, Fabio Rumler, Martin Schneider 1 Economic growth in Austria peaked at the end of 217. The first half of 218 saw a gradual
The North Africa Steel Markets: Recent Developments & Their Impact On Growth
 The North Africa Steel Markets: Recent Developments & Their Impact On Growth Presented to: 18 th Middle East Iron & Steel Conference (Dubai, 9 th December 21) By: George Matta Ezz Steel - Egypt The Political
Transforming tomorrow
 Transforming tomorrow Bank of America Merrill Lynch Global Metals and Mining Conference May 2010 Disclaimer Forward-Looking Statements This document may contain forward-looking information and statements
Global PMI. Global economy buoyed by rising US strength. June 12 th IHS Markit. All Rights Reserved.
 Global PMI Global economy buoyed by rising US strength June 12 th 2018 2 Global PMI rises but also brings signs of slower future growth At 54.0 in May, the headline JPMorgan Global Composite PMI, compiled
World Economic outlook
 Frontier s Strategy Note: 01/23/2014 World Economic outlook IMF has just released the World Economic Update on the 21st January 2015 and we are displaying the main points here. Even with the sharp oil
Facing the challenges
 Facing the challenges Whilst 2012 was a very difficult year, we have addressed the main challenges facing us. As a result we are in a stronger position, ready to provide excellent steel solutions to our
PPG Industries, Inc. Fourth Quarter 2018 Financial Results Earnings Brief January 17, 2019
 PPG Industries, Inc. Fourth Quarter 2018 Financial Results Earnings Brief January 17, 2019 Fourth Quarter Financial Highlights PPG fourth quarter net sales from continuing operations were approximately
EU steel market situation and outlook
 75nd Session of the OECD Steel Committee Paris, 5th December 2013 EU steel market situation and outlook EU economy: on the road to recovery 2013: economy turned the corner in Q2 Indicators strengthening
Second Quarter 2018 Questions and Answers
 Second Quarter 2018 Questions and Answers Page 1 Forward-Looking Statements This document may contain forward-looking information and statements about ArcelorMittal and its subsidiaries. These statements
Jan F Qvigstad: Outlook for the Norwegian economy
 Jan F Qvigstad: Outlook for the Norwegian economy Address by Mr Jan F Qvigstad, Deputy Governor of Norges Bank (Central Bank of Norway), at Sparebank 1 Fredrikstad, 4 November 2009. The text below may
Manpower Employment Outlook Survey
 Manpower Employment Outlook Survey Global 4 215 Global Employment Outlook Nearly 59, employers across 42 countries and territories have been interviewed to measure anticipated labor market activity between
Outlook for Economic Activity and Prices
 Not to be released until : p.m. Japan Standard Time on Saturday, October 31, 15. October 31, 15 Bank of Japan Outlook for Economic Activity and Prices October 15 (English translation prepared by the Bank's
Macroeconomic and financial market developments. March 2014
 Macroeconomic and financial market developments March 2014 Background material to the abridged minutes of the Monetary Council meeting 25 March 2014 Article 3 (1) of the MNB Act (Act CXXXIX of 2013 on
Financial results For the year ended 31 December 2017
 Financial results For the year ended 31 December 2017 Disclaimer Forward looking statements This presentation includes forward-looking information and statements about ArcelorMittal South Africa ( AMSA
EUROPEAN COMMISSION DIRECTORATE-GENERAL FOR ECONOMIC AND FINANCIAL AFFAIRS. September 2006 Interim forecast
 EUROPEAN COMMISSION DIRECTORATE-GENERAL FOR ECONOMIC AND FINANCIAL AFFAIRS September 26 Interim forecast Press conference of 6 September 26 European economic growth speeding up, boosted by buoyant domestic
Cautious optimism. Lakshmi N Mittal Chairman and CEO of ArcelorMittal
 Cautious optimism In recent years we have adapted our footprint to new demand realities, intensified our efforts to control costs and invested in our key franchise businesses. I am happy to report that
Viet Nam GDP growth by sector Crude oil output Million metric tons 20
 Viet Nam This economy is weathering the global economic crisis relatively well due largely to swift and strong policy responses. The GDP growth forecast for 29 is revised up from that made in March and
Analyst Meet Presentation Standalone Financial Results, Quarter Ended 30 Sep 2011
 Analyst Meet Presentation Standalone Financial Results, Quarter Ended 30 Sep 2011 Agenda Business Environment Key Developments Performance Overview Projects Update Guidance Update 2 Global economy Recovery
Jean-Pierre Roth: Recent economic and financial developments in Switzerland
 Jean-Pierre Roth: Recent economic and financial developments in Switzerland Introductory remarks by Mr Jean-Pierre Roth, Chairman of the Governing Board of the Swiss National Bank and Chairman of the Board
Review of the Economy. E.1 Global trends. January 2014
 Export performance was robust during the third quarter, partly on account of the sharp depreciation in the exchange rate of the rupee and partly on account of a modest recovery in major advanced economies.
Moderate but continued growth expected for global steel demand
 PRESS RELEASE Moderate but continued growth expected for global steel demand worldsteel Short Range Outlook October 2017 Brussels, 16 October 2017 - The World Steel Association (worldsteel) today released
The Outlook for the World Economy
 AIECE General Meeting Brussels, 14/15 November 218 The Outlook for the World Economy Downward risks are rising Klaus-Jürgen Gern Kiel Institute for the World Economy Forecasting Center Global growth has
Global Macroeconomic Monthly Review
 Global Macroeconomic Monthly Review August 14 th, 2018 Arie Tal, Research Economist Capital Markets Division, Economics Department 1 Please see disclaimer on the last page of this report Key Issues Global
SEPTEMBER Overview
 Overview SEPTEMBER 214 Global growth. Global growth has been weaker than expected so far this year, as economic activity disappointed in a number of major countries in the first six months (Figure 1).
MEDIUM-TERM FORECAST
 MEDIUM-TERM FORECAST Q2 2010 Published by: Národná banka Slovenska Address: Národná banka Slovenska Imricha Karvaša 1 813 25 Bratislava Slovakia Contact: Monetary Policy Department +421 2 5787 2611 +421
Leumi. Global Economics Monthly Review. Arie Tal, Research Economist. May 8, The Finance Division, Economics Department. leumiusa.
 Global Economics Monthly Review May 8, 2018 Arie Tal, Research Economist The Finance Division, Economics Department Leumi leumiusa.com Please see important disclaimer on the last page of this report Key
Global MT outlook: Will the crisis in emerging markets derail the recovery?
 Global MT outlook: Will the crisis in emerging markets derail the recovery? John Walker Chairman and Chief Economist jwalker@oxfordeconomics.com March 2014 Oxford Economics Oxford Economics is one of the
South African Reserve Bank STATEMENT OF THE MONETARY POLICY COMMITTEE. Issued by Lesetja Kganyago, Governor of the South African Reserve Bank
 South African Reserve Bank PRESS STATEMENT EMBARGO DELIVERY 24 May 2018 STATEMENT OF THE MONETARY POLICY COMMITTEE Issued by Lesetja Kganyago, Governor of the South African Reserve Bank In recent weeks,
Meeting with Analysts
 CNB s New Forecast (Inflation Report III/2018) Meeting with Analysts Karel Musil Prague, 3 August 2018 Outline 1. Assumptions of the forecast 2. The new macroeconomic forecast 3. Comparison with the previous
Eurozone. EY Eurozone Forecast March 2014
 Eurozone EY Eurozone Forecast March 2014 Austria Belgium Cyprus Estonia Finland France Germany Greece Ireland Italy Latvia Luxembourg Malta Netherlands Portugal Slovakia Slovenia Spain Outlook for Germany
Text. improvement in earnings. Textdemand drove continued
 Good Textdemand drove continued improvement in earnings Text Presentation of the Q2/2018 results Martin Lindqvist, President & CEO Håkan Folin, CFO July 20, 2018 Agenda Market and demand trends Performance
UC RUSAL ANNOUNCES 2017 SECOND QUARTER AND INTERIM RESULTS
 Press-release UC RUSAL ANNOUNCES 2017 SECOND QUARTER AND INTERIM RESULTS Moscow, 25 August 2017 UC RUSAL (SEHK: 486, Euronext: RUSAL/RUAL, Moscow Exchange: RUAL), a leading global aluminium producer, announces
Positive trend in earnings and strong cash flow
 Positive trend in earnings and strong cash flow Presentation of the Q3/2017 result Martin Lindqvist, President & CEO Håkan Folin, CFO October 25, 2017 Agenda Q3/2017 and performance by division Financials
Investor presentation. May 2015
 Investor presentation May 2015 Disclaimer Forward-Looking Statements This document may contain forward-looking information and statements about ArcelorMittal and its subsidiaries. These statements include
Global Economic Outlook 2014 Year Ahead Outlook January 2014
 PRUDENTIAL INTERNATIONAL INVESTMENTS ADVISERS, LLC. Global Economic Outlook 2014 Year Ahead Outlook January 2014 2014 Year Ahead - Global Economic Outlook Global Growth Strengthens as U.S. & U.K. GDP Growth
Eurozone. EY Eurozone Forecast September 2014
 Eurozone EY Eurozone Forecast September 2014 Austria Belgium Cyprus Estonia Finland France Germany Greece Ireland Italy Latvia Luxembourg Malta Netherlands Portugal Slovakia Slovenia Spain Outlook for
Economic ProjEctions for
 Economic Projections for 2016-2018 ECONOMIC PROJECTIONS FOR 2016-2018 Outlook for the Maltese economy 1 Economic growth is expected to ease Following three years of strong expansion, the Bank s latest
3. The international debt securities market
 Jeffery D Amato +41 61 280 8434 jeffery.amato@bis.org 3. The international debt securities market The fourth quarter completed a banner year for international debt securities. Issuance of bonds and notes
Explore the themes and thinking behind our decisions.
 ASSET ALLOCATION COMMITTEE VIEWPOINTS First Quarter 2017 These views are informed by a subjective assessment of the relative attractiveness of asset classes and subclasses over a 6- to 18-month horizon.
Outlook for Economic Activity and Prices (July 2018)
") Outlook for Economic Activity and Prices (July 2018) July 31, 2018 Bank of Japan The Bank's View 1 Summary Japan's economy is likely to continue growing at a pace above its potential in fiscal 2018, mainly
Outlook for Economic Activity and Prices (July 2018) July 31, 2018 Bank of Japan The Bank's View 1 Summary Japan's economy is likely to continue growing at a pace above its potential in fiscal 2018, mainly
Economic Update. Port Finance Seminar. Paul Bingham. Global Insight, Inc. Copyright 2006 Global Insight, Inc.
 Economic Update Copyright 26 Global Insight, Inc. Port Finance Seminar Paul Bingham Global Insight, Inc. Baltimore, MD May 16, 26 The World Economy: Is the Risk of a Boom-Bust Rising? As the U.S. Economy
Global Economy & the Machine Tool Outlook. Jan 2010 Rhys Herbert
 Global Economy & the Machine Tool Outlook Jan 21 Rhys Herbert rherbert@oxfordeconomics.com Which scenario do you favour? Short-term outlook (a) W -shaped cycle Growth initially boosted by inventory rebuild
ANN JOO RESOURCES BERHAD 22 ND ANNUAL GENERAL MEETING DATO LIM HONG THYE, GROUP MANAGING DIRECTOR 30 MAY 2018
 ANN JOO RESOURCES BERHAD 22 ND ANNUAL GENERAL MEETING DATO LIM HONG THYE, GROUP MANAGING DIRECTOR 30 MAY 2018 INDUSTRY OVERVIEW INDUSTRY PERFORMANCE STEEL BAR PRICES (SOUTHEAST ASIA) 2004-2008 Commodities
Eurozone. Economic Watch FEBRUARY 2017
 Eurozone Economic Watch FEBRUARY 2017 EUROZONE WATCH FEBRUARY 2017 Eurozone: A slight upward revision to our GDP growth projections The recovery proceeded at a steady and solid pace in, resulting in an
Economic Outlook. Global And Finnish. Technology Industries In Finland Economic uncertainty has not had a major impact yet p. 5.
 Economic Outlook Technology Industries of 1 219 Global And Finnish Economic Outlook Uncertainty dims growth outlook p. 3 Technology Industries In Economic uncertainty has not had a major impact yet p.
Global Economic Outlook
 Global Economic Outlook Will the growth continue and at what pace? Latin American Conference São Paulo August 2018 Lasse Sinikallas Director, Macroeconomics Copyright 2018 RISI, Inc. Proprietary Information
Portfolio Strategist Update from BlackRock Active Opportunity ETF Portfolios
 Portfolio Strategist Update from BlackRock Active Opportunity ETF Portfolios As of Sept. 30, 2017 Ameriprise Financial Services, Inc., ("Ameriprise Financial") is the investment manager for Active Opportunity
GLOBAL EQUITY MARKET OUTLOOK
 LPL RESEARCH WEEKLY MARKET COMMENTARY KEY TAKEAWAYS 2017 was an excellent year for international equities, particularly EM. We favor the United States and EM equities for tactical global asset allocations
ManpowerGroup Employment Outlook Survey Finland
 ManpowerGroup Employment Outlook Survey Finland 4 217 The ManpowerGroup Employment Outlook Survey for the fourth quarter 217 was conducted by interviewing a representative sample of 625 employers in Finland.
Financial Market Outlook: Stocks Rebounding from July Correction, Further Gains Likely. Bond Yields Range Bound
 For Market Commentary Interviews Contact: Lisa Villareal, 973-367-2503/lisa.villareal@prudential.com Financial Market Outlook & Strategy: Stocks Rebounding from July Correction, Further Gains Likely. Bond
Austria s economy will grow by 2¾% in 2017
 Gerhard Fenz, Friedrich Fritzer, Martin Schneider 1 In the first half of 217, Austria s economy gathered further momentum. With growth rates by.8% in both the first and the second quarters, Austria recorded
International & Global Commentaries
 International & Global Commentaries Market Review International Equity Global Select Looking Ahead Market Review In aggregate, global equities posted positive returns in the first quarter, with developed
Mining Strategic Progress - Exploiting our potential ArcelorMittal Mines Canada, June 29, 2015 Simon Wandke, Vice President Commercial
 Mining Strategic Progress - Exploiting our potential ArcelorMittal Mines Canada, June 29, 2015 Simon Wandke, Vice President Commercial Disclaimer Forward-Looking Statements This document may contain forward-looking
Global Investment Outlook & Strategy
 PRUDENTIAL INTERNATIONAL INVESTMENTS ADVISERS, LLC. Global Investment Outlook & Strategy John Praveen, PhD Chief Investment Strategist FOR MORE INFORMATION CONTACT: Mayura Hooper Phone: 973-367-7930 Email:
ECONOMIC OUTLOOK UNIVERSITY OF CYPRUS ECONOMICS RESEARCH CENTRE. October Issue 15/4
 SUMMARY UNIVERSITY OF CYPRUS ISSN 1986-1001 The recovery of economic activity in Cyprus is forecasted to continue in the following quarters. Real GDP growth for 2015 is projected at 1.3%. Real output is
Svein Gjedrem: The outlook for the Norwegian economy
 Svein Gjedrem: The outlook for the Norwegian economy Address by Mr Svein Gjedrem, Governor of Norges Bank (Central Bank of Norway), at the Bergen Chamber of Commerce and Industry, Bergen, 11 April 2007.
Summary. Economic Update 1 / 7 May Global Global GDP growth is forecast to accelerate to 2.9% in 2017 and maintain at 3.0% in 2018.
 Economic Update Economic Update 1 / 7 Summary 2 Global Global GDP growth is forecast to accelerate to 2.9% in 2017 and maintain at 3.0% in 2018. 3 Eurozone The eurozone s recovery appears to strengthen
Quarterly market summary
 Quarterly market summary 4th Quarter 2016 Economic overview Economies around the world appear to be relatively resilient, with data signalling that in many countries, economic activities are expanding
Financial Information
 Financial Information Q3 of 5.9bn, organic up 0.7% Performance in line with H1, driven by China and North America, while Western Europe remained difficult Partner observed strong of 5% outside Western
STEEL MARKET DEVELOPMENTS
 4 TH QUARTER 2011 by Laurent Daniel and Anthony de Carvalho OECD, Paris Note for Israel The statistical data for Israel are supplied by and under the responsibility of the relevant Israeli authorities.
Financial Market Outlook: Further Stock Gain on Faster GDP Rebound and Earnings Recovery. Year-end Target Raised
 For Market Commentary Interviews Contact: Lisa Villareal, 973-367-2503/lisa.villareal@prudential.com Financial Market Outlook & Strategy: FurtherStock Gains Likely, Year-end Target Raised. Bond Under Pressure
Outlook for Economic Activity and Prices (April 2010)
") April 30, 2010 Bank of Japan Outlook for Economic Activity and Prices (April 2010) The Bank's View 1 The global economy has emerged from the sharp deterioration triggered by the financial crisis and has
April 30, 2010 Bank of Japan Outlook for Economic Activity and Prices (April 2010) The Bank's View 1 The global economy has emerged from the sharp deterioration triggered by the financial crisis and has
Consolidated Business Results for the First Quarter of the Fiscal Year Ending March 31, 2014 (U.S. GAAP)
") Komatsu Ltd. Corporate Communications Dept. Tel: +81-(0)3-5561-2616 Date: July 29, 2013 URL: http://www.komatsu.com/ Consolidated Business Results for the First Quarter of the Fiscal Year Ending March
Komatsu Ltd. Corporate Communications Dept. Tel: +81-(0)3-5561-2616 Date: July 29, 2013 URL: http://www.komatsu.com/ Consolidated Business Results for the First Quarter of the Fiscal Year Ending March
World Payments Stresses in
 World Payments Stresses in 1956-57 INTERNATIONAL TRANSACTIONS in the year ending June 1957 resulted in net transfers of gold and dollars from foreign countries to the United States. In the four preceding
SOUTH ASIA. Chapter 2. Recent developments
 SOUTH ASIA GLOBAL ECONOMIC PROSPECTS January 2014 Chapter 2 s GDP growth rose to an estimated 4.6 percent in 2013 from 4.2 percent in 2012, but was well below its average in the past decade, reflecting
1 World Economy. about 0.5% for the full year Its GDP in 2012 is forecast to grow by 2 3%.
 1 World Economy The short-term outlook on the Finnish forest industry s exports markets is overshadowed by uncertainty and a new setback for growth in the world economy. GDP growth in the world economy
South African Reserve Bank STATEMENT OF THE MONETARY POLICY COMMITTEE. Issued by Lesetja Kganyago, Governor of the South African Reserve Bank
 South African Reserve Bank PRESS STATEMENT EMBARGO DELIVERY 18 January 2018 STATEMENT OF THE MONETARY POLICY COMMITTEE Issued by Lesetja Kganyago, Governor of the South African Reserve Bank In recent weeks,
Monthly Report of Recent Economic and Financial Developments December 2015
 December, 15 Bank of Japan Monthly Report of Recent Economic and Financial Developments December 15 (English translation prepared by the Bank's staff based on the Japanese original released on December
What is the economic outlook for OECD countries? An interim assessment
 What is the economic outlook for OECD countries? An interim assessment Paris, 3 rd September 2009 11h00 Paris time Jorgen Elmeskov Acting Head of Economics Department www.oecd.org/oecdeconomicoutlook 1.
IMF forecasts India s GDP growth to improve from 6.7% in FY2018 to 7.4% in FY2019 : World Economic Outlook
 All Members, IMF forecasts India s GDP growth to improve from 6.7% in FY2018 to 7.4% in FY2019 : World Economic Outlook International monetary fund (IMF) in its latest update on World Economic Outlook
GETTING STRONGER, BUT TENSIONS ARE RISING
 GETTING STRONGER, BUT TENSIONS ARE RISING Summary The world economy will continue to strengthen in 2018 and 2019, with global GDP growth projected to rise to about 4%, from 3.7% in 2017. Stronger investment,
Recent developments in the Global and South African economies
 Day Month Year Recent developments in the Global and South African economies Presented by: Nico Kelder Senior Economist Industrial Development Corporation of South Africa 2010 Growth, Development and Investment