CH 3 P4 as of ink
|
|
|
- Barbra Merritt
- 5 years ago
- Views:
Transcription
1 1
2 2


3 3
4 4
5 5
6 Ron has a player s card for the arcade at the mall. His player s card keeps track of the number of credits he earns as he wins games. Each winning game earns the same number of credits, and those credits can be redeemed for various prizes. Ron has been saving his credits to collect a prize worth 500 credits. The table shows the number of credits Ron had on his game card at various times today when he checked his balance at the arcade. 1. Explain the meaning of the ordered pair (0, 120) listed in the table. 2. Write a rate to compare the change in credits earned to the change in games won. Show your work. 3. Write the rate as a unit rate and explain its meaning. 4. Recalculate the unit rate by using different values from the table. Show your work. 6

7 8. Create a graph to represent the information from the previous table. Include scales and labels. a. Does the graph represent a linear function? Explain why or why not. b. Calculate the rate of change from the graph. Show your work. 9. What is the domain of the problem situation? Include units in your response. 7
8 8
9 9
10 10
11 11
12 12
13 13
14 14
15 15
16 16
17 17
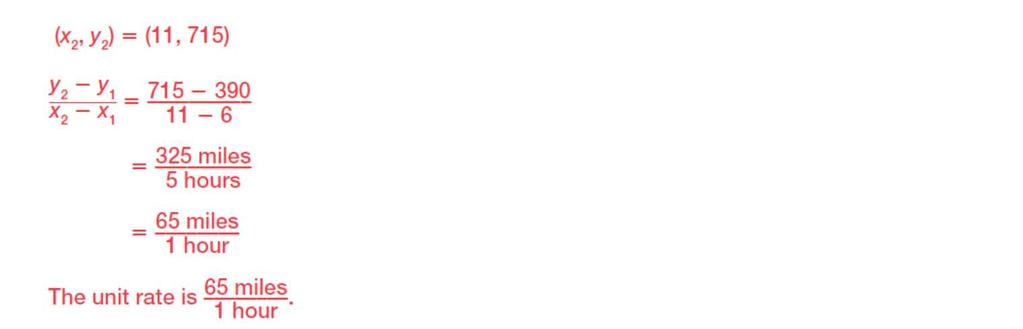
18 The Salem Middle School soccer team travels to a tournament. They began their bus trip the evening before the tournament by traveling 210 miles and staying overnight at a hotel. The following morning, they continued their trip by traveling an additional three hours until they reached their destination 180 miles from the hotel. They arrived there in time for their tournament, which began at 11:00 am. 1. What is the rate at which the bus traveled during the second portion of the trip? Show your work. 2. What was the total distance of the trip? Show your work. 3. If the bus traveled the same average rate during both segments of the trip, what is the total number of hours the team traveled on the bus? Show your work. 4. Why do you think the team did not make the entire trip the morning of the tournament? 18
19 5. Complete the graph to represent the context. The Salem Middle School soccer team travels to a tournament. They began their bus trip the evening before the tournament by traveling 210 miles and staying overnight at a hotel. The following morning, they continued their trip by traveling an additional three hours until they reached their destination 180 miles from the hotel. They arrived there in time for their tournament, which began at 11:00 am. 6. Explain why the graph represents a linear function. 7. Demonstrate the rate of change graphically and by using the formula. Show your work. 8. What is happening in terms of the context in the second quadrant of the graph? 19
 is not an entry in the table.")

20 9. Complete the table representing the context. 10. The unit rate (miles per hour) is not an entry in the table. Calculate the unit rate using the table of values. Show your work. 11. Recalculate the unit rate by using different values from the table. Show your work. 20
21 21
. A funicular is a railway that pulls cars up and down a slope.")

22 The Duquesne (pronounced "doo - KANE") Incline in Pittsburgh, Pennsylvania is what is known as a funicular (foo - NICK - you - lur). A funicular is a railway that pulls cars up and down a slope. Funiculars played important roles in many cities' histories. Funiculars were ways people could commute to work from their homes in hillsides to factories along river banks. The Duquesne Incline, which has a slope of 30 o, is one of the most popular tourist attractions in Pittsburgh. 22


23 1. Carefully match the graphs, tables, contexts, and equations on the following pages. Match each equation with its correct graph, table, or context. Explain how you matched the equations with the representations. 23
24 24
25 If a linear equation is solved for y, the coefficient of x represents the rate of change, or slope of the line. Determine the slopes of the lines represented by each equation. Show your work. 25
26 26
27 27
28 28
29 29
30 30

31 Questions 1 through 5 provide guidance for completing the graphic organizer that follows. 1. Read the context. Represent that information in the form of a graph, a table, and an equation. 2. Revisit each representation. In each box, show how the rate of change is represented. The rate of change is one important feature of a linear function. Another important feature is the yintercept. The y-intercept is the y-coordinate of the point where a graph crosses the y-axis. The y-intercept can also be written in the form (0, y). 3. Mark the y-intercept on the graph. Label the yintercept in coordinate form. 4. What is the meaning of the y-intercept in the context? 5. Revisit each representation. Mark where the yintercept is evident in the context, the table, and the equation. 31


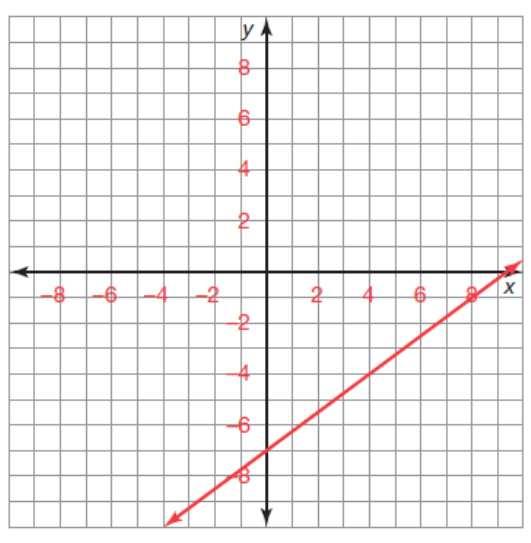
32 Examine each linear graph and determine the y-intercept. Write the y-intercept in coordinate form. Show all work. 32

33 Each table represents a linear function. Use the table to identify the y-intercept. Write the y-intercept in coordinate form. Show all work. 33
34 34

35 As you learned previously, the slope-intercept form of a linear equation is y = mx + b where m is the slope of the line. However, you did not learn what b represented. In the slope-intercept form, b is the y-intercept of the line. Remember that the slope of the line is the "steepness" of that line. Douglas is giving away tickets to a concert that he won from a radio station contest. Currently, he has 10 tickets remaining. He gives a pair of tickets to each person who asks for them. An equation to represent this context is: y = number of tickets available x = number of people who request tickets y = -2x + 10 Follow these steps to graph the equation: Step 1: Write the coordinates for the y-intercept. Step 2: Plot the y-intercept on the coordinate plane shown. Step 3: Write the slope as a ratio. Step 4: Use the slope and count from the y-intercept. To identify another point on the graph, start at the y-intercept and count either down (negative) or up (positive) for the rise. Then, count either left (negative) or right (positive) for the run. Continue the counting process to plot the next points. Step 5: Connect the points to make a straight line. 35

36 Graph each line. Be careful to take into account the scales on the axes. 36
37 So far, you have been able to determine the y-intercept of a line when given the linear equation in the slopeintercept form. However, you can determine the y-intercept of a line when given the slope of that line and one point that lies on the line. Calculate the y-intercept of each line when given the slope and one point that lies on the line. 37
38 38
39 39
40 So far, you have determined the y-intercept from the slope-intercept form of a linear equation, and the y-intercept from the slope and a point on that lies on the line given. Now, you will write the equation of a line when given two points that lie on the line. Write an equation of a line using the given information. Show your work. 1. (7, 15) and (-39, 28) 3. (6, 19) and (0, -35) 40
41 4. The slope is - 8. The point (3, 12) lies on the line. 41
42 1. Write the equation of a line in point-slope form with a slope of -8 and the point (3, 12) that lies on the line. 2. While this equation took little time to write, it is difficult to visualize its graph or even its y-intercept. To determine the y-intercept, manipulate the equation using algebra to write the equation in y = mx + b form. Show all work. 3. What is the y-intercept of this line? 4. Write the equation of each line in point-slope form. Then, state the y-intercept of the line. Show all work. a. slope = -5; (16, 32) lies on the line 42
43 4. Write the equation of each line in point-slope form. Then, state the y-intercept of the line. Show all work. a. slope = -5; (16, 32) lies on the line 43
44 44
45 45
46 46
47 47
48 48
49 49
Equations. Krista Hauri I2T2 Project
 Applied Linear Equations Krista Hauri I2T2 Project Grade Level: 9 th Intergraded Algebra 1 Time Span : 5 (40 minute) days Tools: Calculator Base Ranger (CBR) at least 4 TI-84 Graphing Calculator for each
Section 4.3 Objectives
 CHAPTER ~ Linear Equations in Two Variables Section Equation of a Line Section Objectives Write the equation of a line given its graph Write the equation of a line given its slope and y-intercept Write
Algebra Success. LESSON 14: Discovering y = mx + b
 T282 Algebra Success [OBJECTIVE] The student will determine the slope and y-intercept of a line by examining the equation for the line written in slope-intercept form. [MATERIALS] Student pages S7 S Transparencies
Int Math 1 Midterm Review Handout (Modules 1-5)
") Int Math 1 Midterm Review Handout (Modules 1-5) 1 Short Answer: (Put answer in box below.) A small hotel with 4 rooms was destroyed in a fire. After the hotel was rebuilt, the owner took out a loan to
Int Math 1 Midterm Review Handout (Modules 1-5) 1 Short Answer: (Put answer in box below.) A small hotel with 4 rooms was destroyed in a fire. After the hotel was rebuilt, the owner took out a loan to
Slope-Intercept Form Practice True False Questions Indicate True or False for the following Statements.
 www.ck2.org Slope-Intercept Form Practice True False Questions Indicate True or False for the following Statements.. The slope-intercept form of the linear equation makes it easier to graph because the
f x f x f x f x x 5 3 y-intercept: y-intercept: y-intercept: y-intercept: y-intercept of a linear function written in function notation
 Questions/ Main Ideas: Algebra Notes TOPIC: Function Translations and y-intercepts Name: Period: Date: What is the y-intercept of a graph? The four s given below are written in notation. For each one,
EOC Review Days 2 & 3: Linear Basics, Slope, and Intercepts
 Name: Date: Period: Algebra 1 Bowling, Cawthon, Fletcher, Skiles EOC Review Days 2 & 3: Linear Basics, Slope, and Intercepts 1. Find the x-intercept and the y-intercept for the function represented in
List the quadrant(s) in which the given point is located. 1) (-10, 0) A) On an axis B) II C) IV D) III
 in which the given point is located. 1) (-10, 0) A) On an axis B) II C) IV D) III") MTH 55 Chapter 2 HW List the quadrant(s) in which the given point is located. 1) (-10, 0) 1) A) On an axis B) II C) IV D) III 2) The first coordinate is positive. 2) A) I, IV B) I, II C) III, IV D) II,
MTH 55 Chapter 2 HW List the quadrant(s) in which the given point is located. 1) (-10, 0) 1) A) On an axis B) II C) IV D) III 2) The first coordinate is positive. 2) A) I, IV B) I, II C) III, IV D) II,
Mathematics Success Level H
 Mathematics Success Level H T473 [OBJECTIVE] The student will graph a line given the slope and y-intercept. [MATERIALS] Student pages S160 S169 Transparencies T484, T486, T488, T490, T492, T494, T496 Wall-size
Extra Practice Chapter 6
 Extra Practice Chapter 6 Topics Include: Equation of a Line y = mx + b & Ax + By + C = 0 Graphing from Equations Parallel & Perpendicular Find an Equation given Solving Systems of Equations 6. - Practice:
Review Exercise Set 13. Find the slope and the equation of the line in the following graph. If the slope is undefined, then indicate it as such.
 Review Exercise Set 13 Exercise 1: Find the slope and the equation of the line in the following graph. If the slope is undefined, then indicate it as such. Exercise 2: Write a linear function that can
Unit 3: Writing Equations Chapter Review
 Unit 3: Writing Equations Chapter Review Part 1: Writing Equations in Slope Intercept Form. (Lesson 1) 1. Write an equation that represents the line on the graph. 2. Write an equation that has a slope
dollars per person; the cost is $45 for each person. dollars per person; the cost is $1 for 225 people.
 Name: ate: 1 The table shows the cost of a vacation package for a given number of people. The rate of change is constant in the table. Find the rate of change. Explain what the rate of change means for
Mathematics Success Grade 8
 Mathematics Success Grade 8 T379 [OBJECTIVE] The student will derive the equation of a line and use this form to identify the slope and y-intercept of an equation. [PREREQUISITE SKILLS] Slope [MATERIALS]
Algebra I April 2017 EOC Study Guide Practice Test 1
 Name: Algebra I April 2017 EOC Study Guide Practice Test 1 Score: Top 3 Items to Study: 1. 2. 3. 1) The distance a car travels can be found using the formula d = rt, where d is the distance, r is the rate
Lecture Notes 1 Part B: Functions and Graphs of Functions
 Lecture Notes 1 Part B: Functions and Graphs of Functions In Part A of Lecture Notes #1 we saw man examples of functions as well as their associated graphs. These functions were the equations that gave
4.1 Write Linear Equations by Using a Tables of Values
 4.1 Write Linear Equations by Using a Tables of Values Review: Write y = mx + b by finding the slope and y-intercept m = b = y = x + Every time x changes units, y changes units m = b = y = x + Every time
Module 2- A Coordinate Geometry. 1. What is an equation of the line whose graph is shown? A. y = x B. y = 2x C. y = x D.
 Name: Date: 1. What is an equation of the line whose graph is shown? A. y = x B. y = 2x C. y = x D. y = 2 2. Which is an equation for line l in the accompanying diagram? A. y = 2x + 2 B. y = 2x 4 C. y
TCM Final Review Packet Name Per.
 TCM Final Review Packet Name Per. MULTIPLE CHOICE. Choose the one alternative that best completes the statement or answers the question. Translate the statement into a formula. 1) The total distance traveled,
Common Review of Graphical and Algebraic Methods
 Common Review of Graphical and Algebraic Methods The questions in this review are in pairs. An algebraic version followed by a graph version. Each pair has the same answers. However, do them separately
Algebra I EOC - Review 1 st Semester, (2x + 1) 3
 3") Algebra I EOC - Review 1 st Semester, 2013 Simplify the following. 1. - 2 1 (x 3) + 5 4 (2x + 1) 2. 4 3 (2x + 1) 3 2 (x 1) 3. (6x 4) + 5(2x + 3) 4. -2(3x 1) 4(x + 1) Find the following for each of the
Algebra I EOC - Review 1 st Semester, 2013 Simplify the following. 1. - 2 1 (x 3) + 5 4 (2x + 1) 2. 4 3 (2x + 1) 3 2 (x 1) 3. (6x 4) + 5(2x + 3) 4. -2(3x 1) 4(x + 1) Find the following for each of the
LINES AND SLOPES. Required concepts for the courses : Micro economic analysis, Managerial economy.
 LINES AND SLOPES Summary 1. Elements of a line equation... 1 2. How to obtain a straight line equation... 2 3. Microeconomic applications... 3 3.1. Demand curve... 3 3.2. Elasticity problems... 7 4. Exercises...
Algebra 1 Predicting Patterns & Examining Experiments
 We will explicitly define slope-intercept form. We have already examined slope, y- intercepts, and graphing from tables, now we are putting all of that together. This lesson focuses more upon the notation
Name: Date: Period: Activity 4.3.1: What is Slope?
 Name: Date: Period: Activity 4.3.: What is Slope? What is slope? If you have ever walked up or down a hill, then you have already experienced a real life example of slope. Keeping this fact in mind, by
par ( 12). His closest competitor, Ernie Els, finished 3 strokes over par (+3). What was the margin of victory?
. His closest competitor, Ernie Els, finished 3 strokes over par (+3). What was the margin of victory?") Exam Name MULTIPLE CHOICE. Choose the one alternative that best completes the statement or answers the question. 1) Tiger Woods won the 000 U.S. Open golf tournament with a score of 1 strokes under par
Exam Name MULTIPLE CHOICE. Choose the one alternative that best completes the statement or answers the question. 1) Tiger Woods won the 000 U.S. Open golf tournament with a score of 1 strokes under par
SPIRIT 2.0 Lesson: Am I Straight?
 SPIRIT 2.0 Lesson: Am I Straight? ===============================Lesson Header ============================== Lesson Title: Am I Straight? Draft Date: July 21, 2008 1st Author (Writer): Neil Hammond 2nd
rise m x run The slope is a ratio of how y changes as x changes: Lines and Linear Modeling POINT-SLOPE form: y y1 m( x
 Chapter 1 Notes 1 (c) Epstein, 013 Chapter 1 Notes (c) Epstein, 013 Chapter1: Lines and Linear Modeling POINT-SLOPE form: y y1 m( x x1) 1.1 The Cartesian Coordinate System A properly laeled set of axes
Lesson 2.6 Creating and Graphing Linear Equations in Two Variables
 Lesson 2.6 Creating and Graphing Linear Equations in Two Variables Concept: Graphing Linear Equations EQ: How do I create and graph a linear equation in two variables from a word problem? (Standard CED.2)
slope= y 2 y 1 x 2 Calculate and simplify the slope. 5. (1, 3) (4, 9) 6. (3, 7) (8, 17) 7. (-3, -5) (3, 7) 8. (-6, -11) (2, 5)
 (4, 9) 6. (3, 7) (8, 17) 7. (-3, -5) (3, 7) 8. (-6, -11) (2, 5)") A 7-1 Calculate the slope. (-2, -3) (3, 7) (-3, -5) (6, 13) slope= rise run = slope= y 2 y 1 x 2 x 1 = A 7-1 Name BDFM? Why? Use the graph to find the slope between the points. Simplify the slope. 1. (1,
A 7-1 Calculate the slope. (-2, -3) (3, 7) (-3, -5) (6, 13) slope= rise run = slope= y 2 y 1 x 2 x 1 = A 7-1 Name BDFM? Why? Use the graph to find the slope between the points. Simplify the slope. 1. (1,
Representing Linear Functions. Constant Rate of Change and Direct Variation. Writing Linear Equations
 Lesson 7-1 Lesson 7-2 Lesson 7-3 Lesson 7-4 Lesson 7-5 Lesson 7-6 Lesson 7-7 Lesson 7-8 Functions Representing Linear Functions Rate of Change Constant Rate of Change and Direct Variation Slope Slope-Intercept
Section 7C Finding the Equation of a Line
 Section 7C Finding the Equation of a Line When we discover a linear relationship between two variables, we often try to discover a formula that relates the two variables and allows us to use one variable
Algebra I EOC 10-Day STAAR Review. Hedgehog Learning
 Algebra I EOC 10-Day STAAR Review Hedgehog Learning Day 1 Day 2 STAAR Reporting Category Number and Algebraic Methods Readiness Standards 60% - 65% of STAAR A.10(E) - factor, if possible, trinomials with
Review for Test 3: Linear Functions
 Name: Date: Period: Review for Test 3: Linear Functions Slope Formula: y 2 y 1 x 2 x 1 1. Graph the line that passes through the given points. Then identify the slope, whichever intercept is asked for,
MLC at Boise State Logarithms Activity 6 Week #8
 Logarithms Activity 6 Week #8 In this week s activity, you will continue to look at the relationship between logarithmic functions, exponential functions and rates of return. Today you will use investing
b) According to the statistics above the graph, the slope is What are the units and meaning of this value?
 According to the statistics above the graph, the slope is What are the units and meaning of this value?") ! Name: Date: Hr: LINEAR MODELS Writing Motion Equations 1) Answer the following questions using the position vs. time graph of a runner in a race shown below. Be sure to show all work (formula, substitution,
! Name: Date: Hr: LINEAR MODELS Writing Motion Equations 1) Answer the following questions using the position vs. time graph of a runner in a race shown below. Be sure to show all work (formula, substitution,
Mrs Mat. Name: 2. Which is the following equation rewritten in slopeintercept. A) y = x + 1. B) y = 4x + 1. C) y = -4x + 1.
 y = x + 1. B) y = 4x + 1. C) y = -4x + 1.") Slope, Intercepts, and Graphing Equations Exam Expressions and Equations 8.EE - Understand the connections between proportional relationships, lines, and linear equations. No Calculator! Make sure all
Slope, Intercepts, and Graphing Equations Exam Expressions and Equations 8.EE - Understand the connections between proportional relationships, lines, and linear equations. No Calculator! Make sure all
1. You are given two pairs of coordinates that have a linear relationship. The two pairs of coordinates are (x, y) = (30, 70) and (20, 50).
 = (30, 70) and (20, 50).") Economics 102 Fall 2017 Answers to Homework #1 Due 9/26/2017 Directions: The homework will be collected in a box before the lecture. Please place your name, TA name and section number on top of the homework
Economics 102 Fall 2017 Answers to Homework #1 Due 9/26/2017 Directions: The homework will be collected in a box before the lecture. Please place your name, TA name and section number on top of the homework
WEEK 2 REVIEW. Straight Lines (1.2) Linear Models (1.3) Intersection Points (1.4) Least Squares (1.5)
 Linear Models (1.3) Intersection Points (1.4) Least Squares (1.5)") WEEK 2 REVIEW Straight Lines (1.2) Linear Models (1.3) Intersection Points (1.4) Least Squares (1.5) 1 STRAIGHT LINES SLOPE A VERTICAL line has NO SLOPE. All other lines have a slope given by m = rise
WEEK 2 REVIEW Straight Lines (1.2) Linear Models (1.3) Intersection Points (1.4) Least Squares (1.5) 1 STRAIGHT LINES SLOPE A VERTICAL line has NO SLOPE. All other lines have a slope given by m = rise
Chapter 4 Factoring and Quadratic Equations
 Chapter 4 Factoring and Quadratic Equations Lesson 1: Factoring by GCF, DOTS, and Case I Lesson : Factoring by Grouping & Case II Lesson 3: Factoring by Sum and Difference of Perfect Cubes Lesson 4: Solving
3.3 rates and slope intercept form ink.notebook. October 23, page 103. page 104. page Rates and Slope Intercept Form
 3.3 rates and slope intercept form ink.notebook page 103 page 104 page 102 3.3 Rates and Slope Intercept Form Lesson Objectives 3.3 Rates and Slope-Intercept Form Press the tabs to view details. Standards
35 38 point slope day 2.notebook February 26, a) Write an equation in point slope form of the line.
 Write an equation in point slope form of the line.") LT 6: I can write and graph equations in point slope form. p.35 What is point slope form? What is slope intercept form? Let's Practice: There is a line that passes through the point (4, 3) and has a slope
LT 6: I can write and graph equations in point slope form. p.35 What is point slope form? What is slope intercept form? Let's Practice: There is a line that passes through the point (4, 3) and has a slope
Final Project. College Algebra. Upon successful completion of this course, the student will be able to:
 COURSE OBJECTIVES Upon successful completion of this course, the student will be able to: 1. Perform operations on algebraic expressions 2. Perform operations on functions expressed in standard function
AUSTRALIAN ISLAMIC COLLEGE
 AUSTRALIAN ISLAMIC COLLEGE Western Australian Curriculum Mathematics 2018 Year 9 Project Based Learning Investigation Name: Student ID: Teacher: Instructions: Read the project carefully There is a lot
Finding the Equation from a Slope and y-intercept
 Lesson 4.4 Objectives Write linear equations given a slope and y-intercept, a slope and a point, or a graph. Writing Linear Equations Michael turns on the high-temperature oven each morning when he comes
Math Studio College Algebra
 - Studio College Algebra Kansas State University August 31, 2016 Format of a Linear Function Terminology: What are intercepts on the graph of a function? Format of a Linear Function Terminology: What are
Use Scantron 882E to transfer the answers. MULTIPLE CHOICE. Choose the one alternative that best completes the statement or answers the question.
 HW Date: Name Use Scantron 88E to transfer the answers. MULTIPLE CHOICE. Choose the one alternative that best completes the statement or answers the question. The graph shows sales in thousands of dollars
3. a) Recall that slope is calculated with formula:
 Recall that slope is calculated with formula:") Economics 102 Fall 2007 Homework #1 Answer Key 1. Cheri s opportunity cost of seeing the show is $115 dollars. This includes the $80 she could have earned working, plus the $30 for the ticket, plus the
Economics 102 Fall 2007 Homework #1 Answer Key 1. Cheri s opportunity cost of seeing the show is $115 dollars. This includes the $80 she could have earned working, plus the $30 for the ticket, plus the
Linear Modeling Business 5 Supply and Demand
 Linear Modeling Business 5 Supply and Demand Supply and demand is a fundamental concept in business. Demand looks at the Quantity (Q) of a product that will be sold with respect to the Price (P) the product
Graphing Equations Chapter Test Review
 Graphing Equations Chapter Test Review Part 1: Calculate the slope of the following lines: (Lesson 3) Unit 2: Graphing Equations 2. Find the slope of a line that has a 3. Find the slope of the line that
Summer Math Packet for Entering Algebra 1 Honors Baker High School
 Summer Math Packet for Entering Algebra 1 Honors Baker High School *You should be fluent in operations with fractions involved (multiplying, dividing, adding, and subtracting). *You should know all of
Objective Today I will calculate the linear depreciation of an automobile. Bellwork 1) What do you think depreciate means?
 What do you think depreciate means?") Objective Today I will calculate the linear depreciation of an automobile. Bellwork 1) What do you think depreciate means? lose value 2) In the equation y = 200x + 450, explain what 200 and 450 mean. 200
Objective Today I will calculate the linear depreciation of an automobile. Bellwork 1) What do you think depreciate means? lose value 2) In the equation y = 200x + 450, explain what 200 and 450 mean. 200
4. a. This table shows two points that are on the same straight line. Complete the table to show three other points on the same line.
 Moving Straight Ahead Study Questions 0. Sharon owns a bakery that makes cakes. She must pay a monthly rent for the bakery, and has to pay for ingredients for each cake. In January she made 300 cakes and
Topic #1: Evaluating and Simplifying Algebraic Expressions
 John Jay College of Criminal Justice The City University of New York Department of Mathematics and Computer Science MAT 105 - College Algebra Departmental Final Examination Review Topic #1: Evaluating
Buying A Car. Mathematics Capstone Course
 Buying A Car Mathematics Capstone Course I. UNIT OVERVIEW & PURPOSE: In this lesson the student will be asked to search the Internet and find a car that he/she would like to purchase. The student will
Equivalent Expressions & Combining Expressions
 Unit 6: Say It with Symbols//Investigations 1 & //Connections Name Class Date Equivalent Expressions & Combining Expressions Connecting Your Knowledge I can determine when algebraic expressions are equivalent
Math Performance Task Teacher Instructions
 Math Performance Task Teacher Instructions Stock Market Research Instructions for the Teacher The Stock Market Research performance task centers around the concepts of linear and exponential functions.
Section 1.4: Slope-Intercept Form
 Section 1.4: Slope-Intercept Form Objective: Give the equation of a line with a known slope and y-intercept. When graphing a line we found one method we could use is to make a table of values. However,
WEEK 1 REVIEW Lines and Linear Models. A VERTICAL line has NO SLOPE. All other lines have change in y rise y2-
 WEEK 1 REVIEW Lines and Linear Models SLOPE A VERTICAL line has NO SLOPE. All other lines have change in y rise y- y1 slope = m = = = change in x run x - x 1 Find the slope of the line passing through
Acc. Alg. II W.S. Sec Assign. # 5. Show work to justify all answers!!!!!!!
 Acc. Alg. II W.S. Sec. 1.1-1.4 Assign. # 5 Name Show work to justify all answers!!!!!!! 1. Determine p so that the slope of the line containing this pair of points has the given value. 5 ( -2, p), (4,
Cost (in dollars) 0 (free) Number of magazines purchased
 0 (free) Number of magazines purchased") Math 1 Midterm Review Name *****Don t forget to study the other methods for solving systems of equations (substitution and elimination) as well as systems of linear inequalities and line of best fit! Also,
Math 1 Midterm Review Name *****Don t forget to study the other methods for solving systems of equations (substitution and elimination) as well as systems of linear inequalities and line of best fit! Also,
BARUCH COLLEGE MATH 2003 SPRING 2006 MANUAL FOR THE UNIFORM FINAL EXAMINATION
 BARUCH COLLEGE MATH 003 SPRING 006 MANUAL FOR THE UNIFORM FINAL EXAMINATION The final examination for Math 003 will consist of two parts. Part I: Part II: This part will consist of 5 questions similar
Pre-Algebra Blizzard Bag Number 3
 Name: Class: Date: ID: A Pre-Algebra Blizzard Bag Number 3 Multiple Choice Identify the choice that best completes the statement or answers the question. Express each ratio as a fraction in simplest form..
Name: Date: Page 1 of 7. What is Slope? There are four types of slope you can encounter. A slope can be positive, negative, zero, or undefined.
 Name: Date: Page of 7 What is Slope? What is slope? If ou have ever walked up or down a hill, then ou have alread eperienced a real life eample of slope. Keeping this fact in mind, b definition, the slope
5.2E Lesson: Proportions in Tables and Graphs*
 5.2E Lesson: Proportions in Tables and Graphs* Name: Period: 1. Use Graph A below to fill in the table relating calories to snacks. Number Number of Ordered Write a complete sentence describing the meaning
CH 39 CREATING THE EQUATION OF A LINE
 9 CH 9 CREATING THE EQUATION OF A LINE Introduction S ome chapters back we played around with straight lines. We graphed a few, and we learned how to find their intercepts and slopes. Now we re ready to
notebook October 08, What are the x and y intercepts? (write your answers as coordinates).
.") 3.4 Opening Activity: Draw a graph of the equation y = 5x + 20 What are the x and y intercepts? (write your answers as coordinates). How are you able to use the equation but NOT the graph to find the x
3.4 Opening Activity: Draw a graph of the equation y = 5x + 20 What are the x and y intercepts? (write your answers as coordinates). How are you able to use the equation but NOT the graph to find the x
5.5: LINEAR AUTOMOBILE DEPRECIATION OBJECTIVES
 Section 5.5: LINEAR AUTOMOBILE DEPRECIATION OBJECTIVES Write, interpret, and graph a straight line depreciation equation. Interpret the graph of a straight line depreciation. Key Terms depreciate appreciate
2.2 Contextualizing Linear Functions
 2.2 izing Linear Functions Last unit we defined a linear function in several different ways: A function whose graph is a straight line, A function whose rate of change is constant, or A function whose
Economics 101 Fall 2018 Answers to Homework #1 Due Thursday, September 27, Directions:
 Economics 101 Fall 2018 Answers to Homework #1 Due Thursday, September 27, 2018 Directions: The homework will be collected in a box labeled with your TA s name before the lecture. Please place your name,
Algebra Review (New Version) Homework Problems
 Homework Problems") MATH 119 Algebra Review (New Version) Homework Problems The following set is only to review the Algebra needed for this class. It should be familiar to you from previous class such as M110, M111 or others.
MATH 119 Algebra Review (New Version) Homework Problems The following set is only to review the Algebra needed for this class. It should be familiar to you from previous class such as M110, M111 or others.
5.2 Partial Variation
 5.2 Partial Variation Definition: A relationship between two variables in which the dependent variable is the sum of a number and a constant multiple of the independent variable. Notice: If we take the
The Zero Product Law. Standards:
 Objective: Students will be able to (SWBAT) use complex numbers in polynomial identities and equations, in order to (IOT) solve quadratic equations with real coefficient that have complex solutions. Standards:
Name: Period: Date: FOMP 10 Final Review Part 2 v1. Short Answer. Level 1-2 Questions. 1. What expression does the diagram represent?
 Period: Date: FOMP 10 Final Review Part 2 v1 Short Answer Level 1-2 Questions 1. What expression does the diagram represent? 2. What is the factored form of the expression 5x 2 45? 3. What value of k makes
1) ordered pair: 2) function: 3) domain: 4) range: 5) solution of a linear equation: 6) proportional graph: 7) origin: 8) slope: 9) rise: 10) run:
 ordered pair: 2) function: 3) domain: 4) range: 5) solution of a linear equation: 6) proportional graph: 7) origin: 8) slope: 9) rise: 10) run:") ARE YOU READY? 7 th Grade Accelerated Chapter 11 Name: Vocabulary Date: Block: Write the definition for the following terms. Give an example if possible. 1) ordered pair: 2) function: 3) domain: 4) range:
ARE YOU READY? 7 th Grade Accelerated Chapter 11 Name: Vocabulary Date: Block: Write the definition for the following terms. Give an example if possible. 1) ordered pair: 2) function: 3) domain: 4) range:
Linear Relationships UNIT 3 Warm-Up A. Finding Percents Mentally Find 10% of each of the following numbers. (Move the decimal 1 place to the left.
 Linear Relationships UNIT 3 Warm-Up A Find 10% of each of the following numbers. (Move the decimal 1 place to the left.) 1) 600 2) 50 3) 36 4) 574 5) 26.5 6) 900 7) 270 8)13.8 9) 246 10) 0.36 11) Record
FINITE MATH LECTURE NOTES. c Janice Epstein 1998, 1999, 2000 All rights reserved.
 FINITE MATH LECTURE NOTES c Janice Epstein 1998, 1999, 2000 All rights reserved. August 27, 2001 Chapter 1 Straight Lines and Linear Functions In this chapter we will learn about lines - how to draw them
Linear function and equations Linear function, simple interest, cost, revenue, profit, break-even
 Exercises 4 Linear function and equations Linear function, simple interest, cost, revenue, profit, break-even Objectives - be able to think of a relation between two quantities as a function. - be able
Chapter 14. Descriptive Methods in Regression and Correlation. Copyright 2016, 2012, 2008 Pearson Education, Inc. Chapter 14, Slide 1
 Chapter 14 Descriptive Methods in Regression and Correlation Copyright 2016, 2012, 2008 Pearson Education, Inc. Chapter 14, Slide 1 Section 14.1 Linear Equations with One Independent Variable Copyright
A.REI.C.6: Graphing Linear Systems
 A.REI.C.6: Graphing Linear Systems 1 Rowan has $50 in a savings jar and is putting in $5 every week. Jonah has $10 in his own jar and is putting in $15 every week. Each of them plots his progress on a
MLC at Boise State Polynomials Activity 2 Week #3
 Polynomials Activity 2 Week #3 This activity will discuss rate of change from a graphical prespective. We will be building a t-chart from a function first by hand and then by using Excel. Getting Started
MATH SPEAK - TO BE UNDERSTOOD AND MEMORIZED
 FOM 11 T6 RATES AS GRAPHS 1 MATH SPEAK - TO BE UNDERSTOOD AND MEMORIZED 1) GRAPH a visual representation of a relationship between two different quantities. 2) SLOPE m a measure of the steepness of a graph
Unit 7 Exponential Functions. Name: Period:
 Unit 7 Exponential Functions Name: Period: 1 AIM: YWBAT evaluate and graph exponential functions. Do Now: Your soccer team wants to practice a drill for a certain amount of time each day. Which plan will
MA 162: Finite Mathematics - Chapter 1
 MA 162: Finite Mathematics - Chapter 1 Fall 2014 Ray Kremer University of Kentucky Linear Equations Linear equations are usually represented in one of three ways: 1 Slope-intercept form: y = mx + b 2 Point-Slope
3.1 Solutions to Exercises
 .1 Solutions to Exercises 1. (a) f(x) will approach + as x approaches. (b) f(x) will still approach + as x approaches -, because any negative integer x will become positive if it is raised to an even exponent,
MULTIPLE CHOICE. Choose the one alternative that best completes the statement or answers the question. C) C) 31.
 C) 31.") Eam Name MULTIPLE CHOICE. Choose the one alternative that best completes the statement or answers the question. Write the sentence as a mathematical statement. 1) Negative twent-four is equal to negative
Eam Name MULTIPLE CHOICE. Choose the one alternative that best completes the statement or answers the question. Write the sentence as a mathematical statement. 1) Negative twent-four is equal to negative
Algebra 1 Semester 1 Final Exam Review (Chapters 2, 3, 4, & 5)
") Name: Date Block: Algebra 1 Semester 1 Final Exam Review (Chapters 2, 3, 4, & 5) Chapter 2: Solving Equations 1. Solve each equation. Show your work! 5 1 3n y a) f + 9.8 = 8 b) h + = c) 2p = 54 d) - 15
Name: Date Block: Algebra 1 Semester 1 Final Exam Review (Chapters 2, 3, 4, & 5) Chapter 2: Solving Equations 1. Solve each equation. Show your work! 5 1 3n y a) f + 9.8 = 8 b) h + = c) 2p = 54 d) - 15
A. Linear B. Quadratic C. Cubic D. Absolute Value E. Exponential F. Inverse G. Square Root
 UCS JH Algebra I REVIEW GD #2 1 Which family of function does each graph belong? A. Linear B. Quadratic C. Cubic D. Absolute Value E. Exponential F. Inverse G. Square Root 2 The coach of a basketball team
LCHL Paper 1 Q2 (25 marks)
") Note: The sample answers provided are illustrative of one possible approach to answering the particular question. Students may adopt different but equally valid approaches and should be encouraged to compare
Note: The sample answers provided are illustrative of one possible approach to answering the particular question. Students may adopt different but equally valid approaches and should be encouraged to compare
Math 1101 Exam 1 Practice Problems
 Math 1101 Eam 1 Practice Problems These problems are not intended to cover all possible test topics. Rather, the should serve as an activit in preparing for our test, but other stud is required to full
Is It Getting Hot in Here?
 Lesson.1 Skills Practice Name Date Is It Getting Hot in Here? Modeling Data Using Linear Regression Vocabulary Choose the term that best completes each sentence. linear regression line of best fit linear
Chapter 6 Analyzing Accumulated Change: Integrals in Action
 Chapter 6 Analyzing Accumulated Change: Integrals in Action 6. Streams in Business and Biology You will find Excel very helpful when dealing with streams that are accumulated over finite intervals. Finding
SESSION 3: GRAPHS THAT TELL A STORY. KEY CONCEPTS: Line Graphs Direct Proportion Inverse Proportion Tables Formulae X-PLANATION 1.
 SESSION 3: GRAPHS THAT TELL A STORY KEY CONCEPTS: Line Graphs Direct Proportion Inverse Proportion Tables Formulae X-PLANATION 1. DIRECT PROPORTION Two quantities are said to be in direct proportion if
Chapter 10: Exponential Functions
 Chapter 10: Exponential Functions Lesson 1: Introduction to Exponential Functions and Equations Lesson 2: Exponential Graphs Lesson 3: Finding Equations of Exponential Functions Lesson 4: Exponential Growth
MULTIPLE CHOICE. Choose the one alternative that best completes the statement or answers the question.
 12B Practice for the Final Eam MULTIPLE CHOICE. Choose the one alternative that best completes the statement or answers the question. If = -4 and = -2, evaluate the epression. 12-6 1) + 2 A) - 9 B) 0 C)
Math 116: Business Calculus
 Math 116: Business Calculus Instructor: Colin Clark Spring 2017 Exam 1 - Thursday February 9. 1.1 Slopes and Equations of Lines. 1.2 Linear Functions and Applications. 2.1 Properties of Functions. 2.2
Prentice Hall Connected Mathematics 2, 7th Grade Units 2009 Correlated to: Minnesota K-12 Academic Standards in Mathematics, 9/2008 (Grade 7)
") 7.1.1.1 Know that every rational number can be written as the ratio of two integers or as a terminating or repeating decimal. Recognize that π is not rational, but that it can be approximated by rational
7.1.1.1 Know that every rational number can be written as the ratio of two integers or as a terminating or repeating decimal. Recognize that π is not rational, but that it can be approximated by rational
1 algebraic. expression. at least one operation. Any letter can be used as a variable. 2 + n. combination of numbers and variables
 1 algebraic expression at least one operation 2 + n r w q Any letter can be used as a variable. combination of numbers and variables DEFINE: A group of numbers, symbols, and variables that represent an
COWLEY COUNTY, KANSAS Meals and Travel Policy Effective August 1, 2014
 POLICY The County will reimburse all employees for reasonable and necessary travel and subsistence expenses actually incurred on behalf of the County with the approval of the appointing authority. The
TASK: What is the True Cost of Purchasing an Automobile?
 This task was developed by secondary mathematics and CTE teachers across Washington State from urban and rural areas. These teachers have incorporated financial literacy in their classroom and have received
ACCT312 CVP analysis CH3
 ACCT312 CVP analysis CH3 1 Cost-Volume-Profit Analysis A Five-Step Decision Making Process in Planning & Control Revisited 1. Identify the problem and uncertainties 2. Obtain information 3. Make predictions