Mathematics Success Grade 8
|
|
|
- Horatio Walsh
- 5 years ago
- Views:
Transcription
1 Mathematics Success Grade 8 T379 [OBJECTIVE] The student will derive the equation of a line and use this form to identify the slope and y-intercept of an equation. [PREREQUISITE SKILLS] Slope [MATERIALS] Student pages S185 S197 Ruler or straight-edge Colored paper (1 sheet per student for foldable) [ESSENTIAL QUESTIONS] 1. Where is the slope represented in the equation of a line? 2. Where is the y-intercept represented in the equation of a line? 3. What is the slope-intercept form of the equation of a line? Explain the meaning of the equation. [WORDS FOR WORD WALL] y-intercept, equation of a line: y = mx, y = mx + b, undefined slope, zero slope, horizontal, vertical [GROUPING] Cooperative Pairs (CP), Whole Group (WG), Individual (I) *For Cooperative Pairs (CP) activities, assign the roles of Partner A or Partner B to students. This allows each student to be responsible for designated tasks within the lesson. [LEVELS OF TEACHER SUPPORT] Modeling (M), Guided Practice (GP), Independent Practice (IP) [MULTIPLE REPRESENTATIONS] SOLVE, Verbal Description, Pictorial Representation, Concrete Representation, Graphic Organizer, Algebraic Formula, Graph [WARM-UP] (IP, WG) S185 (Answers on T391.) Have students turn to S185 in their books to begin the Warm-Up. Students will identify the unit rate or slope represented by equations, tables or graphs. Monitor students to see if any of them need help during the Warm-Up. After students have completed the Warm-Up, review the solutions as a whole group. {Graphic Organizer, Graph, Table, Algebraic Formula} [HOMEWORK] Take time to go over the homework from the previous night. [LESSON][1 2 Days (1 day = 80 minutes) M, GP, WG, CP, IP]
2 T380 Mathematics Success Grade 8 SOLVE Problem (WG, GP) S186 (Answers on T392.) Have students turn to S186 in their books. The first problem is a SOLVE problem. You are only going to complete the S step with students at this point. Tell students that during the lesson they will learn how to derive the equation of a line and use this form to identify the slope and y-intercept of an equation. They will use this knowledge to complete this SOLVE problem at the end of the lesson. {SOLVE, Verbal Description, Graphic Organizer} Slope as Rise over Run (M, GP, CP, WG) S186 (Answers on T392.) M, GP, CP, WG: After students complete the S Step of the SOLVE problem, direct them to the chart at the bottom of the page. Students will use this chart to review the concept of rise over run as a way to determine slope. Be sure to identify Partners A and B for activities. {Verbal Description, Graphic Organizer, Pictorial Representation, Graph} Slope as Rise over Run Step 1: Direct students attention to the first graph on S186. Partner A, what are we looking for as we examine the line on the graph? (the slope of the graph or the vertical change over the horizontal change) Partner B, what is another word for the vertical change? Justify your answer. (The rise is the vertical change from one point on the graph to another point on the graph.) Let s identify two points on the line that are on the graph: (1, 1) and (2, 3). Partner A, what is the vertical change from (1, 1) to (2, 3)? Explain your answer. [2 units The vertical change from (1, 1) to (2, 3) is 2 units] Record as the rise. Partner A, what is another word for the horizontal change? (The run is the horizontal change from one point on the graph to another point on the graph.) Partner B, what is the horizontal change from (1, 1) to (2, 3)? Explain your answer. [1 unit The horizontal change from (1,1) to (2, 3) is 1 unit] Record as the run. Partner A, can we simplify 2 over 1? (Yes) What is the slope? (2) Step 2: Direct students attention to the second graph on S186. Partner B, what are we looking for in this graph? (rise over run) Let s identify two points on the line that are on the graph: ( - 3, 5) and (0, 3). Plot the points on the line.
3 Mathematics Success Grade 8 T381 Partner A, what is the vertical change from ( - 3, 5) to (0, 3)? ( - 2 units) Record as the rise. Partner B, what is the horizontal change from ( - 3, 5) to (0, 3)? (3 units) Record as the run. Partner B, what is the rise over the run? ( ) The rise over the run is one way to identify and write the (slope) of the line. In algebra we use the letter (m) to represent slope. For Questions 1 and 2, go back and write the slope by using the notation of m =. Derive the Equation of a Line (M, GP, IP, CP, WG) S187, S188, S189 (Answers on T393, T394, T395.) M, GP, CP, WG: Have students turn to S187 in their books. Use the following activity to help students derive the equation of the line. Be sure students know their role as Partner A or Partner B. {Verbal Description, Graphic Organizer, Pictorial Representation, Graph, Algebraic Formula} Derive the Equation of a Line Step 1: Have students direct their attention to Step 1 on S187. Partner A, explain how we can complete the table. (Substitute the x-value into the function to arrive at an output value, y.) Partner B, if we substitute - 2 in for x, what is our result? Explain your thinking. [3( - 2) = - 6] Have students complete the table by substituting in the x-values in the equation y = 3x. Review the answers in the table as a class. Step 2: Direct students to Step 2. Have student pairs discuss how to plot the line in Step 2. (Graph the line by plotting the points we created.) Partner A, how do we identify the points from the table? (Use the x-coordinate and the y-coordinate to create five ordered pairs.) Have students plot the points from Step 1 and then review what the graph should look like as a class. Step 3: Direct students to Step 3. Partner A, what is Step 3 asking us to find? (the rise over the run, or the slope)
4 T382 Mathematics Success Grade 8 Partner B, what is one way that we can find the rise over the run? (We can count the vertical and horizontal distance between two points on the graph and write the values as a ratio of rise over run.) Partner A, what is another way we can find the rise over the run? (We can use two points by subtracting their y-coordinates and subtracting their x-coordinates.) Have students use one of the methods to complete Step 3. *Teacher Note: The solution provided uses two points to find the rise over the run, but the rise and run are marked on the graph. Step 4: Direct students to Step 4. Partner B, what is Step 4 asking us to find? (where the graph crosses the y-axis) Give students a moment to identify where their graphs cross the y-axis. [(0, 0)] Partner A, what is the second part of Step 4 asking us to find? (the y-intercept) Have student pairs discuss their ideas about the meaning of the y-intercept. Partner B, what does intercept sound like? (intersect) Partner A, what do you predict a y-intercept is? (a place where the graph intersects the y-axis) Partner B, what is the y-intercept (b)? Explain your thinking. (Zero, because this is the point where the line crosses the y-axis.) According to the last question, what other notation can we use to describe a y-intercept? (b) Step 5: Direct students to Part B on the bottom of S187. Complete the table, graph, slope and y-intercept questions for Part B using the questioning from Steps 1 4. Have students work in pairs to complete Part C and Part D on S188. After students have completed the table, graph, slope and y-intercept questions for both problems, review the answers as a whole group. Step 6: Direct students to look at the chart on the top of S189. Ask students to work together to complete the table at the top. Students will copy their solutions from Parts A D into the table. Step 7: Direct students to the Slope organizer. Partner A, which step did we use to find the slope? (Step 3) Partner B, which step did we use to find the y-intercept? (Step 4) Partner A, what do you notice about the slopes for Parts A and B? (They are the same; they are both 3.)
5 Mathematics Success Grade 8 T383 Partner B, what do you notice about the slopes for Parts C and D? (They are the same; they are both - 2.) Partner A, what do you notice about the equations for Parts A and B? (They both have a 3 as a coefficient for x, the independent variable.) Partner B, what do you notice about the equations for Parts C and D? (They both have a - 2 as a coefficient for x, the independent variable.) What can you conclude about the slope within an equation of a line? (The slope will be the coefficient of the x, or the independent variable.) Step 8: Direct students to the y-intercept organizer. Partner A, what do you notice about the y-intercepts for Parts A and C? (They are the same; they are both 0.) Partner B, what do you notice about the y-intercepts for Parts B and D? (Part B s is 1 and Part D s is - 3.) Partner A, what do you notice about the equations for Parts A and C? (They do not have anything added to or subtracted from x.) Partner B, what do you notice about the equations for Parts B and D? (Part B has 1 added to x and Part D has 3 subtracted from x.) What can you conclude about the y-intercept within an equation of a line? (The y-intercept will be added to or subtracted from x.) Identifying Slope and y-intercepts to Write Equations (M, GP, CP, IP, WG) S190 (Answers on T396.) M, GP, CP, WG: Students will derive the general equation for a line. After developing that concept, students will be able to identify the slope and y-intercept from an equation. Additionally, they will be given slopes and y-intercepts and will be asked to write the related equation. Be sure students know their roles as Partner A and Partner B. {Algebraic Formula, Verbal Description, Graphic Organizer} Identifying Slope and y-intercepts to Write Equations Step 1: Have students discuss Questions 1 and 2. Partner B, based on the conclusions we made on S189, what is a general equation that can be used for the equation of a line? (y = mx + b or y = mx) Partner A, what does the x represent? (the independent variable) Partner B, what does the y represent? (the dependent variable)
6 T384 Mathematics Success Grade 8 Partner A, what does the m represent? (the slope of the equation) Partner B, what does the b represent? (the y-intercept of the equation) *Teacher Note: If the y-intercept is 0, the equation of the line will be y=mx. Step 2: Direct students attention to the first table on S190. Partner A, what are we asked to find in this activity? (the slope and y-intercept for each equation) Have partners look at Question 3. Partner B, where is the slope located? (It is the coefficient of x. It is 2.) Partner A, where is the y-intercept located? (It is added to or subtracted from the x. It is - 5.) Step 3: Direct students to Question 6. Partner A, what is different about this equation? (There is not an x in the equation.) Partner B, what is the coefficient of x: (0) Explain. (Zero times the x is equal to zero.) Partner A, what is the slope of this line? (0) Partner B, what is the y-intercept? (9) Step 4: Direct students to Question 7. Partner A, what is different about this equation? (The equation is not in y = mx + b form.) Partner B, where is the slope always located? (It is always the coefficient of the independent variable.) What is the slope? ( - 3) Partner A, what is the y-intercept? (6) Step 5: Direct students attention to the second table on S190. Partner B, what are we asked to find in this activity? (the equation of the line) Have students look at Question 9. Partner B, what does the m represent? (slope) Partner A, where is the slope located? (It is the coefficient of x.) Partner B, what does the b represent? (y-intercept) Partner B, where is the y-intercept located? (It is added to or subtracted from the x.) Partner A, how can we write the equation for this line? (y = 5x + 4) IP, CP, WG: Students will complete both of the tables. Remind students that they derived the general form of an equation of a line in Question 1 and they may refer to that as they complete the tables. Take a few moments to review student solutions as a whole group. {Algebraic Formula, Verbal Description, Graphic Organizer}
7 Mathematics Success Grade 8 T385 Equations for Horizontal and Vertical Lines (M, GP, CP, WG) S191 (Answers on T397.) M, GP, CP, WG: Students will explore more with equations by looking at equations for horizontal and vertical lines. Be sure students know their role as Partner A and Partner B. {Verbal Description, Pictorial Representation, Graph, Algebraic Formula} Equations for Horizontal and Vertical Lines Step 1: Have students name the four points on the line for the first graph. [(0, 4), (1, 4), ( - 2, 4), (3, 4)] Partner A, how are the points similar? (The y-coordinates are all 4.) Choose two coordinates and find the slope. [Example uses (0, 4) and (1, 4), The slope is 0.] Partner B, what is the y-intercept of the line? (4) What is the equation of the line? (y = 0x + 4, or y = 4) This is a (horizontal) line. Have student pairs draw another horizontal line anywhere on the graph and select two points on that line to determine the slope. Have student pairs share the y-intercept of their line and the slope. What is the slope of any of the horizontal lines? (The slope of all (horizontal) lines is zero slope.) Have students discuss what it means that the slope is zero. (When the slope is positive the line goes up from left to right and when the slope it negative it goes down from left to right. When a line is horizontal is does not go up or down, so the value of the slope is zero.) The equation of all (horizontal) lines is in the form (y = a number). Step 2: Have students name the four points on the line for the second graph. [(1, 3), (1, 2), (1, 1), (1, 0)] Partner B, how are the points similar? (The x-coordinates are all 1.) Choose two coordinates and find the slope. [Example uses (1, 1) and (1, 0), The slope is undefined because we are dividing by 0.] Partner A, what is the y-intercept of the line? (There is no y-intercept; the line does not cross the y-axis.) What is the equation of the line? (x = 1) This is a (vertical) line. Have student pairs draw another vertical line anywhere on the graph and select two points on that line to determine the slope. Have student pairs share the equation of their lines. (The slope is undefined because we are dividing by 0.)
8 T386 Mathematics Success Grade 8 The slope of all (vertical) lines is (undefined). Have students discuss what it means that the slope is undefined. (When the slope is positive the line goes up from left to right and when the slope is negative it goes down from left to right. A vertical line has an undefined slope because all points on the line have the same x-coordinate. As a result the formula used for slope has a denominator of 0, which makes the slope undefined.) The equation of all (vertical) lines is in the form (x = a number). Using a Graph to Write the Equation of a Line (M, GP, CP, IP, WG) S192 (Answers on T398.) M, GP, CP, WG: Students will expand their knowledge of equations and lines by using a graph to identify the slope and y-intercept, then use this information to write the equation of a line. Be sure students know their roles as Partner A and Partner B. {Verbal Description, Pictorial Representation, Graphic Organizer, Graph, Algebraic Formula} Using a Graph to Write the Equation of a Line Step 1: Direct students attention to S192. Have students take a look at the top left box. Partner A, what two pieces of information do we need to write the equation of a line? (the slope and the y-intercept) Partner B, how can we quickly identify the y-intercept? Explain your answer. (We can find where the graph intersects the y-axis.) Partner A, what is the y-intercept? Justify your thinking. (2; This is where the line crosses the y-axis.) Partner A, how can we find the slope of the line? (Identify another point on the line and use the rise over run method.) Partner B, what is the additional point that we can identify on the line? [(1, 4)] Partner A, what is the rise from the y-intercept to (1, 4)? (2) Partner B, what is the run from the y-intercept to (1, 4)? (1) What is the slope of the line? (2 over 1 which simplifies to 2) Have partners discuss how they can write the equation of the line using the slope and y-intercept. (y = mx +b) Substitute in the values and write the equation. (y = 2x + 2) Step 2: Direct students attention to the top right box on S192. Partner B, what two pieces of information do we need to write the equation of a line? (the slope and the y-intercept)
9 Mathematics Success Grade 8 T387 Partner A, how can we quickly identify the y-intercept? (We can find where the graph intersects the y-axis.) Partner B, what is the y-intercept? ( - 3) Partner B, how can we find the slope of the line? (Identify another point on the line and use the rise over the run method.) Partner A, what is the additional point that we can identify on the line? [(4, - 2)] Partner B, what is the rise from the y-intercept to (4, - 2)? (1) Partner A, what is the run from the y-intercept to (4, - 2)? (4) What is the slope of the line? ( 1 4 ) When we substitute in your values for slope and the y-intercept, what is our equation? (y = 1 x 3) 4 IP, CP, WG: Students will complete the bottom two sections on S192. They will continue to write equations for the lines that are graphed. Take a moment to review the solutions with students and be sure they understand how to translate the graph of a line to an equation. {Graphic Organizer, Pictorial Representation, Algebraic Formula, Graph} Using an Equation to Graph a Line (M, GP, CP, IP, WG) S193, S194 (Answers on T399, T400.) M, GP, CP, WG: Students will complete this section to learn how to translate from an equation to a graph. Encourage students to work backward from the previous section as they think about this activity. Be sure students know their roles as Partner A and Partner B. {Verbal Description, Pictorial Representation, Graphic Organizer, Algebraic Formula, Graph} Using an Equation to Graph a Line Step 1: Direct students attention to S193. Partner B, what is the slope of the equation? (5) Explain your answer. (It is the coefficient of x.) Partner A, what is the y-intercept of the equation? (1) Defend your answer. (It is added to x.) Partner B, what does the y-intercept tell us? (It tells us the point where the graph crosses the y-axis.) Partner A, what is the ordered pair for the y-intercept? [(0, 1)] Plot the point. Partner B, what does the slope tell us? (It tells the rise over run to use to get to the next point on the line.)
10 T388 Mathematics Success Grade 8 Partner A, is there a way we can write 5 in the form of rise over run? (Yes, 5 over 1.) Partner B, what does the 5 tell us to do? (Rise 5 units.) Have students place their pencils on the y-intercept and from there, count up 5 units. Partner A, what does the 1 tell us to do? (Move 1 unit to the right.) Have students drag their pencils one unit to the right and plot a point there. If we want to continue the line to the left, what movement should we use starting from the y-intercept? (Move 5 units down and one unit to the left.) Have students plot a point here. Connect the points and graph the line. Step 2: Direct students attention to the bottom of S193. Take a look at the second equation. Let s analyze this equation before we begin starting to graph. Have students make predictions of what they think the line will look like. Partner A, what is the slope of the equation? (0) How do you know? (There is no x in the equation.) Partner B, what is the y-intercept of the equation? ( - 3) How do you know? (It is the constant number that would be added to x if we write the slope as 0x.) Partner A, what does the y-intercept tell us? (It tells us the point where the graph crosses the y-axis.) Partner B, what is the ordered pair for the y-intercept? [(0, - 3)] Plot the point. Partner A, what does the slope tell us? (It tells the rate, or the rise over the run, to use to get to the next point on the line.) Partner B, is there a way we can write 0 in the form of rise over run? (Yes, 0 over 1.) Partner A, what does the 0 tell us to do? (We do not need to move up or down to get to the next point.) Partner B, what does the 1 tell us to do? (Move 1 unit to the right.) Have students drag their pencils one unit to the right and plot a point there. If we want to continue the line to the left, what movement should we use starting from the y-intercept? (Move one unit to the left.) Have students plot a point here. Connect the points and graph the line. Students should identify this line as a horizontal line.
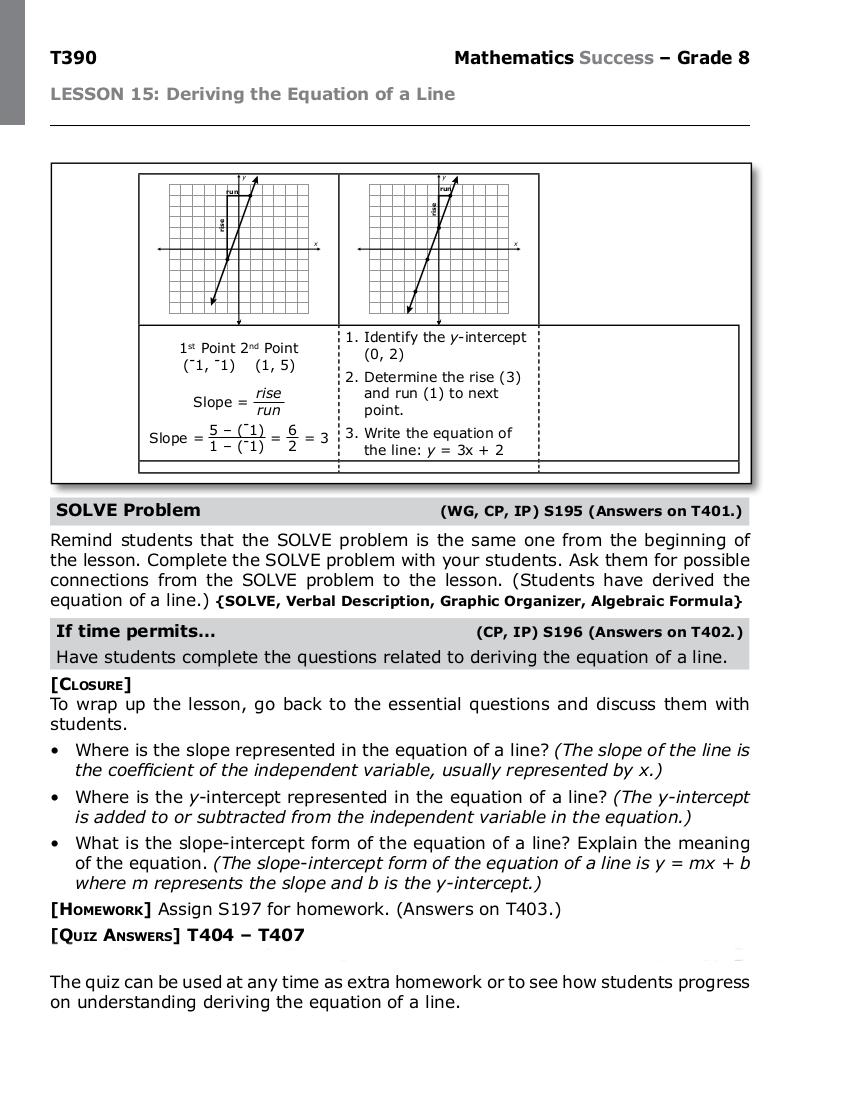
11 Mathematics Success Grade 8 T389 IP, CP, WG: Students will complete S194 with a partner. They will continue to graph lines from the given equation. Take a moment to review the solutions with students and be sure they understand how to translate the equation of a line to a graph of the line. {Verbal Description, Graphic Organizer, Pictorial Representationm, Algebraic Formula, Graph} Foldable (WG, GP, M) Give each student one piece of colored paper. Use the following instructions to create a foldable for Slope and Writing the Equation of a Line. {Verbal Description, Graphic Organizer, Graph, Algebraic Formula} Foldable Step 1: Model for students as they create the foldable. Have students put the paper flat on the desk, horizontally. Fold the top down so that the top flap is a little shorter than the bottom flap. Step 2: Fold the paper from left to right into thirds. Cut along the dotted lines on the top flap only to make three sections. On the first section on the left write, Slope. On the second flap write, Deriving the Equation of a Line. Slope Deriving the Equation of a Line Step 3: Lift the first flap and examine the graph. Write the steps for determining the slope of a line using the rise over the run. Lift the second flap and write the directions for determining the y-intercept and the slope of the line. Use that information to write the equation of the line. run run rise rise
12
Mathematics Success Level H
 Mathematics Success Level H T473 [OBJECTIVE] The student will graph a line given the slope and y-intercept. [MATERIALS] Student pages S160 S169 Transparencies T484, T486, T488, T490, T492, T494, T496 Wall-size
Algebra Success. LESSON 14: Discovering y = mx + b
 T282 Algebra Success [OBJECTIVE] The student will determine the slope and y-intercept of a line by examining the equation for the line written in slope-intercept form. [MATERIALS] Student pages S7 S Transparencies
Algebra Success. [MULTIPLE REPRESENTATIONS] SOLVE, Verbal Description, Algebraic Formula, Concrete Representation, Pictorial Representation
![Algebra Success. [MULTIPLE REPRESENTATIONS] SOLVE, Verbal Description, Algebraic Formula, Concrete Representation, Pictorial Representation](/thumbs/93/112561762.jpg "Algebra Success. [MULTIPLE REPRESENTATIONS] SOLVE, Verbal Description, Algebraic Formula, Concrete Representation, Pictorial Representation") T755 [OBJECTIVE] The student will learn how to multiply polynomials. [MATERIALS] Student pages S289 S297 Transparencies T765, T767, T769, T771, T773, T775 [ESSENTIAL QUESTIONS] 1. When multiplying polynomials,
T755 [OBJECTIVE] The student will learn how to multiply polynomials. [MATERIALS] Student pages S289 S297 Transparencies T765, T767, T769, T771, T773, T775 [ESSENTIAL QUESTIONS] 1. When multiplying polynomials,
Unit 3: Writing Equations Chapter Review
 Unit 3: Writing Equations Chapter Review Part 1: Writing Equations in Slope Intercept Form. (Lesson 1) 1. Write an equation that represents the line on the graph. 2. Write an equation that has a slope
Section 4.3 Objectives
 CHAPTER ~ Linear Equations in Two Variables Section Equation of a Line Section Objectives Write the equation of a line given its graph Write the equation of a line given its slope and y-intercept Write
Section 7C Finding the Equation of a Line
 Section 7C Finding the Equation of a Line When we discover a linear relationship between two variables, we often try to discover a formula that relates the two variables and allows us to use one variable
Graphing Equations Chapter Test Review
 Graphing Equations Chapter Test Review Part 1: Calculate the slope of the following lines: (Lesson 3) Unit 2: Graphing Equations 2. Find the slope of a line that has a 3. Find the slope of the line that
Review Exercise Set 13. Find the slope and the equation of the line in the following graph. If the slope is undefined, then indicate it as such.
 Review Exercise Set 13 Exercise 1: Find the slope and the equation of the line in the following graph. If the slope is undefined, then indicate it as such. Exercise 2: Write a linear function that can
4.1 Write Linear Equations by Using a Tables of Values
 4.1 Write Linear Equations by Using a Tables of Values Review: Write y = mx + b by finding the slope and y-intercept m = b = y = x + Every time x changes units, y changes units m = b = y = x + Every time
b) According to the statistics above the graph, the slope is What are the units and meaning of this value?
 According to the statistics above the graph, the slope is What are the units and meaning of this value?") ! Name: Date: Hr: LINEAR MODELS Writing Motion Equations 1) Answer the following questions using the position vs. time graph of a runner in a race shown below. Be sure to show all work (formula, substitution,
! Name: Date: Hr: LINEAR MODELS Writing Motion Equations 1) Answer the following questions using the position vs. time graph of a runner in a race shown below. Be sure to show all work (formula, substitution,
Section 1.4: Slope-Intercept Form
 Section 1.4: Slope-Intercept Form Objective: Give the equation of a line with a known slope and y-intercept. When graphing a line we found one method we could use is to make a table of values. However,
Equations. Krista Hauri I2T2 Project
 Applied Linear Equations Krista Hauri I2T2 Project Grade Level: 9 th Intergraded Algebra 1 Time Span : 5 (40 minute) days Tools: Calculator Base Ranger (CBR) at least 4 TI-84 Graphing Calculator for each
Simplifying and Graphing Rational Functions
 Algebra 2/Trig Unit 5 Notes Packet Name: Period: # Simplifying and Graphing Rational Functions 1. Pg 543 #11-19 odd and Pg 550 #11-19 odd 2. Pg 543 #12-18 even and Pg 550 #12-18 even 3. Worksheet 4. Worksheet
1. You are given two pairs of coordinates that have a linear relationship. The two pairs of coordinates are (x, y) = (30, 70) and (20, 50).
 = (30, 70) and (20, 50).") Economics 102 Fall 2017 Answers to Homework #1 Due 9/26/2017 Directions: The homework will be collected in a box before the lecture. Please place your name, TA name and section number on top of the homework
Economics 102 Fall 2017 Answers to Homework #1 Due 9/26/2017 Directions: The homework will be collected in a box before the lecture. Please place your name, TA name and section number on top of the homework
f x f x f x f x x 5 3 y-intercept: y-intercept: y-intercept: y-intercept: y-intercept of a linear function written in function notation
 Questions/ Main Ideas: Algebra Notes TOPIC: Function Translations and y-intercepts Name: Period: Date: What is the y-intercept of a graph? The four s given below are written in notation. For each one,
Math Performance Task Teacher Instructions
 Math Performance Task Teacher Instructions Stock Market Research Instructions for the Teacher The Stock Market Research performance task centers around the concepts of linear and exponential functions.
CH 39 CREATING THE EQUATION OF A LINE
 9 CH 9 CREATING THE EQUATION OF A LINE Introduction S ome chapters back we played around with straight lines. We graphed a few, and we learned how to find their intercepts and slopes. Now we re ready to
5.2E Lesson: Proportions in Tables and Graphs*
 5.2E Lesson: Proportions in Tables and Graphs* Name: Period: 1. Use Graph A below to fill in the table relating calories to snacks. Number Number of Ordered Write a complete sentence describing the meaning
LINES AND SLOPES. Required concepts for the courses : Micro economic analysis, Managerial economy.
 LINES AND SLOPES Summary 1. Elements of a line equation... 1 2. How to obtain a straight line equation... 2 3. Microeconomic applications... 3 3.1. Demand curve... 3 3.2. Elasticity problems... 7 4. Exercises...
Topic #1: Evaluating and Simplifying Algebraic Expressions
 John Jay College of Criminal Justice The City University of New York Department of Mathematics and Computer Science MAT 105 - College Algebra Departmental Final Examination Review Topic #1: Evaluating
3.3 rates and slope intercept form ink.notebook. October 23, page 103. page 104. page Rates and Slope Intercept Form
 3.3 rates and slope intercept form ink.notebook page 103 page 104 page 102 3.3 Rates and Slope Intercept Form Lesson Objectives 3.3 Rates and Slope-Intercept Form Press the tabs to view details. Standards
Math Released Item Grade 8. Slope Intercept Form VH049778
 Math Released Item 2018 Grade 8 Slope Intercept Form VH049778 Anchor Set A1 A8 With Annotations Prompt Score Description VH049778 Rubric 3 Student response includes the following 3 elements. Computation
Chap3a Introduction to Exponential Functions. Y = 2x + 4 Linear Increasing Slope = 2 y-intercept = (0,4) f(x) = 3(2) x
 f(x) = 3(2) x") Name Date HW Packet Lesson 3 Introduction to Exponential Functions HW Problem 1 In this problem, we look at the characteristics of Linear and Exponential Functions. Complete the table below. Function If
Name Date HW Packet Lesson 3 Introduction to Exponential Functions HW Problem 1 In this problem, we look at the characteristics of Linear and Exponential Functions. Complete the table below. Function If
A C E. Answers Investigation 4. Applications. x y y
 Answers Applications 1. a. No; 2 5 = 0.4, which is less than 0.45. c. Answers will vary. Sample answer: 12. slope = 3; y-intercept can be found by counting back in the table: (0, 5); equation: y = 3x 5
Finding the Equation from a Slope and y-intercept
 Lesson 4.4 Objectives Write linear equations given a slope and y-intercept, a slope and a point, or a graph. Writing Linear Equations Michael turns on the high-temperature oven each morning when he comes
Applications of Exponential Functions Group Activity 7 Business Project Week #10
 Applications of Exponential Functions Group Activity 7 Business Project Week #10 In the last activity we looked at exponential functions. This week we will look at exponential functions as related to interest
Piecewise-Defined Functions
 The Right Stuff: Appropriate Mathematics for All Students Promoting materials that engage students in meaningful activities, promote the effective use of technology to support the mathematics, further
par ( 12). His closest competitor, Ernie Els, finished 3 strokes over par (+3). What was the margin of victory?
. His closest competitor, Ernie Els, finished 3 strokes over par (+3). What was the margin of victory?") Exam Name MULTIPLE CHOICE. Choose the one alternative that best completes the statement or answers the question. 1) Tiger Woods won the 000 U.S. Open golf tournament with a score of 1 strokes under par
Exam Name MULTIPLE CHOICE. Choose the one alternative that best completes the statement or answers the question. 1) Tiger Woods won the 000 U.S. Open golf tournament with a score of 1 strokes under par
Question 3: How do you find the relative extrema of a function?
 Question 3: How do you find the relative extrema of a function? The strategy for tracking the sign of the derivative is useful for more than determining where a function is increasing or decreasing. It
r 1. Discuss the meaning of compounding using the formula A= A0 1+
 Money and the Exponential Function Goals: x 1. Write and graph exponential functions of the form f ( x) = a b (3.15) 2. Use exponential equations to solve problems. Solve by graphing, substitution. (3.17)
Slope-Intercept Form Practice True False Questions Indicate True or False for the following Statements.
 www.ck2.org Slope-Intercept Form Practice True False Questions Indicate True or False for the following Statements.. The slope-intercept form of the linear equation makes it easier to graph because the
Foundational Preliminaries: Answers to Within-Chapter-Exercises
 C H A P T E R 0 Foundational Preliminaries: Answers to Within-Chapter-Exercises 0A Answers for Section A: Graphical Preliminaries Exercise 0A.1 Consider the set [0,1) which includes the point 0, all the
Professor Christina Romer SUGGESTED ANSWERS TO PROBLEM SET 5
 Economics 2 Spring 2017 Professor Christina Romer Professor David Romer SUGGESTED ANSWERS TO PROBLEM SET 5 1. The tool we use to analyze the determination of the normal real interest rate and normal investment
Name For those going into. Algebra 1 Honors. School years that begin with an ODD year: do the odds
 Name For those going into LESSON 2.1 Study Guide For use with pages 64 70 Algebra 1 Honors GOAL: Graph and compare positive and negative numbers Date Natural numbers are the numbers 1,2,3, Natural numbers
Use Scantron 882E to transfer the answers. MULTIPLE CHOICE. Choose the one alternative that best completes the statement or answers the question.
 HW Date: Name Use Scantron 88E to transfer the answers. MULTIPLE CHOICE. Choose the one alternative that best completes the statement or answers the question. The graph shows sales in thousands of dollars
Buying A Car. Mathematics Capstone Course
 Buying A Car Mathematics Capstone Course I. UNIT OVERVIEW & PURPOSE: In this lesson the student will be asked to search the Internet and find a car that he/she would like to purchase. The student will
5.2 Partial Variation
 5.2 Partial Variation Definition: A relationship between two variables in which the dependent variable is the sum of a number and a constant multiple of the independent variable. Notice: If we take the
Comparing Investments
 Lesson 37 Mathematics Assessment Project Formative Assessment Lesson Materials Comparing Investments MARS Shell Center University of Nottingham & UC Berkeley Alpha Version Please Note: These materials
The Zero Product Law. Standards:
 Objective: Students will be able to (SWBAT) use complex numbers in polynomial identities and equations, in order to (IOT) solve quadratic equations with real coefficient that have complex solutions. Standards:
dollars per person; the cost is $45 for each person. dollars per person; the cost is $1 for 225 people.
 Name: ate: 1 The table shows the cost of a vacation package for a given number of people. The rate of change is constant in the table. Find the rate of change. Explain what the rate of change means for
GRAPHS IN ECONOMICS. Appendix. Key Concepts. Graphing Data
 Appendix GRAPHS IN ECONOMICS Key Concepts Graphing Data Graphs represent quantity as a distance on a line. On a graph, the horizontal scale line is the x-axis, the vertical scale line is the y-axis, and
4.3 The money-making machine.
 . The money-making machine. You have access to a magical money making machine. You can put in any amount of money you want, between and $, and pull the big brass handle, and some payoff will come pouring
Math 116: Business Calculus
 Math 116: Business Calculus Instructor: Colin Clark Spring 2017 Exam 1 - Thursday February 9. 1.1 Slopes and Equations of Lines. 1.2 Linear Functions and Applications. 2.1 Properties of Functions. 2.2
Prentice Hall Connected Mathematics 2, 7th Grade Units 2009 Correlated to: Minnesota K-12 Academic Standards in Mathematics, 9/2008 (Grade 7)
") 7.1.1.1 Know that every rational number can be written as the ratio of two integers or as a terminating or repeating decimal. Recognize that π is not rational, but that it can be approximated by rational
7.1.1.1 Know that every rational number can be written as the ratio of two integers or as a terminating or repeating decimal. Recognize that π is not rational, but that it can be approximated by rational
(i.e. the rate of change of y with respect to x)
") Section 1.3 - Linear Functions and Math Models Example 1: Questions we d like to answer: 1. What is the slope of the line? 2. What is the equation of the line? 3. What is the y-intercept? 4. What is the
Section 1.3 - Linear Functions and Math Models Example 1: Questions we d like to answer: 1. What is the slope of the line? 2. What is the equation of the line? 3. What is the y-intercept? 4. What is the
2) Endpoints of a diameter (-1, 6), (9, -2) A) (x - 2)2 + (y - 4)2 = 41 B) (x - 4)2 + (y - 2)2 = 41 C) (x - 4)2 + y2 = 16 D) x2 + (y - 2)2 = 25
 Endpoints of a diameter (-1, 6), (9, -2) A) (x - 2)2 + (y - 4)2 = 41 B) (x - 4)2 + (y - 2)2 = 41 C) (x - 4)2 + y2 = 16 D) x2 + (y - 2)2 = 25") Math 101 Final Exam Review Revised FA17 (through section 5.6) The following problems are provided for additional practice in preparation for the Final Exam. You should not, however, rely solely upon these
Math 101 Final Exam Review Revised FA17 (through section 5.6) The following problems are provided for additional practice in preparation for the Final Exam. You should not, however, rely solely upon these
notebook October 08, What are the x and y intercepts? (write your answers as coordinates).
.") 3.4 Opening Activity: Draw a graph of the equation y = 5x + 20 What are the x and y intercepts? (write your answers as coordinates). How are you able to use the equation but NOT the graph to find the x
3.4 Opening Activity: Draw a graph of the equation y = 5x + 20 What are the x and y intercepts? (write your answers as coordinates). How are you able to use the equation but NOT the graph to find the x
Chapter 4 Factoring and Quadratic Equations
 Chapter 4 Factoring and Quadratic Equations Lesson 1: Factoring by GCF, DOTS, and Case I Lesson : Factoring by Grouping & Case II Lesson 3: Factoring by Sum and Difference of Perfect Cubes Lesson 4: Solving
* The Unlimited Plan costs $100 per month for as many minutes as you care to use.
 Problem: You walk into the new Herizon Wireless store, which just opened in the mall. They offer two different plans for voice (the data and text plans are separate): * The Unlimited Plan costs $100 per
Economics 307: Intermediate Macroeconomic Theory A Brief Mathematical Primer
 Economics 07: Intermediate Macroeconomic Theory A Brief Mathematical Primer Calculus: Much of economics is based upon mathematical models that attempt to describe various economic relationships. You have
Linear Modeling Business 5 Supply and Demand
 Linear Modeling Business 5 Supply and Demand Supply and demand is a fundamental concept in business. Demand looks at the Quantity (Q) of a product that will be sold with respect to the Price (P) the product
A. B. C. D. Graphing Quadratics Practice Quiz. Question 1. Select the graph of the quadratic function. f (x ) = 2x 2. 2/26/2018 Print Assignment
 = 2x 2. 2/26/2018 Print Assignment") Question 1. Select the graph of the quadratic function. f (x ) = 2x 2 C. D. https://my.hrw.com/wwtb2/viewer/printall_vs23.html?umk5tfdnj31tcldd29v4nnzkclztk3w8q6wgvr2629ca0a5fsymn1tfv8j1vs4qotwclvofjr8uon4cldd29v4
Question 1. Select the graph of the quadratic function. f (x ) = 2x 2 C. D. https://my.hrw.com/wwtb2/viewer/printall_vs23.html?umk5tfdnj31tcldd29v4nnzkclztk3w8q6wgvr2629ca0a5fsymn1tfv8j1vs4qotwclvofjr8uon4cldd29v4
Section Linear Functions and Math Models
 Section 1.1 - Linear Functions and Math Models Lines: Four basic things to know 1. The slope of the line 2. The equation of the line 3. The x-intercept 4. The y-intercept 1. Slope: If (x 1, y 1 ) and (x
Algebra 1 Predicting Patterns & Examining Experiments
 We will explicitly define slope-intercept form. We have already examined slope, y- intercepts, and graphing from tables, now we are putting all of that together. This lesson focuses more upon the notation
How Wealthy Are Europeans?
 How Wealthy Are Europeans? Grades: 7, 8, 11, 12 (course specific) Description: Organization of data of to examine measures of spread and measures of central tendency in examination of Gross Domestic Product
Algebra Review (New Version) Homework Problems
 Homework Problems") MATH 119 Algebra Review (New Version) Homework Problems The following set is only to review the Algebra needed for this class. It should be familiar to you from previous class such as M110, M111 or others.
MATH 119 Algebra Review (New Version) Homework Problems The following set is only to review the Algebra needed for this class. It should be familiar to you from previous class such as M110, M111 or others.
Representing Linear Functions. Constant Rate of Change and Direct Variation. Writing Linear Equations
 Lesson 7-1 Lesson 7-2 Lesson 7-3 Lesson 7-4 Lesson 7-5 Lesson 7-6 Lesson 7-7 Lesson 7-8 Functions Representing Linear Functions Rate of Change Constant Rate of Change and Direct Variation Slope Slope-Intercept
A warm up to review identifying proportional and non-proportional relationships from tables and graphs would give students entry to the activity.
 1 Interpreting Slopes and Y-Intercepts of Proportional and Non-Proportional Relationships Task 1: Investigating Proportional and Non-Proportional Relationships Framework Cluster Standard(s) Materials/Links
rise m x run The slope is a ratio of how y changes as x changes: Lines and Linear Modeling POINT-SLOPE form: y y1 m( x
 Chapter 1 Notes 1 (c) Epstein, 013 Chapter 1 Notes (c) Epstein, 013 Chapter1: Lines and Linear Modeling POINT-SLOPE form: y y1 m( x x1) 1.1 The Cartesian Coordinate System A properly laeled set of axes
Lesson 2.6 Creating and Graphing Linear Equations in Two Variables
 Lesson 2.6 Creating and Graphing Linear Equations in Two Variables Concept: Graphing Linear Equations EQ: How do I create and graph a linear equation in two variables from a word problem? (Standard CED.2)
BOSTON UNIVERSITY SCHOOL OF MANAGEMENT. Math Notes
 BOSTON UNIVERSITY SCHOOL OF MANAGEMENT Math Notes BU Note # 222-1 This note was prepared by Professor Michael Salinger and revised by Professor Shulamit Kahn. 1 I. Introduction This note discusses the
Multiplying and Dividing Rational Expressions
 COMMON CORE 4 Locker LESSON 9. Multiplying and Dividing Rational Expressions Name Class Date 9. Multiplying and Dividing Rational Expressions Essential Question: How can you multiply and divide rational
FINITE MATH LECTURE NOTES. c Janice Epstein 1998, 1999, 2000 All rights reserved.
 FINITE MATH LECTURE NOTES c Janice Epstein 1998, 1999, 2000 All rights reserved. August 27, 2001 Chapter 1 Straight Lines and Linear Functions In this chapter we will learn about lines - how to draw them
Extra Practice Chapter 6
 Extra Practice Chapter 6 Topics Include: Equation of a Line y = mx + b & Ax + By + C = 0 Graphing from Equations Parallel & Perpendicular Find an Equation given Solving Systems of Equations 6. - Practice:
Lecture Notes 1 Part B: Functions and Graphs of Functions
 Lecture Notes 1 Part B: Functions and Graphs of Functions In Part A of Lecture Notes #1 we saw man examples of functions as well as their associated graphs. These functions were the equations that gave
BARUCH COLLEGE MATH 2003 SPRING 2006 MANUAL FOR THE UNIFORM FINAL EXAMINATION
 BARUCH COLLEGE MATH 003 SPRING 006 MANUAL FOR THE UNIFORM FINAL EXAMINATION The final examination for Math 003 will consist of two parts. Part I: Part II: This part will consist of 5 questions similar
Before How can lines on a graph show the effect of interest rates on savings accounts?
 Compound Interest LAUNCH (7 MIN) Before How can lines on a graph show the effect of interest rates on savings accounts? During How can you tell what the graph of simple interest looks like? After What
Final Project. College Algebra. Upon successful completion of this course, the student will be able to:
 COURSE OBJECTIVES Upon successful completion of this course, the student will be able to: 1. Perform operations on algebraic expressions 2. Perform operations on functions expressed in standard function
SPIRIT 2.0 Lesson: Am I Straight?
 SPIRIT 2.0 Lesson: Am I Straight? ===============================Lesson Header ============================== Lesson Title: Am I Straight? Draft Date: July 21, 2008 1st Author (Writer): Neil Hammond 2nd
Economics 101 Fall 2018 Answers to Homework #1 Due Thursday, September 27, Directions:
 Economics 101 Fall 2018 Answers to Homework #1 Due Thursday, September 27, 2018 Directions: The homework will be collected in a box labeled with your TA s name before the lecture. Please place your name,
Exploring Slope. High Ratio Mountain Lesson 11-1 Linear Equations and Slope
 Eploring Slope High Ratio Mountain Lesson 11-1 Learning Targets: Understand the concept of slope as the ratio points on a line. between any two Graph proportional relationships; interpret the slope and
1 algebraic. expression. at least one operation. Any letter can be used as a variable. 2 + n. combination of numbers and variables
 1 algebraic expression at least one operation 2 + n r w q Any letter can be used as a variable. combination of numbers and variables DEFINE: A group of numbers, symbols, and variables that represent an
6.3 Comparing Functions
 ? LESSN 6.3 Comparing Functions ESSENTIAL QUESTIN How can you use tables, graphs, and equations to compare functions? Proportionality 8.5.I Write an equation in the form y = mx + b to model a linear relationship
So far in the short-run analysis we have ignored the wage and price (we assume they are fixed).
.") Chapter 6: Labor Market So far in the short-run analysis we have ignored the wage and price (we assume they are fixed). Key idea: In the medium run, rising GD will lead to lower unemployment rate (more
Chapter 6: Labor Market So far in the short-run analysis we have ignored the wage and price (we assume they are fixed). Key idea: In the medium run, rising GD will lead to lower unemployment rate (more
SJAM MPM 1D Unit 5 Day 13
 Homework 1. Identify the dependent variable. a) The distance a person walks depends on the time they walk. b) The recipe for 1 muffins requires cups of flour. c) Houses need 1 fire alarm per floor.. Identify
Week 19 Algebra 2 Assignment:
 Week 9 Algebra Assignment: Day : pp. 66-67 #- odd, omit #, 7 Day : pp. 66-67 #- even, omit #8 Day : pp. 7-7 #- odd Day 4: pp. 7-7 #-4 even Day : pp. 77-79 #- odd, 7 Notes on Assignment: Pages 66-67: General
GOOD LUCK! 2. a b c d e 12. a b c d e. 3. a b c d e 13. a b c d e. 4. a b c d e 14. a b c d e. 5. a b c d e 15. a b c d e. 6. a b c d e 16.
 MA109 College Algebra Spring 2017 Exam2 2017-03-08 Name: Sec.: Do not remove this answer page you will turn in the entire exam. You have two hours to do this exam. No books or notes may be used. You may
review 4.notebook March 20, 2014
 Review 4 Extreme Values Points of Inflection Justifying Pulling info from a chart Mapping f, f, f Tying it all together How do you determine when a function has a max? The first derivative changes from
Student Activity: Show Me the Money!
 1.2 The Y-Intercept: Student Activity Student Activity: Show Me the Money! Overview: Objective: Terms: Materials: Procedures: Students connect recursive operations with graphs. Algebra I TEKS b.3.b Given
CH 3 P4 as of ink
 1 2 3 4 5 Ron has a player s card for the arcade at the mall. His player s card keeps track of the number of credits he earns as he wins games. Each winning game earns the same number of credits, and those
S14 Exponential Growth and Decay (Graphing Calculator or App Needed)
") 1010 Homework Name S14 Exponential Growth and Decay (Graphing Calculator or App Needed) 1. Without graphing, classify each of the following as increasing or decreasing and find f (0). a. f (x) = 1.5(0.75)
1010 Homework Name S14 Exponential Growth and Decay (Graphing Calculator or App Needed) 1. Without graphing, classify each of the following as increasing or decreasing and find f (0). a. f (x) = 1.5(0.75)
Interpreting the Unit Rate as Slope
 L E S S N 3.3 Florida Standards The student is expected to: Expressions and Equations.EE.. Graph proportional relationships, interpreting the unit rate as the slope of the graph. Compare two different
CCAC ELEMENTARY ALGEBRA
 CCAC ELEMENTARY ALGEBRA Sample Questions TOPICS TO STUDY: Evaluate expressions Add, subtract, multiply, and divide polynomials Add, subtract, multiply, and divide rational expressions Factor two and three
1. Factors: Write the pairs of factors for each of the following numbers:
 Attached is a packet containing items necessary for you to have mastered to do well in Algebra I Resource Room. Practicing math skills is especially important over the long summer break, so this summer
1 Supply and Demand. 1.1 Demand. Price. Quantity. These notes essentially correspond to chapter 2 of the text.
 These notes essentially correspond to chapter 2 of the text. 1 Supply and emand The rst model we will discuss is supply and demand. It is the most fundamental model used in economics, and is generally
Solutions for Rational Functions
 Solutions for Rational Functions I. Souldatos Problems Problem 1. 1.1. Let f(x) = x4 9 x 3 8. Find the domain of f(x). Set the denominator equal to 0: x 3 8 = 0 x 3 = 8 x = 3 8 = 2 So, the domain is all
MLC at Boise State Logarithms Activity 6 Week #8
 Logarithms Activity 6 Week #8 In this week s activity, you will continue to look at the relationship between logarithmic functions, exponential functions and rates of return. Today you will use investing
List the quadrant(s) in which the given point is located. 1) (-10, 0) A) On an axis B) II C) IV D) III
 in which the given point is located. 1) (-10, 0) A) On an axis B) II C) IV D) III") MTH 55 Chapter 2 HW List the quadrant(s) in which the given point is located. 1) (-10, 0) 1) A) On an axis B) II C) IV D) III 2) The first coordinate is positive. 2) A) I, IV B) I, II C) III, IV D) II,
MTH 55 Chapter 2 HW List the quadrant(s) in which the given point is located. 1) (-10, 0) 1) A) On an axis B) II C) IV D) III 2) The first coordinate is positive. 2) A) I, IV B) I, II C) III, IV D) II,
Linear functions Increasing Linear Functions. Decreasing Linear Functions
 3.5 Increasing, Decreasing, Max, and Min So far we have been describing graphs using quantitative information. That s just a fancy way to say that we ve been using numbers. Specifically, we have described
MATH THAT MAKES ENTS
 On December 31, 2012, Curtis and Bill each had $1000 to start saving for retirement. The two men had different ideas about the best way to save, though. Curtis, who doesn t trust banks, put his money in
Name: Date: Period: Activity 4.3.1: What is Slope?
 Name: Date: Period: Activity 4.3.: What is Slope? What is slope? If you have ever walked up or down a hill, then you have already experienced a real life example of slope. Keeping this fact in mind, by
3. a) Recall that slope is calculated with formula:
 Recall that slope is calculated with formula:") Economics 102 Fall 2007 Homework #1 Answer Key 1. Cheri s opportunity cost of seeing the show is $115 dollars. This includes the $80 she could have earned working, plus the $30 for the ticket, plus the
Economics 102 Fall 2007 Homework #1 Answer Key 1. Cheri s opportunity cost of seeing the show is $115 dollars. This includes the $80 she could have earned working, plus the $30 for the ticket, plus the
Name Date
 NEW DORP HIGH SCHOOL Deirdre A. DeAngelis, Principal MATHEMATICS DEPARTMENT Li Pan, Assistant Principal Name Date Summer Math Assignment for a Student whose Official Class starts with 7, 8, and 9 Directions:
Cost (in dollars) 0 (free) Number of magazines purchased
 0 (free) Number of magazines purchased") Math 1 Midterm Review Name *****Don t forget to study the other methods for solving systems of equations (substitution and elimination) as well as systems of linear inequalities and line of best fit! Also,
Math 1 Midterm Review Name *****Don t forget to study the other methods for solving systems of equations (substitution and elimination) as well as systems of linear inequalities and line of best fit! Also,
BACKGROUND KNOWLEDGE for Teachers and Students
 Pathway: Agribusiness Lesson: ABR B4 1: The Time Value of Money Common Core State Standards for Mathematics: 9-12.F-LE.1, 3 Domain: Linear, Quadratic, and Exponential Models F-LE Cluster: Construct and
Chapter 6: Quadratic Functions & Their Algebra
 Chapter 6: Quadratic Functions & Their Algebra Topics: 1. Quadratic Function Review. Factoring: With Greatest Common Factor & Difference of Two Squares 3. Factoring: Trinomials 4. Complete Factoring 5.
Lesson 4: Back to School Part 4: Saving
 Lesson 4: Back to School Part 4: Saving Lesson Description In this five-part lesson, students look at the financial lessons that a teen and her family learned while they were displaced from their home
Assignment 2 (part 1) Deadline: September 30, 2004
 Deadline: September 30, 2004") ECN 204 Introductory Macroeconomics Instructor: Sharif F. Khan Department of Economics Ryerson University Fall 2005 Assignment 2 (part 1) Deadline: September 30, 2004 Part A Multiple-Choice Questions [20
ECN 204 Introductory Macroeconomics Instructor: Sharif F. Khan Department of Economics Ryerson University Fall 2005 Assignment 2 (part 1) Deadline: September 30, 2004 Part A Multiple-Choice Questions [20
EOC Review Days 2 & 3: Linear Basics, Slope, and Intercepts
 Name: Date: Period: Algebra 1 Bowling, Cawthon, Fletcher, Skiles EOC Review Days 2 & 3: Linear Basics, Slope, and Intercepts 1. Find the x-intercept and the y-intercept for the function represented in
1 SE = Student Edition - TG = Teacher s Guide
 Mathematics State Goal 6: Number Sense Standard 6A Representations and Ordering Read, Write, and Represent Numbers 6.8.01 Read, write, and recognize equivalent representations of integer powers of 10.