METRO BOARD OF DIRECTORS FINANCE & AUDIT WORKING COMMITTEE MEETING JANUARY 21, :00 PM. Fargo & Co. for Banking Services.
|
|
|
- Alaina Lamb
- 5 years ago
- Views:
Transcription
1 METRO BOARD OF DIRECTORS FINANCE & AUDIT WORKING COMMITTEE MEETING JANUARY 21, :00 PM ACTION 1. Request Board approval of Monthly Financial Committee Reports including the Investment Reports. D. Jefferson 2. Authorization for the President & CEO to eecute and deliver a contract with Wells Fargo & Co. for Banking Services. D. Jefferson 3. Authorization for the President & CEO to negotiate, eecute and deliver a contract with DAI Source for the migration of METRO s Budget System. BRIEFING 4. Monthly Compliance Report 5. Monthly Financial Reports B. Ballanfant A. Smiley D. Sechler - Sales Ta Report - Investment Report - Debt Report - Monthly Board Report 6. Ticket Vending Maching (TVM) Update 7. TTI Review of Fare Policy: Preliminary Findings R. Treviño TX A&M TTI
2 5(48(67 )25 %2$5' $&7,21 68%-(&7 APPROVAL OF MONTHLY FINANCIALS )520 'HSDUWPHQW RU RWKHU SRLQW RI RULJLQ FINANCE 3$*( $*(1'$,7(0 25,*,1$7,21 '$7( $*(1'$ '$7( $1','(17,),&$7,21 2) 35,25 $87+25,=,1* $&7,21 25,*,1$725 DEBBIE SECHLER 5(&200(1'$7,21 $JHQGD 6XPPDU\ Request Board approval accepting the monthly committee reports, including investment reports. $:$5' $02817 &RQWUDFW ZLOO EH IRU D QRW WR H[FHHG DPRXQW RI (VWLPDWHG WR EH DSSURYHG LQ IXWXUH EXGJHWV *UDQW )XQGLQJ < 1 3UHYLRXV )< ([SHQGLWXUHV %XGJHWHG 0RQWKV No 0.00 Yes 0.00 Yes 0.00 Yes %XGJHWHG 6RXUFH 'HSW 1DPH 2SHUDWLQJ &DSLWDO *HQHUDO 0RELOLW\ 'HEW 6HUYLFH 727$/ %XGJHWHG )< %XGJHWHG 0RQWKV BBBBBBBBBBBBBBBBBBBBBB %DVH &RQWUDFW 0.00 )< %XGJHWHG 0RQWKV 2XW <HDUV %XGJHWHG 0RQWKV 7RWDO %8'*(7 127(6 )XQGLQJ IRU IXWXUH SHULRGV LI DQ\ ZLOO EH LQFOXGHG LQ IXWXUH EXGJHW VXEPLVVLRQV &KLHI )LQDQFLDO 2IILFHU 63(&,),& (;3/$1$7,21 Accept and approve monthly financial reports to include: Sales Ta Report Investments Report Debt Report Monthly Board Report Hedge Report 60$// %86,1(66 3$57,&,3$7,21 to be completed by Small Business 6PDOO %XVLQHVV $SSURYDO 5(48,5(' $87+25,=$7,21 'HSW +HDG 9LFH 3UHVLGHQW BBBBBBBBBBBBBBB 6LJQDWXUH 3UHVLGHQW &(2 6LJQDWXUH &225',1$7,21 72 &203/(7( $&7,21 BBBBBB $GPLQLVWUDWLRQ BBBBBB (QJLQHHULQJ &DSLWDO 3URMHFWV BBBBBB 2SHUDWLRQV BBBBBB 3UHVV BBBBBB $XGLW BBBBBB *RY W 3XEOLF $IIDLUV BBBBBB BBBBBB &XVWRPHU 5LGHUVKLS 6UYF BBBBBB /HJDO BBBBBB 3ODQQLQJ 3XEOLF 6DIHW\

3 02.1

4

5
6


7
8


9 03.1


10 03.1
11 Finance Committee Budget System Migration January
12 Background METRO s current IBM Cognos Enterprise Planning budget system (Cognos EP) was implemented in 2002 Cognos EP is used to prepare the annual operating budget, and overhead allocation IBM will stop improving the Cognos EP system and is offering the opportunity for METRO to migrate to their new product called Cognos TM1 Cognos EP is still supported, but IBM no longer provides enhancements or ongoing research 2
13 Limitations & Benefits Limitations of Current System: Manual and time-consuming processes require significant labor resources to keep the system operational Some system processes take 1-2 hours to run and often fail The system has had stability issues, delaying budget processing and reporting The current system does not allow for real-time reporting Benefits of New System: Improved system stability Fully automated processes will allow real-time reporting with far less staff intervention METRO will benefit from continued system research, enhancements and updates 3

14
15
16 Scope of Services Budget System Migration I. Table of Content I. Table of Content... 1 II. Overview... 3 A. Summary... 3 B. Current Cognos Process... 3 C. Elements of the Scope Licenses Software Installation Migrating Data Models... 4 a) Operating Model... 5 b) Overhead Model... 5 c) Merit increase Model Creation of Dimensions and Cubes Prior End of Year Data Data Interfaces Reports Additional Costs & Deliverables... 6 D. Contractor Qualifications... 6 III. Interfaces... 7 A. Goals & Objectives Overview Goal... 7 B. Interface 1: From Payroll to Cognos Operating Budget Overview Format Sample... 8 C. Interface 2: From Oracle Financials to Cognos Operating Budget Overview Format Sample... 9 D. Interface 3: From Cognos Operating Budget to Oracle Financial Format Sample IV. Reports A. Goals & Objectives Overview Goal B. Report 1: Budget Comparison Report Description Sample C. Report 2: Employee Budget Check Report SCOPE-Budget System Migration FINANCE Page 1 of 15
17 1. Description Sample D. Report 3: Headcount Eception Report Description Sample E. Report 4: Headcount Spread Report Description Sample F. Report 5: Labor Cost Report Description Sample G. Report 6: METRO Budget Comparison Report Description Sample H. Report 7: METRO Healthcare Count Report Description Sample I. Report 8: Resources Detail Description Sample SCOPE-Budget System Migration FINANCE Page 2 of 15
18 II. Overview A. Summary The Metropolitan Transit Authority of Harris County, Houston Teas (also referred as METRO or the Authority ) is seeking proposals to migrate its current budget system, IBM Cognos 10.1 EP solution to the IBM Cognos TM1 solution. Services delivered shall include but not be limited to the following: - Installation and setup of IBM Cognos TM1 environment (10.2 or later release) - Translation and optimization of the eisting Operating Budget Model - Translating the eisting Interfaces to and from the solution - Create the current reports - Provide documentation and training (on-site for the support and virtual for users) The Vendor must be an IBM Certified partner, using Cognos certified personnel to provide the services listed in this document. The schedule of implementation of the migration must be tailored around METRO resources availability, to minimize any impact on any current Budget activities and deadlines. The solution will not be turned on during Budget Season and will only be used when Budget Services feel comfortable that the solution provided will allow METRO to operate. Meanwhile, the eisting EP solution will continue to be used, and could run in parallel until final acceptance. METRO is epecting the IBM Cognos TM1 solution to provide a fully integrated, reworked solution that will work seamlessly between all interested parties within METRO, using real time live reporting, reducing the workload and delays currently eperienced by publish reporting. B. Current Cognos Process METRO has been using Cognos Enterprise Planning (EP) and SSRS (Sequel Server database Reporting System) for its annual budget preparation for the past 10 years. Recently IBM advised their customers that Cognos (EP) would phased out and replaced with Cognos TM1. SSRS is maintained in-house. This reporting software currently provides eight (8) reports maintained and supported by METRO IT staff. To design and develop a new report in SSRS will require the dedication of significant time and resources. The resource and time limitations make the reporting and Cognos EP etremely infleible. Generating Cognos reports does not provide real-time data to the users. A secondary process called Publish must be eecuted before user data changes are available. The Publish process can take up to an hour to complete and it is normally eecuted two (2) to three (3) times per day during the budget season. Through the services delivered in this effort, METRO intends to resolve these issues by replacing SSRS with the Cognos TM1 Reporting solution: TM1 provides live reports on demand without the need to run the Publish process. The following is a summary of epectations for the migration to Cognos TM1: - Real Time Reporting - No downtime to maintain and administer the solution (GTP, Publish ) - Reduce the workload to support the solution and reports - Reduce any delay on data entry and data verification - Transfer the creation and modification of reports to end users - Clean-up of the Model, Data and Rules - Increase Data Retention duration - Better management of Organizational Changes and what-if scenarios 10.3-SCOPE-Budget System Migration FINANCE Page 3 of 15
19 C. Elements of the Scope This scope of work is to procure the necessary user software licenses and services from a qualified IBM Business Partner to facilitate the installation of IBM s TM1 and BI software, build TM1 models, create the necessary dimensions and cubes required to implement a fully functional and error free budget solution that conforms to METRO s business practices and processes and provides real time reporting to the Budget Services group as well as the end users. METRO is seeking a qualified IBM Business partner to migrate our current IBM Cognos system structure and data (version 10.1) to IBM s TM1 solution (version 10.2 or higher). There are a number of components of this upgrade: - Licenses - Software Installation - Migrating Data Models from Cognos 10.1 EP to Cognos 10.2 TM1 - Creation of Dimensions and Cubes - Prior End-of-Year data - Data Interfaces (3) - Reports (8) - Additional Costs and Deliverables - Project Administration: shall consist of project management and other support services for project coordination, schedule management, communication and reporting.. CONSULTANT shall provide administrative direction for the project and shall insure that proper documentation is maintained throughout the project schedule. Upon completion of the work effort, CONSULTANT shall transmit to the METRO Project Manager (PM), a copy of the project documentation in electronic form. This documentation is to include project schedules, meeting Agendas/meeting notes, and knowledge transfer documentation. 1. Licenses METRO requires the necessary licenses for TM1. See IBM recommendations below IBM P/N Description IBM Cognos Analytic Server Processor Value Unit (PVU) license + Software D0C12LL Subscription & Support (12 Months) IBM Cognos Enterprise Planning TM1 for non-production Environment Processor D076ELL Value Unit (PVU) license + Software Subscription & Support (12 Months) IBM Cognos Enterprise Planning TM1 Modeler authorized user license + Software D0762LL Subscription & Support (12 Months) IBM Cognos Enterprise Planning Contributor with dual rights to IBM Cognos TM1 D0762LL Contributor authorized user (*) METRO currently owns this item (license renewal due on 12/31/2014) Units/Qty (*) 2. Software Installation The vendor shall contract with IBM to properly install the TM1 and BI software. This is required so that our software installation is fully warranted by IBM. 3. Migrating Data Models Upon successful installation of TM1 and BI software, the vendor shall, meet with the Cognos system Budget Services team and IT support staff and evaluate our current budget processes and the current Cognos data models. The vendor shall suggest opportunities for improvements and efficiencies of the eisting models when migrating to TM1 The vendor shall build the budget models within TM1 similar to the current models within Cognos with any improvements agreed to by METRO. METRO points out that the current Cognos Operating Budget environment is small and unsophisticated, containing only 3 models: 10.3-SCOPE-Budget System Migration FINANCE Page 4 of 15
20 a) Operating Model This model enables users to develop plans, budgets and forecasts for METRO s annual operating budget. It also allows the model users to compare and evaluate business scenarios and help them to forecast resource requirements and future business performance. b) Overhead Model This model enables users to apply the overhead rates to all Capital project labor accounts and GMP labor accounts by departments. c) Merit increase Model This model is created to enable HR to calculate the merit increase for the eligible employees based on METRO s latest criteria. 4. Creation of Dimensions and Cubes Current Cognos models have used 19 cubes to build three models: - 10 cubes are used for the Operating model - 5 cubes are used for the Overhead model - 4 cubes are used for the Merit Increase model These cubes are built as the basic structure of the models, and need to be migrated to the new structures. 5. Prior End of Year Data After the models are built and accepted by METRO, prior year end data from Cognos shall be populated into TM1 for METRO to be able to perform historical year-to-year comparisons. 6. Data Interfaces The vendor shall create three (3) basic interface processes between TM1 and METRO s back end system similar to those created by METRO IT staff and currently in use today. Interface descriptions and interface samples are described in the net section. There are two (2) interfaces importing data into Cognos, utilizing a CSV file generated from the following METRO systems: - SAP Payroll data (Employee information, salaries, RC, Health Plan, Dental Plan, Headcount ) - Oracle Financials (Budget information for Current Year Actual to Date, Prior Year Audited Actuals, Current Year Budget, Current Year Budget Re-Forecast ) There is one (1) interface eporting data from Cognos, into a CSV file, to populate Oracle Financials with the monthly budget by account. 7. Reports The vendor shall create eight (8) reports on TM1 data, providing the same information as METRO eisting reports: - Budget Comparison Report - Employee Budget Check - Headcount Eception Report - Headcount Spread Report 10.3-SCOPE-Budget System Migration FINANCE Page 5 of 15
21 - Labor Cost Budget Report METRO Budget Comparison Report METRO Healthcare Count Report Resource Detail Report Report descriptions and samples are provided in a later section. 8. Additional Costs & Deliverables The vendor shall provide additional costs, needed for the implementation and for ongoing operation: - First Year of Implementation Support - Training (both for administrators and power users) - Travel costs and any additional fees - Documentation of Model and Operation - Consultant rate for non-scoped services and future change orders. As a separate proposal, the proposer shall include the following for METRO s consideration - Annual Maintenance cost for the net three years of system operation. - Consultant rate for future change orders and services over the net 3 years D. Contractor Qualifications The system Implementer must have a minimum of 5 years of heavy hands-on client side eperience operating and administrating Cognos Enterprise Planning (EP) system. The Implementer must have a strong financial background and be an epert in understanding the challenges that organizations face with implementing a Cognos budget solution. The Implementer must be an epert in building models and reports within Cognos (EP). The Implementer must be an epert in building efficient models and reports in TM1 and in migrating data from Cognos (EP) to TM1. The Implementer shall provide a quick end-to-end solution for the clients. The Implementer must be able to work with all levels within an organization and have a successful track record of implementation in both small and large organizations. The Implementer must have the ability to anticipate client s needs and implement a solution that will best fit METRO s business processes and practices. METRO requires the proposer provide the system Implementer s resume and qualifications for this project as well as three professional references for the system Implementer. METRO requires services to be provided onsite unless otherwise approved by the METRO PM SCOPE-Budget System Migration FINANCE Page 6 of 15
22 III. Interfaces A. Goals & Objectives 1. Overview METRO has been using three (3) CSV interfaces to feed or etract data to/from Cognos: - From Payroll (SAP) to Cognos Operating Budget - From Oracle Financials to Cognos Operating Budget - From Cognos Operating Budget to Oracle Financials 2. Goal The vendor shall create three (3) interfaces to import and etract data to/from TM1. These interfaces shall be similar to those used by METRO IT staff to move data between METRO various information systems. The new interfaces shall use the same data structure as the current eisting interfaces, to prevent any needed change in other information systems. However, the vendor may suggest opportunities to add additional data elements into the interfaces to be utilized by the TM1 budget solution. The following sections will provide a description of each of those three interfaces SCOPE-Budget System Migration FINANCE Page 7 of 15
 list of information that serves as a yearly entry point for the new year Operating Budget, for salaries. 2.")
23 B. Interface 1: From Payroll to Cognos Operating Budget 1. Overview This interface is a CSV etract from the Payroll (SAP) list of information that serves as a yearly entry point for the new year Operating Budget, for salaries. 2. Format This file has no column title, header and no summary or total (by line or row). Each employee has a total of 15 consecutive rows, one for the value of each Data Type. There are si columns, separated by comma: - Data Type Title of payroll records - Elist RC number (4 characters) - Sequence Sequence number for the payroll record of the same RC - Year New budget year (format FY, being the year without century) - Budget Type Name of budget type in Oracle Financials - Value Value for that Data Type 3. Sample 10.3-SCOPE-Budget System Migration FINANCE Page 8 of 15
 that serves as a yearly entry point for the new year Operating Budget. 2.")
24 C. Interface 2: From Oracle Financials to Cognos Operating Budget 1. Overview This interface is a CSV etract from the Budget line items by account (Oracle Financials) that serves as a yearly entry point for the new year Operating Budget. 2. Format This file has no column title, header and no summary or total (by line or row). Each account has a total of 4 consecutive rows, one for the value of each Budget Type. There are si columns, separated by comma: - E-list RC number (4 characters) - Account Name Type of financial account (code and label) - Month Month name (format Mmm) - Year New budget year (format FY, being the year without century) - Budget Type Name of budget type in Oracle Financials - Value Budget amount in Oracle Financials, for that E-list, account, month and budget type Note: Account number in the Account Name column will be twenty five (25) digits in TM1 3. Sample 10.3-SCOPE-Budget System Migration FINANCE Page 9 of 15
. Each account has a single row, containing each month spread (from October to September), sequentially.")
25 D. Interface 3: From Cognos Operating Budget to Oracle Financial This interface is a CSV etract from Cognos Operating Budget to fill Oracle Financials with monthly spreads by account. 1. Format This file has no column title, header and no summary or total (by line or row). Each account has a single row, containing each month spread (from October to September), sequentially. There are fourteen columns, separated by comma: - RC Number RC number (4 characters) - Account Number Oracle Financial account number (first 7 characters) - Value (12) Operating budget for that month (October to September) Note: Account number in the Account Name column will be twenty five (25) digits in TM1 2. Sample 10.3-SCOPE-Budget System Migration FINANCE Page 10 of 15
26 IV. Reports A. Goals & Objectives 1. Overview METRO has been using SSRS for their annual Operating Budget reports: - current release of SSRS is 2008 R2 - current release of Report Builder is 3.0 METRO Budget uses eight reports intensively to work on the Operating Budget: - Budget Comparison Report - Employee Budget Check - Headcount Eception Report - Headcount Spread Report - Labor Cost Budget Report - METRO Budget Comparison Report - METRO Healthcare Count Report - Resource Detail Report 2. Goal The vendor shall create eight (8) basic reports using TM1 as the data source. These reports shall be similar to those created by METRO IT staff and currently in use by METRO s Budget Services group (see above). The new reports shall be using Perspectives and/or TM1 Café, whenever applicable, and no more SSRS. The following sections will provide a description of each of those eight reports SCOPE-Budget System Migration FINANCE Page 11 of 15


27 B. Report 1: Budget Comparison Report 1. Description This Ecel report provides a comparison summary of the various budget scenarios, for a selected fiscal year. 2. Sample C. Report 2: Employee Budget Check Report 1. Description This report provides the list of employee positions, by headcount and account, for each department (RC). 2. Sample 10.3-SCOPE-Budget System Migration FINANCE Page 12 of 15

.")
28 D. Report 3: Headcount Eception Report 1. Description This report provides the full information (worker type, RC number, RC name, Department, Division, FTE, Headcount, Employee Name, Position, Account, Grade and Salary/Wages) about all the headcounts that do not comply with the standard rules and restrictions. 2. Sample E. Report 4: Headcount Spread Report 1. Description This report provides a monthly summary of headcount recognition report for the fiscal year, by department (RC). Selecting one fiscal year (October to September) and the department (RC), the report displays monthly headcount, considering the spread logic, by worker type. 2. Sample 10.3-SCOPE-Budget System Migration FINANCE Page 13 of 15
 and the department (RC), the report displays monthly labor costs, considering the allocation logic, by position. 2. Sample G.")
29 F. Report 5: Labor Cost Report 1. Description This report provides a monthly summary of labor costs for the fiscal year, by department (RC). Selecting one fiscal year (October to September) and the department (RC), the report displays monthly labor costs, considering the allocation logic, by position. 2. Sample G. Report 6: METRO Budget Comparison Report 1. Description This report provides a detailed financial comparison of the all budget types, by account. Selecting a Fiscal Year, the report displays the METRO Authority Budget and METRO Operating Budget, with all the different columns presenting the various scenarios and their %age calculations. 2. Sample 10.3-SCOPE-Budget System Migration FINANCE Page 14 of 15


30 H. Report 7: METRO Healthcare Count Report 1. Description This report provides the total of employees that selected healthcare benefits, by type of benefit and department (RC). 2. Sample I. Report 8: Resources Detail 1. Description This report provides a monthly summary of resource allocation, by department and account. 2. Sample 10.3-SCOPE-Budget System Migration FINANCE Page 15 of 15

31

32

33

34

35

36


37

38

39
40 BOARD BRIEFING SUMMARY SUBJECT: AGENDA ITEM #: MONTHLY FINANCIAL REPORTS AGENDA DATE: DEPARTMENT: FINANCE & AUDIT SUMMARY: - CFO's Report - FINANCE COMMITTEE REPORT a. SALES TAX REPORT b. INVESTMENT REPORT c. DEBT REPORT d. MONTHLY BOARD REPORT e. HEDGE REPORT PRESENTER: DEBBIE SECHLER 05.1
41 The Monthly Report of the Chief Financial Officer Finance & Audit Committee January 21, 2015


42 Sales Ta Revenues Revenue thru January 2015 is $235.2 million $3.9 million or 7.3 % over estimates $15.8 million or 7.2% over FY2014 year-to-date Funds Received in Compared to Estimate Compared to Prior Year January $3.9M 7.3 % $5.1M 10.0% December $6.6M 12.5 % $7.7M 14.9%


43 Fare Revenue Fied-route ridership is +2.3% over last year Year to date fare revenue difference mainly due to reduction in route guarantees

44 METRO s Referendum Increment *Amount received in January 2015 represents sales ta activity from November 2014.
45 Budget Results
46 Diesel Fuel Hedge Report As of 01/14/15: Fiscal Year 2015 Gallons Hedged 10.8 million Hedge Price $2.74 / gal Percentage Hedged 93% million $2.68 / gal 89% million $2.26 / gal 16% Notes: As of 01/14/15, market prices per gallon are $1.72 for FY2016 and $1.86 for FY2017.
47 Fuel Purchasing and Hedging METRO purchases diesel and gasoline to fuel buses, METROLift vans and ARBOC vehicles Hedging applies only to diesel fuel METRO has contracts with vendors to purchase diesel fuel at market price (inde + differential) Diesel fuel is delivered at least weekly to facilities METRO pays for this diesel fuel at market price Separately, METRO enters into Financial Hedges Current target is to hedge 90% of volume Financial hedges guarantee budget certainty on the volume hedged (subject to market on remainder) METRO may hedge out 24 months per policy
48 Financial Advisor Review of Policy METRO s Financial Advisors (FA) reviewed the current policy and compared it with the risk policies of those of Metro s peers and determined that it is consistent with best practices for the method/ instrument used, time length and fuel use percentage of its hedges. As METRO s Risk Policy was last updated in 2008, it should be reviewed to bring it current with METRO s internal structure. Goals of the Policy should be clearly understood.
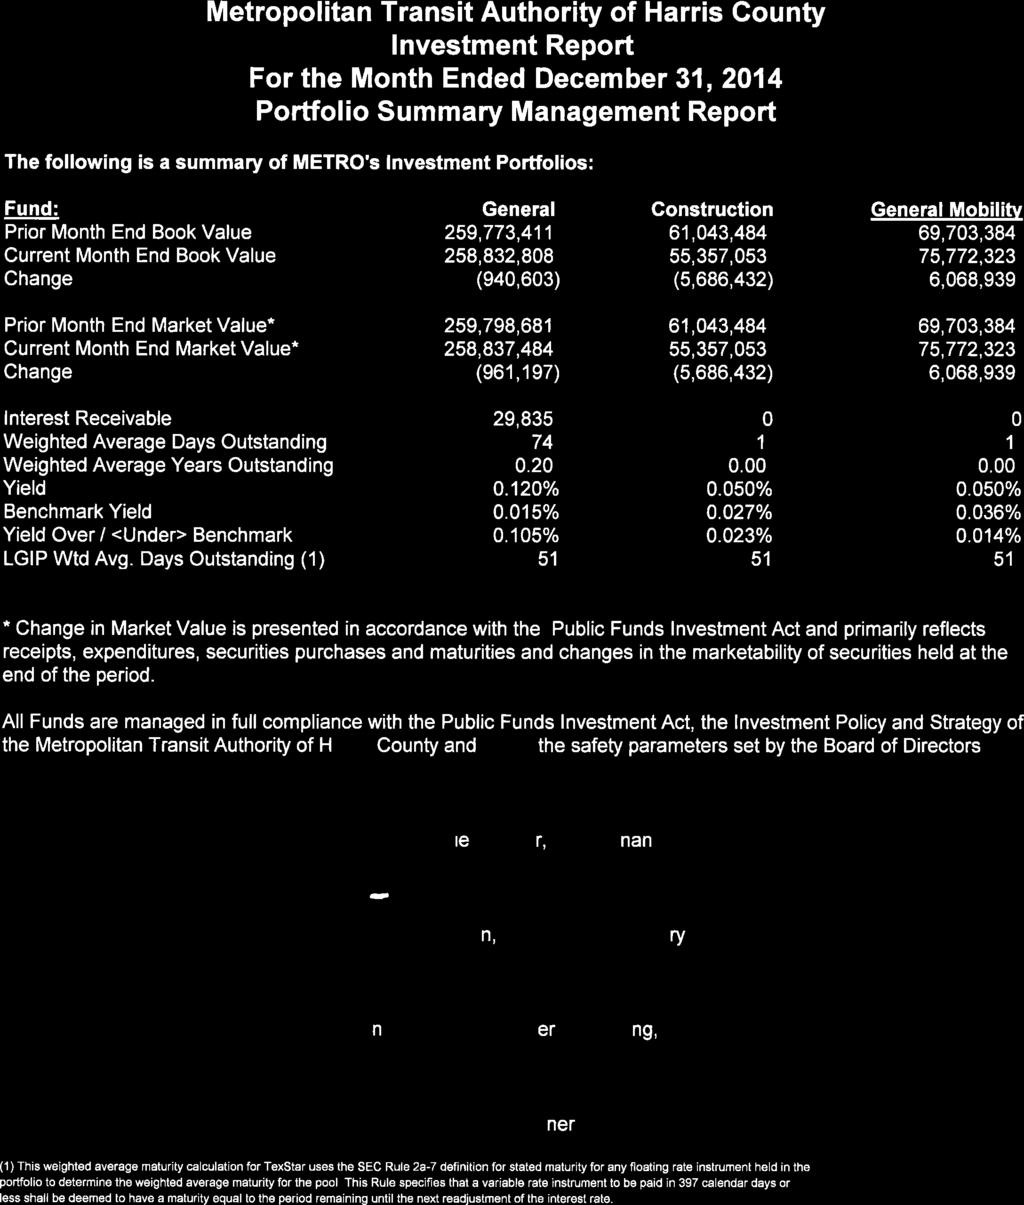
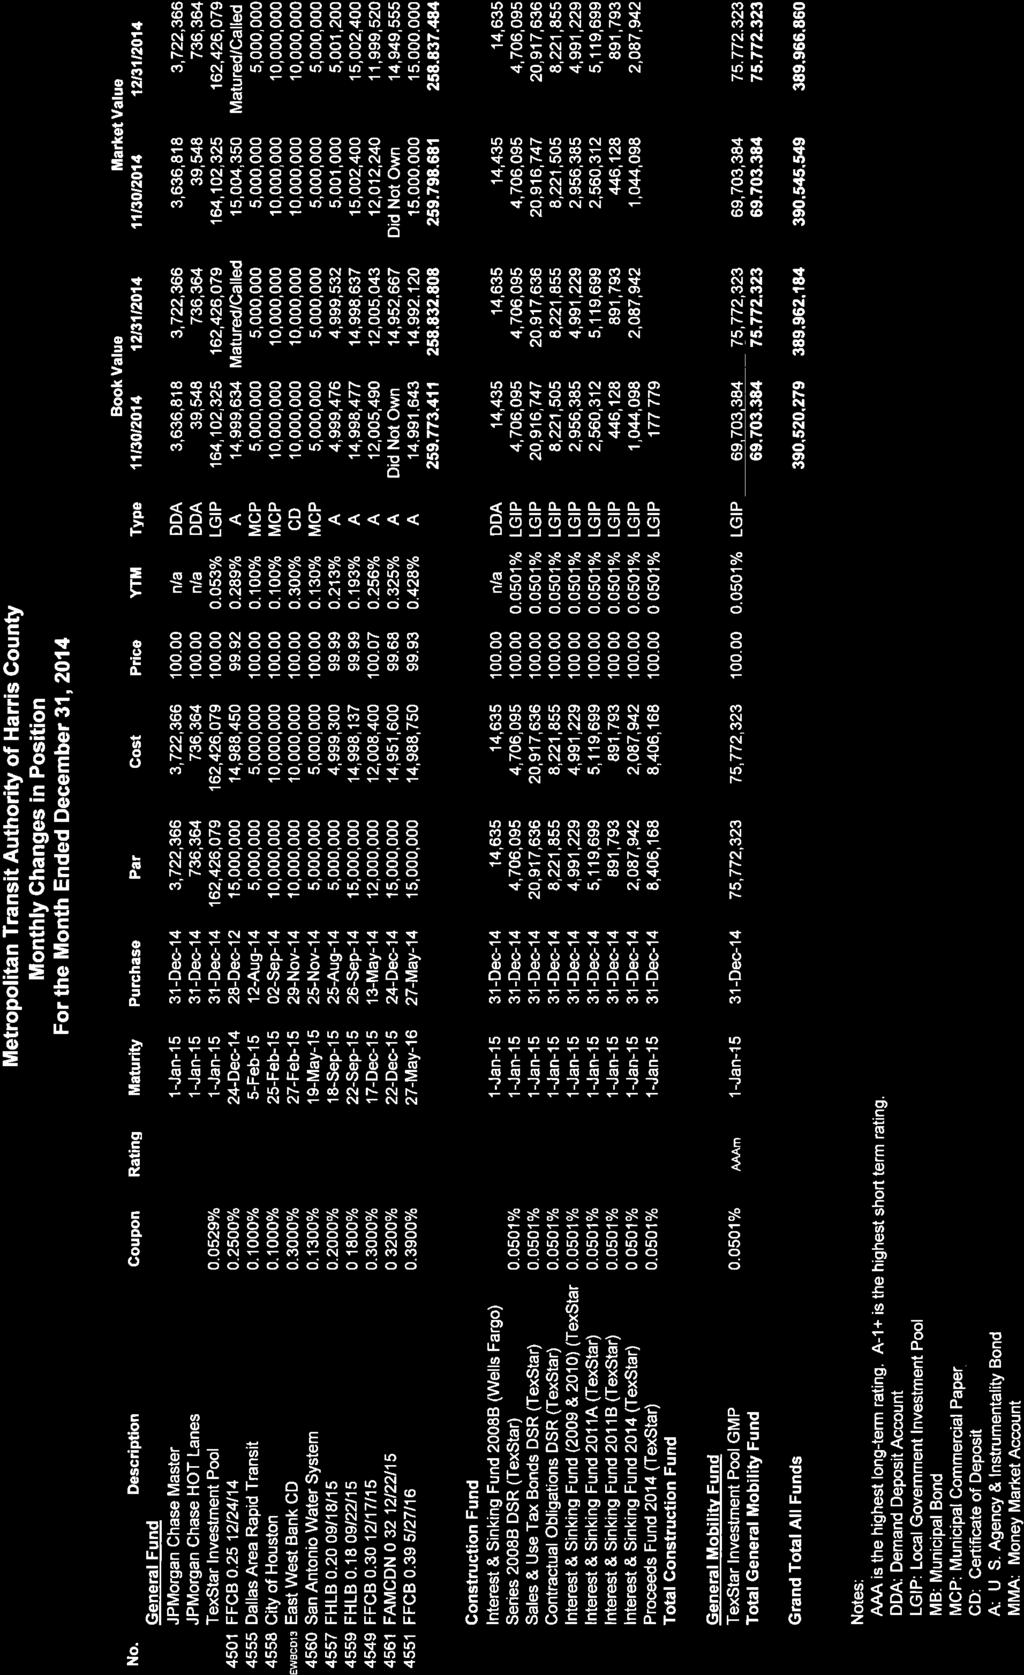
49 Portfolio Summary Fund Beginning Balance, $millions (11/30/2014) Ending Balance, $millions (12/31/2014) Earnings Rate Benchmark Rate General $259.8 $ % 0.015% Construction General Mobility
50 Debt As of Total Debt (millions) December 31, 2014 $ 1,129.0 November 30, 2014 $ 1,129.0
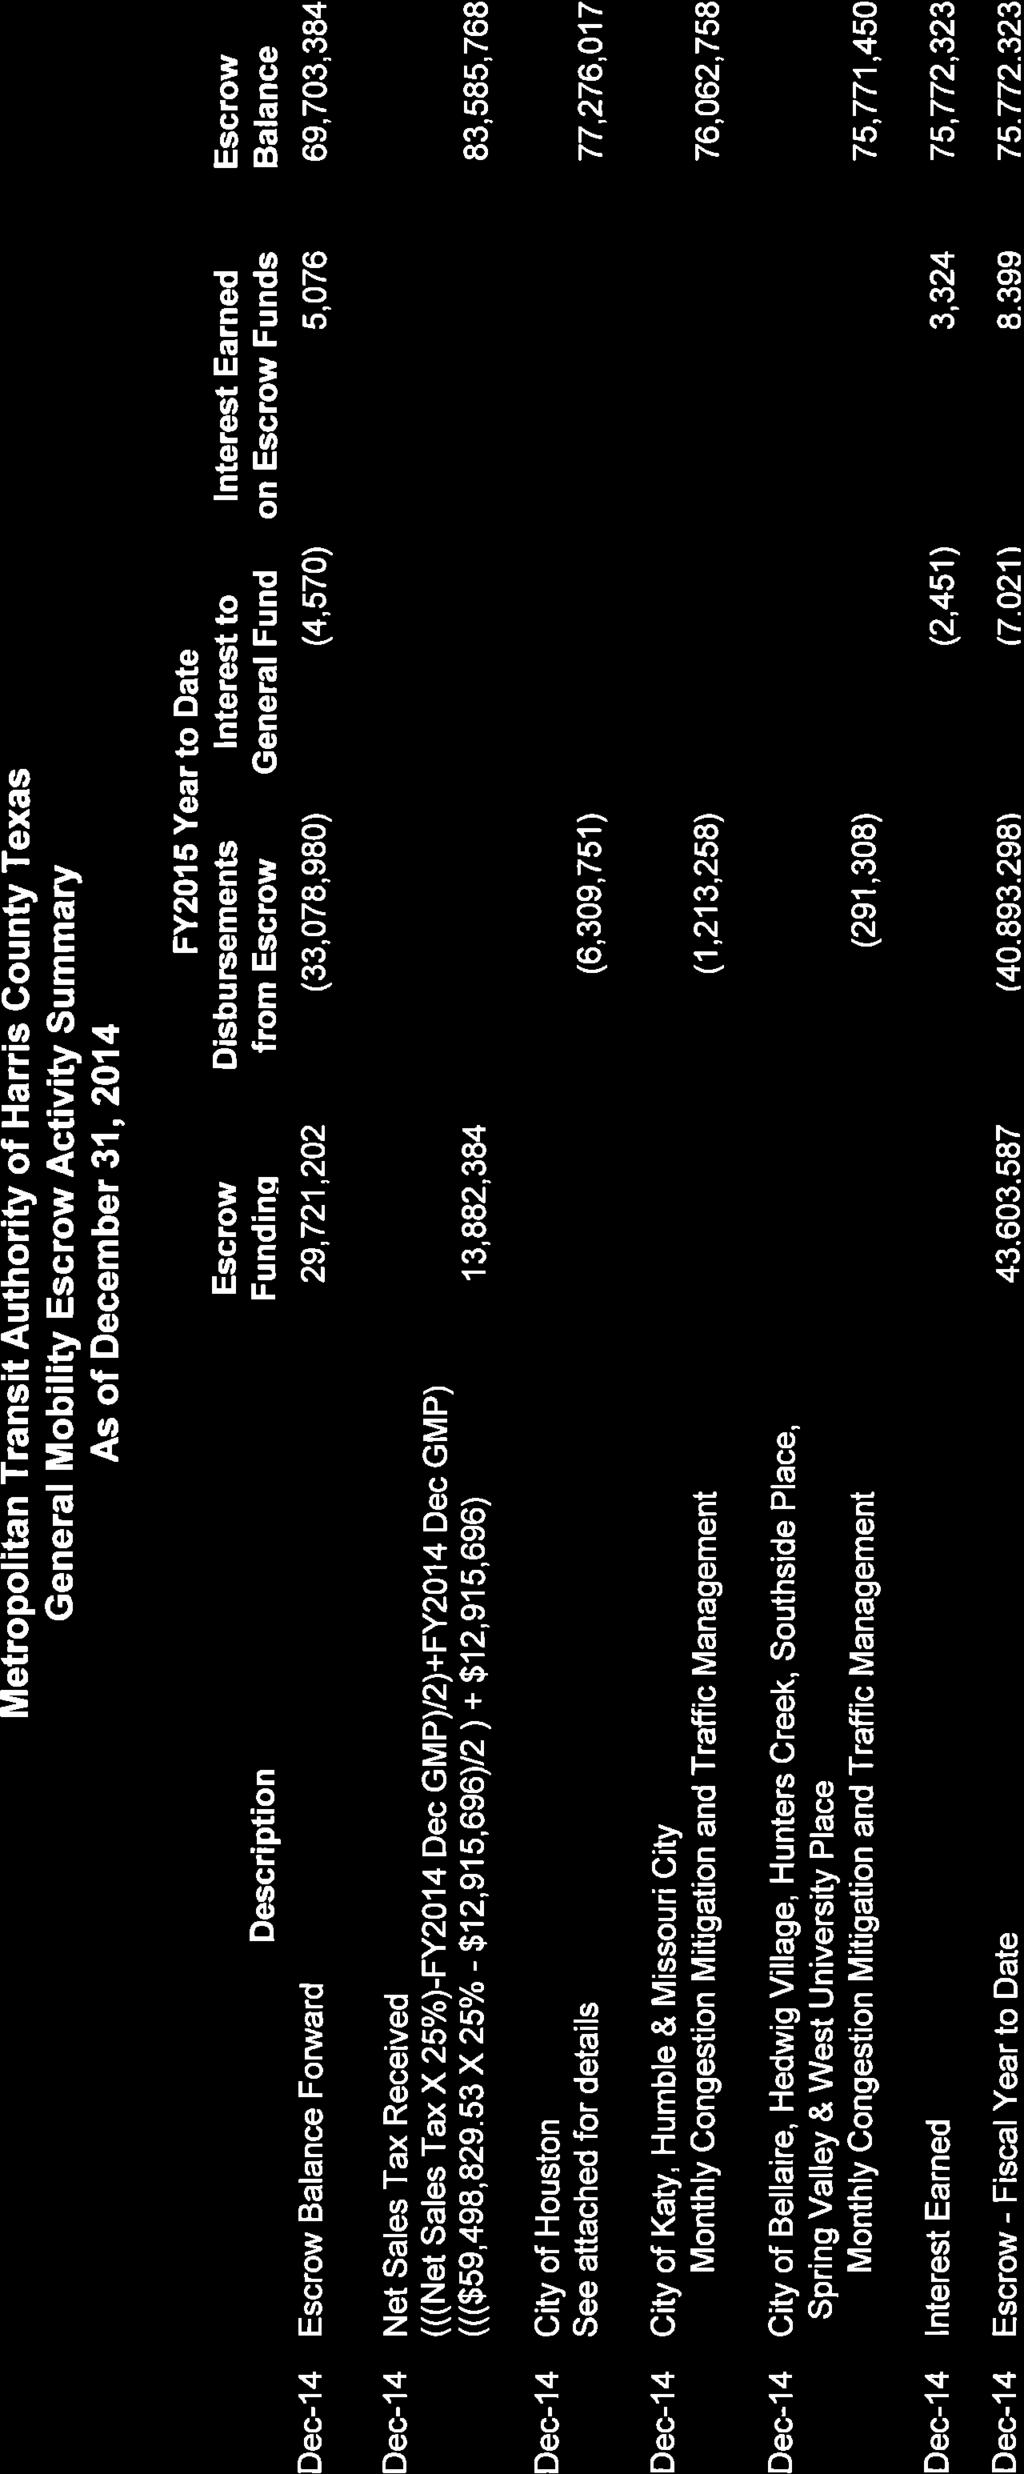
51 Finance & Audit Committee Meeting Report December Sales Ta Report Investment Report $ 56,563,341 $ 235,180, % Rec d in JANUARY/ Sales in NOVEMBER FY2015 FY2015 Change over FY2014 $ 258,837,484 General Fund (0.120% vs % Benchmark) $ 55,357,053 Construction Fund (0.050% vs % Benchmark) $ 75,772,323 General Mobility Escrow Balance Inflows: $ 13.9 million from Sales Ta Outflows: $ 6.3 million to City of Houston Debt Report $1,128,970,000 Outstanding Balance METRO Board Meeting - January 29, 2014
52 Finance & Audit Committee Meeting Report Monthly Board Report Year-to-date FY2015 ependitures are within budget: Operating $ (12.4M) or (9.8%) METRORail Epansion.... $ (8.7M) or (25.3%) Capital Improvements.... $ (3.5M) or (14.9%) General Mobility $ (19.0M) or (46.1%) Debt Service $ (0.0M) or (0.0%) Briefing Items Monthly Compliance Report Monthly Financial Reports TVM update Recommended for Board Action Approval of Monthly Financial Committee Reports including the Investment Reports Recommended Authorizations for the President & CEO Eecute and deliver a three-year contract with two one-year options with Wells Fargo & Co. for Banking services with an amount not to eceed $243, with two one-year options not to eceed $80, for each option year Negotiate, eecute and deliver a contract with DAI Source for the migration of METRO s budget system METRO Board Meeting - January 29, 2014
53 Metropolitan Transit Authority Sales & Use Ta Report January 2015 Treasury Services 1/13/2015
54 Metropolitan Transit Authority Sales & Use Ta Net Receipts (Cash Receipts Basis) FY 2015 NET NET GROSS NET VARIANCE CHANGE IN ACTUALS REC'D SALES RECEIPTS ESTIMATE RECEIPTS REBATES RECEIPTS TO FY14 ESTIMATE FY15 FY14 IN IN FY14 FY15 FY15 FY15 FY15 $ % $ % OCT AUG $ 51,431, $ 52,541, $ 54,521, $ 191, $ 54,330, $ 1,788, % $ 2,898, % NOV SEP $ 58,858, $ 61,304, $ 64,941, $ 153, $ 64,787, $ 3,483, % $ 5,928, % DEC OCT $ 51,767, $ 52,871, $ 59,665, $ 166, $ 59,498, $ 6,627, % $ 7,731, % JAN NOV $ 51,435, $ 52,701, $ 56,759, $ 195, $ 56,563, $ 3,862, % $ 5,127, % FEB DEC $ 72,282, $ 76,045, $ $ $ $ 0.00% $ 0.00% MAR JAN $ 51,684, $ 51,609, $ $ $ $ 0.00% $ 0.00% APR FEB $ 49,701, $ 50,845, $ $ $ $ 0.00% $ 0.00% MAY MAR $ 62,313, $ 69,316, $ $ $ $ 0.00% $ 0.00% JUN APR $ 55,132, $ 55,393, $ $ $ $ 0.00% $ 0.00% JUL MAY $ 54,501, $ 57,621, $ $ $ $ 0.00% $ 0.00% AUG JUN $ 62,285, $ 69,267, $ $ $ $ 0.00% $ 0.00% SEP JUL $ 56,517, $ 56,723, $ $ $ $ 0.00% $ 0.00% TOTAL $ 677,912, $ 706,241, $ 235,886, $ 706, $ 235,180, $ 15,761, % $ 21,686, % Net Receipts Estimate Net Receipts Net Receipts YTD % Over YTD % Chge YTD FY 15 YTD FY 14 YTD FY 15 FY 15 Est FY Act $ 219,418, $ 213,493, $ 235,180, % 10.16% Treasury Services 1/13/2015 Page 1 of 4
55 Metropolitan Transit Authority Sales & Use Ta Net Receipts (Cash Receipts Basis) Most Recent 12 Month History Including Accrual for Rebates NET RECEIPTS REC'D SALES NET CHANGE IN IN FISCAL NET FISCAL GROSS REBATES RECEIPTS AMOUNT % FEB DEC FY '13 $ 66,018, FY'14 $ 72,637, $ 354, $ 72,282, $ 6,263, % MAR JAN FY '13 $ 47,427, FY'14 $ 51,925, $ 240, $ 51,684, $ 4,256, % APR FEB FY '13 $ 46,852, FY'14 $ 49,938, $ 237, $ 49,701, $ 2,848, % MAY MAR FY '13 $ 60,529, FY'14 $ 62,637, $ 323, $ 62,313, $ 1,784, % JUNE APR FY '13 $ 50,459, FY'14 $ 55,390, $ 258, $ 55,132, $ 4,672, % JULY MAY FY '13 $ 52,872, FY'14 $ 54,586, $ 85, $ 54,501, $ 1,629, % AUG JUNE FY '13 $ 60,140, FY'14 $ 62,578, $ 292, $ 62,285, $ 2,145, % SEPT JULY FY '13 $ 51,797, FY'14 $ 56,756, $ 239, $ 56,517, $ 4,720, % OCT AUG FY'14 $ 51,431, FY'15 $ 54,521, $ 191, $ 54,330, $ 2,898, % NOV SEP FY'14 $ 58,858, FY'15 $ 64,941, $ 153, $ 64,787, $ 5,928, % DEC OCT FY'14 $ 51,767, FY'15 $ 59,665, $ 166, $ 59,498, $ 7,731, % JAN NOV FY'14 $ 51,435, FY'15 $ 56,759, $ 195, $ 56,563, $ 5,127, % TOTAL $ 649,590, $ 702,337, $ 2,738, $ 699,598, $ 50,008, % CURRENT MONTH REBATE ACCRUALS Reliant Stadium $ 85, Baybrook MUD $ 110, Total Rebates $ 195, Treasury Services 1/13/2015 Page 2 of 4

56
57

58
59
60 General Mobility Program Political Jurisdictions of Projects Funded in December 2014 Invoiced City Council City of Houston Projects Amount District 15th Pd: HATTS Intersections Projects $ 2,809, Various 16th Period: Safe Sidewalk Program 2,227, Various 16th Pd: Redesign & Safety Improvements Project 621, Various 15th Period: Cambridge Street (OST to Holly Hall) 371, Various 14th Pd: Patterson Remediation Project 240, C 16th Period: Street & Bridge Program Management 20, Various 16th Period: Street & Bridge Program Management 20, Various $ 6,309,751.00

61


62
63 DRAFT METRO Fiscal Year 2015 Monthly Board Report Revenue Epense Ridership Performance December 2014 (First Quarter Fiscal Year-to-Date) 1/14/2015
64 MONTHLY BOARD REPORT December 2014 Table of Contents Section A Section B Section C Section D Section E Section F Section G Section H Section I Section J Summary Sales Ta Revenue Fare Revenue Grant and Interest & Miscellaneous Revenue Budget and Epense Summary Operating Epenses December 2014 Budget vs. Actual FY2015 YTD Budget vs. Actual FY2015 YTD Major Variance Items FY2015 YTD Operating Budget/Epenses by Department Capital, General Mobility & Debt Service Ependitures Ridership by Service Category Performance Statistics Performance Statistic Notes Balance Sheet
65 MONTHLY BOARD REPORT December 2014 Summary FY2015 Sales Ta revenue through January 2015 is $235.2 million and $15.8 miliion or 7.2% over estimates. Sales Ta revenue for January FY2015 is $56.6 million, $3.9 million or 7.3% over estimates. Fare revenue of $16.8 million through December 2014 year-to-date is $0.6 million or 3.2% under budget. December 2014 revenue of $5.3 million is $0.0 million or 0.7% over budget. Service Related Grant Revenue year-to-date of $1.4 million through December 2014 is $0.3 million or 19.5% under budget. December 2014 revenue of $0.6 million is $0.0 million or 5.8% over budget. Capital Grant revenue year-to-date of $3.6 million through December 2014 is $4.4 million under budget. Interest & Miscellaneous revenue year-to-date of $2.5 million through December 2014 is $0.4 million or 20.7% over budget. December 2014 revenue of $0.8 million is $0.2 million or 24.0% over budget. Operating epenses year-to-date of $113.6 million through December 2014 are $12.4 million or 9.8% under budget. December 2014 epenses of $37.9 million are $4.1 million or 9.8% under budget. METRORail Epansion epenses year-to-date of $25.8 million through December 2014 are $8.7 million or 25.3% under budget. December 2014 epenses of $19.0 million are $2.9 million or 18.2% over budget. Other Capital Improvement Program epenses year-to-date of $19.9 million through December 2014 are $3.5 million or 14.9% under budget. December 2014 epenses of $4.0 million are $7.5 million or 65.2% under budget. General Mobility Program epenses year-to-date of $22.2 million through December 2014 are $19.0 million or 46.1% under budget. December 2014 epenses of $15.8 million are $2.3 million or 17.1% over budget. Debt Service epenses of $29.3 million through December 2014 year-to-date is on budget. METROBus ridership (fied route) year-to-date of 17.0 million through December 2014 is 174,000 or 1.0% under last year. December 2014 ridership of 5.4 million is 52,000 or 1.0% over last year. METRORail ridership year-to-date of 3.3 million through December 2014 is 617,000 or 22.8% over last year ridership of 1.1 million is 191,000 or 22.2% over compared to last year. December Performance Indicator Summary: Safety & Security Bus Accidents met the benchmark for both the month and year-to-date. Rail Accidents met the benchmark for the month and the year-to-date. Total Major Security Incidents met the benchmark for the month and for the year-to-date. Major Security Incidents on METRO properties met the benchmark for both the month and year-to-date. Service Reliability On-Time Performance for Local Bus is below the minimum performance standard for the month and the year-to-date. On-Time Performance for Park & Ride Bus met the minimum performance standard for both the month and year-to-date. On-Time Performance for METROLift met the minimum performance standard for the month and for the year-to-date. On-Time Performance for Rail missed the benchmark for the month and year to date. The Mean Distance Between Mechanical Failures (MDBF) for all buses is above the minimum standard for the month and year-to-date. MDBF for METROLift is above the minimum standard for both the month and year-to-date. Customer Service Complaint Contacts missed the goal for the month but met the goal for the year-to-date. The number of Commendations met the goal for the month and for the year-to-date. The Average Call Center Answer Delay met the goal for the month and year-to-date. Section A Page 1
66 MONTHLY BOARD REPORT December 2014 Sales Ta Revenue thru January 2015 millions $80.0 $70.0 $60.0 $50.0 $40.0 $30.0 $20.0 OCT NOV DEC JAN FEB MAR APR MAY JUN JUL AUG SEP FY2015 Budget FY2015 Actual FY2014 Actual Total FY2015 Sales Ta budget is $706.2 million Budget to Actual FY2015 ($ millions) Budget Actual Variance % October $ 52.5 $ % November % December % January % February March April May June July August September FY 2015 YTD $ $ $ % Prior Year vs. Current Year ($ millions) Prior Year Current Year Variance % October $ 51.4 $ % November % December % January % February March April May June July August September FY 2015 YTD $ $ $ % Section B Page 2
67 MONTHLY BOARD REPORT December 2014 Fare Revenue Total FY2015 Fare Revenue budget is $72.2 million Budget to Actual FY2015 ($ millions) Budget Actual Variance % October $ 6.6 $ 6.4 $ (0.2) (2.9%) November (0.4) (7.3%) December % January February March April May June July August September FY 2015 YTD $ 17.4 $ 16.8 $ (0.6) (3.2%) Prior Year vs. Current Year ($ millions) Prior Year Current Year Variance % October $ 6.5 $ 6.4 $ (0.1) (1.1%) November (0.1) (2.4%) December % January February March April May June July August September FY 2015 YTD $ 16.8 $ 16.8 $ % Section C Page 3
68 MONTHLY BOARD REPORT December 2014 Service Related Grant Revenue Total FY2015 Service Related Grant budget is $75.8 million Budget to Actual FY2015 ($ millions) Budget Actual Variance % October $ 0.7 $ 0.4 $ (0.3) (38.4%) November (0.1) (21.6%) December % January February March April May June July August September FY 2015 YTD $ 1.8 $ 1.4 $ (0.3) (19.5%) Capital Grant Revenue Year-to-date Capital Grant revenue is $3.6 million versus $8.0 million budgeted Interest & Miscellaneous Revenue Total FY2015 Interest & Miscellaneous Revenue budget is $10.8 million Budget to Actual FY2015 ($ millions) Budget Actual Variance % October $ 0.8 $ 1.0 $ % November % December % January February March April May June July August September FY 2015 YTD $ 2.1 $ 2.5 $ % Section D Page 4
69 MONTHLY BOARD REPORT December 2014 Budget and Epense Summary (in $ millions) Operating Budget (9.8%) METROLift Budget (6.7%) GMP Budget (46.1%) Debt Service Budget (0.0%) METRORail Epansion (25.3%) CIP Program (14.9%) Budget Actual $- $20 $40 $60 $80 $100 $120 $140 Section E Page 5
70 MONTHLY BOARD REPORT December 2014 Operating Epenses Comparison of Budget to Actual for the Month (December 2014) FY15 Annual December December $ Variance % Variance Budget Budget Actual (favorable)/unfavorable Labor and Fringe Benefits $ 301,590,090 $ 25,407,470 $ 24,196,890 $ (1,210,580) (4.8%) Non-Labor 221,035,377 18,466,164 15,268,502 (3,197,662) (17.3%) Subtotal Labor & Non-Labor 522,625,467 43,873,634 39,465,393 (4,408,241) (10.0%) Contingency 10,000, % Allocation to Capital and GMP (17,633,767) (1,896,915) (1,586,667) 310, % Total Operating Budget $ 514,991,700 $ 41,976,719 $ 37,878,725 $ (4,097,994) (9.8%) Comparison of Budget to Actual Year-to-Date December 2014 (3 months) FY15 Annual Year-to-Date Year-to-Date $ Variance % Variance Epense Category Budget Budget Actual (favorable)/unfavorable Wages $ 116,070,301 $ 29,532,160 $ 28,555,327 $ (976,833) (3.3%) Union Fringe Benefits $ 60,485,951 14,531,456 13,616,870 (914,586) (6.3%) Subtotal Union Labor 176,556,252 44,063,616 42,172,197 (1,891,419) (4.3%) Salaries and Non-Union Wages 86,438,577 21,365,365 20,660,263 (705,102) (3.3%) Non-Union Fringe Benefits 38,595,261 9,438,503 8,862,491 (576,012) (6.1%) Subtotal Non-Union Labor 125,033,838 30,803,868 29,522,754 (1,281,114) (4.2%) Subtotal Labor and Fringe Benefits 301,590,090 74,867,484 71,694,951 (3,172,533) (4.2%) Services 41,330,171 10,392,420 5,970,012 (4,422,408) (42.6%) Materials and Supplies 21,657,314 5,128,133 4,864,868 (263,265) (5.1%) Fuel and Utilities 51,995,174 12,779,350 12,573,411 (205,939) (1.6%) Casualty and Liability 4,516,671 1,036, ,186 (834,807) (80.5%) Purchased Transportation 93,342,065 22,809,212 21,966,426 (842,786) (3.7%) Leases, Rentals and Misc. 8,193,982 3,729,956 1,975,089 (1,754,867) (47.0%) Subtotal Non-Labor 221,035,377 55,876,064 47,551,992 (8,324,072) (14.9%) Subtotal Labor and Non-Labor 522,625, ,743, ,246,943 (11,496,606) (8.8%) Contingency 10,000, % Allocation to Capital and GMP (17,633,767) (4,741,655) (5,652,628) (910,973) (19.2%) Subtotal Contingency / Allocations (7,633,767) (4,741,655) (5,652,628) (910,973) (19.2%) Total Operating Budget $ 514,991,700 $ 126,001,893 $ 113,594,315 $ (12,407,579) (9.8%) Section F Page 6
71 MONTHLY BOARD REPORT December 2014 Major Operating Budget Variance Items - Categories with major variances Epense Type YTD Budget YTD Actual December 2014 Year-to-Date $ Variance (favorable) / unfavorable Union Labor 44,063,616 $ 42,172,197 $ (1,891,419) Wages & Fringe Benefits - primarily mechanic, technician, cleaner, and operator vacancies $ (3,618,000) Benefit Trust Contribution - due to lower enrollment and vacancies (504,412) Overtime wages mostly due to vacancies in bus operator positions and additional hours related to shuttle services for the APTA Conference 2,172,000 Non-Union Labor 30,803,868 29,522,754 (1,281,114) Salaries and fringes primarily related to vacancies (1,503,775) Lower than epected healthcare epenses resulting from vacancies and the effect of different employee healthcare election options than planned (391,787) Offset by Processing delay in severance pay for certain personnel carried over from prior year Overtime mostly associated with APTA related services Mostly year end vacation buyback activity 56, , ,000 Services Timing delays in 10,392,420 5,970,012 (4,422,408) The processing of Smartnet maintenance invoices (1,107,000) Advertising fees resulting from a delay in the East End and Southeast rail launch events Planning's System Reimagining projects for scheduling assistance and service planning activities Transit Oriented Development, Long Range Planning, Corridor Development, and Origin/Destination Survey IT contract management services (534,000) (418,000) (386,000) (267,000) Contractual support services within Operations (143,000) Issuance/processing of lnvoices for legislative coordination (126,000) Under accrual of System planning invoices to be corrected in the upcoming month Issuance/processing of lnvoices for legal services (117,000) Bus operating facility maintenenance costs (91,000) Contractual support services in Finance (77,000) Contracted HR servicesm contract employment services and temporary help (76,000) Underrun in Stakeholder Affairs support services resulting from a delay in the East Savings in contractual costs (386,000) Underutilization in other areas throughout the Authority - mostly in: - Support services - Education and training - Treasury equipment repairs and maintenance (379,000) (182,000) (114,000) - Other miscellaneous services spread across the Authority (226,000) Materials & Supplies 5,128,133 4,864,868 (263,265) Underutilization in - Special office supplies and parts (263,000) Fuel & Utilities Lower than epected gasoline cost 12,779,350 12,573,411 (205,939) (215,000) Lower than planned consumption of power and natural gas General timing variances in other utilities including, fuel (127,000) lubicants, antifreeze, CNG and ehaust fluids and (93,000) propulsion power Offset by Timing variance resulting from transition of services from AT&T to Verizon Mostly due to higher than epected diesel costs and related taes due to running more METRO bus miles than budgeted and possible timing variances 104, ,000 Casualty and Liability Subrogation recovery is higher than anticipated due to 1,036, ,186 (834,807) (849,000) mediation settlement of FY10 rail car accident Offset by Higher than epected vehicle liability costs 82,000 Purchased Transportation 22,809,212 21,966,426 (842,786) ML carried 4,870 more passengers than budgeted but favorable variance is due to service mi, higher productivity and an over accrual in FY14 performance bonuses (395,000) for van and sedan ($324,195) that was reversed in December Northwest First Transit bus hours are under budget. In addition there was an over accrual of the performance bonus in FY14 of ($223,792) for First Transit that was (308,000) reversed in December Lower than epected vanpool activity (122,000) Leases, Rentals and Miscellaneous 3,729,956 1,975,089 (1,754,867) Offset by Timing delays in the processing of SAP and other license Invoices (1,576,000) Timing delays in discretionary items (Travel, Memberships, Subscriptions, etc.) (96,000) Allocation to Capital and GMP (4,741,655) (5,652,628) (910,973) Due to heavy activity in rail operations mostly related to pre revenue testing and rail vehicle 'burn in'. (1,100,000) Due to a delay in implementation of Capital Improvement projects 189,000 Section F Page 7
72 MONTHLY BOARD REPORT December 2014 Total Net Operating Budget / Epenses by Department Authorized EOY Year-to-Date Current Month-- Headcount Department Annual Budget Budget Epense Variance Variance 3,096 Operations, Public Safety and Customer Service $ 398,978,918 $ 98,007,576 $ 92,235,105 $ (5,772,471) $ (1,986,410) 74 Customer Service 4,782,931 1,156,619 1,048,980 (107,639) (46,004) 2,714 Operations 363,255,318 89,384,223 84,505,646 (4,878,577) (1,641,369) 298 Public Safety 29,673,329 7,158,357 6,407,401 (750,956) (261,007) 10 EVP Operations, Public Safety & Customer Service 1,267, , ,078 (35,299) (38,030) 298 Finance & Administration 55,667,490 16,119,463 12,475,077 (3,644,386) (1,645,958) 76 Finance 9,666,886 2,158,398 1,751,281 (407,117) (157,107) 39 Human Resources 18,747,135 4,622,392 3,918,772 (703,620) (143,588) 67 Information Technology 17,408,855 6,803,133 4,562,883 (2,240,250) (1,278,061) 114 Procurement & Materials 9,466,377 2,439,409 2,225,170 (214,239) (62,897) 2 EVP Finance & Administration 378,237 96,131 16,970 (79,161) (4,305) 260 Planning, Engineering and Construction 34,587,599 8,212,892 6,392,789 (1,820,103) (368,430) 36 Engineering and Construction 174,321 14,974 37,553 22,579 (2,716) 184 Facility Maintenance 25,983,489 6,013,983 5,340,159 (673,824) (258,619) 38 Planning 8,414,918 2,180,515 1,015,076 (1,165,439) (105,950) 2 EVP Planning, Engineering and Construction 14,871 3,420 (0) (3,420) (1,145) 40 Gov't & Public Affairs 8,322,105 1,871,222 1,027,873 (843,349) (6,475) 3 Government Affairs 572, , ,700 13,661 6, Mktg & Corporate Communications 6,904,216 1,407, ,256 (694,320) (2,727) 7 Public Engagement 712, , ,538 (53,677) (13,282) 6 Stakeholder Affairs 133, ,392 (1,621) (109,013) 3, Legal 3,792, , ,990 (304,540) (27,876) 14 Legal 3,372, , ,567 (290,534) (18,729) 4 Records Management 420,147 97,429 83,423 (14,006) (9,146) 11 Eecutive & Board 2,052, , ,452 (4,720) (55,268) 11 Audit 1,309, , ,028 (18,010) (7,580) Contingency 10,000, Non Departmental 280, ,734 TOTAL NET OPERATING $ 514,991,700 $ 126,001,893 $ 113,594,314 $ (12,407,579) $ (4,097,997) Section F Page 8
73 MONTHLY BOARD REPORT December 2014 Total Net Operating Budget / Epenses by Department as of the end of December FY2015 vs. December FY2014 December FY2015 December FY Year-to-Date Year-to-Date Department Budget Epense Variance Budget Epense Variance Operations, Public Safety and Customer Service $ 98,007,576 $ 92,235,105 $ (5,772,471) $ 93,081,774 $ 88,318,325 $ (4,763,449) EVP Operations, Public Safety and Customer Service 308, ,078 (35,299) N/A N/A N/A Customer Service 1,156,619 1,048,980 (107,639) 1,090,747 1,056,456 (34,291) Operations 89,384,223 84,505,646 (4,878,577) 85,445,571 81,447,939 (3,997,632) Public Safety 7,158,357 6,407,401 (750,956) 6,545,456 5,813,930 (731,526) Finance & Administration 16,119,463 12,475,077 (3,644,386) 13,979,416 11,525,332 (2,454,084) EVP Finance & Administration 96,131 16,970 (79,161) N/A N/A N/A Finance 2,158,398 1,751,281 (407,117) 2,581,199 1,804,722 (776,477) Human Resources 4,622,392 3,918,772 (703,620) 4,110,774 3,703,633 (407,141) Information Technology 6,803,133 4,562,883 (2,240,250) 5,051,809 3,826,856 (1,224,953) Procurement & Materials 2,439,409 2,225,170 (214,239) 2,235,634 2,190,121 (45,513) Planning, Engineering and Construction 8,212,892 6,392,789 (1,820,103) 8,147,931 5,896,207 (2,251,724) EVP Planning, Engineering & Construction 3,420 (0) (3,420) N/A N/A N/A Engineering and Construction 14,974 37,553 22, , ,308 32,187 Facility Maintenance 6,013,983 5,340,159 (673,824) 6,281,336 4,567,698 (1,713,638) Planning 2,180,515 1,015,076 (1,165,439) 1,749,474 1,179,201 (570,273) Gov't & Public Affairs 1,871,222 1,027,873 (843,349) 2,017,272 1,006,986 (1,010,286) Government Affairs 157, ,700 13, , ,890 (33,712) Mktg & Corporate Communications 1,407, ,256 (694,320) 1,683, ,382 (919,559) Public Engagement 199, ,538 (53,677) 196, ,714 (58,492) Stakeholder Affairs 107,392 (1,621) (109,013) (1,477) - 1,477 Legal 951, ,990 (304,540) 835, ,414 (200,599) Legal 854, ,567 (290,534) 727, ,678 (175,710) Records Management 97,429 83,423 (14,006) 107,625 82,736 (24,889) Eecutive & Board 511, ,452 (4,720) 477, ,867 (75,910) Audit 328, ,028 (18,010) 330, ,615 (24,444) Non-Departmental Contingency TOTAL NET OPERATING $ 126,001,893 $ 113,594,314 $ (12,407,579) $ 118,869,242 $ 108,088,743 $ (10,780,499) Section F Page 9
74 MONTHLY BOARD REPORT December 2014 Capital, General Mobility and Debt Service Epenses Budget vs. Actual - Month and Fiscal Year-to-Date ($ millions) FY2015 Annual Month of December 2014 Variance Fiscal YTD December 2014 Variance Budget Budget Actual $ % Budget Actual $ % METRORail Epansion Capital Improvement Program Total Capital Budget $ $ 16.1 $ 19.0 $ % $ 34.6 $ 25.8 $ (8.7) (25.3%) (7.5) (65.2%) (3.5) (14.9%) $ (4.6) (16.7%) (12.2) (21.1%) General Mobility $ % (19.0) (46.1%) Debt Service $ 91.5 $ 6.1 $ 6.1 $ (0.0) (0.2%) $ 29.3 $ 29.3 $ (0.0) (0.0%) Section G Page 10
75 MONTHLY BOARD REPORT December 2014 Ridership by Service Category YTD % Change Dec-14 Dec-13 Dec-14 Dec-14 Service Category Dec-13 Dec-14 vs. YTD YTD vs. Boardings Boardings Dec-13 Boardings Boardings Dec-13 Fied Route Bus Local 4,771,199 4,759,042 (0.3%) 15,304,421 15,032,370 (1.8%) Park & Ride 545, , % 1,916,737 2,014, % Subtotal Fied Route Bus 5,316,509 5,368, % 17,221,158 17,047,149 (1.0%) METRORail 860,735 1,052, % 2,700,262 3,316, % Subtotal Fied Route 6,177,244 6,420, % 19,921,420 20,364, % Special Events * (41.0%) ,899 N.A. Total Fied Route 6,177,417 6,420, % 19,921,593 20,382, % Customized Bus Services METROLift 142, , % 449, , % METRO STAR Vanpool 177, , % 592, , % Internal Service % (95.6%) Subtotal Customized Bus 319, , % 1,042,594 1,083, % Subtotal Bus and Rail 6,497,066 6,765, % 20,964,187 21,466, % HOV/HOT Carpools, Vanpools, and Non-METRO 2,125,578 2,359, % 6,376,734 6,756, % Buses Total System 8,622,644 9,125, % 27,340,921 28,222, % Fied route ridership is reported on the same basis as in the National Transit Database * The Special Events category of ridership reflects customer service oriented short-term additional motor bus service provided for events at Reliant Park such as football games and RODEO Houston January ############### Fied Route and Total System Ridership January January FY2014 FY2015 Total System Ridership January 8.0 Millions Fied Route Ridership FY2014 in Blue FY2015 in Green OCT NOV DEC JAN FEB MAR APR MAY JUN JUL AUG SEP January January Section H Page 11
76 MONTHLY BOARD REPORT December 2014 Performance Statistics Fiscal Year 2015 Benchmark Met Benchmark Missed FY2015 YTD SAFETY & SECURITY Monthly YTD FY2015 % OCT NOV DEC JAN FEB MAR APR MAY JUN JUL AUG SEP Target GOAL YTD Change Bus Accidents (Includes METROLift) % Bus Accidents per 100,000 vehicle miles % Rail Accidents % Rail Accidents per 100,000 vehicle miles % Major Security Incidents - total % Major Security Incidents per 100,000 boardings % Major Security Incidents - METRO properties % Major Security Incidents per 100,000 boardings % FY2015 YTD SERVICE & RELIABILITY Monthly YTD FY2015 % OCT NOV DEC JAN FEB MAR APR MAY JUN JUL AUG SEP Target GOAL YTD Change Local Bus OTP 68.5% 68.6% 68.8% 69% 69% 68.6% 0.5% Park & Ride Bus OTP 77.0% 75.3% 75.9% 75% 75% 76.1% 1.4% Weighted Average Bus OTP 70.7% 70.5% 70.7% 71% 71% 70.6% 0.5% METROLift OTP 85.8% 87.6% 88.1% 87% 87% 87.2% 0.2% Rail On-Time Performance 85.7% 92.3% 91.5% 95% 95% 89.7% MDBF (Mean Distance Between Mechanical Failures) - All Buses MDBF (Mean Distance Between Mechanical Failures) - METROLift 11,027 11,033 10,905 10,000 9,250 10, % 17,920 12,938 13,599 13,000 13,000 14, % 0.0% 0.0% FY2015 YTD CUSTOMER SERVICE Monthly YTD FY2015 % OCT NOV DEC JAN FEB MAR APR MAY JUN JUL AUG SEP Target GOAL YTD Change *Complaint Contacts per 100,000 boardings % Commendations % Average Call Center Answer Delay (Sec.) % Section I Page 12
77 MONTHLY BOARD REPORT December 2014 Performance Statistic Definitions Bus and Rail Accidents - An accident is a transit incident with passenger injuries that require immediate medical treatment away from the scene or a collision between a revenue vehicle and an object such that the amount of damage eceeds $1,000. Bus accidents (which include METROLift) and rail accidents are reported separately and in terms of the absolute number of accidents and the relative number of accidents per 100,000 vehicle miles. Rail accidents reflect collisions between METRORail and other vehicles, pedestrians, or bicyclists. This definition has been revised beginning in FY2011 to include pedestrian accidents. Major Security Incidents - The total Major Security Incidents is based on two industry standards: the FBI Uniform Crime Report and the National Transit Database (NTD) Report issued by the Federal Transit Administration (FTA). The eight (8) categories included are: homicide, forcible rape, robbery, aggravated assault, burglary, larceny and theft, motor vehicle theft and arson. This metric is reported both in terms of the absolute number of incidents and the number of incidents per 100,000 boardings. Major Security Incidents - METRO Properties - The total Major Security Incidents - METRO Properties is the number of incidents that occur at Park & Ride lots, Transit Centers, on-board buses and trains and on Light Rail Vehicle (LRV) platforms. This metric is reported both in terms of the absolute number of incidents and the number of incidents per 100,000 boardings. On-Time Performance (OTP) - A local bus is considered on-time if it does not leave early and is within a five (5) minute window after the scheduled departure time. A Park & Ride bus is considered on-time if it does not depart early (ecept in the morning when a bus can leave from a Park & Ride lot when full) and is within a five (5) minute window after the scheduled departure time, with measurements during peak hours. OTP is measured by the IVOMS system which calculates data to the second, and the five (5) minute window is defined as anything less than si (6) minutes. For METRORail, a train departing from the beginning of the line or arriving at the end of the line less than five (5) minutes after the scheduled time is considered on-time. For METROLift, a trip is considered on-time if the vehicle arrives within 30 minutes of the scheduled pick-up time and no later than the appointment time. Mean Distance Between Mechanical Failures (MDBF) - MDBF reflects any mechanical issue encountered during operation of the vehicle in revenue service that requires a maintenance action resulting from a mechanical failure. Mechanical failures include warranty and fleet defects but eclude accidents. Complaint Contacts - Patrons may contact METRO s Customer Care Center to epress dissatisfaction with METRO. Contacts made via telephone and over the internet which result in a complaint record being generated in the Public Comment System are reported as the number of contacts per 100,000 boardings. Commendations - Patrons may contact METRO's Customer Care Center to recognize, compliment or praise a METRO employee or the METRO organization for eemplary work or performance. Contacts made via telephone, internet, or mail which result in a commendation record being generated in the Public Comment System are reported only on the basis of the absolute number of contacts received. Average Call Center Answer Delay - METRO is committed to providing customers with accurate, customerfriendly bus and service information in a timely manner. Customers may obtain bus information over METRO's website and by telephone using an interactive voice response system without speaking to a representative and with no customer wait time. For those customers who prefer to speak with a representative, METRO's goal is to answer their calls in 120 seconds or less. Section I Page 13
78 MONTHLY BOARD REPORT December 2014 Balance Sheet December 31, 2013 ($) December 31, 2014 ($) Change ($) Cash $ 3,012,409 $ 3,552,019 $ 539,610 Receivables 138,594, ,063,167 15,468,640 Inventory 22,388,586 24,951,836 2,563,250 Investments 292,049, ,452,388 93,402,416 Other Assets 86,199,582 41,181,581 (45,018,001) Property Net of Depreciation 2,606,723,864 2,784,612, ,888,530 Land & Improvements 395,852, ,064, ,471 Total Assets and Other 3,544,821,707 3,789,877, ,055,916 Liabilities Trade Payables 40,517,859 58,257,325 17,739,466 Accrued Payroll 29,488,188 28,753,366 (734,822) Commercial Paper 183,400, ,300,000 (2,100,000) Long-Term Liabilities 1,067,525,050 1,229,735, ,210,815 Other Liabilities 73,135,315 29,683,070 (43,452,245) Total Liabilities 1,394,066,412 1,527,729, ,663,214 Net Assets - Retained 2,150,755,295 2,262,147, ,392,702 Total Liabilities and Net Assets $ 3,544,821,707 $ 3,789,877,623 $ 245,055,916 Section J Page 14
79 FUEL PRICE RISK MANAGEMENT POLICY REPORT "FUEL HEDGE" Dec-14
80 FUEL PRICE RISK MANAGEMENT POLICY REPORT Dec-14 (Budget Services 01/13//14) The Fuel Price Risk Management Policy approved by the Board on February 16, 2006 requires monthly reports to the Finance/Audit Committee. Per the Finance Chair in 2009, the report is to be presented quarterly to the F/A committee. The Board has approved resolutions authorizing implementation of the Fuel Hedge Policy for FY2008 (October 2006). In July 2008 the Board amended the Fuel Risk Management Policy by eliminating the July 15 deadline for hedging the net fiscal years fuel requirement. A. Diesel Fuel Hedges For FY2015 four hedges totaling 10.84M gallons have been eecuted at an average price of $ As of 12/31/2014 a total of seven hedges totaling 10.58M gallons at an average price of $ have been eecuted for FY2016 and three hedges totaling 1.47M gallons at an average price of $ have been eecuted for FY2017. Note that for FY2014 eight hedges totaling 11.09M gallons were eecuted at an average price of $ (Hedge prices are market price only, not including transportation, additive and taes). See Attachment A for hedge details. METRO currently has chosen Koch Supply & Trading LP, Merrill Lynch Commodities Inc., BP Products North America Inc. and Goldman, Sachs & Co. to bid financial hedges. A comparison of the FY2014 hedged gallons, actual usage and hedge collections is outlined in Attachment B. Hedge payments fiscal year to date total $1.48M. B. 3 Year Contract for Electricity In March 2010 the Board Approved a 3 year contract with the Teas General Land Office (GLO) to supply electricity for April 1, 2010 to March 31, The contract rate of $ per kilowatt hour was fied for the term of the contract while the Transmission and Distribution (TDSP) floats. This contract was etended through June 30,2013 at a contract rate of $ per kilowatt hour. A new contract has been finalized with GDF SUEZ Energy Resources NA, Inc ("Suez"). This contract span covers 2 years from July 1, 2013 through June 30, 2015 with a contract rate of $ per kilowatt hour. This contract hedges METRO's electricity requirements for 2 years, providing budget certainty on price in accord with the Board's Fuel Price Risk Management Policy adopted February 2006.
81 ATTACHMENT A
82 Financial Hedge (Oct-Sep Delivery) Delivery Year Gallons Fuel Type Vendor a. b. c. d. e. f. g. h. FY ,000 USLD Koch Supply & Trading, LP 12/1/11 $ $ 694,386 FY2014 1,470,000 USLD Koch Supply & Trading, LP 5/17/12 $ $ 4,168,185 FY2014 1,008,000 USLD Goldman, Sachs & Co. 5/30/12 $ $ 2,771,055 FY2014 1,344,000 USLD Goldman, Sachs & Co. 6/21/12 $ $ 3,484,320 FY2014 1,512,000 USLD Goldman, Sachs & Co. 10/11/12 $ $ 4,441,500 FY2014 1,512,000 USLD Goldman, Sachs & Co. 3/20/13 $ $ 4,354,560 FY2014 METRO FY2014, FY2015, FY2016 and FY2017 Fuel Hedge (Diesel) - Status 12/31/14 (Budget Services 01/13//14) Date of Purchase Avg. Price per gallon 1,092,000 USLD Goldman, Sachs & Co. 4/12/13 $ $ 3,104,010 FY2014 2,898,000 USLD Merrill Lynch 4/18/13 $ $ 7,998,480 11,088,000 $ $ 31,016,496 Cost i. j. k. FY2015 1,512,000 USLD Goldman, Sachs & Co. 12/18/12 $ $ 4,227,552 FY2015 2,058,000 USLD Goldman, Sachs & Co. 4/18/13 $ $ 5,564,832 FY2015 3,990,000 USLD Merrill Lynch 9/24/13 $ $ 10,850,700 l. FY2015 3,276,000 USLD Merrill Lynch 4/2/14 $ $ 9,077,943 10,836,000 $ $ 29,721,027 m. FY2016 1,512,000 USLD Goldman, Sachs & Co. 1/3/14 $ $ 4,067,280 n. FY2016 1,386,000 USLD Merrill Lynch 1/15/14 $ $ 3,718,638 o. FY2016 2,226,000 USLD Goldman, Sachs & Co. 4/2/14 $ $ 6,010,200 p. FY2016 3,024,000 USLD Merrill Lynch 9/11/14 $ $ 8,172,310 q. FY2016 1,512,000 USLD Merrill Lynch 9/29/14 $ $ 4,055,184 r. FY ,000 USLD Merrill Lynch 10/7/14 $ $ 1,093,478 s. FY ,000 USLD Merrill Lynch 10/16/14 $ $ 1,244,536 10,584,000 $ $ 28,361,626 t. FY ,000 USLD Merrill Lynch 10/7/14 $ $ 1,092,202 u. FY ,000 USLD Merrill Lynch 10/16/14 $ $ 522,291 v. FY ,000 USLD Goldman, Sachs & Co. 12/19/14 $ $ 1,703,100 1,470,000 $ $ 3,317,593 2
83 ATTACHMENT B
84 METRO FY2014 DIESEL FUEL (Budget Services 01/13//14) Month Fuel Source Gallons in Financial Hedge Gallons Purchased Gallons Used Gallons Used Variance Swap Receipts Oct-14 Financial Hedge 966,000 1,136,114 1,122, ,562 $ (278,901) Nov-14 Financial Hedge 798, , ,112 98,112 $ (365,228) Dec-14 Financial Hedge 840, , , ,516 $ (838,278) Jan-15 Financial Hedge 840,000 Feb-15 Financial Hedge 798,000 Mar-15 Financial Hedge 924,000 Apr-15 Financial Hedge 924,000 May-15 Financial Hedge 924,000 Jun-15 Financial Hedge 966,000 Jul-15 Financial Hedge 966,000 Aug-15 Financial Hedge 966,000 Sep-15 Financial Hedge 924,000 Total 10,836,000 3,032,744 3,002, ,189 $ (1,482,407) NOTE 1. The gallons above the financial hedge volumes, as shown in the variance, were bought at the prevailing market prices. 3
85 BOARD BRIEFING SUMMARY SUBJECT: AGENDA ITEM #: Ticket Vending Machine Update 06.1 AGENDA DATE: 1/29/15 DEPARTMENT: Planning, Engineering and Construction PRESENTER: Roberto Treviño, P.E. SUMMARY: Update the Board on the status of testing, commissioning and installation of the Ticket Vending Machine's along METRO's Rail Lines.


86 January 2015 Metropolitan Transit Authority of Harris County, Teas

87 February 2014 Board eecuted contracts with Parkeon to provide 44 basic Ticket Vending Machines and Genfare to provide 26 full service Ticket Vending Machines 2


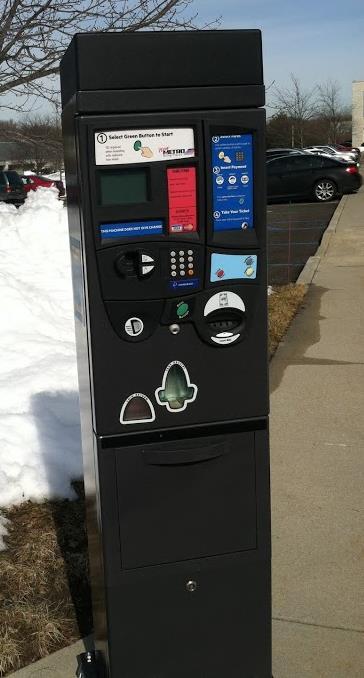
88 Eisting ACS 1. Purchase paper ticket with cash, credit & debit card 2. Change made 3. Reload Q-card Genfare New Full Service 1. Purchase paper ticket with cash, credit & debit card 2. Change made 3. Dispense Q-card & METRO Money Parkeon New Basic 1. Purchase paper ticket with cash, credit & debit card 2. No change made 3
89 RAIL LOCATION ACS GENFARE (NEW) PARKEON (NEW) RED LINE PURPLE LINE GREEN LINE TOTAL NEW TVMs 4
90 RAIL LOCATION TVMs Installed TVMs Remaining to Install RED LINE 0 27 PURPLE LINE 9 26 GREEN LINE TOTAL NEW TVMs Testing, Configuration and Installation complete for all Ticket Vending Machines by the April 2015 Rail opening. 5
91 BOARD BRIEFING SUMMARY SUBJECT: AGENDA ITEM #: TTI Review of Fare Policy: Preliminary Findings 07.1 AGENDA DATE: DEPARTMENT: Finance/Office of Management and Budget PRESENTER: Teas A&M Transportation Institute (TTI) SUMMARY: The purpose of this item is to brief the full Board on the preliminary findings of the Fare Study being conducted by Teas A&M Transportation Institute. Findings covered include: * Previous fare policy goals * Fare elasticity * Results of peer review * Proposed fare policy goals * Fare payment technology options
92 AUTHORITY REVIEW FARE POLICY AND STRUCTURE PROJECT TRANSIT January 2015 METROPOLITAN TTI REVIEW OF FARE POLICY: PRELIMINARY FINDINGS
93 STATUS: TTI REVIEW OF FARE POLICY METROPOLITAN Goal: Identify and evaluate different options for a revised fare structure, including pricing strategies and fare collection technology Task Status Review historical changes in fare structure to document impact on ridership and revenue Completed Review fare elasticity model Completed Peer comparison of current fare policy Ongoing Identify fare structure options for analysis Ongoing Evaluate and recommend fare structure options; determine technology impacts Ongoing REVIEW FARE POLICY AND STRUCTURE PROJECT AUTHORITY Completed TRANSIT Review and document METRO Board fare policy goals 2
94 Goals 2005 Increase revenue Improve fare recovery Goals 2011 Increase ridership Improve fare recovery REVIEW FARE POLICY AND STRUCTURE PROJECT AUTHORITY Simplify fare structure Reduce fraud Improve equity Improve fare recovery Speed bus operations Goals 2009 TRANSIT METROPOLITAN PREVIOUS FARE POLICY GOALS REFLECTED DIFFERING EMPHASES 3
95 Date Action Priority Resolution Offset cost increases, improve fare recovery ratio Dec 1996 Add Day Pass Increase ridership Sept 2006 Restructure fied-route fares, add smart card, eliminate most passes Increase revenue, simplify payment Oct 2008 FY 2009 Increase fied-route fares, (Local/Rail: + $.25 P&R: + $.50 - $1.00) Increase revenue, improve fare recovery ratio Mar 2013 Reinstate Day Pass Respond to riders, increase ridership AUTHORITY Increase all fares (Local: + $.15; P&R: + $.30 - $.60; METROLift: +$.15) TRANSIT Jul 1991 REVIEW FARE POLICY AND STRUCTURE PROJECT METROPOLITAN BOARD ACTIONS REGARDING FARES REFLECT ORGANIZATIONAL PRIORITIES 4
96 25% 80 20% 60 15% 40 10% 20 5% 0 0% Fare Recovery Ratio Fares in Millions of Dollars Fare Recover Ratio Fare Revenues and Ridership in Millions 100 AUTHORITY 30% TRANSIT 120 METROPOLITAN TRENDS IN RIDERSHIP, FARE REVENUE, AND FARE RECOVERY RATIO Ridership in Millions REVIEW FARE POLICY AND STRUCTURE PROJECT 5
97 METROPOLITAN FARE INCREASE +25% IN 2009 RESULTS: REDUCED RIDERSHIP, INCREASED REVENUE % % + 4.0% Fare Revenue % % + 8.8% AUTHORITY Ridership TRANSIT Fare Elasticity Actual Actual Model 2012 Compared 2013 Compared to Forecast to Baseline February 2006 Forecast and actual ridership were nearly identical. REVIEW FARE POLICY AND STRUCTURE PROJECT 6


98 PEERS FOR FARE POLICY AND STRUCTURE METROPOLITAN Seattle $2.50 Minneapolis $2.25 Portland $2.50 Philadelphia $2.25 Salt Lake City $2.50 Los Angeles $1.75 Dallas $2.50 Atlanta $2.50 AUTHORITY Phoeni $2.00 TRANSIT Washington DC $1.75 Denver $2.25 Austin $1.25 San Antonio $1.20 Houston $1.25 REVIEW FARE POLICY AND STRUCTURE PROJECT Miami $2.25 7
METRO. Fiscal Year 2015 Monthly Board Report. February 2015
 METRO Fiscal Year 2015 Monthly Board Report Revenue Expense Ridership Performance 4/2/2015 Table of Contents Section A Section B Section C Section D Section E Section F Section G Section H Section I Section
METRO. Fiscal Year 2014 Monthly Board Report. May 2014
 METRO Fiscal Year 2014 Monthly Board Report Revenue Expense Ridership Performance 7/11/2014 Table of Contents Section A Section B Section C Section D Section E Section F Section G Section H Section I Section
METRO. Fiscal Year 2017 Monthly Performance Report. Revenue Expense Ridership Performance. October 2016
 METRO Fiscal Year 2017 Monthly Performance Report Revenue Expense Ridership Performance 11/18/2016 Table of Contents Section A Section B Section C Section D Section E Section F Section G Section H Section
METRO. Fiscal Year 2015 Monthly Board Report. September 2015 (Fourth Quarter Fiscal Year-to-Date)
") METRO Fiscal Year 2015 Monthly Board Report Revenue Expense Ridership Performance (Fourth Quarter Fiscal Year-to-Date) This report is based on a preliminary closing of the year-end financials for FY2015
METRO Fiscal Year 2015 Monthly Board Report Revenue Expense Ridership Performance (Fourth Quarter Fiscal Year-to-Date) This report is based on a preliminary closing of the year-end financials for FY2015
METRO. Fiscal Year Monthly Performance Report. Revenue Expense Ridership Performance. November 2018 (Third Quarter Fiscal Year-to Date)
") METRO Fiscal Year 2019 Monthly Performance Report Revenue Expense Ridership Performance (Third Quarter Fiscal Year-to Date) 12/12/2018 Table of Contents Section A Section B Section C Section D Section
METRO Fiscal Year 2019 Monthly Performance Report Revenue Expense Ridership Performance (Third Quarter Fiscal Year-to Date) 12/12/2018 Table of Contents Section A Section B Section C Section D Section
METRO. Fiscal Year Monthly Performance Report. Revenue Expense Ridership Performance. February 2018 (First Quarter Fiscal Year-to Date)
") METRO Fiscal Year 2018 Monthly Performance Report Revenue Expense Ridership Performance (First Quarter Fiscal Year-to Date) 3/12/2018 Table of Contents Section A Section B Section C Section D Section E
METRO Fiscal Year 2018 Monthly Performance Report Revenue Expense Ridership Performance (First Quarter Fiscal Year-to Date) 3/12/2018 Table of Contents Section A Section B Section C Section D Section E
METRO. Fiscal Year 2013 Monthly Board Report. January 2013
 METRO Fiscal Year 2013 Monthly Board Report Revenue Expense Ridership Performance 2/14/2013 Table of Contents Section A Section B Section C Section D Section E Section F Section G Section H Section I Section
METRO. Fiscal Year 2012 Monthly Board Report. December 2011 (First Quarter Fiscal Year-to-Date)
") METRO Fiscal Year 2012 Monthly Board Report Revenue Expense Ridership Performance (First Quarter Fiscal Year-to-Date) 1/27/2012 Table of Contents Section A Section B Section C Section D Section E Section
METRO Fiscal Year 2012 Monthly Board Report Revenue Expense Ridership Performance (First Quarter Fiscal Year-to-Date) 1/27/2012 Table of Contents Section A Section B Section C Section D Section E Section
METRO. Fiscal Year 2012 Monthly Board Report. September 2012 (Fourth Quarter Fiscal Year-to-Date)
") METRO Fiscal Year 2012 Monthly Board Report Revenue Expense Ridership Performance (Fourth Quarter Fiscal Year-to-Date) This report is based on a preliminary closing of the year-end financials for FY2012
METRO Fiscal Year 2012 Monthly Board Report Revenue Expense Ridership Performance (Fourth Quarter Fiscal Year-to-Date) This report is based on a preliminary closing of the year-end financials for FY2012
METRO. Fiscal Year 2013 Monthly Board Report. November 2012
 METRO Fiscal Year 2013 Monthly Board Report Revenue Expense Ridership Performance 12/13/2012 Table of Contents Section A Section B Section C Section D Section E Section F Section G Section H Section I
METRO. Fiscal Year Monthly Performance Report. Revenue Expense Ridership Performance. May 2018 (Second Quarter Fiscal Year-to Date)
") METRO Fiscal Year 2018 Monthly Performance Report Revenue Expense Ridership Performance (Second Quarter Fiscal Year-to Date) 6/12/2018 Table of Contents Section A Section B Section C Section D Section
METRO Fiscal Year 2018 Monthly Performance Report Revenue Expense Ridership Performance (Second Quarter Fiscal Year-to Date) 6/12/2018 Table of Contents Section A Section B Section C Section D Section
METRO. Fiscal Year 2013 Monthly Board Report. December 2012 (First Quarter Fiscal Year-to-Date)
") METRO Fiscal Year 2013 Monthly Board Report Revenue Expense Ridership Performance (First Quarter Fiscal Year-to-Date) 1/14/2013 Table of Contents Section A Section B Section C Section D Section E Section
METRO Fiscal Year 2013 Monthly Board Report Revenue Expense Ridership Performance (First Quarter Fiscal Year-to-Date) 1/14/2013 Table of Contents Section A Section B Section C Section D Section E Section
METRO MONTHLY BOARD REPORT
 METRO Revenue Expenses Service Performance Fiscal Year FY2011 Table of Contents Section A Section B Section C Section D Section E Section F Section G Section H Summary Sales Tax Revenue Fare Revenue Operating
METRO. (Fourth Quarter Fiscal Year-to-Date)
") METRO Fiscal Year 2016 Monthly Performance Report Revenue Expense Ridership Performance (Fourth Quarter Fiscal Year-to-Date) 10/25/2016 Table of Contents Section A Section B Section C Section D Section
METRO Fiscal Year 2016 Monthly Performance Report Revenue Expense Ridership Performance (Fourth Quarter Fiscal Year-to-Date) 10/25/2016 Table of Contents Section A Section B Section C Section D Section
METRO. Fiscal Year 2017 Monthly Performance Report. Revenue Expense Ridership Performance. September 2017 (Fourth Quarter Fiscal Year-to Date)
") METRO Fiscal Year 2017 Monthly Performance Report Revenue Expense Ridership Performance (Fourth Quarter Fiscal Year-to Date) 10/13/2017 Table of Contents Section A Section B Section C Section D Section
METRO Fiscal Year 2017 Monthly Performance Report Revenue Expense Ridership Performance (Fourth Quarter Fiscal Year-to Date) 10/13/2017 Table of Contents Section A Section B Section C Section D Section
METRO. Fiscal Year Monthly Performance Report. Revenue Expense Ridership Performance. June 2018 (Third Quarter Fiscal Year-to Date)
") METRO Fiscal Year 2018 Monthly Performance Report Revenue Expense Ridership Performance (Third Quarter Fiscal Year-to Date) 7/12/2018 Table of Contents Section A Section B Section C Section D Section E
METRO Fiscal Year 2018 Monthly Performance Report Revenue Expense Ridership Performance (Third Quarter Fiscal Year-to Date) 7/12/2018 Table of Contents Section A Section B Section C Section D Section E
METRO. Monthly Board Report. June 2006
 METRO Monthly Board Report Operating Capital Service Performance June 26 7/17/26 June 26 MONTHLY BOARD REPORT INDEX Section A Section B Section C Section D Section E Section F Section G Operating Budget
August 31, 2016 Financial Report
 August 31, 2016 Financial Report Capital Metropolitan Transportation Authority 10/14/2016 Table of Contents SUMMARY REPORTS Budgetary Performance - Revenue 2 - Sales Tax Revenue 6 - Operating Expenses
February 2016 Financial Report
 2016 February 2016 Financial Report Capital Metropolitan Transportation Authority 4/13/2016 Table of Contents SUMMARY REPORT Budgetary Performance - Revenue 2 - Sales Tax Revenue 5 - Operating Expenses
Financial Report - FY 2017 Year to Date May 31, 2017
 Financial Report - FY 2017 Year to Date July 19, 2017 1 Major Highlights Revenue Sales tax remittances received through YTD April 2017 are 4.2% higher than YTD April 2016 Plaza Saltillo lease income budgeted
Operating Budget. Third Quarter Financial Report (July 2005 March 2006)
") Third Quarter Financial Report (July 2005 March 2006) INDEX A. Executive Summary...page 2 B. Revenue and Expense Analysis...page 3 C. Budget Variance Reports...page 14 D. Ridership and Performance Measures...page
Third Quarter Financial Report (July 2005 March 2006) INDEX A. Executive Summary...page 2 B. Revenue and Expense Analysis...page 3 C. Budget Variance Reports...page 14 D. Ridership and Performance Measures...page
METRO BOARD OF DIRECTORS Finance and Audit Agenda Working Committee Meeting METRO Board Room, 2 nd Floor March 21, 2016, 8:30 AM
 Thomas C. Lambert PRESIDENT & CEO METRO BOARD OF DIRECTORS Finance and Audit Agenda Working Committee Meeting METRO Board Room, 2 nd Floor March 21, 2016, 8:30 AM COMMITTEE MEMBERS Cindy Siegel, Chair
April 30, 2016 Financial Report
 2016 April 30, 2016 Financial Report Capital Metropolitan Transportation Authority 6/15/2016 Table of Contents SUMMARY REPORT Budgetary Performance - Revenue 2 - Sales Tax Revenue 6 - Operating Expenses
May 31, 2016 Financial Report
 2016 May 31, 2016 Financial Report Capital Metropolitan Transportation Authority 7/13/2016 Table of Contents SUMMARY REPORTS Budgetary Performance - Revenue 2 - Sales Tax Revenue 6 - Operating Expenses
Capital Metropolitan Transportation Authority Monthly Performance & Financial Report For Period Ending October 31, 2012 Soft Close
 Capital Metropolitan Transportation Authority Monthly Performance & Financial Report For Period Ending October 31, 2012 Soft Close Table of Contents SUMMARY REPORT Financial Performance -Sales Tax 3 -Other
FY2018 Third Quarter Financial Update
 Finance and Committee Information Item IV-A May 10, 2018 Third Quarter Financial Update Page 30 of 53 Washington Metropolitan Area Transit Authority Board Action/Information Summary Action Information
BUDGETWATCH October 2018 Flash Report
 October 2018 Flash Report Overall Latest Condition (reporting on operations through September and subsidies through October): Passenger Revenues were slightly below the Forecast in September, marginally
MONTHLY FINANCIAL STATUS JUNE 2018
 (Millions) MONTHLY FINANCIAL STATUS To: Dave Genova, General Manager and CEO ACTION DISCUSSION INFO From: Heather McKillop, CFO and AGM Administration x Date: July 10, VS. BUDGET YTD VS. BUDGET JUNE VS.
MONTHLY FINANCIAL STATUS AUGUST 2018
 (Millions) MONTHLY FINANCIAL STATUS To: Dave Genova, General Manager and CEO ACTION DISCUSSION INFO From: Heather McKillop, CFO and AGM Administration x Date: October 9, VS. BUDGET YTD VS. BUDGET AUGUST
MONTHLY FINANCIAL STATUS JANUARY 2019
 (Millions) MONTHLY FINANCIAL STATUS To: Dave Genova, General Manager and CEO ACTION DISCUSSION INFO From: Heather McKillop, CFO and AGM Administration x Date: March 12, 2019 VS. BUDGET YTD 2019 VS. BUDGET
MONTHLY FINANCIAL STATUS OCTOBER 2018
 (Millions) MONTHLY FINANCIAL STATUS To: Dave Genova, General Manager and CEO ACTION DISCUSSION INFO From: Heather McKillop, CFO and AGM Administration x Date: December 11, VS. BUDGET YTD VS. BUDGET OCTOBER
Capital Metropolitan Transportation Authority Monthly Financial Report For Period Ending November 30, 2013
 Capital Metropolitan Transportation Authority Monthly Financial Report For Period Ending November 30, 2013 Table of Contents SUMMARY REPORT Financial Performance -Sales Tax Revenue 3 -Other Revenue 4 -Operating
Cash & Liquidity The chart below highlights CTA s cash position at March 2017 compared to March 2016.
 To: Chicago Transit Authority Board From: Jeremy Fine, Chief Financial Officer Re: Financial Results for March 2017 Date: May 10, 2017 I. Summary CTA s financial results are $0.6 million favorable to budget
FY2014 Operating Budget Performance Report
 Finance & Administration Committee Information Item IV-C September 11, 2014 FY2014 Operating Budget Performance Report Washington Metropolitan Area Transit Authority Board Action/Information Summary Action
Cash & Liquidity The chart below highlights CTA s cash position at February 2017 compared to February 2016.
 To: Chicago Transit Authority Board From: Jeremy Fine, Chief Financial Officer Re: Financial Results for February 2017 Date: April 5, 2017 I. Summary CTA s financial results are $0.3 million favorable
Operating Budget. Second Quarter Financial Report
 Second Quarter Financial Report INDEX A. Executive Summary... A-1 B. Revenue and Expense Analysis... B-1 C. Budget Variance Reports... C-1 D. Ridership and Performance Measures... D-1 Board Budget Committee
- II OPERATING BUDGET REPORT ^ H FY2013 ^^ H. ««-ms. I ~?j i... \6.3 j^^^^^^ YTD OVERTIME BUDGET VS ACTUAL ($ in Millions) 1
 1") OPERATING BUDGET REPORT ^ H FY2013 ^^ H OPERATING BUDGET($ in Millions) MTD Revenue Expense Subsidy Cost Recovery YTD Revenue Expense Subsidy Cost Recovery Jan-FY2012 Jan-FY2013 Variance FY13 Actual Actual
OPERATING BUDGET REPORT ^ H FY2013 ^^ H OPERATING BUDGET($ in Millions) MTD Revenue Expense Subsidy Cost Recovery YTD Revenue Expense Subsidy Cost Recovery Jan-FY2012 Jan-FY2013 Variance FY13 Actual Actual
Financial Management Report... 3
 November 13, 2013 Table of Contents Financial Management Report... 3 OPERATING FUNDS STATEMENT OF REVENUES & EXPENSES... 3 METROPOLITAN COUNCIL INVESTMENT PERFORMANCE SHORT-TERM PORTFOLIO... 4 METROPOLITAN
Cash & Liquidity The chart below highlights CTA s cash position at September 2017 compared to September 2016.
 To: Chicago Transit Authority Board From: Jeremy Fine, Chief Financial Officer Re: Financial Results for September 2017 Date: November 15, 2017 I. Summary CTA s financial results are $7.7 million favorable
FY2014 Capital and Operating Budget Discussion
 Finance & Administration Committee Information Item III-B December 6, 2012 FY2014 Capital and Operating Budget Discussion Page 18 of 44 Washington Metropolitan Area Transit Authority Board Action/Information
BUDGETWATCH March 2019 Flash Report
 March 2019 Flash Report Overall Latest Condition (reporting on operations through February and subsidies through March): Overall, YTD preliminary net results were favorable mainly reflecting lower operating
Financial Report Fiscal Year 2018
 Financial Report Fiscal Year 2018 Year to Date March 31, 2018 Presented on May 21, 2018 1 Major Highlights Revenue FY2018 sales tax revenue budgeted at 2.5% growth over FY2017 Sales tax remittances received
The year to date is less than budget and prior year by 15.4 million and 11.6 million, respectively.
 To: Chicago Transit Authority Board From: Jeremy Fine, Chief Financial Officer Re: Financial Results for September 2016 Date: November 16, 2016 I. Summary CTA s financial results are $0.3 million unfavorable
Cash & Liquidity The chart below highlights CTA s cash position at December 2017 compared to December 2016.
 To: Chicago Transit Authority Board From: Jeremy Fine, Chief Financial Officer Re: Financial Results for December 2017 Date: February 14, 2018 I. Summary CTA s financial results are $4.7 million favorable
Cash & Liquidity The chart below highlights CTA s cash position at June 2018 compared to June 2017.
 To: Chicago Transit Authority Board From: Jeremy Fine, Chief Financial Officer Re: Financial Results for June 2018 Date: August 15, 2018 I. Summary CTA s financial results are unfavorable to budget for
Approval of Proposed FY 2019 Annual Budget and 20-Year Financial Plan
 Approval of Proposed FY 2019 Annual Budget and 20-Year Financial Plan Committee of the Whole September 18, 2018 Joseph G. Costello Senior Vice President, Finance 0 Board Calendar Date Subject July 10 Draft
BUDGETWATCH May 2018 Flash Report
 May 2018 Flash Report Overall Latest Condition (reporting on operations through April and subsidies through May): Passenger revenues were $15.1 million unfavorable in April, increasing the unfavorable
Cash & Liquidity The chart below highlights CTA s cash position at August 2018 compared to August 2017.
 To: Chicago Transit Authority Board From: Jeremy Fine, Chief Financial Officer Re: Financial Results for August 2018 Date: October 10, 2018 I. Summary CTA s financial results are favorable to budget for
MONTHLY FINANCIAL STATUS MAY 2018
 (Millions) MONTHLY FINANCIAL STATUS To: Dave Genova, General Manager and CEO ACTION DISCUSSION INFO From: Heather McKillop, CFO and AGM Administration x Date: July 10, VS. BUDGET YTD VS. BUDGET MAY VS.
MONTHLY FINANCIAL STATUS APRIL 2018
 (Millions) MONTHLY FINANCIAL STATUS To: Dave Genova, General Manager and CEO ACTION DISCUSSION INFO From: Heather McKillop, CFO and AGM Administration x Date: June 19, VS. BUDGET YTD VS. BUDGET APRIL VS.
BUDGETWATCH April 2019 Flash Report
 April 2019 Flash Report Overall Latest Condition (reporting on operations through March and subsidies through April): Due to the early scheduling of the Finance Committee meeting, first-close preliminary
FISCAL YEAR 2014 BUSINESS PLAN & BUDGET
 M E TROPOLITAN TRANS IT AU THO RITY O F HARRIS C O U N TY, TEX AS FISCAL YEAR 2014 BUSINESS PLAN & BUDGET GROWING RIDERSHIP FINAL 09/27/13 1:38 PM September 12, 2013 Gilbert Andrew Garcia Chairman of the
FUEL PRICE RISK MANAGEMENT POLICY REPORT "FUEL HEDGE"
 FUEL PRICE RISK MANAGEMENT POLICY REPORT "FUEL HEDGE" Sep-18 FUEL PRICE RISK MANAGEMENT POLICY REPORT Sep-18 (Office of Management and Budget 09/30/2018) The Fuel Price Risk Management Policy approved
Operating Budget Report
 Operating Budget Report MTD Operating Budget ($ in Millions) Sept-FY2012 Sept-FY2013 Variance FY13 Actual Actual Budget $ Percent $140M Operating Expenditures ($ in Millions) Revenue $ 67 $ 68 $ 71 $ (3)
TSCC Budget Review TriMet
 TSCC Budget Review 2017-18 TriMet 1. Introduction to the District: The Tri-County Metropolitan Transportation District (TriMet) boundary covers about 575 square miles of the urban portions of Multnomah,
FY2008 Quarterly Financial & Management Report
 FY2008 Quarterly Financial & Management Report INDEX Page Highlights Strategic Response to Increased Ridership 2 Vanpool Routes Added to Address Growth in Customer Demand 2 Concent Agreement Finalized
BUDGETWATCH March 2018 Flash Report
 March 2018 Flash Report Overall Latest Condition (reporting on operations through February and subsidies through March): Passenger revenues were $6 million unfavorable in February, increasing the unfavorable
BUDGETWATCH September 2018 Flash Report
 September 2018 Flash Report (Forecast figures in this report refer to the 2018 Forecast) Overall Latest Condition (reporting on operations through August and subsidies through September): For reporting
Cash & Liquidity The chart below highlights CTA s cash position at January 2018 compared to January 2017.
 To: Chicago Transit Authority Board From: Jeremy Fine, Chief Financial Officer Re: Financial Results for January 2018 Date: March 14, 2018 I. Summary CTA s financial results are $1.7 million unfavorable
BUDGETWATCH April 2015 Flash Report
 BUDGETWATCH April 2015 Flash Report Summary of March Budgetwatch (reporting on operations through February and subsidies through March): Overall, results through March were favorable mainly as a result
Capital Metropolitan Transportation Authority
 Capital Metropolitan Transportation Authority Monthly Performance Report (Covering Performance Data Through March and April 2010) Capital Metropolitan Transportation Authority 1 Performance Report Contents
FUEL PRICE RISK MANAGEMENT POLICY REPORT "FUEL HEDGE"
 FUEL PRICE RISK MANAGEMENT POLICY REPORT "FUEL HEDGE" December 2018 FUEL PRICE RISK MANAGEMENT POLICY REPORT December 2018 The Fuel Price Risk Management Policy approved by the Board on February 16, 2006
Operating Budget Stability
 Operating Budget Stability March Financial Update Report to Agenda Executive Summary March Performance Against FY16 Budget March Performance Against Same Period Last Year Appendix Financial Detail: March
Washington Metropolitan Area Transit Authority Metro Budget Overview
 Washington Metropolitan Area Transit Authority Metro Budget Overview February 2011 Metro 10,877 Employees (10,974 budgeted) 1,491 Buses 588 Escalators and 237 Elevators 106 Miles of Track 92 Traction Power
OPERATING BUDGET REPORT
 OPERATING BUDGET REPORT OPERATING BUDGET ($ in Millions) MTD Nov-FY2012 Nov-FY2013 Actual Actual Budget $ Percent Revenue $ 63.0 $ 65.7 $ 68.3 $ (2.7) -3.9% Expense $ 107.6 $ 124.8 $ 129.8 $ 5.0 3.8% Subsidy
Jul Aug Sept Oct Nov Dec Jan Feb Mar Apr May Jun
 REVENUE AND RIDERSHIP 4th Quarter FY2014 REVENUE (in Millions) $90M $85M $80M $75M $70M $65M $60M $55M $50M 79 77 74 74 72 70 FY2013 Actual FY2014 Budget FY2014 Actual 79 85 78 78 77 67 66 70 59 67 65
Operating Budget Report
 Operating Report Operating ($ in Millions) Operating Expenditures ($ in Millions) Jun-11 Jun-12 $ Percent Revenue $ 212,640 $ 217,643 $ 214,671 $ 2,973 1% Expense $ 359,102 $ 361,882 $ 366,332 $ 4,450
VALLEY METRO RPTA FY18 Budget EXECUTIVE SUMMARY
 VALLEY METRO RPTA FY18 Budget EXECUTIVE SUMMARY FY18 ADOPTED ANNUAL OPERATING AND CAPITAL BUDGET Valley Metro Regional Public Transportation Authority (RPTA) provides public transportation services for
Operating Budget Report
 Operating Budget Report MTD Operating Budget ($ in Millions) Oct-FY2012 Oct-FY2013 Variance FY13 Actual Actual Budget $ Percent $140M Operating Expenditures ($ in Millions) Revenue $ 67 $ 70 $ 79 $ (8)
Approval of Proposed FY 2019 Annual Budget and 20-Year Financial Plan
 Approval of Proposed FY 2019 Annual Budget and 20-Year Financial Plan Committee of the Whole September 11, 2018 Joseph G. Costello Senior Vice President, Finance 0 Board Calendar Date Subject July 10 Draft
BUDGETWATCH September 2014 Flash Report
 BUDGETWATCH September 2014 Flash Report (Forecast figures in this report, except the Summary of June Budgetwatch, refer to the 2014 Forecast) Summary of June Budgetwatch (reporting on operations through
~ NOTICE OF MEETING ~ CAPITAL METROPOLITAN TRANSPORTATION AUTHORITY BOARD OF DIRECTORS FINANCE, AUDIT AND ADMINISTRATION COMMITTEE MEETING
 ~ NOTICE OF MEETING ~ CAPITAL METROPOLITAN TRANSPORTATION AUTHORITY BOARD OF DIRECTORS FINANCE, AUDIT AND ADMINISTRATION COMMITTEE MEETING 2910 East Fifth Street Austin, TX 78702 ~ AGENDA ~ Monday, April
Spokane Transit Authority Adopted 2019 Operating and Capital Budgets. November 15, 2018 Board Meeting Resolution Number:
 Spokane Transit Authority Adopted 2019 Operating and Capital Budgets November 15, 2018 Board Meeting Resolution Number: 764-18 Vision Vision/Mission We aspire to be a source of pride for the region. Mission
BUDGETWATCH March 2016 Flash Report
 March 2016 Flash Report Summary of February Budgetwatch (reporting on operations through January and subsidies through February): Overall results through February were slightly favorable. Net operating
Cash & Liquidity The chart below highlights CTA s cash position at July 2016 compared to July 2015.
 To: Chicago Transit Authority Board From: Jeremy Fine, Chief Financial Officer Re: Financial Results for July 2016 Date: September 14, 2016 I. Summary CTA s financial results are $0.4 million favorable
Operating Budget Report
 Operating Budget Report Operating Budget ($ in Millions) Operating Expenditures ($ in Millions) MTD May-FY2011 May - FY2012 Variance FY12 Actual Actual Budget $ Percent $140M Revenue $ 68,140 $ 70,480
SUBJECT: October Monthly Financial Reports ^ DATE: December 22, 2011
 MEMORANDUM SUBJECT: October Monthly Financial Reports ^ DATE: December 22, 2011 FROM: DGMA/CFO - Carol Dillon Kissa TO: GM/CEO - Richard Sarles A I am enclosing for your review the October financial report.
BUDGETWATCH February 2016 Flash Report
 February 2016 Flash Report Overall Latest Condition (reporting on operations for January and subsidies through February): Overall, preliminary results were on target for the month and slightly favorable
FY17 FY16 Valley Metro RPTA Sources of Funds FY17 vs FY16
 FY17 ADOPTED ANNUAL OPERATING AND CAPITAL BUDGET Valley Metro Regional Public Transportation Authority (RPTA) provides public transportation services for Maricopa County located in the metro Phoenix, Arizona.
ACTUAL * COR ADMINISTRATION TARGETS * 2017 Target vs 2016 Target a) Number of New COR Registrations % Year (a)
 Number of New COR Registrations % Year (a)") 23-Jun-16 Date Prepared Section 1(a): BUDGET - COR ACTIVITIES ACTUAL * COR ADMINISTRATION TARGETS * # Variance (b-a) % Variance (b/a) (12 months) 2016 YTD (6 months) Year 1 Year 2 2016 (a) Year 3 2017
23-Jun-16 Date Prepared Section 1(a): BUDGET - COR ACTIVITIES ACTUAL * COR ADMINISTRATION TARGETS * # Variance (b-a) % Variance (b/a) (12 months) 2016 YTD (6 months) Year 1 Year 2 2016 (a) Year 3 2017
Pre-Existing Condition Insurance Plan Washington State (PCIP-WA) January 2012 Financial Review
 January 2012 Financial Review") Pre-Existing Condition Insurance Plan Washington State (PCIP-WA) January 2012 Financial Review 1. Financial Statements January 2012 U Sheet Due to the timing of the HHS reimbursement receipts, there is
Pre-Existing Condition Insurance Plan Washington State (PCIP-WA) January 2012 Financial Review 1. Financial Statements January 2012 U Sheet Due to the timing of the HHS reimbursement receipts, there is
Pre-Existing Condition Insurance Plan Washington State (PCIP-WA) February 2012 Financial Review
 February 2012 Financial Review") Pre-Existing Condition Insurance Plan Washington State (PCIP-WA) February 2012 Financial Review 1. Financial Statements February 2012 U Sheet Due to the timing of the HHS reimbursement receipts, there
Pre-Existing Condition Insurance Plan Washington State (PCIP-WA) February 2012 Financial Review 1. Financial Statements February 2012 U Sheet Due to the timing of the HHS reimbursement receipts, there
Cash & Liquidity The chart below highlights CTA s cash position at March 2018 compared to March 2017.
 To: Chicago Transit Authority Board From: Jeremy Fine, Chief Financial Officer Re: Financial Results for March 2018 Date: May 9, 2018 I. Summary CTA s financial results are $0.9 million favorable to budget
Capital Metropolitan Transportation Authority
 Capital Metropolitan Transportation Authority # Monthly Performance Report Capital Metropolitan Transportation Authority 1 Performance Report Contents Page Financial Performance 3 -- Sales Tax 3 -- Cost
BUDGETWATCH January 2018 Special 2017 Year-End Flash Report
 January 2018 Special 2017 Year-End Flash Report Overall The January Budgetwatch is a flash look focusing on some very preliminary 2017 actual revenue results, along with debt service, compared with the
General Mobility Program Board Proposals: Possible Scenarios
 General Mobility Program Board Proposals: Possible Scenarios Friday - August 3, 2012 Starting Point Assumptions: Inside METRO Maintain current bus service hours overall Complete three planned Park & Ride
BUDGETWATCH May 2017 Flash Report
 May 2017 Flash Report Summary of April Budgetwatch (reporting on operations through March and subsidies through April): Overall, results were favorable for the month, and remained favorable YTD. Passenger
Financial Report Fiscal Year 2018
 Financial Report Fiscal Year 2018 Year to Date December 31, 2017 Presented on February 14, 2018 1 Major Highlights Revenue FY2018 sales tax revenue budgeted at 2.5% growth over FY2017 Sales tax remittances
Performance Management Accountability Meeting Data as of October, 2012
 Performance Management Accountability Meeting Data as of October, 2012 Richard A. Davey, Secretary & CEO Office of Performance Management and Innovation Celia J. Blue, Assistant Secretary November 27,
M Aug sept OCt Nov Dec ~ FtIb ~ ~ ~
 Ill. $14OM FY2012 Actual _ FY2013 Budget _ FY2013 Actual $13OM $11OM $l00m $9OM $10M Jul Aug sept OCt Nov Dec Jan FtIb Mar May Jun As of December YID, Metro Is favorable to budget by $S.OM, or 1.4%. Year-to-date
GENERAL MOBILITY PROGRAM
 GENERAL MOBILITY PROGRAM Current Proposals: Transit Implications Greater Houston Partnership Transportation Policy Advisory Committee Friday - July 27, 2012 1 Member Entities Spring Valley Village Humble
Pre-Existing Condition Insurance Plan Washington State (PCIP-WA) June 2014 Financial Review
 June 2014 Financial Review") Pre-Existing Condition Insurance Plan Washington State (PCIP-WA) June 2014 Financial Review 1. Financial Statements June 2014 U Sheet Cash on Hand at the end of June 2014 is $14 K. The entire $14 K is
Pre-Existing Condition Insurance Plan Washington State (PCIP-WA) June 2014 Financial Review 1. Financial Statements June 2014 U Sheet Cash on Hand at the end of June 2014 is $14 K. The entire $14 K is
Pre-Existing Condition Insurance Plan Washington State (PCIP-WA) June 2013 Financial Review
 June 2013 Financial Review") Pre-Existing Condition Insurance Plan Washington State (PCIP-WA) June 2013 Financial Review 1. Financial Statements June 2013 U Sheet Due to the timing of the HHS reimbursement receipts, there is no available
Pre-Existing Condition Insurance Plan Washington State (PCIP-WA) June 2013 Financial Review 1. Financial Statements June 2013 U Sheet Due to the timing of the HHS reimbursement receipts, there is no available
PimaCountyCommunityCollegeDistrict Board of Governors 4905C East Broadway/Tucson, Arizona INFORMATION REPORT
 PimaCountyCommunityCollegeDistrict Board of Governors 4905C East Broadway/Tucson, Arizona 85709-1010 INFORMATION REPORT Meeting Date: 9/14/16 Item Number: 2.1 Item Title Financial Report July 2016 Financial
VIIl. Agency Financial Plans and 12-Month Allocations
 VIIl. Agency Financial Plans and 12-Month Allocations New York City Transit MTA NEW YORK CITY TRANSIT FEBRUARY FINANCIAL PLAN FOR 2006-2009 2005 FINAL ESTIMATE AND ADOPTED BUDGET FOR 2006 In accordance
Capital Improvement Program Update
 Finance & Administration Committee Information Item III-A May 12, 2011 Capital Improvement Program Update Washington Metropolitan Area Transit Authority Board Action/Information Summary Action Information
Revised 2011 Draft Operating and Capital Budgets
 Revised 2011 Draft Operating and Capital Budgets Board Meeting & Public Hearing November 17, 2010 Spokane Transit: Revised 2011 Draft Operating and Capital Budgets 1 Mission We are dedicated to providing
FY2017 Year-End Financial Update
 Finance Committee Information Item III-A September 14, 2017 FY2017 Year-End Financial Update Washington Metropolitan Area Transit Authority Board Action/Information Summary Action Information MEAD Number:
Pre-Existing Condition Insurance Plan Washington State (PCIP-WA) November 2014 Financial Review
 November 2014 Financial Review") Pre-Existing Condition Insurance Plan Washington State (PCIP-WA) November 2014 Financial Review 1. Financial Statements November 2014 U Sheet Due to the timing of the HHS reimbursement receipts, there
Pre-Existing Condition Insurance Plan Washington State (PCIP-WA) November 2014 Financial Review 1. Financial Statements November 2014 U Sheet Due to the timing of the HHS reimbursement receipts, there
SHAKER HEIGHTS BOARD OF EDUCATION SHAKER HEIGHTS, OHIO. April 12, Members, Shaker Heights Board of Education
 SHAKER HEIGHTS BOARD OF EDUCATION SHAKER HEIGHTS, OHIO TO: FROM: SUBJECT: Members, Shaker Heights Board of Education Bryan C. Christman, Treasurer Financial and Miscellaneous Briefs I. GENERAL FUND (As