FISCAL YEAR 2014 BUSINESS PLAN & BUDGET
|
|
|
- Lily Davis
- 5 years ago
- Views:
Transcription


1 M E TROPOLITAN TRANS IT AU THO RITY O F HARRIS C O U N TY, TEX AS FISCAL YEAR 2014 BUSINESS PLAN & BUDGET GROWING RIDERSHIP FINAL 09/27/13 1:38 PM
2 September 12, 2013 Gilbert Andrew Garcia Chairman of the Board Metropolitan Transit Authority Dear Mr. Garcia: Please find the attached proposed FY2014 Business Plan & Budget for METRO, which includes both the Operating and Capital Budgets, as well as the General Mobility Budget, and the Debt Service Budget. Section of the Texas Transportation Code requires the Board of Directors of the Metropolitan Transit Authority of Harris County to adopt an annual budget which specifies major expenditures by type and amount prior to commencement of a fiscal year. In accordance with the code, we have prepared the proposed FY2014 Business Plan & Budget for the Board s consideration at its September meeting. The annual budgets represent the maximum annual expenditure authorized by the Board to fund METRO s FY2014 business plan. In accordance with Board approved procedures, it is recommended that the Board adopt the following budgets for the Metropolitan Transit Authority of Harris County for Fiscal Year 2014 (October 1, 2013 September 30, 2014) Operating Budget $ 487,393,187 General Mobility Budget $ 160,120,730 Capital Budget $ 512,924,000 Debt Service $ 80,198,494 A Public Hearing on the proposed FY2014 Business Plan & Budget is scheduled to be held at 8:30am on Thursday, September 26, 2013 in the 2 nd Floor Board Room of the METRO Administration Building. The proposed FY2014 Business Plan & Budget is scheduled for approval by the Board at the regular September meeting scheduled later that day, September 26, 2013, at 9:00am. Sincerely, Thomas C. Lambert Interim President & CEO cc: Board of Directors
3 Table of Contents Executive Summary... 1 Service Summary... 4 Overview Data... 6 Ridership & Service... 6 Workforce Financials Year-to-Year Budget Comparison Financials Five Year Cash Flow Projections Operating Budget Capital Budget METRORail Expansion Capital Improvement Program General Mobility Budget Debt Service Budget Department Budgets Key Performance Indicators... 53

4 1 Executive Summary In FY2014, the New METRO will renew its focus on its most basic task, which is to provide quality transit services within the region. Ridership, Ridership, Ridership METRO will take a back to basics approach towards its mission and bolster its core business with tactical investments. This means more investment in fixed-route bus and rail services as well as METROLift, the Authority s paratransit service. METRO will also increase investments in its customer support functions, ensuring that patrons are safe and have the information and resources needed for a first-class customer experience. This also means more investment in security and safety as well as customer information centers, call centers, and information technologies. Campaigns directly addressing ridership On top of its financial and internal investments, the New METRO is also actively planning and implementing new market-based strategies in FY2014 to generate ridership. These upcoming initiatives in FY2014 include: increasing seating capacity through the re-introduction of articulated buses and additional rail cars; the re-introduction of the Day Pass; and service adjustments to address customer overloads. The New METRO will also continue to look at its services and operations from a long-term perspective through its program of System Reimagining which began in FY2013. This endeavor involves a complete rethinking of the local bus network with a blank slate approach. The goal is to make sure the New METRO is in tune with the changing demographics and regional trends of its service area and is operating the most optimal types of transit services for the betterment of the region. Opening three new rail lines All the above initiatives will of course complement the exciting early openings of the North extension of the Red (Main Street) rail line, scheduled for revenue service in December; as well as the opening of the Green (East End) and Purple (Southeast) rail lines, scheduled for revenue service in the fourth quarter FY2014. The opening of these lines continues to involve focused planning and coordination. 1
 111 213 TOTAL 487 160 80 314-67 131 114 1,354")
5 2 FY2014 Budget Highlights Fiscal Year 2014 Sources of METRO Funds ( in millions) Operations General Mobility Debt Service METRORail Expansion FY13 Bus Replacements FY14 Bus/Van Replacements Capital Improvement Reserves TOTAL Sales Tax Grants* Farebox Borrowing Other Fund Balance 153 (52) TOTAL ,354 *Many expenses that accounting rules classify as operating costs are eligible as capital expenses in the 5307 formula grant program. A number of elements regarding the FY2014 Budget merit special notice: The total proposed budget for FY2014 including fund balance is $1.4 billion, a decrease of $150 million or 10% under the projected FY2013 funding envelope. a financial plan based on a conservative 5.75% sales tax growth rate; no increase in base fares. The FY2014 operating budget also proposes a methodical approach towards implementing METRO s business plan, where all increases are evaluated based on: 2
6 3 1. Budget base: continuing current operations as-is with any planned programmatic or contractual changes; 2. Rail increment: applying additional resources directly related to the opening of the three new rail lines; 3. New non-rail requirements: strategic investments in the core business which improve the New METRO s ability to meet its goals. With this method as a guide to planning this budget: The total FY2014 proposed workforce is 3,726. FY2013 Workforce Proposed FY2014 3,610 Base 3,580 New non-rail requirements 8 Rail increment 138 The total FY2014 proposed operating budget is $487.4 million or +9.5% higher than FY2013. FY2013 Operating Budget Proposed FY2014 $445 million Base budget increase $21.1 million +4.7% New non-rail requirements 5.7 million +1.3% Rail increment 15.6 million +3.5% The total FY2014 proposed Capital Budget is $512.9 million, which represents a 44% decrease in spending for METRORail Expansion as the Authority moves closer to completing the three new rail lines as well as a 24% increase in the Capital Improvement Program (CIP) as it refocuses on back to basics investments. The total FY2014 proposed General Mobility Budget is $160.1 million, which shows a 2% reduction from the prior year since METRO has successfully paid off all the remaining carryover balances to its community partners in FY2013. The total FY2014 proposed Debt Service Budget is $80.2 million, a 2% increase from the prior year, which provides funds to make principal and interest payments on METRO s outstanding bonds, contractual obligations, and commercial paper. In Conclusion Simply put, the New METRO s top priorities for FY2014 are improving ridership and completing the three light rail lines. METRO staff looks forward to working with the Board in implementing policies and actions to grow ridership in FY2014 while going back to the basics on delivering quality transit services. 3

7 4 Service Summary Local Bus Park & Ride/ Commuter Services Bikes on Buses METROLift METRORail HOV + HOT Lanes METRO STAR Motorist Assistance Program (MAP) METRO provides bus, light rail, High Occupancy Vehicle lanes and other transit services to the City of Houston, 14 other incorporated Cities, and parts of unincorporated Harris County, a service area of approximately 3.5 million people. Houston is the nation's fourth largest city and the Houston metro area is the nation's sixth largest metro area. 4
8 5 Transit System The Authority is organized to develop, operate, and maintain a mass transit system to serve the residents within and visitors to its service area. The focus of the FY2014 Transit Service Plan is to identify operational cost savings and reinvest those savings into expanded and realigned bus service. To achieve this objective, the Plan focuses on reducing duplicate service, matching vehicle type with service needs, and extending existing bus routes to better connect communities to the larger transit network. The plan factors in the three new METRORail lines under construction and begins to realign our bus services to take advantage of these high-quality transit services in the North, East and Southeast areas of Houston. The Authority s transit system is multi-modal, with the following components: Bus System - The Authority provides public bus service within its service area utilizing a fleet of approximately 1,248 buses, which includes the Greenlink CNG buses, 118 METROLift paratransit service vans, plus passenger facilities, including 9,898 active bus stops, and 34,159 parking spaces. METRO buses ran 58 million revenue miles in a service area of 1,286 square miles with approximately 81 million boardings in FY2013. HOV/HOT Lane System - The High Occupancy Vehicle (HOV) lane program is a cooperative effort between the Texas Department of Transportation (TxDOT) and METRO, which is funded through a combination of federal, state and local resources. As of September 2013, METRO has 141 miles of HOV/HOT lanes on Houston freeways. For FY2013, the projected HOV/HOT lane ridership is about 26.6 million. Light Rail System - The Authority s first light rail line began operation on January 1, This 7.5-mile line originates in the northern part of Houston s Central Business District and continues south through Midtown, the Museum District, the Texas Medical Center and the Reliant Park Complex to the Fannin South Park & Ride Lot. There are 16 stations along the route. The Authority is currently building three additional light rail lines. METRO will open an additional 14.2 miles of light rail lines by fall of 2014, with an additional 1.0 mile on the East End Line upon completion of the Hughes underpass. The North Line will be the first of these new lines to open in December of With these additional lines, METRO s total light rail miles will be Paratransit Service - The Authority s METROLift paratransit service provided service to 17,745 registrants using both METRO-owned lift-equipped vans and contractor-owned and operated accessible minivans in FY2013. Commuter Vanpool Service In FY2013, the Authority s METRO STAR commuter vanpool service had 720 vanpools, taking approximately 2.5 million trips annually with approximately 7,189 riders. In FY2014, the Authority is estimating 2.5 million trips annually, with approximately 7,205 riders; making METRO STAR one of the largest vanpool programs in the nation. 5
9 6 Projected Ridership Category FY2014 Budgeted FY2013 Estimate Change % Change Fixed Routes 85,003,372 80,540, ,463, % Customized Services Total Bus and Rail 4,267,518 4,204, , % 89,270,890 84,744, ,526, % Note: The chart above measures the change in system ridership between FY2013 estimate and FY2014 budgeted levels. 6
10 7 Boardings by Service Category Budget to Budget FY2012 FY2013 FY2013 FY2014 Variance Actual Budget Estimate Budget # % Fixed Route Bus Local 58,067,351 55,608,540 60,779,250 63,534,211 7,925, % Park & Ride 7,394,535 7,077,204 7,956,632 8,332,325 1,255, % Subtotal Fixed Route Bus 65,461,886 62,685,744 68,735,882 71,866,536 9,180, % METRORail* 11,309,468 11,638,566 11,393,285 12,713,362 1,074, % Subtotal Fixed Route 76,771,354 74,324,310 80,129,167 84,579,898 10,255, % Special Events ** 365, , , , , % Total Fixed Route 77,136,902 74,458,538 80,540,307 85,003,372 10,544, % Customized Bus Services METROLift 1,668,631 1,666,455 1,709,772 1,761,180 94, % METRO STAR Vanpool 2,411,533 2,501,955 2,490,424 2,502, % Internal Service 3,777 3,835 3,835 3, % Subtotal Customized Bus 4,083,941 4,172,245 4,204,031 4,267,518 95, % Subtotal Bus and Rail 81,220,843 78,630,783 84,744,338 89,270,890 10,640, % HOV/HOT Carpools, Vanpools, and Non-METRO Buses 24,698,658 26,185,422 26,603,100 27,295,000 1,109, % *Increase in rail ridership is due to the early opening of the North Line light rail. **Special Events is a category that reflects customer service-oriented short-term additional motor bus and rail service provided for events at Reliant Park, such as football games and the Houston Livestock Show and Rodeo. Note: The chart above measures the change in system ridership between FY2013 estimate and FY2014 budgeted levels. 7
11 8 FY2014 Service Levels Budget Service Plan Fixed Route Customized Service Contracted Contracted Special Total Bus Internal METRO Resources METRO Bus Bus Alternative* Events Total Bus Rail and Rail Service METROLift STAR Revenue Miles 32,251,511 8,471,942 1,140,385 22,337 41,886,175 1,193,100 43,079,275 4,432 17,410,597 - Revenue Hours 2,220, ,518 83,773 2,259 2,864,077 97,606 2,961, ,017,409 - Total Miles 38,276,673 10,536,565 1,303,539 22,337 50,139,114 1,200,534 51,339,648 4,432 20,185,987 - Total Hours 2,461, ,416 90,505 2,259 3,183,471 98,694 3,282, ,133,794 - Number of Vans 720 FY2013 Service Levels Estimate Fixed Route Customized Service Contracted Contracted Special Total Bus Internal METRO Resources METRO Bus Bus Alternative* Events Total Bus Rail and Rail Service METROLift STAR Revenue Miles 32,204,903 8,326, ,174 22,337 41,017, ,122 41,784,780 4,432 16,324,319 - Revenue Hours 2,236, ,567 36,799 2,259 2,822,505 64,970 2,887, ,185 - Total Miles 38,070,383 10,290, ,492 22,337 48,945, ,616 49,719,422 4,432 18,969,348 - Total Hours 2,470, ,679 40,795 2,259 3,130,588 65,846 3,196, ,084,070 - Number of Vans 717 FY2013 Service Levels Budget Fixed Route Customized Service Contracted Contracted Special Total Bus Internal METRO Resources METRO Bus Bus Alternative* Events Total Bus Rail and Rail Service METROLift STAR Revenue Miles 32,163,175 8,045, ,591 22,337 40,968, ,881 41,735,606 4,432 15,870,617 - Revenue Hours 2,219, ,709 58,999 2,259 2,806,665 64,916 2,871, ,246 - Total Miles 37,929,699 9,947, ,384 22,337 48,786, ,443 49,559,802 4,432 18,405,790 - Total Hours 2,452, ,688 65,081 2,259 3,113,496 65,790 3,179, ,014,985 - Number of Vans 757 Note: Contracted Alternative service reflects fixed route bus service delivered with the use of smaller, more efficient vehicles. 8
12 9 Change to Service Levels: FY2013 Estimate to FY2014 Proposed Budget Fixed Route Customized Service Contracted Contracted Special Total Bus Internal METRO Resources METRO Bus Bus Alternative Events Total Bus Rail and Rail Service METROLift STAR Revenue Miles 46, , , , , ,539-1,086,278 - Revenue Hours -16,353 10,951 46,974-41,572-32,636 8,936-44,224 - Total Miles 206, , ,047-1,193, , ,390-1,216,639 - Total Hours -9,564 12,737 49,710-52,883-32,848 20,035-49,724 - Number of Vans 3 Fixed Route Customized Service Contracted Contracted Special Total Bus Internal METRO Resources METRO Bus Bus Alternative Events Total Bus Rail and Rail Service METROLift STAR Revenue Miles 0.14% 1.75% % % % 1.06% % - Revenue Hours -0.73% 2.00% % % % 0.31% % - Total Miles 0.54% 2.39% % % % 1.54% % - Total Hours -0.39% 2.07% % % % 0.63% % - Number of Vans 0.42% Change to Service Levels: FY2013 Budget to FY2014 Proposed Budget Fixed Route Customized Service Contracted Contracted Special Total Bus Internal METRO Resources METRO Bus Bus Alternative Events Total Bus Rail and Rail Service METROLift STAR Revenue Miles 88, , , , ,219 1,343,669-1,539,980 - Revenue Hours ,809 24,774-57,412 32,690 90,102-91,163 - Total Miles 346, , ,155-1,352, ,091 1,779,846-1,780,197 - Total Hours 8,824 35,728 25,424-69,975 32, , ,809 - Number of Vans -37 Fixed Route Customized Service Contracted Contracted Special Total Bus Internal METRO Resources METRO Bus Bus Alternative Events Total Bus Rail and Rail Service METROLift STAR Revenue Miles 0.27% 5.30% % 55.58% 3.22% % - Revenue Hours 0.04% 6.05% % 50.36% 3.14% % - Total Miles 0.91% 5.92% % 55.22% 3.59% % - Total Hours 0.36% 6.02% % 50.01% 3.24% % - Number of Vans -4.89% 9
13 10 Workforce by Department FY2012 FY2013 FY2014 Current Authority Auth. Actual Auth. Auth. Executive Office Government & Public Affairs Service Delivery Service Delivery Union 2,183 2,166 2,254 2,267 Service Delivery Non-Union Service Design & Development Capital Programs Capital Programs Union Capital Programs Non-Union Chief Admin. Office Chief Admin. Officer Union Chief Admin. Officer Non-Union METRO Police Safety Legal Finance Audit Total Union 2,338 2,317 2,409 2,462 Total Non-Union 1,124 1,079 1,201 1,264 Total Workforce 3,462 3,396 3,610 3,726 Auth. = Number of authorized full-time and part-time positions at the end of the year. 10
14 11 Workforce Summary FY2013 EOY Department Workforce * Baseline Rail Increment FY2014 New Requirements Total Service Delivery 2,759 2, ,778 Executive VP METRO Police Service Design & Development Government & Public Affairs Safety Capital Programs Finance Legal Audit Executive Total Workforce 3,610 3, ,726 The Workforce by Department chart above reflects all positions that will be added to the budget as a result of the implementation of the three new LRT lines from the METRORail Program and to improve the current service levels with Ridership as the focal point throughout FY2014. These increments are predominantly within the Service Delivery Rail Operations Division, METRO Police, Facilities Maintenance and Finance. 11
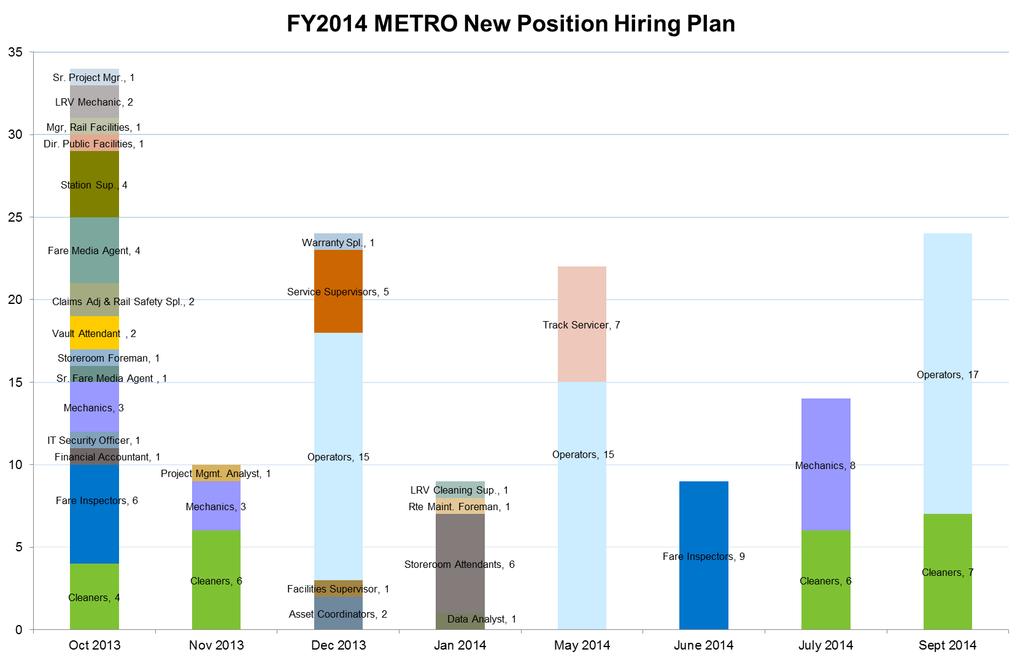
15 12 FY2014 Operating Budget Workforce Additions Department Position Rail Increment Service Delivery LRV Operators 47 Service Delivery LRV Servicer 4 Service Delivery LRV Mechanic 2 Service Delivery LRV Servicer 7 Procurement & Materials Storeroom Attendants 6 Procurement & Materials Storeroom Foreman 1 Facilities Maintenance Cleaners 19 Facilities Maintenance Mechanics 14 New Requirements Total Union Service Delivery Warranty Specialist 1 Service Delivery Senior Project Mgr. 1 Service Delivery Field Supervisor 4 Service Delivery LRV Cleaning Supervisor 1 Service Delivery Service Supervisor 5 Information Technology IT Security Officer 1 METRO Police Fare Inspectors 15 Facilities Maintenance Manager, Rail Facilities 1 Facilities Maintenance Asset Coordinator 1 Facilities Maintenance Route Maintenance Foreman 1 Facilities Maintenance Data Analyst 1 Facilities Maintenance Director, Public Facilities 1 Facilities Maintenance Facilities Supervisor 1 Safety Claims Adjuster and Rail Safety Specialist 2 Finance Vault Attendant 2 Finance Fare Media Agent Field 4 Finance Sr. Fare Media Agent 1 Finance Financial Accountant 1 Real Estate Project Management Analyst 1 Capital Programs Asset Coordinator 1 Total Non-Union 38 8 Subtotal Total Positions
16 13 13
17 14 Authority Budget Summary FY2012 FY2013 FY2013 FY2014 Actual Budget Estimate Budget $ % Sales Tax $ 593,732,843 $ 614,750,795 $ 632,900,000 $ 669,292,000 $ 54,541, % Fares 66,887,319 65,000,000 69,194,610 69,700,000 4,700, % Grants 411,829, ,393, ,459, ,746,412 (168,647,587) (45.0%) Interest 625, ,000 1,032, , , % Miscellaneous 4,700,547 4,860,946 6,962,860 7,683,480 2,822, % Total Revenues $ 1,077,775,012 $ 1,059,455,740 $ 1,077,549,331 $ 952,971,893 $ (106,483,847) (10.1%) Operating Expenses Wages $ 99,899,878 $ 103,135,921 $ 102,541,962 $ 109,561,856 $ 6,425, % Union Fringe Benefits 46,070,068 56,576,950 54,023,968 59,182,085 2,605, % Subtotal Union Labor 145,969, ,712, ,565, ,743,941 9,031, % Salaries and Non-Union Wages 66,066,278 73,847,798 72,674,425 80,257,978 6,410, % Non-Union Fringe Benefits 31,494,234 32,175,339 31,640,600 36,279,089 4,103, % Subtotal Non-Union Labor 97,560, ,023, ,315, ,537,068 10,513, % Subtotal Labor and Fringe Benefits 243,530, ,736, ,880, ,281,009 19,545, % Services 23,715,308 34,712,488 32,886,892 39,933,471 5,220, % Materials and Supplies 22,170,356 19,689,940 19,501,509 21,115,065 1,425, % Fuel & Utilities 49,512,259 50,104,164 49,075,304 51,522,033 1,417, % Casualty and Liability (1,424,743) 3,256,864 2,683,660 4,677,577 1,420, % Purchased Transportation 78,384,760 80,895,333 80,719,356 88,591,060 7,695, % Leases, Rentals and Miscellaneous 5,809,236 7,720,430 7,233,711 7,431,621 (288,809) (3.7%) Subtotal Non-Labor 178,167, ,379, ,100, ,270,828 16,891, % Subtotal Labor and Non Labor 421,697, ,115, ,981, ,551,837 36,436, % Emergency Fund ,000,000 1,000,000 - Contingency - 4,608,993-9,000,000 4,391, % Allocation to Capital and GMP (14,252,050) (21,724,220) (18,087,141) (21,158,651) 565, % Subtotal Contingency/Allocation (14,252,050) (17,115,227) (18,087,141) (11,158,651) 5,956, % - Budget-to-Budget Variance Total Operating Expenses $ 407,445,585 $ 445,000,000 $ 434,894,246 $ 487,393,187 $ 42,393, % Capital Budget METRO Rail Expansion 409,964, ,400, ,881, ,557,000 (244,843,000) (43.8%) Capital Improvement Program 79,927, ,777, ,961, ,367,000 38,590, % Total Capital Budget $ 489,891,680 $ 719,177,000 $ 619,842,000 $ 512,924,000 $ (206,253,000) (28.7%) General Mobility $ 153,787,527 $ 164,834,000 $ 160,842,111 $ 160,120,730 $ (4,713,270) (2.9%) Debt Service $ 77,614,000 $ 78,302,000 $ 75,000,000 $ 80,198,494 $ 1,896, % 14 `
18 15 Financial Summary Fiscal Year 2013 Estimate Sources of METRO Funds ( in millions) Operations General Mobility Debt Service METRORail Expansion FY13 Bus/Van Replacements Capital Improvement Reserves TOTAL Sales Tax Grants* Farebox Borrowing Other Fund Balance TOTAL ,504 * Many expenses that accounting rules classify as operating costs are eligible as capital expenses in the 5307 formula grant program, including preventative maintenance, expenses (up to 10% of the amount apportioned) for providing non-fixed route paratransit transportation services in accordance with section 223 of the ADA, and mobility management expenses. 15
19 16 Financial Summary (continued) Fiscal Year 2014 Sources of METRO Funds ( in millions) Operations General Mobility Debt Service METRORail Expansion FY13 Bus Replacements FY14 Bus/Van Replacements Capital Improvement Reserves TOTAL Sales Tax Grants* Farebox Borrowing Other Fund Balance 153 (52) TOTAL ,354 * Many expenses that accounting rules classify as operating costs are eligible as capital expenses in the 5307 formula grant program, including preventative maintenance, expenses (up to 10% of the amount apportioned) for providing non-fixed route paratransit transportation services in accordance with section 223 of the ADA, and mobility management expenses. 16
20 17 Year-to-Year Budget Comparisons 17
21 18 Financials Development Guidelines METRO is committed to being a responsible steward of public funds and to financial sustainability. To meet these goals, METRO s FY2014 Business Plan was developed using the following guidelines: Estimates of sales tax growth will be consistent with Dr. Robert W. (Bill) Gilmer s growth estimates, reduced by approximately 1% in the first year of the estimate and applying the forecasted growth rate for the out years. METRO will support financial sustainability by managing the growth of non-start-up operating expenses to no more than the estimated sales tax growth rate. No fixed-route fare increases will be proposed for FY2014. METRO will present the Five Year Cash Flow model annually, clearly specifying all sources and uses of revenue. (The model will be updated periodically as required). METRO will position itself for optimum receipt of Federal grants. METRO will allocate sufficient resources to complete, start-up, and operate the three new rail lines while continuing to provide high quality service to all other modes. Capital expenditures must be supported upon project completion by a sustainable revenue source (e.g. sales tax revenue, fare revenue). Employee health care, pensions, and salaries will be reviewed periodically to ensure that they are commensurate with the industry. Requests to expand service or improve service quality for the current year will require a cost/benefit analysis, which will include changes to future operating cost. 18
22 19 Net Summary Section of the Texas Transportation Code requires the Board of Directors of the Metropolitan Transit Authority to adopt an annual budget which specifies major expenditures by type and amount prior to the commencement of a fiscal year. The total proposed budget for FY2014 is $1,240.6 million, a decrease of $166.6 million or 12% from the approved FY2013 budget. The table below shows the four major expenditures by type Operating, Capital, General Mobility and Debt Service. Net Summary Proposed FY2014 Annual Budget (in millions) Description Approved FY13 Budget Proposed FY14 Budget Increase Operating Budget $ $ $ % GMP Budget (4.7) (3%) Capital Budget (206.3) (29%) Debt Service % Total $ 1,407.3 $ 1,240.6 $ (166.6) (12%) Operating Budget The proposed Operating budget is $487.4 million, an increase of $42.4 million or 10% from the FY2013 approved budget level. General Mobility Program Budget The FY2014 General Mobility program budget is $160.1 million, a decrease of $4.7 million or 2.8% from the prior year. The decrease reflects the completion of funding for unexpended carryover of prior years to the City of Houston and Harris County. Thus the $160.1 million includes provisions for the 25% sales tax commitment that METRO makes to the GMP escrow account. Capital Budget The current Capital budget reflects a decrease of $206.3 million or 29% over the FY2013 approved budget level. This decline is largely due to a $244.8 million or 44% decrease in METRORail Expansion (MRE) expenditures, offset by a $38.5 million or 24% increase in planned Capital Improvement Program (CIP) expenditures. 19
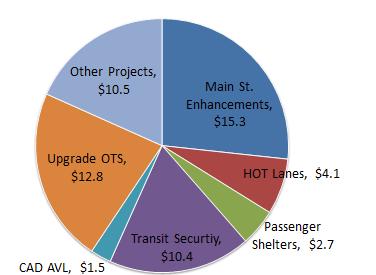
23 20 Description Capital Program Proposed FY2014 Annual Budget (in millions) Approved FY13 Budget Proposed FY14 Budget Increase METRORail Expansion Program (MRE) LRT Lines $ $ $ ( ) (41%) Main Street Vehicles & Other (37.473) (79%) Total MRE ( ) (44%) Capital Improvement Program (CIP) Main Street Upgrades and Other MRErelated projects % State of Good Repair Bus and Van Acquisitions % State of Good Repair Projects % Total State of Good Repair % Enhancement of Existing Assets (Less MRE related projects) (5.997) (22%) Service Expansion % Total CIP % The proposed Capital budget of $512.9 million is allocated in two program categories the METRORail Expansion (MRE) program and the Capital Improvement Program (CIP). The FY2014 budget allots $314.6 million for MRE program expenditures, specifically, $304.5 million for the LRT lines, $10.1 million for Main Street rail vehicle procurements, on-board equipment expenditures, and other related expenses, $198.4 million for the CIP program: specifically, $15.3 million for Main Street upgrades and other MRErelated projects (considered separate from the MRE program), $129.2 million for State of Good Repair projects (including bus acquisitions, METROLift van replacements, bus and facilities improvements and support vehicles), $21.4 million for projects that enhance existing assets and $32.5 million for projects relating to service expansion. Debt Service TOTAL Capital Program $ $ $ ( ) (29%) The proposed budget for debt service is $80.2 million, an increase of $1.9 million or 2.4% from FY2013 approved budget level. The debt service budget includes principal and interest payments and required deposits to the debt service reserve fund. A detailed table of METRO s debt position is provided in the Debt Service section of this book. 20
24 21 Sources & Uses of Funds The FY2014 budget calls for $1.240 billion to fund Operating Expenditures, Debt Service, General Mobility Program (GMP), Capital Improvement Projects (CIP) and the METRORail Expansion (MRE) program. The table below summarizes the Sources and Uses of Funds for the FY2014 budget. It segregates the Authority s operations into two parts - the Operating and Capital Improvement Program and METRORail Expansion (MRE). Sources & Uses of Funds (in millions) Operating & CIP METRORail Expansion TOTAL SOURCES OF FUNDS Beginning Fund Balance $ $ $ Revenues: Sales Tax Transportation Fares Grants Other Income Total Revenues Debt Funding Proceeds from Borrowing Total Sources of Funds $ 1, $ $ 1, USES OF FUNDS Expenses: Operating Budget $ $ - $ General Mobility Program Capital Improvement Projects* MRE Expenditures Debt Service Total FY14 Expenses , Ending Fund Balance Total Uses of Funds $ 1, $ $ 1, * Includes only Non-MRE projects 21
25 22 Funding of Operating and Capital Improvement Projects The Operating Budget of $487.4 million, General Mobility Program of $160.1 million, Capital Projects $198.4 million and Debt Service expenses of $80.2 million, will be funded from several revenue sources (including sales tax receipts, transportation fares, operating and capital grants and other income) totaling $ million and proceeds received from borrowing of $ million. In addition, the METRO Board-approved Debt Policy adopted in June 2005 sets the minimum target fiscal year ending fund balance (cash and investment portfolio) at 15% of the forward 12 month operating expenditures. Thus, the FY2015 beginning fund balance reserved for operations of $114.2 million includes a reserved amount of $73.1 million, which will be available to assist in the funding of the operating and non-mre capital expenditures while maintaining the minimum target fiscal year fund balance required for forward 12 month operating period expenditures. Funding of the METRORail Expansion Program The FY2014 budget for the METRORail Expansion is $314.0 million. The funding sources for this program include proceeds of borrowing (contractual obligations and bond issuances) totaling $33.9 million and grant revenues of $ million. An additional $153.5 million will be used from the fund balance to cover the remaining expenditures. 22
26 23 Statement of Net Assets The table below shows the Authority s Statement of Net Assets as of fiscal years ending September 30, 2012, 2013, and Statement of Net Assets (in millions) Assets FY12 FY13 FY13 FY14 Actual Budget Estimate Budget 9/30/2012 9/30/2013 9/30/2013 9/30/2014 Cash $ $ $ $ Receivables Inventory Investments Other Assets Debt Issuance Costs Property Net of Depreciation 2, , , , Total Assets $ 3, $ 3, $ 3, $ 3, Liabilities Trade Payables $ $ $ $ Accrued Payroll Short-Term Debt Long-Term Liabilities 1, , , Other Liabilities * Total Liabilities $ 1, $ 1, $ 1, $ 1, Net Assets - Retained $ 1, $ 2, $ 2, $ 2, Total Liabilities and Net Assets $ 3, $ 3, $ 3, $ 3, *Reporting of deferred rental payments reclassed to Long term Liabilities in FY
27 24 Five Year Cash Flow Projections The table below shows cash flow projections for the next five years to FY2018. Five Year Cash Flow Projections (in millions) FY2013 Estimate FY2014 FY2015 FY2016 FY2017 FY2018 SOURCES: Beginning Fund Balance $ $ $ $ $ $ Sales Tax Fare Revenue Grant Revenue Proceeds from Borrowing Other Revenues Total Sources $ 1, $ 1, $ 1, $ 1, $ 1, $ 1, USES: Operating Budget Expenditures $ $ $ $ $ $ General Mobility Program Capital Programs METRORail Expansion LRT Lines Main St. Vehicles Sub-Total MRE Capital Improvement Projects Main St. Upgrades & Other MRErelated projects State of Good Repair Enhancement of Existing Assets (Excludes MRE-related projects) Service Expansion Park & Rides and Signature Bus Sub-Total Capital Improvement Projects Total Capital Programs Debt Service Available for New Projects Ending Fund Balance Total Uses $ 1, $ 1, $ 1, $ 1, $ 1, $ 1,
28 25 Statement of Revenues, Expenses, and Changes in Net Assets The table below Statement of Revenues, Expenses and Changes in Net Assets uses the Comprehensive Annual Financial Report (CAFR) format and is prepared using the economic resources focus and the accrual basis of accounting revenues are recognized when earned and expenses are recognized when incurred. In other words, all the current year s revenues and expenses are included regardless of when the cash is received or paid. Statement of Revenues, Expenses and Changes in Net Assets (in millions) FY2012 Actual FY2013 Budget FY2013 Estimate FY2014 Estimate REVENUES Operating Revenues: Revenues: Transportation Fares HOT Lane Revenues Total Operating Revenues Operating Expenses: Transit Operating Depreciation and Amortization Total Operating Expenses Operating Loss $ ( ) $ ( ) $ ( ) $ ( ) Non-Operating Revenues (Expenses): Sales Tax $ $ $ $ Investment Income Inter-Government Revenue Interest Expense (13.720) Other Income Grant Proceeds - Operating Local Infrastructure Assistance/GMP ( ) ( ) ( ) ( ) Loss on Sale for Disposal of Assets (0.316) Total Non-Operating Revenues $ $ $ $ Gain/(Loss) before Capital Grants $ (86.869) $ $ $ Capital Grant Proceeds Changes in net assets Net Assets - beginning of the year 1, , , , Net Assets - end of the year 1, , , ,
29 26 FY2014 Operating Budget Proposal Baseline Operating Budget: FY2013 Operating Budget $ 445,000,000 FY2014 Proposed Operating Budget Base $ 466,095,947 Budget-to-Budget Variance $ 21,095,947 Workforce Increase/(Decrease) (30) Proposed New Requirements (non-rail): Budget Increase $ 5,676,145 Workforce Increase 8 Proposed Rail Increment: Budget Increase $15,621,095 Workforce Increase 138 Total FY2014 Proposed Operating Budget: $487,393,187 26
30 27 Increases & Decreases FY2014 Operating Budget Summary FY2014 Board Approved Operating Budget $ 445,000,000 Net Increases from FY ,974,663 Net Decreases from FY2014 (3,581,476) FY2014 OPERATING BUDGET $ 487,393,187 Net Increase in Operating Budget 42,393,187 Increases MAJOR INCREASES & DECREASES Implementation of 3 new rail lines $ 15,621,095 Restoring operating contingency to $9 million level 4,391,007 Increased METROLift costs associated with contractual rate increases, increased ridership, and continued investment in improvement of on-time performance 4,133,886 Increased wage and healthcare costs resulting from the collective bargaining agreement 2,862,028 Operating expenses associated with initiatives to increase the ridership on fixed route, e.g., providing the new service to address overloads, improving customer service with bilingual operators, improving OTP, and promoting service to key demographics 2,648,155 Increased rates and hours of service for contracted fixed route service 2,583,273 Increased contract rate and service in alternative fixed routes 1,826,953 Increase in operating expenses due to lower capitalization 1,561,453 Increased usage of gasoline primarily associated with more non-revenue & revenue vehicles 1,219,967 Increased extended warranty expense reflecting additional buses coming out of initial warranty period 1,122,324 Increased expense in vehicle liability associated with insurance for new rail cars 1,060,438 Increased operating expense related to expected growth in retirees Establishing an Emergency Fund 1,047,688 1,000,000 Increased software expense reflecting more maintenance, support & licenses 978,500 Increased healthcare cost for non-union employees due to rate increases and additional employees 937,585 Investment in a new risk management information system 550,000 Increase contract rate for HOT lanes 501,686 Increased contract rate for bus tire leases 485,078 Increased expenses related to diesel fuel delivery cost 414,855 Increase in vanpool leases and Harris County toll fees 351,880 Investments in new positions in IT, Capital Programs and Real Estate 288,992 Increased investment in organizational development & training of employees 178,061 Annualization of Pay-for-Performance & salary adjustments 146,449 Other miscellaneous increases from annualizations, contracts, and other 63,309 Total Increases $ 45,974,663 27
31 28 Decreases Legal expenses associated with the FY2013 General Mobility referendum (1,231,314) Lower METRO Q support cost in FY2014 (1,000,000) Lower electric power, natural gas, and telephone expenses reflecting new contract rates (742,406) Lower legislative coordination fees (580,000) Other decreases in the Authority (27,756) Total Decreases $ (3,581,476) 28


32 29 Operating Budget by Cost Category FY2012 FY2013 FY2013 FY2014 Budget-to-Budget Variance Actual Budget Estimate Budget $ % Wages $ 99,899,878 $ 103,135,921 $ 102,541,962 $ 109,561,856 $ 6,425, % Union Fringe Benefits 46,070,068 56,576,950 54,023,968 59,182,085 2,605, % Subtotal Union Labor 145,969, ,712, ,565, ,743,941 9,031, % Salaries and Non-Union Wages 66,066,278 73,847,798 72,674,425 80,257,978 6,410, % Non-Union Fringe Benefits 31,494,234 32,175,339 31,640,600 36,279,089 4,103, % Subtotal Non-Union Labor 97,560, ,023, ,315, ,537,067 10,513, % Subtotal Labor and Fringe Benefits 243,530, ,736, ,880, ,281,008 19,545, % Services 23,715,308 34,712,488 32,886,892 39,933,471 5,220, % Materials and Supplies 22,170,356 19,689,940 19,501,509 21,115,065 1,425, % Fuel & Utilities 49,512,259 50,104,164 49,075,304 51,522,033 1,417, % Casualty and Liability (1,424,743) 3,256,864 2,683,660 4,677,577 1,420, % Purchased Transportation 78,384,760 80,895,333 80,719,356 88,591,060 7,695, % Leases, Rentals and Miscellaneous 5,821,341 7,720,430 7,233,711 7,431,624 (288,806) (3.7%) Subtotal Non-Labor 178,179, ,379, ,100, ,270,830 16,891, % Subtotal Labor and Non Labor 421,709, ,115, ,981, ,551,838 36,436, % Emergency Fund ,000,000 1,000,000 - Contingency - 4,608,993-9,000,000 4,391, % Allocation to Capital and GMP (14,252,050) (21,724,220) (18,087,141) (21,158,651) 565, % Total Operating Expenses $ 407,457,689 $ 445,000,000 $ 434,894,246 $ 487,393,187 $ 42,393, % FY2014 Operating Budget Breakdown By Cost Category By Function 29
 the useful life of the asset acquired exceeds one")
33 30 Capital Programs METRO s Capital Programs consist of METRORail Expansion (MRE) and the Capital Improvement Program (CIP). METRO's FY2014 Capital Programs $512.9 million Capitalization Policy The Authority's overall capitalization policy requires expenditures to be capitalized when they exceed $5,000 and (a) the useful life of the asset acquired exceeds one year and/or (b) the useful life of an existing asset is increased beyond its original useful life. (in millions) PROJECTS FY2014 FY2015* FY2016* FY2017* FY2018* METRORail Expansion $ $ $ 18.7 $ 32.1 $ 25.9 Capital Improvement Program Total Projects $ $ $ $ $ *Estimates to be updated in future budgets. 30
34 31 METRORail Expansion METRORail Expansion (MRE) is a Light Rail Transit (LRT) infrastructure plan to expand the existing LRT system by adding three additional lines (North, Southeast, and East End). This program includes the design and construction of approximately 15 miles of LRT, 24 LRT stations, a storage facility at the Southeast line, a service and inspection facility at the East End line, and the procurement of 39 Light Rail Vehicles (LRV) for the opening-day fleets. The expansion also includes the capacity to increase the existing Main Street Red Line fleet by procuring 19 additional vehicles and expansion of the existing Rail Operations Center (ROC). Other costs included are MRE pre-design/build program development, planning, engineering, and land acquisition. (in thousands) FY2014 METRORail Expansion Budget Grant Local Purple Line - Southeast Corridor $ 120,236 $ 62,949 $ 57,287 Green Line - East End Corridor 116, ,494 Red Line Extension - North Corridor 67,758 40,246 27,512 Other 10,069 3,278 6,791 Total MRE $ 314,557 $ 106,473 $ 208,084 31
. The Authority s funding of its capital improvement plan is subject to available funding sources and access to the financial markets.")
35 32 Capital Improvement Program (Non-MRE) The Capital Improvement Program (CIP) provides for the capital needs that are outside the scope of the METRORail Expansion (e.g. bus replacement, facility renovations, procurement of equipment, etc.). The Authority s funding of its capital improvement plan is subject to available funding sources and access to the financial markets. METRO launched capital improvement projects that will help preserve its capability for high-quality service delivery over a ten-year range. The infrastructure supported by the FY2014 CIP budget includes facilities (maintenance and administrative support), revenue rolling stock (rail cars, buses and paratransit vans), rail system infrastructure including rail stations, and a vast array of tools and equipment. Maintenance of these assets is critical to ensure a high level of service, reliability and optimized operating costs. There are three project types: State of Good Repair Projects, Enhancements to Existing Assets, and Service Expansion / New Assets. (in thousands) 32
 Reflects a comprehensive understanding of the system and its condition, and the strategic direction of the system and")

36 33 State of Good Repair (SOGR) A state of good repair standard is where all capital assets are functioning at their ideal capacity within their design life. -- Federal Transit Administration (FTA) Reflects a comprehensive understanding of the system and its condition, and the strategic direction of the system and agency; Supports the enhancement of the transit service to our customers while maintaining the overall condition of the basic infrastructure; Prioritizes expenditures so that there is a maximum return on investment; and Supports the transition of our system from one in a start-up mode to one in a renewal mode. 33
37 34 STATE OF GOOD REPAIR PROJECTS (in thousands) Budget Grant Local FY2014 FY2014 FY2014 Clean Diesel Buses (45' Commuter Buses) $ 44,334 $ - $ 44,334 40' transit buses - Clean Diesel 19,574 19,574 LRV Truck Overhaul verify 4,373 1,550 2,823 Engine Assemblies 3,656 3,656 METROLIFT Vans 3,416 2, Hiram Clark BOF Rehab - Local 3,350 3,350 Hiram Clarke BOF Resurface/Recoat Interior 3,321 2, Mulit Facilities Renovations 3,184 3,184 Northwest BOF Resurface/Recoat Exterior 3,040 2, FSC Tools/Equipment 2,815 2,815 Passenger Safety Initiative 2,500 2,500 Non Revenue Vehicles 2,498 2,498 Polk BOF Resurface/Recoat Exterior 2,168 1, Kashmere BOF Renovations Upgrade 2,167 1, METRONet 2,101 2,101 Multi Facilities Bus Wash Systems Replacement 2,100 1, Multi Facilities Outdoor Lighting LED Retrofit 2,000 1, Rail Tie Upgrade; Redline 4 Crossing 1,888 1, Data Center Management 1,722 1,722 Treasury Vault Room Expansion 1,650 1,650 Yard Rail Tie Upgrade 1, Transmission assemblies Couplers Auxiliary Power System Seats - MCI Passenger Seating Rebuild State of Good Repair Database - EAM Database Field Service Center Renovation Multi Facilities Oil Water Seperator Rehabilitation Bus Axles Multi Facilities Replace Shop Flooring FSC, Polk, NW Capital BOF tools and equipment Drainage Improvements Between Naomi And I Hybrid bus batteries West BOF Generator Replacement Multi Facilities Elevators Rehabilitation TMC MPD Obsevation Station Fallbrook BOF Multi Facilities Security Systems Access Control/Keys Repl New Bus make ready Plano Disaster Recovery Site Improvements - Generator Event Recorder NorthLine Transit Center Rehab SE Motorola Handhelds EE Motorola Handhelds Central Stores FACP Replacement Kashmere BOF Fire/Life Safety System Rehabilitation Central Stores Replace Generator Kashmere BOF Crane Rehab Hybrid bus parts Rail Ops Center Trash Compactor Replacement Northwest BOF Chassis Wash Removal New Bus make ready METROLift K-9 Replacements TOTAL STATE OF GOOD REPAIR $ 129,344 $ 20,132 $ 109,212 34

38 35 FY2014 Enhancement to Existing Assets 35
39 36 36

40 37 Service Expansion/ New Projects 37
 METRO s enabling legislation authorizes the Authority to construct or maintain streets, roads, traffic signals, sidewalks, and hike and bike trails or perform these functions")
41 38 General Mobility FY2014 General Mobility Program Budget $ million (in millions) METRO s enabling legislation authorizes the Authority to construct or maintain streets, roads, traffic signals, sidewalks, and hike and bike trails or perform these functions through agreements with other government agencies. As early as 1982, METRO began to participate in and contribute funds for various joint construction projects with the City of Houston, Harris County and the 14 Multi-Cities within its service area. In 1988, this use of METRO s sales tax revenues was formalized into the General Mobility Program (GMP), dedicating 25% of its sales tax revenues to its constituent entities for General Mobility projects. These dedicated funds and their associated projects are locally known as the General Mobility Program. 38

42 39 Projected Funding (in thousands) Est. FY2013 FY2014 FY2015 FY2016 FY2017 FY2018 Pre-Agreement Projects City of Houston 10,000 10,000 10,000 10,000 10,000 10,000 Multi-Cities 16,740 17,537 20,298 21,586 22,717 23,905 Area-Wide 3,226 4,000 4,000 4,000 4,000 4,000 Subtotal $ 29,966 $ 31,537 $ 34,298 $ 35,586 $ 36,717 $ 37,905 Future Designated Projects City of Houston 101, , , , , ,435 Harris County 29,429 28,514 30,885 31,910 32,810 33,756 Unascribed Subtotal $ 130,876 $ 128,583 $ 139,879 $ 144,520 $ 148,597 $ 152,878 Total Commitment City of Houston 111, , , , , ,435 Harris County 29,429 28,514 30,885 31,910 32,810 33,756 Multi-Cities 16,740 17,537 20,298 21,586 22,717 23,905 Area-Wide 3,226 4,000 4,000 4,000 4,000 4,000 Unascribed Total GMP Budget $ 160,842 $ 160,121 $ 174,177 $ 180,106 $ 185,314 $ 190,783 39
43 40 Debt Service Debt Service Category (in millions) Projected FY2013 FY2014 FY2015 FY2016 FY2017 FY2018 Bonds & KOs $ 69.3 $ 74.8 $ 90.5 $ $ $ Commercial paper Fees/Interest Payoff - per Debt Policy Payoff - 1/2 GMP Referendum Increment Total $ 75.0 $ 80.2 $ 99.2 $ $ $ Series Source Principal Interest Certificates of Participation (COPS) Debt Service Reserve Fees TOTAL 2008A Sales Tax $ 4,770,000 $ 1,958,863 $ 6,728, B Sales Tax 3,290,000 1,910,625 5,200,625 Contractual Obligations (KOs) FY2014 PROPOSED DEBT SERVICE PAYMENTS 2009B Sales Tax 1,214,071 1,759,088 2,973, D Sales Tax 2,766,500 1,035,525 3,802, A Sales Tax 2,971,538 1,465,100 4,436, B Sales Tax 3,523,333 1,820, ,267 6,222, LRVs Sales Tax Buses & ARBOC Sales Tax - 668, ,082 1,356, Buses 824, ,827 1,673, >2014 East LRVs - 755, ,672 1,049,966 Voted Sales Tax 2009A Sales Tax / Grants 3,395,321 4,116,854 7,512, A Sales Tax / Grants - 23,050,500 5,102,957 28,153, C Sales Tax / Grants/ Subsidy - 5,675,656 5,675,656 Commercial Paper Principal 1,870,000 1,870,000 Interest 2,314,125 2,314,125 Fees LOC Fees 1,045,000 1,045,000 Dealer Fees 64,796 64,796 Legal Fees - Extensions / AG / Rating Agencies 119, ,000 Total Debt Service $ 23,800,763 $ 47,355,131 $ 7,813,804 $ 1,228,796 $ 80,198,494 40
44 41 Metropolitan Transit Authority of Harris County Texas Debt Report As of July 31, 2013 Type of Debt Purpose Par Value Average Rate Issuance Date Maturity / Term Cost of Issuance Interest Earned on Proceeds Disbursements from Proceeds Outstanding Balance Commercial Paper General Mobility $ 169,402,000 Wtd. Avg % Program Inception 10-Jan-06 Current Wtd. Avg days $ 7,014,204 $ 241,452 $ 169,402,000 $ 166,402,000 Sales & Use Tax Contractual Obligations Series 2009D 40 Orion HEV Buses 20 MCI HEV Buses $ 35,050, % 30-Dec-09 1-Nov-21 $ 175,686 $ 8,913 $ 35,612,306 $ 27,650,000 Sales & Use Tax Contractual Obligations Series 2010A Sales & Use Tax Contractual Obligations Series 2011B 80 Orion HEV Buses $ 40,290, % 23-Jun-10 1-Nov-22 $ 186,496 $ 27,485 $ 41,902,115 $ 34,855, Orion HEV Buses $ 49,405, % 28-Sep-11 1-Nov-23 $ 93,614 $ 7,784 $ 53,007,784 $ 46,110,000 Certificates of Participation (COPS) Series 2008A Certificates of Participation (COPS) Series 2008B 46 Orion HEV Buses 52 MCI HEV Buses 10 Signature Orions 50 MCI HEV $ 62,255, % 15-Jul-08 1-Nov-20 $ 215,568 $ 420,316 $ 61,959,754 $ 44,920,000 $ 45,785, % 9-Dec-08 1-Nov-21 $ 151,402 $ 97,461 $ 41,937,000 $ 36,920,000 Total Non-METRORail Expansion $ 402,187, % $ 7,836,970 $ 803,411 $ 403,820,959 $ 356,857,000 Sales & Use Tax Contractual Obligations Series 2009B Sales & Use Tax Bonds Series 2009A Rail Vehicles & Set-Up $ 42,780, % 11-Jun-09 1-Nov-33 $ 253,994 $ 83,868 $ 42,161,735 $ 39,430,000 Full Carryover North and Southeast Corridor Expansion $ 94,465, % 11-Jun-09 1-Nov-29 $ 560,859 $ 145,597 $ 96,578,261 $ 85,330,000 Sales & Use Tax Bonds Series 2009C - Build America Bonds North and Southeast Corridor Expansion $ 82,555, % 11-Jun-09 1-Nov-38 $ 440,193 $ 222,578 $ 77,116,267 $ 82,555,000 Commercial Paper METRORail Expansion Real Estate $ 20,598,000 Wtd. Avg % Program Inception 10-Jan-06 Current Wtd. Avg 115 days $ 852,967 $ 29,362 $ 20,598,000 $ 20,598,000 Sales & Use Tax Bonds Series 2011A North and Southeast Corridor Expansion $ 461,010, % 28-Sep-11 1-Nov-41 $ 869,366 $ 285,759 $ 461,295,758 $ 461,010,000 Total METRORail Expansion $ 701,408, % $ 2,977,379 $ 767,164 $ 697,750,021 $ 688,923,000 Total Debt $ 1,103,595, % $ 10,814,349 $ 1,570,574 $ 1,101,570,980 $ 1,045,780,000 41

45 42 Department Summaries Note: This organizational chart reflects the budget structure as presented in this document. It does not represent the complete planned changes to be implemented during METRO s FY

46 43 Note: This organizational chart does not reflect the budget structure as presented in this document. It does represent a projection of the planned organizational changes to be implemented during METRO s FY
47 44 Budget by Department Departments FY2013 FY2013 FY2014 Budget-to-Budget Variance Budget Estimate Budget $ % Service Delivery $ 321,954,700 $ 319,470,507 $ 348,001,686 $ 26,046, % Executive Vice President 41,672,793 40,179,579 44,863,672 3,190, % Capital Programs / Facilities Maintenance 23,404,811 26,193,069 25,966,583 2,561, % METRO Police 17,339,396 16,940,330 18,984,924 1,645, % Finance 10,682,255 9,265,920 10,873, , % Contingency & Emergency Fund 4,608,993-10,000,000 5,391, % Government & Public Affairs 6,960,231 5,376,308 8,249,678 1,289, % Safety 5,725,726 5,378,806 7,350,816 1,625, % Legal 4,715,714 5,109,176 3,859,386 (856,328) (18.2%) Service Design & Development 5,099,818 4,260,976 5,798, , % Executive & Board 1,456,366 1,588,643 1,982, , % Audit 1,229,197 1,130,934 1,311,911 82, % Small Capital Expenses 150, , % TOTAL NET OPERATING $ 445,000,000 $ 434,894,246 $ 487,393,187 $ 42,393, % 44
48 45 Base Breakdown by Department 45


49 46 New Requirements Breakdown by Department Increment for Rail Expansion Breakdown by Department 46
50 47 Executive & Board Budget to Budget FY2013 FY2013 FY2014 Variance Budget Estimate Budget $ % Wages $ - $ - $ - $ - N/A Union Fringe Benefits 3,695 1,622 2,548 (1,147) (31.0%) Subtotal Union Labor 3,695 1,622 2,548 (1,147) (31.0%) Salaries and Non-Union Wages 971,929 1,009,522 1,249, , % Non-Union Fringe Benefits 231, , , , % Subtotal Non-Union Labor 1,203,036 1,265,650 1,624, , % Subtotal Labor and Fringe Benefits 1,206,731 1,267,272 1,627, , % Services 119, , ,630 (2) (0.0%) Materials and Supplies 3,096 4,131 3, % Fuel & Utilities 10,692 10,601 11,705 1, % Leases, Rentals and Miscellaneous 193, , ,781 27, % Subtotal Non-Labor 326, , ,216 28, % Subtotal Labor and Non Labor 1,533,543 1,643,446 1,982, , % Allocation to Capital and GMP (77,177) (54,803) - 77, % Total Operating Expenses $ 1,456,366 $ 1,588,643 $ 1,982,269 $ 525, % Service Delivery Budget to Budget FY2013 FY2013 FY2014 Variance Budget Estimate Budget $ % Wages $ 96,435,758 $ 95,973,723 $101,874,086 $ 5,438, % Union Fringe Benefits 44,446,394 42,306,120 46,035,248 1,588, % Subtotal Union Labor 140,882, ,279, ,909,334 7,027, % Salaries and Non-Union Wages 26,057,549 26,480,973 29,891,288 3,833, % Non-Union Fringe Benefits 10,059,529 10,157,720 11,764,952 1,705, % Subtotal Non-Union Labor 36,117,078 36,638,693 41,656,240 5,539, % Subtotal Labor and Fringe Benefits 176,999, ,918, ,565,574 12,566, % Services 9,880,920 8,313,096 11,538,632 1,657, % Materials and Supplies 16,183,158 16,118,209 17,208,311 1,025, % Fuel & Utilities 42,347,699 42,355,008 44,223,099 1,875, % Casualty and Liability 1,103, ,226 1,430, , % Purchased Transportation 80,895,333 80,719,356 88,591,060 7,695, % Leases, Rentals and Miscellaneous 965,652 1,242, ,979 (219,673) (22.7%) Subtotal Non-Labor 151,376, ,347, ,737,291 12,361, % Subtotal Labor and Non Labor 328,375, ,266, ,302,865 24,927, % Allocation to Capital and GMP (6,420,748) (4,795,672) (5,301,179) 1,119, % Total Operating Expenses $321,954,700 $319,470,507 $348,001,686 $ 26,046, % 47
51 48 Capital Programs / Facilities Maintenance Budget to Budget FY2013 FY2013 FY2014 Variance Budget Estimate Budget $ % Wages $ 4,461,742 $ 4,269,919 $ 5,085,070 $ 623, % Union Fringe Benefits 2,309,730 2,019,278 2,675, , % Subtotal Union Labor 6,771,472 6,289,197 7,760, , % Salaries and Non-Union Wages 7,184,549 6,951,896 7,736, , % Non-Union Fringe Benefits 2,536,738 2,420,571 2,837, , % Subtotal Non-Union Labor 9,721,287 9,372,466 10,573, , % Subtotal Labor and Fringe Benefits 16,492,759 15,661,663 18,333,951 1,841, % Services 6,620,111 10,052,066 7,957,654 1,337, % Materials and Supplies 1,418,528 1,398,132 1,585, , % Fuel & Utilities 5,526,419 4,978,110 5,337,440 (188,979) (3.4%) Casualty and Liability - (2,973) - - N/A Leases, Rentals and Miscellaneous 254, , ,446 (91,447) (35.9%) Subtotal Non-Labor 13,819,951 16,573,784 15,044,101 1,224, % Subtotal Labor and Non Labor 30,312,710 32,235,447 33,378,052 3,065, % Allocation to Capital and GMP (6,907,899) (6,042,379) (7,411,469) (503,570) (7.3%) Total Operating Expenses $ 23,404,811 $ 26,193,069 $ 25,966,583 $ 2,561, % Service Design & Development Budget to Budget FY2013 FY2013 FY2014 Variance Budget Estimate Budget $ % Wages $ - $ - $ - $ - N/A Union Fringe Benefits 14,022 3,397 14, % Subtotal Union Labor 14,022 3,397 14, % Salaries and Non-Union Wages 2,345,714 2,305,409 2,327,195 (18,519) (0.8%) Non-Union Fringe Benefits 785, , ,036 49, % Subtotal Non-Union Labor 3,131,241 3,109,096 3,162,231 30, % Subtotal Labor and Fringe Benefits 3,145,263 3,112,493 3,176,492 31, % Services 2,330,664 1,553,457 2,866, , % Materials and Supplies 4,708 1,366 1,260 (3,448) (73.2%) Fuel & Utilities 14,329 13,383 5,428 (8,901) (62.1%) Leases, Rentals and Miscellaneous 88,478 69,663 99,866 11, % Subtotal Non-Labor 2,438,179 1,637,868 2,973, , % Subtotal Labor and Non Labor 5,583,442 4,750,361 6,149, , % Allocation to Capital and GMP (483,624) (489,385) (350,799) 132, % Total Operating Expenses $ 5,099,818 $ 4,260,976 $ 5,798,912 $ 699, % 48
52 49 Executive Vice President Budget to Budget FY2013 FY2013 FY2014 Variance Budget Estimate Budget $ % Wages $ 2,238,421 $ 2,298,320 $ 2,602,700 $ 364, % Union Fringe Benefits 9,561,329 9,466,304 10,194, , % Subtotal Union Labor 11,799,750 11,764,624 12,797, , % Salaries and Non-Union Wages 12,463,633 11,785,165 12,500,855 37, % Non-Union Fringe Benefits 7,876,474 7,476,892 8,544, , % Subtotal Non-Union Labor 20,340,107 19,262,057 21,045, , % Subtotal Labor and Fringe Benefits 32,139,857 31,026,681 33,843,023 1,703, % Services 5,582,469 4,948,715 5,974, , % Materials and Supplies 249, , ,105 (13,858) (5.5%) Fuel & Utilities 2,048,249 1,560,475 1,787,407 (260,842) (12.7%) Leases, Rentals and Miscellaneous 4,469,123 3,940,665 5,596,578 1,127, % Subtotal Non-Labor 12,349,804 11,040,415 13,594,565 1,244, % Subtotal Labor and Non Labor 44,489,661 42,067,096 47,437,588 2,947, % Allocation to Capital and GMP (2,816,868) (1,887,517) (2,573,916) 242, % Total Operating Expenses $ 41,672,793 $ 40,179,579 $ 44,863,672 $ 3,190, % METRO Police Budget to Budget FY2013 FY2013 FY2014 Variance Budget Estimate Budget $ % Wages $ - $ - $ - $ - N/A Union Fringe Benefits 216, , ,770 16, % Subtotal Union Labor 216, , ,770 16, % Salaries and Non-Union Wages 12,137,624 11,666,740 13,130, , % Non-Union Fringe Benefits 5,849,447 5,927,056 6,616, , % Subtotal Non-Union Labor 17,987,071 17,593,796 19,747,913 1,760, % Subtotal Labor and Fringe Benefits 18,203,594 17,802,245 19,980,683 1,777, % Services 1,381,659 1,336,197 1,832, , % Materials and Supplies 294, , ,126 65, % Fuel & Utilities 113,420 86,123 96,992 (16,428) (14.5%) Leases, Rentals and Miscellaneous 48,857 33,082 62,485 13, % Subtotal Non-Labor 1,838,725 1,750,191 2,352, , % Subtotal Labor and Non Labor 20,042,319 19,552,436 22,332,896 2,290, % Allocation to Capital and GMP (2,702,923) (2,612,107) (3,347,972) (645,049) (23.9%) Total Operating Expenses $ 17,339,396 $ 16,940,330 $ 18,984,924 $ 1,645, % 49
53 50 Safety Budget to Budget FY2013 FY2013 FY2014 Variance Budget Estimate Budget $ % Wages $ - $ - $ - $ - N/A Union Fringe Benefits 3,958 4,604 3,260 (698) (17.6%) Subtotal Union Labor 3,958 4,604 3,260 (698) (17.6%) Salaries and Non-Union Wages 2,439,750 2,436,373 2,762, , % Non-Union Fringe Benefits 977, ,342 1,102, , % Subtotal Non-Union Labor 3,417,244 3,356,715 3,865, , % Subtotal Labor and Fringe Benefits 3,421,202 3,361,319 3,868, , % Services 366,174 26, , , % Materials and Supplies 23,171 7,398 19,290 (3,881) (16.7%) Fuel & Utilities 17,376 20,787 23,300 5, % Casualty and Liability 2,153,408 2,087,408 3,247,367 1,093, % Leases, Rentals and Miscellaneous 54,204 45,376 55,655 1, % Subtotal Non-Labor 2,614,333 2,187,570 3,853,017 1,238, % Subtotal Labor and Non Labor 6,035,535 5,548,889 7,721,429 1,685, % Allocation to Capital and GMP (309,809) (170,083) (370,613) (60,804) (19.6%) Total Operating Expenses $ 5,725,726 $ 5,378,806 $ 7,350,816 $ 1,625, % Government & Public Affairs Budget to Budget FY2013 FY2013 FY2014 Variance Budget Estimate Budget $ % Wages $ - $ - $ - $ - N/A Union Fringe Benefits 3,281 3,377 3,183 (98) (3.0%) Subtotal Union Labor 3,281 3,377 3,183 (98) (3.0%) Salaries and Non-Union Wages 2,838,949 2,713,369 2,713,205 (125,744) (4.4%) Non-Union Fringe Benefits 1,157,784 1,068,276 1,086,833 (70,951) (6.1%) Subtotal Non-Union Labor 3,996,733 3,781,645 3,800,038 (196,695) (4.9%) Subtotal Labor and Fringe Benefits 4,000,014 3,785,022 3,803,221 (196,793) (4.9%) Services 2,951,200 1,827,113 4,381,227 1,430, % Materials and Supplies 499, , ,763 80, % Fuel & Utilities 4,728 4,305 12,334 7, % Leases, Rentals and Miscellaneous 135,479 68, ,084 (18,395) (13.6%) Subtotal Non-Labor 3,590,519 2,315,714 5,090,408 1,499, % Subtotal Labor and Non Labor 7,590,533 6,100,736 8,893,629 1,303, % Allocation to Capital and GMP (630,302) (724,428) (643,951) (13,649) (2.2%) Total Operating Expenses $ 6,960,231 $ 5,376,308 $ 8,249,678 $ 1,289, % 50
54 51 Legal Budget to Budget FY2013 FY2013 FY2014 Variance Budget Estimate Budget $ % Wages $ - $ - $ - $ - N/A Union Fringe Benefits 2,036 3,063 2, % Subtotal Union Labor 2,036 3,063 2, % Salaries and Non-Union Wages 1,741,557 1,728,572 1,820,170 78, % Non-Union Fringe Benefits 560, , ,716 10, % Subtotal Non-Union Labor 2,302,486 2,223,964 2,391,886 89, % Subtotal Labor and Fringe Benefits 2,304,522 2,227,027 2,394,034 89, % Services 1,692,403 2,079,358 1,657,219 (35,184) (2.1%) Materials and Supplies 6,000 5,077 6, % Fuel & Utilities 14,052 39,561 16,527 2, % Leases, Rentals and Miscellaneous 1,263,772 1,468,985 71,363 (1,192,409) (94.4%) Subtotal Non-Labor 2,976,227 3,592,981 1,751,109 (1,225,118) (41.2%) Subtotal Labor and Non Labor 5,280,749 5,820,008 4,145,143 (1,135,606) (21.5%) Allocation to Capital and GMP (565,035) (710,832) (285,757) 279, % Total Operating Expenses $ 4,715,714 $ 5,109,176 $ 3,859,386 $ (856,328) (18.2%) Finance Budget to Budget FY2013 FY2013 FY2014 Variance Budget Estimate Budget $ % Wages $ - $ - $ - $ - N/A Union Fringe Benefits 14,940 7,296 17,477 2, % Subtotal Union Labor 14,940 7,296 17,477 2, % Salaries and Non-Union Wages 4,777,416 4,778,593 5,224, , % Non-Union Fringe Benefits 1,805,165 1,808,565 2,185, , % Subtotal Non-Union Labor 6,582,581 6,587,158 7,409, , % Subtotal Labor and Fringe Benefits 6,597,521 6,594,454 7,427, , % Services 3,701,276 2,495,736 3,013,455 (687,821) (18.6%) Materials and Supplies 1,006, ,049 1,114, , % Fuel & Utilities 6,000 6,052 6, % Leases, Rentals and Miscellaneous 84,700 45, ,840 52, % Subtotal Non-Labor 4,798,791 3,213,125 4,271,485 (527,306) (11.0%) Subtotal Labor and Non Labor 11,396,312 9,807,579 11,698, , % Allocation to Capital and GMP (714,057) (541,659) (825,305) (111,248) (15.6%) Total Operating Expenses $ 10,682,255 $ 9,265,920 $ 10,873,352 $ 191, % 51
55 52 Audit Budget to Budget FY2013 FY2013 FY2014 Variance Budget Estimate Budget $ % Wages $ - $ - $ - $ - N/A Union Fringe Benefits 1, , % Subtotal Union Labor 1, , % Salaries and Non-Union Wages 889, , ,209 13, % Non-Union Fringe Benefits 335, , ,120 22, % Subtotal Non-Union Labor 1,224,273 1,123,785 1,260,329 36, % Subtotal Labor and Fringe Benefits 1,225,315 1,124,244 1,261,394 36, % Services 85,980 61,112 84,500 (1,480) (1.7%) Materials and Supplies % Fuel & Utilities 1, , % Leases, Rentals and Miscellaneous 11,880 2,749 11,545 (335) (2.8%) Subtotal Non-Labor 99,660 64,967 98,205 (1,455) (1.5%) Subtotal Labor and Non Labor 1,324,975 1,189,211 1,359,599 34, % Allocation to Capital and GMP (95,778) (58,277) (47,688) 48, % Total Operating Expenses $ 1,229,197 $ 1,130,934 $ 1,311,911 $ 82, % 52
56 53 Key Performance Indicators Performance Statistics: Safety & Security, Service & Reliability, and Customer Service FY2012 Actual FY2013 Goal FY2013 Estimate FY2014 Goal On-Time Performance (Service Reliability) Bus Local 71% 67% 72% 70% Bus - Park & Ride 78% 75% 78% 75% Bus - Weighted Average 78% 69% 73% 71.5% Rail 97% 95% 98% 95% METROLift Mean Distance Between Mechanical Failures (all buses) (1) 82% 9,664 85% 7,000 85% 9,962 87% 8,375 Mean Distance Between Service 16,752 12,000 14,209 12,000 Interruptions (Rail) Mean Distance Between Mechanical 11,264 11,500 13,071 11,750 Failures (METROLift) Bus Accidents Absolute Number Per 100,000 Vehicle Miles Rail Accidents Absolute Number Per 100,000 Vehicle Miles Complaint Contacts Absolute Number 22,751 21,230 20,028 22,449 Per 100,000 Boardings Major Security Incidents Total Per 100,000 Boardings Major Security Incidents METRO Properties Total Per 100,000 Boardings Average Call Center Answer Delay 109 seconds 120 seconds 97 seconds 120 seconds (1) The FY2014 goal for MDBF of 8,375 is a weighted average based on monthly targets. In the months of October April, the goal is 9,000; and in the months of May September, the goal is 7,500. The primary element in the success METRO has had in building a first-rate transit system has been the dedication to the quality of its service. METRO has devoted itself to bringing transit passengers service that is safe, clean, comfortable, reliable, attractive, and economical. To maintain a sharp focus on quality, a number of quality indicators are tracked, monitored, and reported throughout the year. Eight (8) of these quality indicators focusing on different aspects of transit service are reported to the Board on a monthly basis: 53
57 54 On-Time Performance (OTP): A local bus is considered on-time if it does not leave early and is within a five (5) minute window after the scheduled departure time. A Park & Ride bus is considered on-time if it does not depart early (except in the morning when a bus can leave from a Park & Ride lot when full) and is within a five (5) minute window after the scheduled departure time, with measurements during peak hours. OTP is measured by the IVOMS system which calculates data to the second, and the five (5) minute window is defined as anything less than six (6) minutes. For METRORail, a train departing from the beginning of the line or arriving at the end of the line less than five (5) minutes after the scheduled time is considered on-time. Mean Distance Between Mechanical Failures (MDBF): MDBF mechanical roadcalls are defined as any mechanical issue encountered during operation of the vehicle in revenue service that requires a maintenance action resulting from a mechanical failure. Mechanical failures include warranty and fleet defects but exclude accidents. This indicator is for the bus system but excludes METROLift. Bus and Rail Accidents: An accident is a transit incident with passenger injuries that require immediate medical treatment away from the scene or a collision between a revenue vehicle and an object such that the amount of damage exceeds $1,000. Bus accidents (which include METROLift) and rail accidents are reported separately and in terms of the absolute number of accidents and the relative number of accidents per 100,000 vehicle miles. A rail accident is defined as any physical contact between a rail vehicle and another vehicle (including another rail vehicle, car, truck, or motorcycle), a pedestrian, or bicyclist along the main rail line. Complaint Contacts: Patrons contact METRO s Customer Information Center to express dissatisfaction with METRO. Contacts made via telephone and over the Internet which result in a complaint record being generated in the Public Comment System are reported both in terms of the absolute number of contacts received and the number of contacts as a percentage of total boardings. Major Security Incidents: The total Major Security Incidents is based on two industry standards: the Federal Bureau of Investigation (FBI) Uniform Crime Report and the National Transit Database (NTD) Report issued by the Federal Transit Administration (FTA). The eight (8) categories included are: homicide, forcible rape, robbery, aggravated assault, burglary, larceny and theft, motor vehicle theft, and arson. This metric is reported both in terms of the absolute number of incidents and the number of incidents per 100,000 boardings. Major Security Incidents METRO Properties: The total Major Security Incidents METRO Properties is the number of incidents that occur at Park & Ride lots, Transit Centers, onboard buses and trains, and on Light Rail Vehicle (LRV) platforms. This metric is reported both in terms of the absolute number of incidents and the number of incidents per 100,000 boardings. Average Call Center Answer Delay: METRO is committed to providing customers with accurate, customer-friendly bus and service information in a timely manner. Customers may obtain bus information over METRO's website and by telephone using an interactive voice response system without speaking to a representative and with no customer wait time. For those customers who prefer to speak with a representative, METRO's goal is to answer their call in 120 seconds or less. In addition to bus information, METRO s Customer Service/Information Center provides general information, supports METRO Q Fare Card requests, documents and researches public comments, aids with Lost and Found inquiries, and provides general vanpool and HOV information. 54

58 55 Current Year s Recent Monthly Status Report 55
METRO. Fiscal Year Monthly Performance Report. Revenue Expense Ridership Performance. November 2018 (Third Quarter Fiscal Year-to Date)
") METRO Fiscal Year 2019 Monthly Performance Report Revenue Expense Ridership Performance (Third Quarter Fiscal Year-to Date) 12/12/2018 Table of Contents Section A Section B Section C Section D Section
METRO Fiscal Year 2019 Monthly Performance Report Revenue Expense Ridership Performance (Third Quarter Fiscal Year-to Date) 12/12/2018 Table of Contents Section A Section B Section C Section D Section
METRO. Fiscal Year Monthly Performance Report. Revenue Expense Ridership Performance. February 2018 (First Quarter Fiscal Year-to Date)
") METRO Fiscal Year 2018 Monthly Performance Report Revenue Expense Ridership Performance (First Quarter Fiscal Year-to Date) 3/12/2018 Table of Contents Section A Section B Section C Section D Section E
METRO Fiscal Year 2018 Monthly Performance Report Revenue Expense Ridership Performance (First Quarter Fiscal Year-to Date) 3/12/2018 Table of Contents Section A Section B Section C Section D Section E
METRO. Fiscal Year 2017 Monthly Performance Report. Revenue Expense Ridership Performance. October 2016
 METRO Fiscal Year 2017 Monthly Performance Report Revenue Expense Ridership Performance 11/18/2016 Table of Contents Section A Section B Section C Section D Section E Section F Section G Section H Section
METRO. Fiscal Year Monthly Performance Report. Revenue Expense Ridership Performance. May 2018 (Second Quarter Fiscal Year-to Date)
") METRO Fiscal Year 2018 Monthly Performance Report Revenue Expense Ridership Performance (Second Quarter Fiscal Year-to Date) 6/12/2018 Table of Contents Section A Section B Section C Section D Section
METRO Fiscal Year 2018 Monthly Performance Report Revenue Expense Ridership Performance (Second Quarter Fiscal Year-to Date) 6/12/2018 Table of Contents Section A Section B Section C Section D Section
METRO. Fiscal Year 2014 Monthly Board Report. May 2014
 METRO Fiscal Year 2014 Monthly Board Report Revenue Expense Ridership Performance 7/11/2014 Table of Contents Section A Section B Section C Section D Section E Section F Section G Section H Section I Section
METRO. Fiscal Year 2012 Monthly Board Report. September 2012 (Fourth Quarter Fiscal Year-to-Date)
") METRO Fiscal Year 2012 Monthly Board Report Revenue Expense Ridership Performance (Fourth Quarter Fiscal Year-to-Date) This report is based on a preliminary closing of the year-end financials for FY2012
METRO Fiscal Year 2012 Monthly Board Report Revenue Expense Ridership Performance (Fourth Quarter Fiscal Year-to-Date) This report is based on a preliminary closing of the year-end financials for FY2012
METRO. Fiscal Year 2015 Monthly Board Report. February 2015
 METRO Fiscal Year 2015 Monthly Board Report Revenue Expense Ridership Performance 4/2/2015 Table of Contents Section A Section B Section C Section D Section E Section F Section G Section H Section I Section
METRO. Fiscal Year 2013 Monthly Board Report. December 2012 (First Quarter Fiscal Year-to-Date)
") METRO Fiscal Year 2013 Monthly Board Report Revenue Expense Ridership Performance (First Quarter Fiscal Year-to-Date) 1/14/2013 Table of Contents Section A Section B Section C Section D Section E Section
METRO Fiscal Year 2013 Monthly Board Report Revenue Expense Ridership Performance (First Quarter Fiscal Year-to-Date) 1/14/2013 Table of Contents Section A Section B Section C Section D Section E Section
METRO. Fiscal Year 2012 Monthly Board Report. December 2011 (First Quarter Fiscal Year-to-Date)
") METRO Fiscal Year 2012 Monthly Board Report Revenue Expense Ridership Performance (First Quarter Fiscal Year-to-Date) 1/27/2012 Table of Contents Section A Section B Section C Section D Section E Section
METRO Fiscal Year 2012 Monthly Board Report Revenue Expense Ridership Performance (First Quarter Fiscal Year-to-Date) 1/27/2012 Table of Contents Section A Section B Section C Section D Section E Section
METRO. Fiscal Year 2013 Monthly Board Report. November 2012
 METRO Fiscal Year 2013 Monthly Board Report Revenue Expense Ridership Performance 12/13/2012 Table of Contents Section A Section B Section C Section D Section E Section F Section G Section H Section I
METRO. Fiscal Year 2013 Monthly Board Report. January 2013
 METRO Fiscal Year 2013 Monthly Board Report Revenue Expense Ridership Performance 2/14/2013 Table of Contents Section A Section B Section C Section D Section E Section F Section G Section H Section I Section
METRO. Fiscal Year 2015 Monthly Board Report. September 2015 (Fourth Quarter Fiscal Year-to-Date)
") METRO Fiscal Year 2015 Monthly Board Report Revenue Expense Ridership Performance (Fourth Quarter Fiscal Year-to-Date) This report is based on a preliminary closing of the year-end financials for FY2015
METRO Fiscal Year 2015 Monthly Board Report Revenue Expense Ridership Performance (Fourth Quarter Fiscal Year-to-Date) This report is based on a preliminary closing of the year-end financials for FY2015
METRO. Fiscal Year 2017 Monthly Performance Report. Revenue Expense Ridership Performance. September 2017 (Fourth Quarter Fiscal Year-to Date)
") METRO Fiscal Year 2017 Monthly Performance Report Revenue Expense Ridership Performance (Fourth Quarter Fiscal Year-to Date) 10/13/2017 Table of Contents Section A Section B Section C Section D Section
METRO Fiscal Year 2017 Monthly Performance Report Revenue Expense Ridership Performance (Fourth Quarter Fiscal Year-to Date) 10/13/2017 Table of Contents Section A Section B Section C Section D Section
DRAFT. September 25, 2017
 DRAFT September 25, 2017 FY2018 Business Plan & Budgets 1. FY2018 Funding Envelope 2. FY2018 Goals 3. FY2018 Targeted Investments 4. FY2018 Capital Budget 5. FY2018 Operating Budget 6. FY2018 Budget Summary
METRO. (Fourth Quarter Fiscal Year-to-Date)
") METRO Fiscal Year 2016 Monthly Performance Report Revenue Expense Ridership Performance (Fourth Quarter Fiscal Year-to-Date) 10/25/2016 Table of Contents Section A Section B Section C Section D Section
METRO Fiscal Year 2016 Monthly Performance Report Revenue Expense Ridership Performance (Fourth Quarter Fiscal Year-to-Date) 10/25/2016 Table of Contents Section A Section B Section C Section D Section
8. FINANCIAL ANALYSIS
 8. FINANCIAL ANALYSIS This chapter presents the financial analysis conducted for the Locally Preferred Alternative (LPA) selected by the Metropolitan Transit Authority of Harris County (METRO) for the.
METRO. Fiscal Year Monthly Performance Report. Revenue Expense Ridership Performance. June 2018 (Third Quarter Fiscal Year-to Date)
") METRO Fiscal Year 2018 Monthly Performance Report Revenue Expense Ridership Performance (Third Quarter Fiscal Year-to Date) 7/12/2018 Table of Contents Section A Section B Section C Section D Section E
METRO Fiscal Year 2018 Monthly Performance Report Revenue Expense Ridership Performance (Third Quarter Fiscal Year-to Date) 7/12/2018 Table of Contents Section A Section B Section C Section D Section E
METRO MONTHLY BOARD REPORT
 METRO Revenue Expenses Service Performance Fiscal Year FY2011 Table of Contents Section A Section B Section C Section D Section E Section F Section G Section H Summary Sales Tax Revenue Fare Revenue Operating
FY2018 Third Quarter Financial Update
 Finance and Committee Information Item IV-A May 10, 2018 Third Quarter Financial Update Page 30 of 53 Washington Metropolitan Area Transit Authority Board Action/Information Summary Action Information
METRO. Metro Funding. Associated Master Plan: Comprehensive Master Transportation Plan (MTP) for Arlington. Neighborhood(s):
 for Arlington. Neighborhood(s):") METRO METRO METRO 2017 2026 CIP Metro Funding Project Description The Washington Metropolitan Area Transit Authority (WMATA/Metro) is a unique federal-state-local partnership formed to provide mass transit
METRO METRO METRO 2017 2026 CIP Metro Funding Project Description The Washington Metropolitan Area Transit Authority (WMATA/Metro) is a unique federal-state-local partnership formed to provide mass transit
VALLEY METRO RPTA FY18 Budget EXECUTIVE SUMMARY
 VALLEY METRO RPTA FY18 Budget EXECUTIVE SUMMARY FY18 ADOPTED ANNUAL OPERATING AND CAPITAL BUDGET Valley Metro Regional Public Transportation Authority (RPTA) provides public transportation services for
FY17 FY16 Valley Metro RPTA Sources of Funds FY17 vs FY16
 FY17 ADOPTED ANNUAL OPERATING AND CAPITAL BUDGET Valley Metro Regional Public Transportation Authority (RPTA) provides public transportation services for Maricopa County located in the metro Phoenix, Arizona.
Federal Assistance 13% Charges for Services 5% Appropriated Fund Balance.5% Other 3% Administration 6% Building Maintenance 3% Other 2%
 TRANSIT FUND The Transit Fund is used to account for the operations of the Town s public transit system. Federal Assistance 13% Transit Revenues State Assistance 12% Charges for Services 5% Appropriated
Washington Metropolitan Area Transit Authority Metro Budget Overview
 Washington Metropolitan Area Transit Authority Metro Budget Overview February 2011 Metro 10,877 Employees (10,974 budgeted) 1,491 Buses 588 Escalators and 237 Elevators 106 Miles of Track 92 Traction Power
Arlington County, Virginia
 Arlington County, Virginia METRO METRO 2015 2024 CIP Metro Funding Project Description The Washington Metropolitan Area Transit Authority (WMATA/Metro) is a unique federal-state-local partnership formed
May 31, 2016 Financial Report
 2016 May 31, 2016 Financial Report Capital Metropolitan Transportation Authority 7/13/2016 Table of Contents SUMMARY REPORTS Budgetary Performance - Revenue 2 - Sales Tax Revenue 6 - Operating Expenses
Transit Subsidy. Mission Statement. Mandates
 Mission Statement The Potomac and Rappahannock Transportation Commission (PRTC) is a multi-jurisdictional agency representing Prince William, Stafford, and Spotsylvania Counties and the Cities of Manassas,
Transit Subsidy. Mission Statement. Mandates
 Mission Statement The Potomac and Rappahannock Transportation Commission (PRTC) is a multi-jurisdictional agency representing Prince William, Stafford, and Spotsylvania Counties and the Cities of Manassas,
Dallas Area Rapid Transit Dallas, Texas. Financial Statements Years Ended September 30, 2016 and 2015 and Independent Auditor s Report
 Dallas Area Rapid Transit Dallas, Texas Financial Statements Years Ended September 30, 2016 and 2015 and Independent Auditor s Report DALLAS, TEXAS FINANCIAL STATEMENTS AS OF AND FOR THE YEARS ENDED SEPTEMBER
Total Operating Activities for FY17 are $56.9 million, an increase of $5.1M or 9.8% from FY16.
 FY17 ADOPTED ANNUAL OPERATING AND CAPITAL BUDGET Valley Metro Rail, Inc. (VMR) is a public non-profit corporation whose members are the cities of Chandler, Glendale, Mesa, Phoenix, and Tempe. VMR plans,
Washington Metropolitan Area Transit Authority
 Washington Metropolitan Area Transit Authority Financial Report issued in Accordance with Government Auditing Standards For the Years Ended June 30, 2016 and 2015 Single Audit Reports issued in Accordance
SOUTHEASTERN PENNSYLVANIA TRANSPORTATION AUTHORITY. Financial Statements June 30, 2018 and (With Independent Auditors Report Thereon)
") SOUTHEASTERN PENNSYLVANIA TRANSPORTATION AUTHORITY Financial Statements June 30, 2018 and 2017 (With Independent Auditors Report Thereon) SOUTHEASTERN PENNSYLVANIA TRANSPORTATION AUTHORITY YEARS ENDED
SOUTHEASTERN PENNSYLVANIA TRANSPORTATION AUTHORITY Financial Statements June 30, 2018 and 2017 (With Independent Auditors Report Thereon) SOUTHEASTERN PENNSYLVANIA TRANSPORTATION AUTHORITY YEARS ENDED
TSCC Budget Review TriMet
 TSCC Budget Review 2017-18 TriMet 1. Introduction to the District: The Tri-County Metropolitan Transportation District (TriMet) boundary covers about 575 square miles of the urban portions of Multnomah,
Washington Metropolitan Area Transit Authority
 Washington Metropolitan Area Transit Authority Financial Report For the Fiscal Years Ended June 30, 2017 and 2016 Table of Contents Washington Metropolitan Area Transit Authority Financial Report For the
METROPOLITAN TRANSIT AUTHORITY OF HARRIS COUNTY, TEXAS. Independent Accountants Report on Applying Agreed-Upon Procedures
 METROPOLITAN TRANSIT AUTHORITY OF HARRIS COUNTY, TEXAS Independent Accountants Report on Applying Agreed-Upon Procedures Year ended September 30, 2012 KPMG LLP 811 Main Street Houston, TX 77002 Independent
METROPOLITAN TRANSIT AUTHORITY OF HARRIS COUNTY, TEXAS. Independent Accountants Report on Applying Agreed-Upon Procedures
 METROPOLITAN TRANSIT AUTHORITY OF HARRIS COUNTY, TEXAS Independent Accountants Report on Applying Agreed-Upon Procedures Year ended September 30, 2017 KPMG LLP 811 Main Street Houston, TX 77002 Independent
FY 2007 Cost Allocation PMB O&M Cost Full METRO Solutions 2030
 Appendix H FY 2007 Cost Allocation PMB O&M Cost Full METRO Solutions 2030 METROPOLITAN TRANSIT AUTHORITY COST ALLOCATION MODEL FY 2007 Structure May 1, 2008 I. CONCEPT The cost allocation model is designed
Transit Subsidy. Mission Statement. Mandates
 Mission Statement The Potomac and Rappahannock Transportation Commission (PRTC) is a multi-jurisdictional agency representing Prince William, Stafford, and Spotsylvania Counties and the Cities of Manassas,
METRO. Monthly Board Report. June 2006
 METRO Monthly Board Report Operating Capital Service Performance June 26 7/17/26 June 26 MONTHLY BOARD REPORT INDEX Section A Section B Section C Section D Section E Section F Section G Operating Budget
CHAPTER 7: Financial Plan
 CHAPTER 7: Financial Plan Report Prepared by: Contents 7 FINANCIAL PLAN... 7-1 7.1 Introduction... 7-1 7.2 Assumptions... 7-1 7.2.1 Operating Revenue Assumptions... 7-2 7.2.2 Operating Cost Assumptions...
Operations & Finance Committee Meeting Agenda
 Operations & Finance Committee Meeting Agenda Nashville MTA Committee Meetings Music City Central Meeting Room 400 Charlotte Ave., Nashville, TN 37219 Thursday, November 16, 2017 The Operations & Finance
FY2017 Year-End Financial Update
 Finance Committee Information Item III-A September 14, 2017 FY2017 Year-End Financial Update Washington Metropolitan Area Transit Authority Board Action/Information Summary Action Information MEAD Number:
FY06 Operating Budget. FY2006 Proposed Operating Budget. Final Summary for Board Referral
 FY2006 Proposed Operating Budget Final Summary for Board Referral 1 Operating Statements Subsidy nearly $10M lower than December proposal Dec Base Other Subtot Mar Prop$ Adj Adj Changes Prop$ Revenues
PROPOSED FISCAL YEAR 2011 BUDGET. Testimony of. Richard Sarles, General Manager. Washington Metropolitan Area Transit Authority.
 PROPOSED FISCAL YEAR 2011 BUDGET Testimony of Richard Sarles, General Manager Washington Metropolitan Area Transit Authority Before the Council of the District of Columbia Committee on Public Works and
Jefferson Transit Authority Annual Budget. November 14, 2017 PROPOSED
 Jefferson Transit Authority 218 Annual Budget November 14, 217 PROPOSED 1 Table of Contents General Manager s Message... 3 Jefferson Transit Authority Mission Statement... 4 Overall Economic Outlook...
VALLEY METRO RAIL FY18 Budget EXECUTIVE SUMMARY
 VALLEY METRO RAIL FY18 Budget EXECUTIVE SUMMARY FY18 ADOPTED ANNUAL OPERATING AND CAPITAL BUDGET Valley Metro Rail, Inc. (VMR) is a public non-profit corporation whose members are the cities of Chandler,
Financial Report Fiscal Year 2018
 Financial Report Fiscal Year 2018 Year to Date September 30, 2018 1 Major Highlights Revenue Sales tax remittances received in FY2018 are 6.5% higher than FY2017 Additional $20 million in operating grants
MARTA 2009 Budget Summary Review
 MARTA 2009 Budget Summary Review 1 Transit Budgeting Strategies Internal Productivity & Cost Containment Fare Changes New Revenue Sources Transit Service Levels 2 The Budget Context Eliminate Legacy MARTA
August 31, 2016 Financial Report
 August 31, 2016 Financial Report Capital Metropolitan Transportation Authority 10/14/2016 Table of Contents SUMMARY REPORTS Budgetary Performance - Revenue 2 - Sales Tax Revenue 6 - Operating Expenses
CHICAGO TRANSIT AUTHORITY CHICAGO, ILLINOIS
 CHICAGO, ILLINOIS FINANCIAL STATEMENTS AND SUPPLEMENTARY INFORMATION Years Ended (With Independent Auditor s Report Thereon) Chicago, Illinois FINANCIAL STATEMENTS Years Ended TABLE OF CONTENTS Independent
Quarterly Status Report
 Capital Projects Quarterly Status Report 2nd Quarter FY2018: October 01 December 31, 2017 Prepared for the March 07, 2018 SamTrans Board Meeting San Mateo County Transit District San Mateo County Transit
JP Morgan Public Finance Transportation Utility Conference
 JP Morgan Public Finance Transportation Utility Conference April 18-19, 2018 Presented by: Brenden Morgan Sr. Manager of Debt & Investments Table of Contents I. Overview of the Region and RTD II. Updates
April 30, 2016 Financial Report
 2016 April 30, 2016 Financial Report Capital Metropolitan Transportation Authority 6/15/2016 Table of Contents SUMMARY REPORT Budgetary Performance - Revenue 2 - Sales Tax Revenue 6 - Operating Expenses
Contents. Appendix. Cost Model Structure. Tables
 Alternatives Analysis Alt ti A l i Technical Methodology Report: Operating and Cost Estimating and Results Prepared for: Washington County Regional Railroad Authority on behalf of the Gateway Corridor
Public Authorities by the Numbers: Capital District Transportation Authority
 Public Authorities by the Numbers: Capital District Transportation Authority June 2016 Table of Contents I. EXECUTIVE SUMMARY... 1 II. CAPITAL DISTRICT TRANSPORTATION AUTHORITY BY THE NUMBERS... 2 Introduction...
Executive Summary - Fiscal Year 2016 Valley Metro Rail Preliminary Annual Operating and Capital Budget
 Executive Summary - Fiscal Year 2016 Valley Metro Rail Preliminary Annual Operating and Capital Budget Valley Metro Rail, Inc. (VMR) is a public non-profit corporation whose members are the cities of Chandler,
Northern Virginia Transportation Commission: 2018 Legislative and Policy Agenda
 Northern Virginia Transportation Commission: 2018 Legislative and Policy Agenda Northern Virginia s economic growth and global competitiveness are directly tied to the region s transit network. Transit
FY2020 Budget Outlook
 Finance and Capital Committee Information Item IV-A October 11, 2018 FY2020 Budget Outlook 35 of 60 Washington Metropolitan Area Transit Authority Board Action/Information Summary Action Information MEAD
Report by Finance and Administration Committee (B) Washington Metropolitan Area Transit Authority Board Action/Information Summary
 Washington Metropolitan Area Transit Authority Board Action/Information Summary") Report by Finance and Administration Committee (B) 01-28-2016 Washington Metropolitan Area Transit Authority Board Action/Information Summary Action Information MEAD Number: 201701 Resolution: Yes No TITLE:
Report by Finance and Administration Committee (B) 01-28-2016 Washington Metropolitan Area Transit Authority Board Action/Information Summary Action Information MEAD Number: 201701 Resolution: Yes No TITLE:
METROPOLITAN TRANSIT AUTHORITY NASHVILLE, TENNESSEE AUDITED FINANCIAL STATEMENTS AND OTHER FINANCIAL INFORMATION JUNE 30, 2017 AND 2016
 NASHVILLE, TENNESSEE AUDITED FINANCIAL STATEMENTS AND OTHER FINANCIAL INFORMATION JUNE 30, 2017 AND 2016 Table of Contents Page INTRODUCTION... 1-2 INDEPENDENT AUDITOR S REPORT... 3-5 MANAGEMENT S DISCUSSION
Financial Report Fiscal Year 2018
 Financial Report Fiscal Year 2018 Year to Date December 31, 2017 Presented on February 14, 2018 1 Major Highlights Revenue FY2018 sales tax revenue budgeted at 2.5% growth over FY2017 Sales tax remittances
Washington Metropolitan Area Transit Authority Board Action/Information Summary
 Washington Metropolitan Area Transit Authority Board Action/Information Summary Action Information MEAD Number: 201958 Resolution: Yes No TITLE: Second Quarter Capital Program Update PRESENTATION SUMMARY:
Whatcom Transportation Authority. Annual Budget. WTA Draft Budget 1
 Whatcom Transportation Authority Annual Budget 2010 WTA Draft Budget 1 Table of Contents Executive Memorandum... 1 WTA Mission... 2 WTA Vision Destination 2010... 3 Key Objectives... 4 Budget Initiatives...
FY2018 Second Quarter Financial Update
 Finance and Committee Information Item III-A February 8, 2018 Second Quarter Financial Update 4 of 52 Washington Metropolitan Area Transit Authority Board Action/Information Summary Action Information
QUALITY TRANSPORTATION SUMMARY
 QUALITY TRANSPORTATION SUMMARY Quality Transportation Overview... 126 Department of Transportation... 127 Traffic Field Operations... 129 Winston-Salem Transit Authority... 131 Quality Transportation Non-Departmental...
Capital Metropolitan Transportation Authority Monthly Performance & Financial Report For Period Ending October 31, 2012 Soft Close
 Capital Metropolitan Transportation Authority Monthly Performance & Financial Report For Period Ending October 31, 2012 Soft Close Table of Contents SUMMARY REPORT Financial Performance -Sales Tax 3 -Other
Financial Report Fiscal Year 2018
 Financial Report Fiscal Year 2018 Year to Date March 31, 2018 Presented on May 21, 2018 1 Major Highlights Revenue FY2018 sales tax revenue budgeted at 2.5% growth over FY2017 Sales tax remittances received
Getting Metro Back on Track
 NVTC Presents: Getting Metro Back on Track A discussion with Virginia members of the WMATA Board @NovaTransit This forum is sponsored by the Northern Virginia Transportation Commission. Learn more about
FY2017 Budget Discussion
 Finance & Administration Committee Information Item IV-B November 5, 2015 FY2017 Budget Discussion Page 70 of 116 Washington Metropolitan Area Transit Authority Board Action/Information Summary Action
Whatcom Transportation Authority
 Whatcom Transportation Authority Annual Budget 12/14/2017 This Page Intentionally Left Blank Whatcom Transportation Authority (WTA) Annual Budget Table of Contents General Manager s Budget Message... 2
Honolulu High-Capacity Transit Corridor Project Alternatives Analysis
 Alternatives Analysis Financial Feasibility Report November 30, 2006 Prepared for: City and County of Honolulu Prepared by: PB Consult Inc. Under Subcontract to: Parsons Brinckerhoff Quade & Douglas, Inc.
FY17 Budget Discussion
 FY17 Budget Discussion Metro is Everywhere Metro is a lot more than buses and trains. Anyone who has boarded a bus or a train, driven on the freeway, used the toll roads, stopped at a traffic signal, or
Solano County Transit
 AGENDA ITEM 13 - REVISED BOARD MEETING DATE: APRIL 18, 2013 Solano County Transit TO: BOARD OF DIRECTORS PRESENTER: KRISTINA BOTSFORD, BUDGET & ACCOUNTING MANAGER MONA BABAUTA, EXECUTIVE DIRECTOR SUBJECT:
Capital & Strategic Planning Committee. Item III - A. January 25, FY2019 Capital Budget Work Session
 Capital & Strategic Planning Committee Item III - A January 25, 2018 FY2019 Capital Budget Work Session Page 4 of 29 Washington Metropolitan Area Transit Authority Board Action/Information Summary Action
Business Plan & Budgets
 North Beltway 8 Business Plan & Budgets IT Uptown Fiscal Year 2009 University IT East End Southeast Concise statement of approved and adopted budgets issued October 16, 2008. BUSINESS PLAN & BUDGETS Fiscal
Jefferson Transit Authority Annual Budget. November 1, 2016 PROPOSED
 Jefferson Transit Authority 2017 Annual Budget November 1, 2016 PROPOSED 1 Table of Contents General Manager s Message... 3 Jefferson Transit Authority Mission Statement... 4 Overall Economic Outlook...
CHAPTER 9 FINANCIAL CONSIDERATIONS
 CHAPTER 9 FINANCIAL CONSIDERATIONS 9.1 INTRODUCTION This chapter presents anticipated costs, revenues, and funding for the Berryessa Extension Project (BEP) Alternative and the Silicon Valley Rapid Transit
Financial Report - FY 2017 Year to Date May 31, 2017
 Financial Report - FY 2017 Year to Date July 19, 2017 1 Major Highlights Revenue Sales tax remittances received through YTD April 2017 are 4.2% higher than YTD April 2016 Plaza Saltillo lease income budgeted
Adopted 2018 OPERATING BUDGET Two-Year Financial Plan and Five-Year CAPITAL PROGRAM
 2018 Adopted 2018 OPERATING BUDGET Two-Year Financial Plan and Five-Year CAPITAL PROGRAM MOVING YOU Northeastern Illinois December 2017 RTA Board of Directors Kirk Dillard Chairman Anthony K. Anderson
GM/CEO s Proposed FY2020 Budget
 Finance and Capital Committee Information Item IV-A November 1, 2018 GM/CEO s Proposed FY2020 Budget Washington Metropolitan Area Transit Authority Board Action/Information Summary Action Information MEAD
SOUTHEASTERN PENNSYLVANIA TRANSPORTATION AUTHORITY. Financial Statements June 30, 2017 and (With Independent Auditors Report Thereon)
") SOUTHEASTERN PENNSYLVANIA TRANSPORTATION AUTHORITY Financial Statements June 30, 2017 and 2016 (With Independent Auditors Report Thereon) SOUTHEASTERN PENNSYLVANIA TRANSPORTATION AUTHORITY YEARS ENDED
SOUTHEASTERN PENNSYLVANIA TRANSPORTATION AUTHORITY Financial Statements June 30, 2017 and 2016 (With Independent Auditors Report Thereon) SOUTHEASTERN PENNSYLVANIA TRANSPORTATION AUTHORITY YEARS ENDED
The Potomac and Rappahannock Transportation Commission (PRTC) is a multijurisdictional agency representing Prince William, Stafford and Spotsylvania
 is a multijurisdictional agency representing Prince William, Stafford and Spotsylvania") Planning and Development Development Services, Department of Economic Development, Department of Housing and Community Development, Office of Planning Prince William County/ Manassas Convention and Visitors
Planning and Development Development Services, Department of Economic Development, Department of Housing and Community Development, Office of Planning Prince William County/ Manassas Convention and Visitors
REGIONAL TRANSPORTATION DISTRICT, COLORADO AS OF DECEMBER 31, 2015
 AS OF DECEMBER 31, RTD Active Fleet of the District Fixed Route Bus Fleet: Number RTD Owned- Fixed Route Buses 40' Transit Coaches 620 Articulated Buses 110 Intercity Coaches 175 Mall Shuttles 37 30' Transit
CITY OF LOS ANGELES INTER-DEPARTMENTAL CORRESPONDENCE
 CITY OF LOS ANGELES INTER-DEPARTMENTAL CORRESPONDENCE DATE: TO: Honorable City Council c/o City Clerk, Room 395, City Hall Attention: Honorable Nury Martinez, Chair, Energy and the Environment Committee
Chapter 5: Cost and Revenues Assumptions
 Chapter 5: Cost and Revenues Assumptions Chapter 5: Cost and Revenues Assumptions INTRODUCTION This chapter documents the assumptions that were used to develop unit costs and revenue estimates for the
Quarterly Status Report
 Capital Projects Quarterly Status Report 3rd Quarter FY2017: January 1 March 31, 2017 Prepared for the June 7, 2017 SamTrans Board Meeting San Mateo County Transit District San Mateo County Transit District
February 2016 Financial Report
 2016 February 2016 Financial Report Capital Metropolitan Transportation Authority 4/13/2016 Table of Contents SUMMARY REPORT Budgetary Performance - Revenue 2 - Sales Tax Revenue 5 - Operating Expenses
Audit and Finance Subcommittee
 MEETING OF THE Audit and Finance Subcommittee MEETING DATE January 12, 2017 TIME LOCATION 12:00 p.m. Valley Metro 101 N. 1st Ave., 10th Floor Lake Mead Conference Room (10B) Phoenix, AZ 85003 VALLEY METRO
FY2011 Budget Forum. District of Columbia. October 19, 2009
 FY2011 Budget Forum District of Columbia October 19, 2009 0 Meeting agenda What is Metro and what is the value of Metro service? What are the Fiscal Year 2011 budget challenges? What are the potential
MEMORANDUM. Santa Clara Valley Transportation Authority Board of Directors. Michael T. Burns General Manager. DATE: August 4, 2008
 MEMORANDUM TO: FROM: Santa Clara Valley Transportation Authority Board of Directors Michael T. Burns General Manager DATE: August 4, 2008 SUBJECT: BART Operating Subsidy This memorandum summarizes and
New York City Transit
 New York City Transit MTA New York City Transit 2008 Preliminary Budget July Financial Plan 2008 2011 MISSION STATEMENT The mission of MTA New York City Transit is to provide customers with safe, reliable
Operating Budget Report
 Operating Budget Report MTD Operating Budget ($ in Millions) Sept-FY2012 Sept-FY2013 Variance FY13 Actual Actual Budget $ Percent $140M Operating Expenditures ($ in Millions) Revenue $ 67 $ 68 $ 71 $ (3)
Operating Budget Report
 Operating Budget Report Operating Budget ($ in Millions) Operating Expenditures ($ in Millions) MTD May-FY2011 May - FY2012 Variance FY12 Actual Actual Budget $ Percent $140M Revenue $ 68,140 $ 70,480
Engineering & Project Management Division
 Division Summary Michael Schipper, Deputy General Manager The Engineering and Project Management Division is responsible for RTA s planning, real estate, and capital project design and construction administrative
Public Transportation
 Municipal Manager Marketing & Customer Service Program Planning Transit Operations & Maintenance Transit Planning Transit Operations Para Transit Services Vehicle Maintenance Non-Vehicle Maintenance PT
QUALITY TRANSPORTATION SUMMARY
 SUMMARY Transportation systems influence virtually every aspect of community life. They are the means for moving people, goods, and services throughout the community, and they play a significant role in
Whatcom Transportation Authority
 Whatcom Transportation Authority Annual Budget 2011 Table of Contents Executive Memorandum... 1 WTA Mission... 2 WTA Vision Destination 2020... 3 Key Objectives... 4 Budget Initiatives... 5 Budget Assumptions...
10 Financial Analysis
 10 Financial Analysis This chapter summarizes the financial analysis for the No-Build Alternative and the proposed METRO Blue Line Light Rail Transit (BLRT) Extension project. This chapter also describes
FY19 Budget - Discussion. April 2018
 FY19 Budget - Discussion April 2018 FY19 Proposed Budget: $6.6 Billion General Planning & Programs 3% Identify regional mobility needs and solutions Debt Service 6% Obligations from current and past projects
REGIONAL TRANSPORTATION DISTRICT, COLORADO
 REGIONAL TRANSPORTATION DISTRICT, COLORADO Series 2004 Lease RTD Active Fleet of the District Fiscal Year Ended December 31, 2013 Fixed Route Bus Fleet Number RTD Owned Fixed Route Buses 40' Transit Coaches