METRO BOARD OF DIRECTORS Finance and Audit Agenda Working Committee Meeting METRO Board Room, 2 nd Floor March 21, 2016, 8:30 AM
|
|
|
- Jasmin Gordon
- 5 years ago
- Views:
Transcription

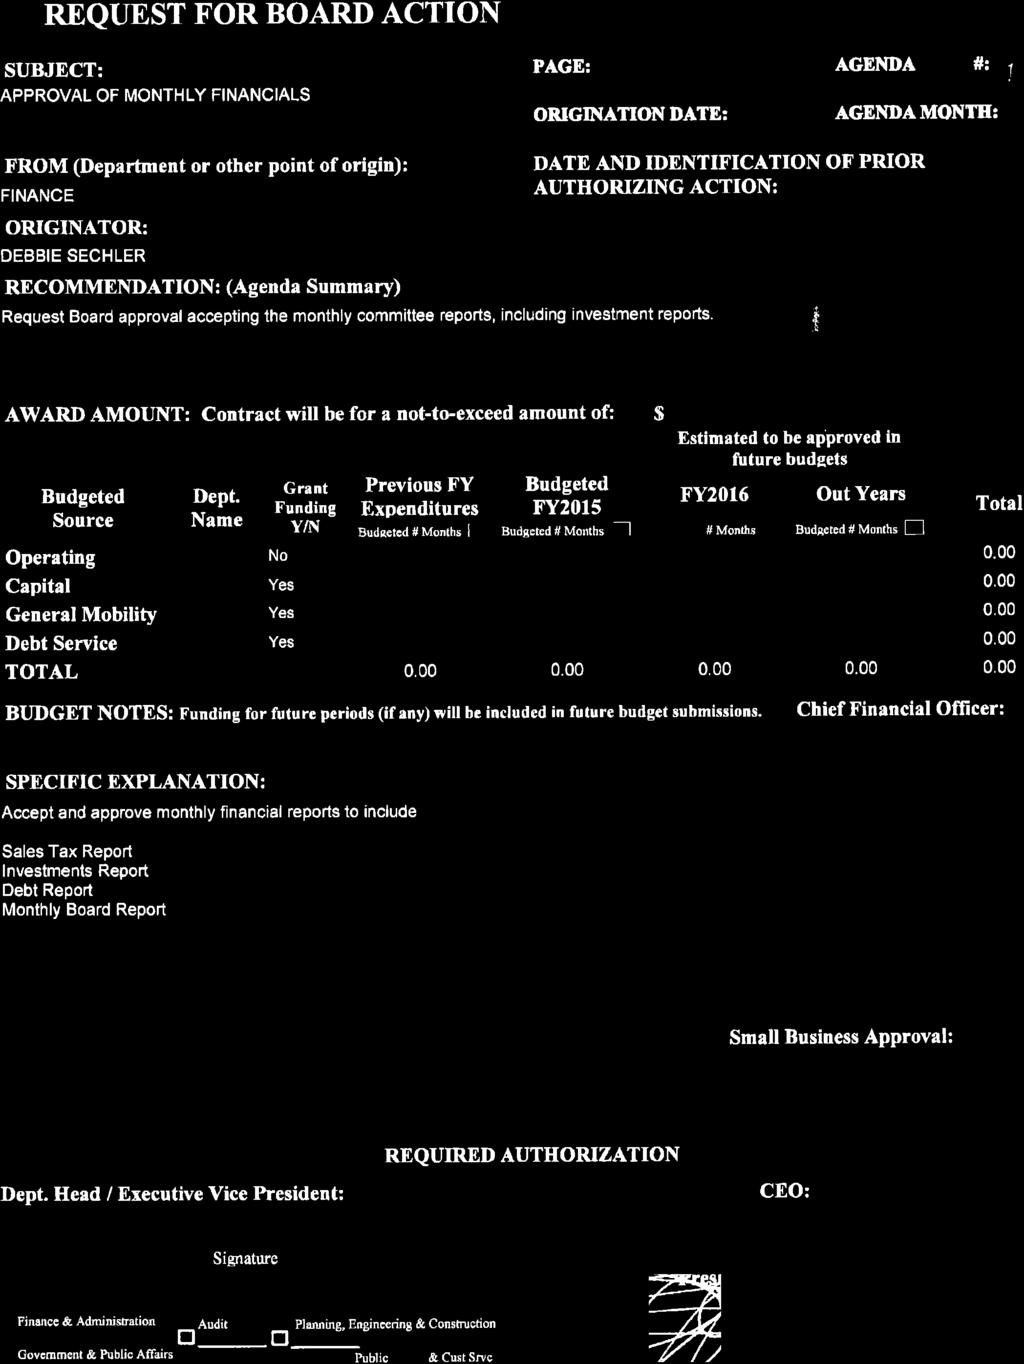
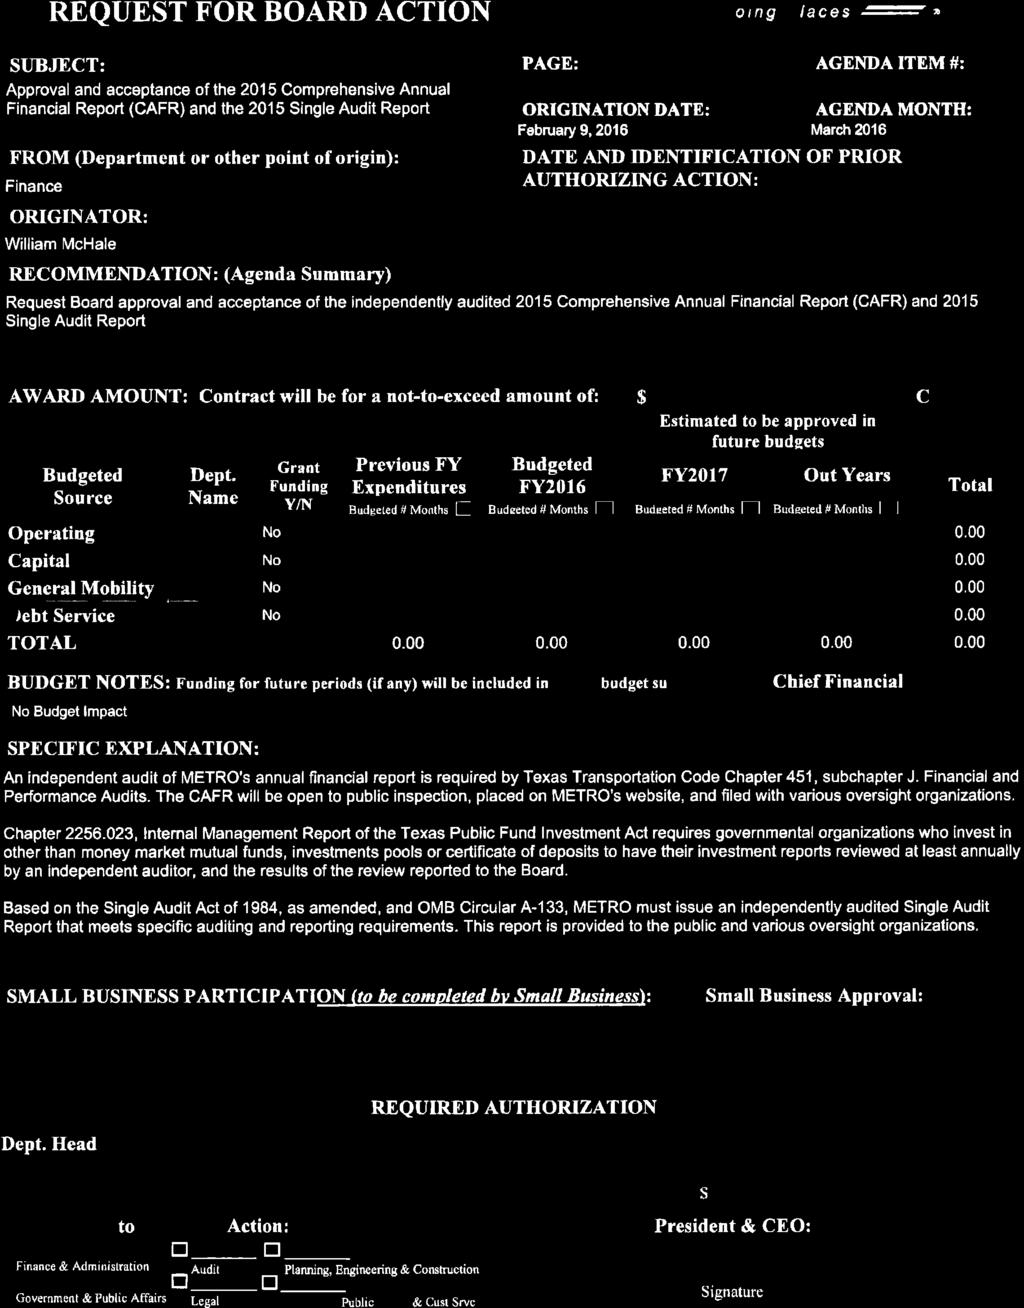
1 Thomas C. Lambert PRESIDENT & CEO METRO BOARD OF DIRECTORS Finance and Audit Agenda Working Committee Meeting METRO Board Room, 2 nd Floor March 21, 2016, 8:30 AM COMMITTEE MEMBERS Cindy Siegel, Chair Diann Lewter Jim Robinson ACTION 1. Request Board approval accepting the monthly committee reports, including investment reports. D. Sechler 2. Request Board approval of the 2015 Comprehensive Annual Financial Report and the 2015 Single Audit Report D. Sechler BRIEFINGS 3. Monthly Compliance Report A. Smiley 4. Monthly Financial Reports Debbie Sechler a. CFO Presentation b. Sales Tax Report c. Investment Report d. Debt Report e. Monthly Board Report 5. Sales Tax Forecast Update P. Brenner 6. Transit Planning 4 All Grant Opportunity A.Lyne Page 1
2
3
4 KPMG LLP 811 Main Street Houston, TX March 14, 2016 The Board of Directors Metropolitan Transit Authority of Harris County, Texas Ladies and Gentlemen: In planning and performing our audit of the financial statements of Metropolitan Transit Authority of Harris County (the Authority), in accordance with auditing standards generally accepted in the United States of America, we considered the Authority s internal control over financial reporting (internal control) as a basis for designing our auditing procedures for the purpose of expressing our opinion on the financial statements but not for the purpose of expressing an opinion on the effectiveness of the Authority s internal control. Accordingly, we do not express an opinion on the effectiveness of the Authority s internal control. During our audit we noted a matter involving internal control that is presented for your consideration. This comment and recommendations, all of which have been disclosed with the appropriate members of management, are intended to improve internal control and are summarized as follows: Census Data Union and Non-Union Pension Plans In connection with the audit, we tested the completeness and accuracy of the census data provided to the Authority s actuary for the Union and Non-Union Pension plans. Out of a sample size of 50, we identified the following exceptions: Union plan 3 active member s date of hire per source documents did not match the census data. Differences ranged from 3 days to 124 days. Union plan 5 retiree s dates of birth per source documents did not match the census data. Differences ranged from 10 days to 24 days. Union plan 3 retiree s benefit start dates per source documents did not match the census data. Differences ranged from 14 days to 32 days. Non-Union plan 2 retiree s dates of birth per source documents did not match the census data. Differences ranged from 2 days to 21 days. KPMG LLP is a Delaware limited liability partnership, the U.S. member firm of KPMG International Cooperative ( KPMG International ), a Swiss entity.
5 The Board of Directors Metropolitan Transit Authority March 14, 2016 Page 2 of 3 Non-Union plan 2 retiree s benefit start dates per source documents did not match the census data. Differences ranged from 1 day to 31 days. These exceptions did not have a material impact on the actuarial analysis and pension liabilities. The Authority recently initiated a project to review its census data files and make adjustments to its data, as appropriate. In connection with this project, the Authority identified approximately 58 Union plan participants that had improperly been excluded from census data submitted to the actuary for the December 31, 2013 valuation. These participants were properly included in the December 31, 2014 valuation. We recommend that the Authority s management perform the following as part of ensuring the completeness and accuracy of the census data for all of its defined benefit plans, with a specific focus on the retiree population: Prior to submission to the actuary, complete a thorough review of the census data to ensure the integrity of the information, including the start date, retirement date, and date of birth. Implement controls to mitigate risk of error in data processing the manual components of the recordkeeping process. Consider computerizing retiree personnel records which are currently being maintained manually. Conduct an inventory of personnel records to confirm that all eligible employees have properly been included in the census data submitted to the actuary. Management Response Management will perform a complete audit of pension files before the end of December 31, 2016 to ensure that any additional errors are found and corrected. The work will be completed by the two Retirement Plan Analysts within the Benefits group, and signed off by the Plan Administrator and the Director of Benefits, Pension and Wellness prior to submittal for the next valuation. Retiree data is being loaded into the SAP system, which will allow further automation of the process of creating the census and fewer errors as a result of manual entry. Target date for completion is December 31, We have upgraded our record keeping system with the State Street Trust which has added further control features to our system. Additionally, we have made changes to the security system and have limited access. Previously, there were two instances in which one user could enter and approve the same data. This has been corrected to allow each user to have only the function of entering or approving data in the system, thus ensuring that all data is reviewed before final submission.
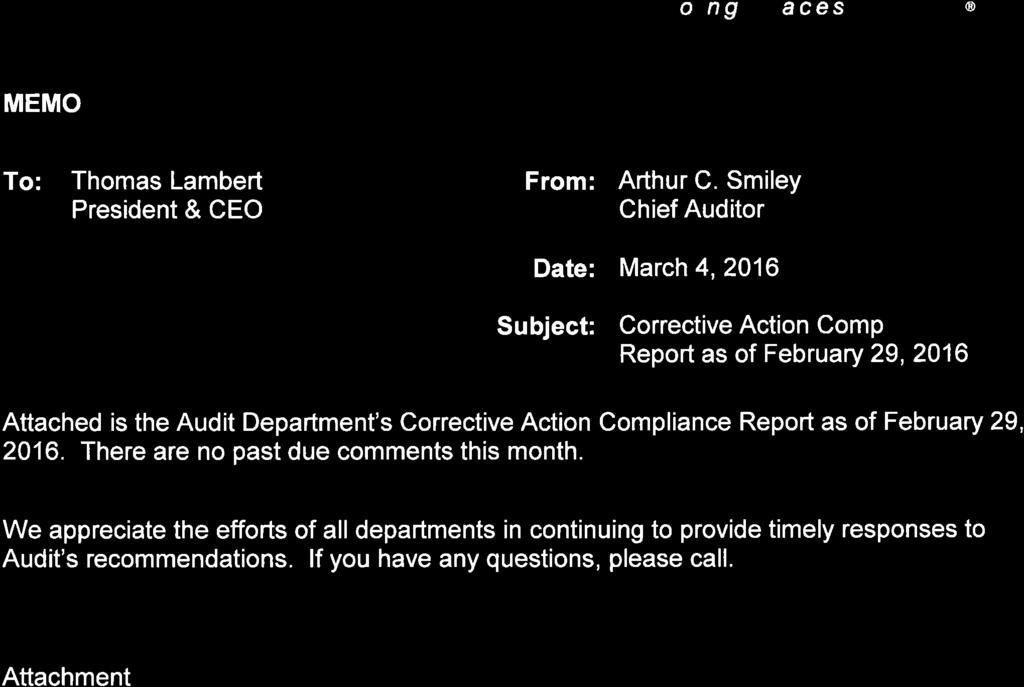
6 The Board of Directors Metropolitan Transit Authority March 14, 2016 Page 3 of 3 The Authority s IT and HRIS teams are reviewing options for digitizing employee and pension records in the future. * * * * * * * Our audit procedures are designed primarily to enable us to form an opinion on the financial statements, and therefore may not bring to light all weaknesses in policies or procedures that may exist. We aim, however, to use our knowledge of the Authority s organization gained during our work to make comments and suggestions that we hope will be useful to you. We would be pleased to discuss this comment and recommendation with you at any time. This communication is intended solely for the information and use of management, the Board of Directors, others within the organization, and the Authority, and is not intended to be and should not be used by anyone other than these specified parties. Very truly yours,


7 METRO Audit Results September 30, 2015 This presentation to the Board of Directors is intended solely for the information and use of the Board of Directors and management and is not intended to be and should not be used by anyone other than these specified parties. This presentation is not intended for general use, circulation or publication and should not be published, circulated, reproduced or used for any purpose without our prior written permission in each specific instance.
8 Agenda Management and Board responsibilities KPMG responsibilities Audit results and status Areas of Audit Emphasis New Accounting Pronouncements (GASBs 68 and 71) Financial statement highlights Single audit highlights Required communications 2015 KPMG LLP, a Delaware limited liability partnership and the U.S. member firm of the KPMG network of independent member firms affiliated with KPMG International Cooperative ( KPMG International ), a Swiss entity. All rights reserved. 1
9 Management and Board responsibilities Management responsibilities Adopting and maintaining sound accounting policies Establishing and maintaining internal control over financial reporting Fairly presenting the financial statements in conformity with generally accepted accounting principles Identifying and complying with the requirements of laws, regulations, contracts, and grants applicable to the Authority Making all financial records and related information available to the auditor Board responsibilities Oversight of the financial reporting process and internal controls Oversight of the establishment and maintenance by management of programs and controls designed to prevent, deter, and detect fraud 2015 KPMG LLP, a Delaware limited liability partnership and the U.S. member firm of the KPMG network of independent member firms affiliated with KPMG International Cooperative ( KPMG International ), a Swiss entity. All rights reserved. 2
10 KPMG s responsibilities Forming and expressing opinions about whether the financial statements prepared by management with the oversight of those charged with governance are presented fairly, in all material respects, in conformity with generally accepted accounting principles Planning and performing the audit to obtain reasonable not absolute assurance about whether the financial statements are free of material misstatement, whether caused by fraud or error. Conducting an audit in accordance with professional standards Communicating all required information to management and to the Board of Directors 2015 KPMG LLP, a Delaware limited liability partnership and the U.S. member firm of the KPMG network of independent member firms affiliated with KPMG International Cooperative ( KPMG International ), a Swiss entity. All rights reserved. 3
11 Fiscal 2015 audit results and status Audit execution Audit reports Other deliverables Audit was completed in accordance with our professional standards and audit plan Management was helpful and professional Testwork completed timely Independent auditors report on the audited financial statements Unmodified opinion Report issued March 14, 2016 Single Audit A-133 auditors reports In process filing deadline is June 30, 2016 Target completion date is March 31, 2016 National Transit Database Agreed Upon Procedures Report timely issued February 1, 2016 No findings Report to the Committee on various matters in accordance with Statement of Auditing Standards No. 114, The Auditors Communication with those Charged with Governance and on internal control matters Communications summarized herein and our formal letters will be issued with the financial statements 2015 KPMG LLP, a Delaware limited liability partnership and the U.S. member firm of the KPMG network of independent member firms affiliated with KPMG International Cooperative ( KPMG International ), a Swiss entity. All rights reserved. 4
12 Fiscal 2015 audit results and status No Scope Limitations Related to Audit Work Open and Effective Communication with Management We test controls for the purpose of our audit procedures. We did not conduct our procedures for the purpose of issuing an opinion on internal controls No significant deficiencies, or material weaknesses noted One control deficiency related to census data Data provided to actuary did not agree to personnel files This is a repeat finding from 2014 Manual process to identify personnel no longer eligible to receive benefits One passed audit difference related to $7.9 million of depreciation expense from the prior year 2015 KPMG LLP, a Delaware limited liability partnership and the U.S. member firm of the KPMG network of independent member firms affiliated with KPMG International Cooperative ( KPMG International ), a Swiss entity. All rights reserved. 5
13 Areas of audit emphasis Investments Texas Public Fund Investment Act Compliance Sales Tax and FTA Receivable Capital Asset and Completed Projects (new rail lines) Bonds Pension Plans and Other Post-Employment Benefits (OPEB) Revenues Expenses 2015 KPMG LLP, a Delaware limited liability partnership and the U.S. member firm of the KPMG network of independent member firms affiliated with KPMG International Cooperative ( KPMG International ), a Swiss entity. All rights reserved. 6
14 Other matters of emphasis Local infrastructure assistance Footnote 7, page 46 Fuel Hedges Negative $15 million at September 30, 2015 Footnote 7, page 55 Axle Counter performance issues and discussions with HRT Footnote 7, page 56 CAF rail car performance issues Footnote 7, page 56 FTA grant required matching (True-up) METRO will be required to identify additional matching before grant concludes in 2021 Footnote 7, page KPMG LLP, a Delaware limited liability partnership and the U.S. member firm of the KPMG network of independent member firms affiliated with KPMG International Cooperative ( KPMG International ), a Swiss entity. All rights reserved. 7
15 New Accounting Pronouncements GASB Statement No. 68 Accounting and Financial Reporting for Pensions The primary objective of this Statement is to improve accounting and financial reporting by state and local governments for pensions. It also improves information provided by state and local governmental employers about financial support for pensions that is provided by other entities. This Statement results from a comprehensive review of the effectiveness of existing standards of accounting and financial reporting for pensions with regard to providing decision-useful information, supporting assessments of accountability and interperiod equity, and creating additional transparency. This Statement replaces the requirements of Statement No. 27, Accounting for Pensions by State and Local Governmental Employers, as well as the requirements of Statement No. 50, Pension Disclosures, as they relate to pensions that are provided through pension plans administered as trusts or equivalent arrangements (hereafter jointly referred to as trusts) that meet certain criteria. The requirements of Statements 27 and 50 remain applicable for pensions that are not covered by the scope of this Statement. This Statement is effective for fiscal years beginning after June 15, 2014 (Fiscal Year 2015 for Metro). GASB 71 - Pension Transition for Contributions Made Subsequent to the Measurement Date An Amendment of GASB Statement No. 68 Effective for current year 2015 KPMG LLP, a Delaware limited liability partnership and the U.S. member firm of the KPMG network of independent member firms affiliated with KPMG International Cooperative ( KPMG International ), a Swiss entity. All rights reserved. 8
16 Millions Financial statement highlights $3,500 $3,000 $2,500 $2,000 $1,500 $1,000 $500 $0 Capital Assets, net of depreciation $3,081 $3,140 $2,979 $2,580 $2,293 1,848 $1,970 $2, KPMG LLP, a Delaware limited liability partnership and the U.S. member firm of the KPMG network of independent member firms affiliated with KPMG International Cooperative ( KPMG International ), a Swiss entity. All rights reserved. 9
17 $53.8 $67.1 $64.5 $68.7 $66.9 $72.8 $76.3 $74.7 $85.0 $100.4 $155.9 $151.1 $173.3 $96.8 Millions $328.7 $521.2 $518.0 $490.0 $536.6 $593.7 $642.5 $685.2 $715.2 $413.4 Financial statement highlights (continued) Revenue Sources $800 $700 $600 $500 $400 $300 $200 $100 $0 Transportation Fares Sales Tax Grants KPMG LLP, a Delaware limited liability partnership and the U.S. member firm of the KPMG network of independent member firms affiliated with KPMG International Cooperative ( KPMG International ), a Swiss entity. All rights reserved. 10
18 Millions Financial statement highlights (continued) $800 $700 $600 $500 $400 $300 $200 $100 $0 $496.5 Total Operating Expenses $563.7 $562.6 $570.5 $573.5 $591.9 $641.8 $ KPMG LLP, a Delaware limited liability partnership and the U.S. member firm of the KPMG network of independent member firms affiliated with KPMG International Cooperative ( KPMG International ), a Swiss entity. All rights reserved. 11
19 Millions Financial statement highlights (continued) $150 Total Unrestricted Net Position $104.6 $100 $50 $35.1 $33.9 $0 -$1.3 -$50 -$100 -$70.4 -$150 -$200 -$94.9 -$ $112.5 See Note Note Decline is a result of $178 million net pension liability recorded on adoption of GASB KPMG LLP, a Delaware limited liability partnership and the U.S. member firm of the KPMG network of independent member firms affiliated with KPMG International Cooperative ( KPMG International ), a Swiss entity. All rights reserved. 12
20 Single Audit results and status 2 Major Programs Highway Planning and Construction Program Federal Transit Cluster Findings Pending Matters Issue report File data collection form with Data Clearinghouse Prior Year Audit Findings Highway Planning and Construction Program allowable costs/activities (remediated) 2015 KPMG LLP, a Delaware limited liability partnership and the U.S. member firm of the KPMG network of independent member firms affiliated with KPMG International Cooperative ( KPMG International ), a Swiss entity. All rights reserved. 13
21 Required communications Matter Significant accounting policies and unusual transactions Alternative treatments Management s judgment and accounting estimates (selection and significance) Comments See Note 1 in CAFR for policies including measurement basis and accounting treatments, such as, revenue/receivables, capital assets, debt. None noted See Note 1 in CAFR, management judgments and estimates appear reasonable Self Insurance Liabilities OPEB/Pension Disclosures Fuel Hedge Effectiveness 2015 KPMG LLP, a Delaware limited liability partnership and the U.S. member firm of the KPMG network of independent member firms affiliated with KPMG International Cooperative ( KPMG International ), a Swiss entity. All rights reserved. 14
22 Required communications (continued) Matter Other information contained in the CAFR Disagreements with management Major issues discussed with management prior to retention Consultation with other accountants Difficulties encountered in performing the review of financial statements Written communication between management and KPMG Comments Required Supplementary Information, including MD&A, Schedules of Pension Trusts, as well as other info. None noted. None noted. None noted. None noted. Engagement Letter, Management Representation letter, Management Letter for Control Deficiency KPMG LLP, a Delaware limited liability partnership and the U.S. member firm of the KPMG network of independent member firms affiliated with KPMG International Cooperative ( KPMG International ), a Swiss entity. All rights reserved. 15

23 Thank you
, a Swiss entity. All rights reserved.")
24 2015 KPMG LLP, a Delaware limited liability partnership and the U.S. member firm of the KPMG network of independent member firms affiliated with KPMG International Cooperative ( KPMG International ), a Swiss entity. All rights reserved. The KPMG name, logo and cutting through complexity are registered trademarks or trademarks of KPMG International.
 for the year ended September 30, 2015 (FY2015).")
25 March 14, 2016 To the Board of Directors, Metropolitan Transit Authority of Harris County, Texas (METRO) and members of METRO s Service Area I am pleased to present METRO s Comprehensive Annual Financial Report (CAFR) for the year ended September 30, 2015 (FY2015). This report represents the highest form of external financial reporting and has been developed by the Office of the Controller with support from other groups within METRO. METRO s management is responsible for the information presented in this report. METRO was established under Texas Law in 1977 and began operation in 1979 to develop, maintain, and operate a public transportation system primarily in Harris County, Texas. The service area comprises 4.3 million potential customers and includes Houston, the nation s fourth largest city, as well as 14 smaller incorporated cities and parts of unincorporated Harris County. METRO is the region s largest public transit provider offering safe, reliable, and affordable transportation services about 370,000 times per day. In addition to operating approximately 1,400 buses on METRO s new bus network, we also provide other services, which include STAR Vanpool, METROLift, High Occupancy Vehicle/High Occupancy Toll Lane, Bikes-on-Bus/Train program, Park & Ride, and funding for road improvement/congestion mitigation program. METRO s revenue sources include a 1% local sales tax imposed across the geographic service area, fares, and federal grants. During 2012, voters approved a referendum, which continues the General Mobility Program through Under this program, 25% of the annual sales tax proceeds, adjusted for certain limits established in FY2014, will be used to fund general mobility projects of local governments. The limits established in FY2014 will provide additional money for non-rail transit activities. Current year s highlights include: Earning the 2015 Outstanding Public Transportation System Achievement Award from the American Public Transportation Association Implementing METRO s new bus network, which gives riders more options and better service Expanding light-rail operations by opening both the SouthEast and East End light-rail lines. Starting construction on the East End Harrisburg Overpass Selling $115 million of bonds of which $60 million was used to reduce commercial paper debt and the rest dedicated to the purchase of new replacement buses Supporting our community by continuing to focus on safety and security through training, awareness, and active policing 1

26 Rating from State of Texas The Texas Comptroller has awarded METRO the PLATINUM Leadership Circle award by the Texas Comptroller for the second year in a row. The award recognizes public entities across Texas for financial transparency. The PLATINUM designation is the highest honor granted by the Comptroller's office. METRO scored a 21 out of 23 possible points. The agency was graded on criteria including annual budget, check register, financial transparency Web page, and budgets for the three most recent fiscal years. Financial Information and Certificate of Achievement for Excellence in Financial Reporting In addition to providing high quality financial information, METRO s Department of Finance supports longterm strategic planning, investment/cash management, Grants, Q-card administration, issues quality financial information, and ensures compliance with various federal and state laws, rules, and regulations. One of our main goals at METRO is to enhance and maintain our status as a trusted community partner by establishing and adhering to financial policies that inspire public trust. The recognition of our independent peers goes far in helping us demonstrate to the public that we are committed to achieving that goal. For the fifth consecutive year, the Department of Finance earned the Texas Comptroller s top award for financial transparency. METRO also continued to earn Certificate of Achievement for Excellence in Financial Reporting for METRO s CAFR and the two separate defined benefit pension plans CAFRs. METRO is not a component unit and the accompanying financial statements include all activities for which it is financially accountable as defined by Governmental Accounting Standard No. 14, The Financial Reporting Entity and Standard No. 61. The Financial Reporting Entity: Omnibus-An Amendment of GASB Statement No 14 and No. 34. METRO s principal operating and capital resources are derived from a 1% sales tax levied in its service area, user fees for transit service, investment income, and federal capital/operating grants. METRO s expenditures relate primarily to transit operations, local infrastructure improvements, traffic management, and various capital projects. The responsibility for accuracy, reliability, and fairness of presentation of the financial information and related disclosures in the CAFR rests with METRO s management. All disclosures that are necessary to enable the reader to gain an understanding of METRO s financial activities have been included. METRO s management is also responsible for ensuring that an adequate internal control structure is in place for preparation of financial information, safeguarding of assets, effective and efficient use of resources, and compliance with applicable laws and regulations. The internal control structure has been designed to provide reasonable, but not absolute, assurance that these objectives are met. The concept of reasonable assurance recognizes that: (1) the cost of a control should not exceed the benefits likely to be derived and (2) the valuation of cost and benefits requires estimates and judgment by management. In addition, METRO is required by state and federal laws to have independent certified public accountants perform audits and issue reports in accordance with generally accepted auditing standards, the Single Audit Act of 1996, and U.S. Office of Management and Budget Circular A-133. These reports are filed annually with the appropriate state and federal agency. METRO uses a single fund to account for all financial activity, which includes transit operations, traffic management, infrastructure assistance (which includes General Mobility) capital programs, grant revenues, sales tax, and related activity. METRO s cash and investment policy is to monitor and adjust, on a daily basis, its cash balance and investment portfolio while investing in only those securities that have been legally authorized by the Texas 2

27 Public Fund Investment Act and approved by the Board of Directors as listed in Note 2 of the financial section. METRO is self-insured, except for property risk insurance, for which it pays an annual premium to a thirdparty insurance company. Other Information The Government Finance Officers Association (GFOA) awarded a Certificate of Achievement for Excellence in Financial Reporting to METRO for its CAFR for the year ended September 30, This is the 23rd consecutive year this prestigious award was received. In order to be awarded a Certificate of Achievement, METRO must publish an easily readable and efficiently organized CAFR. This report must also satisfy both generally accepted accounting principles and applicable legal requirements. The Certificate of Achievement is valid for a period of one year. We believe that our current CAFR continues to meet the Certificate of Achievement Program s requirements and we are submitting it to the GFOA to determine its eligibility for another certificate. Contact Information If you have questions about this report or need additional financial information, contact the Department of Finance, Metropolitan Transit Authority of Harris County, Texas 1900 Main Street, Houston, TX METRO s financial statements have been audited by KPMG LLP. Acknowledgments METRO s management expresses its appreciation to the employees and the Board of Directors for their commitment in making this one of the best transit agencies in the nation. Additional analysis can be found in the Management s Discussion and Analysis section, which starts on page 18. Debbie Sechler Executive VP & Chief Financial Officer 3


28
29

30
31
32

33
34
35
36
37 BOARD BRIEFING SUMMARY SUBJECT: AGENDA ITEM #: MONTHLY FINANCIAL REPORTS AGENDA DATE: DEPARTMENT: FINANCE & AUDIT PRESENTER: DEBBIE SECHLER SUMMARY: - CFO's Report - FINANCE COMMITTEE REPORT a. SALES TAX REPORT b. INVESTMENT REPORT c. DEBT REPORT d. MONTHLY BOARD REPORT
38 The Monthly Report of the Chief Financial Officer Finance & Audit Committee March 21, 2016
39 millions Sales Tax Revenues Revenue thru March 2016 is $352.9 million $11.2 million or 3.3% over estimates $15.1 million or 4.1% under FY2015 year-to-date $80.0 $70.0 $60.0 $50.0 $40.0 $30.0 $20.0 OCT NOV DEC JAN FEB MAR APR MAY JUN JUL AUG SEP FY2016 Budget FY2016 Actual FY2015 Actual Funds Received in Compared to Estimate Compared to Prior Year March $0.05M 0.1% ($3.6M) (6.6%) February ($0.9M) (1.1%) ($4.4M) (5.6%)

40 Fare Revenue ($ in millions) Variance Explanation ($ in millions) Actual $25.4 Vanpool Revenue -$1.1M Budget $27.8 Paper Paper Transfers - Transfers, $0.7M -$0.7M Vanpool Revenue, -$1.1M Variance: -$2.4M
41 Budget Results
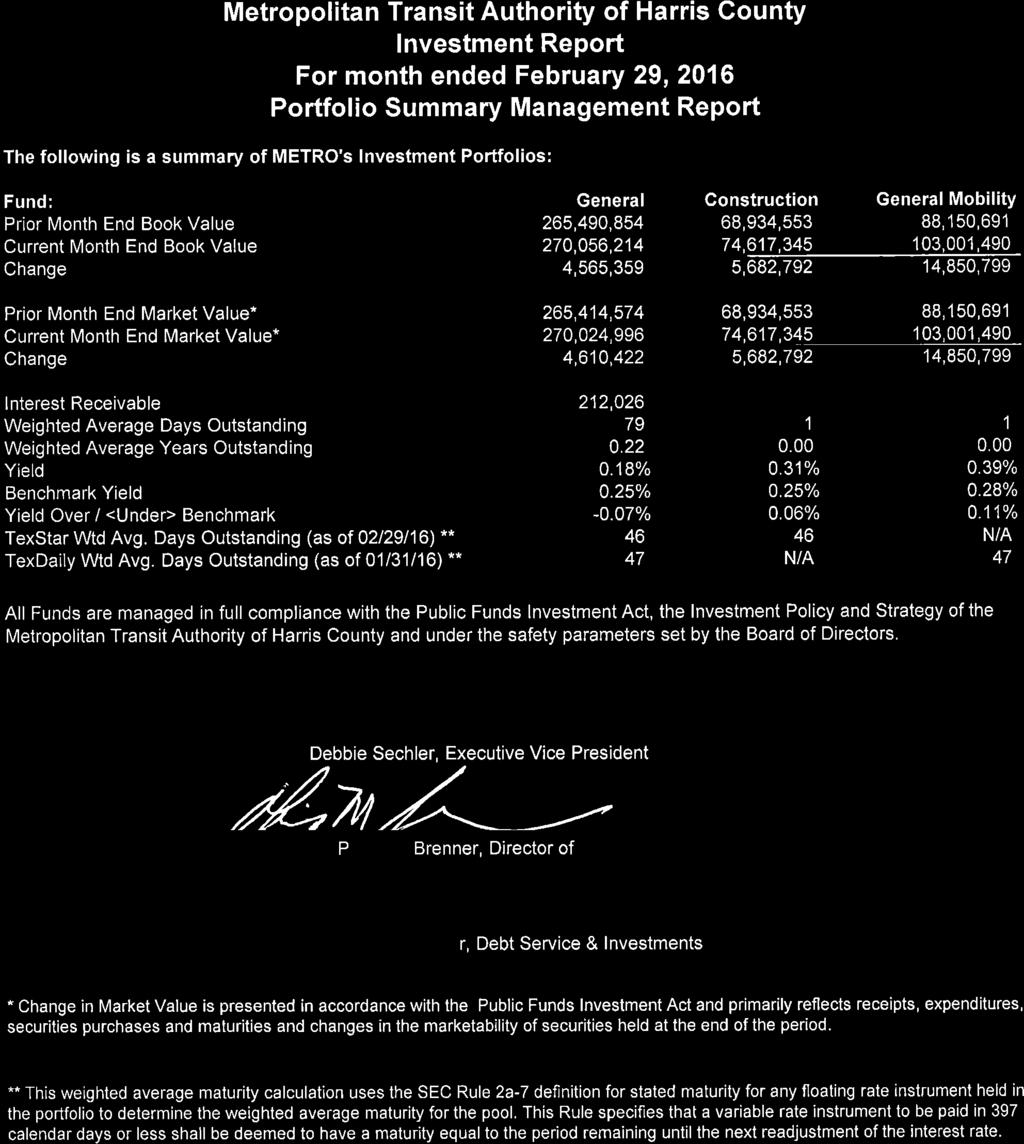
42 Portfolio Summary Fund Beginning Balance, $millions (01/31/2016) Ending Balance, $millions (02/29/2016) Earnings Rate Benchmark Rate General $265.4 $ % 0.25% Construction General Mobility
43 Debt As of Total Debt (millions) February 29, 2016 $ 1,141.0 January 31, 2016 $ 1,141.0
44 Metropolitan Transit Authority Sales & Use Tax Report March 2016 Treasury Services 3/9/2016
45 Metropolitan Transit Authority Sales & Use Tax Net Receipts (Cash Receipts Basis) FY 2016 NET NET GROSS NET VARIANCE CHANGE IN ACTUALS REC'D SALES RECEIPTS ESTIMATE RECEIPTS REBATES RECEIPTS TO FY16 ESTIMATE FY16- FY15 IN IN FY15 FY16 FY16 FY16 FY16 $ % $ % OCT AUG $ 54,330, $ 51,830, $ 53,532, $ 303, $ 53,228, $ 1,397, % $ (1,101,739.19) -2.03% NOV SEP $ 64,787, $ 60,325, $ 63,680, $ 221, $ 63,459, $ 3,133, % $ (1,328,537.02) -2.05% DEC OCT $ 59,498, $ 52,059, $ 56,111, $ 130, $ 55,981, $ 3,921, % $ (3,517,546.99) -5.91% JAN NOV $ 56,563, $ 51,908, $ 55,658, $ 224, $ 55,433, $ 3,525, % $ (1,129,386.75) -2.00% FEB DEC $ 78,343, $ 74,769, $ 74,122, $ 203, $ 73,919, $ (849,905.88) -1.14% $ (4,423,718.47) -5.65% MAR JAN $ 54,449, $ 50,814, $ 51,011, $ 155, $ 50,856, $ 42, % $ (3,593,507.08) -6.60% APR FEB $ 51,992, $ 50,121, $ - $ - $ - $ % $ % MAY MAR $ 66,900, $ 68,110, $ - $ - $ - $ % $ % JUN APR $ 54,419, $ 54,549, $ - $ - $ - $ % $ % JUL MAY $ 54,840, $ 56,813, $ - $ - $ - $ % $ % AUG JUN $ 66,392, $ 68,102, $ - $ - $ - $ % $ % SEP JUL $ 55,867, $ 55,953, $ - $ - $ - $ % $ % TOTAL $ 718,386, $ 695,359, $ 354,117, $ 1,238, $ 352,878, $ 11,170, % $ (15,094,435.49) -4.10% Net Receipts Estimate Net Receipts Net Receipts YTD % Over YTD % Chge YTD FY 16 YTD FY 15 YTD FY 16 FY 16 Est FY Act $ 341,708, $ 367,973, $ 352,878, % -4.10% Treasury Services 3/9/2016 Page 1 of 4
46 Metropolitan Transit Authority Sales & Use Tax Net Receipts (Cash Receipts Basis) Most Recent 12-Month History Including Accrual for Rebates NET RECEIPTS REC'D SALES NET CHANGE IN IN FISCAL NET FISCAL GROSS REBATES RECEIPTS AMOUNT % APR FEB FY '14 $ 49,701, FY'15 $ 52,217, $ 224, $ 51,992, $ 2,291, % MAY MAR FY '14 $ 62,313, FY'15 $ 67,152, $ 251, $ 66,900, $ 4,586, % JUNE APR FY '14 $ 55,132, FY'15 $ 54,633, $ 213, $ 54,419, $ (712,617.10) -1.29% JULY MAY FY '14 $ 54,501, FY'15 $ 55,005, $ 165, $ 54,840, $ 338, % AUG JUNE FY '14 $ 62,285, FY'15 $ 66,518, $ 125, $ 66,392, $ 4,106, % SEPT JULY FY '14 $ 56,517, FY'15 $ 56,803, $ 935, $ 55,867, $ (649,626.40) -1.15% OCT AUG FY'15 $ 54,330, FY'16 $ 53,532, $ 303, $ 53,228, $ (1,101,739.19) -2.03% NOV SEP FY'15 $ 64,787, FY'16 $ 63,680, $ 221, $ 63,459, $ (1,328,537.02) -2.05% DEC OCT FY'15 $ 59,498, FY'16 $ 56,111, $ 130, $ 55,981, $ (3,517,546.99) -5.91% JAN NOV FY'15 $ 56,563, FY'16 $ 55,658, $ 224, $ 55,433, $ (1,129,386.75) -2.00% FEB DEC FY'15 $ 78,343, FY'16 $ 74,122, $ 203, $ 73,919, $ (4,423,718.47) -5.65% MAR JAN FY'15 $ 54,449, FY'16 $ 51,011, $ 155, $ 50,856, $ (3,593,507.08) -6.60% TOTAL $ 708,425, $ 706,446, $ 3,154, $ 703,292, $ (5,132,561.65) -0.72% CURRENT MONTH REBATE ACCRUALS Reliant Stadium $ 30, Baybrook MUD $ 124, Total Rebates $ 155, Treasury Services 3/9/2016 Page 2 of 4
47 METRO INVESTMENT REPORT ALL FUNDS February 2016
48
49 Metropolitan Transit Authority of Harris County Monthly Changes in Position As of February 29, 2016 Maturity Purch Book Value Market Value No. Description Coupon Rating Date Date Par Cost Price YTM Type 1/31/2016 2/29/2016 1/31/2016 2/29/2016 General Fund Wells Fargo Master Account 3/1/2016 2/29/2016 4,949,005 4,949, % DDA 5,824,785 4,949,005 5,824,785 4,949,005 Wells Fargo HOT Lanes Account 3/1/2016 2/29/ ,420 43, % DDA 21,038 43,420 21,038 43,420 Wells Fargo Mobile Ticketing 3/1/2016 2/29/2016 1,129 1, % DDA 32 1, ,129 TexStar Investment Pool AAAm 3/1/2016 2/29/ ,025,123 52,025, % LGIP 50,011,579 52,025,123 50,011,579 52,025,123 TexDaily Investment Pool AAAm 3/1/2016 2/29/ ,092,670 13,092, % LGIP 9,666,039 13,092,670 9,666,039 13,092, EDM66 / Federal Farm Credit Banks 0.39% 5/27/2016 5/27/ ,000,000 14,988, % A 14,998,212 14,998,659 14,982,000 14,987, KF70 / Federal Agricultural Mortage Corp % NA* 9/13/2016 9/14/ ,000,000 19,904, % A 19,941,089 19,948,682 19,936,200 19,952, UB9 / Fannie Mae 0.290% NA* 3/9/2016 9/14/ ,000,000 29,957, % A 29,991,008 29,998,056 29,991,000 29,998,200 EWBCD17 East West Bank CD 0.400% Coll = Aaa 3/12/2016 9/14/ ,000,000 10,000, % CD 10,000,000 10,000,000 10,000,000 10,000, KG61 / Federal Agricultural Mortage Corp % NA* 9/20/2016 9/22/ ,000,000 14,931, % A 14,956,380 14,961,833 14,950,650 14,962,800 EWBCD18 East West Bank CD 0.450% Coll = Aaa 5/22/ /24/ ,000,000 10,000, % CD 10,000,000 10,000,000 10,000,000 10,000, TE9 / Federal Home Loan Bank 0.290% NA* 2/17/ /24/2015 5,000,000 4,997, % A 4,999,332 Matured/Called 4,999,400 Matured/Called UW7 / Federal Home Loan Bank 0.380% NA* 3/28/ /28/2015 5,000,000 4,995, % A 4,997,012 4,998,559 4,997,700 4,998, KVA5 / Federal Agricultural Mortage Corp % NA* 4/1/ /29/2015 5,000,000 4,994, % A 4,996,631 4,998,259 4,997,000 4,998, QF0 / US Treasury Note 0.063% Aaa 4/30/ /29/2015 5,000,000 5,042, % T 5,031,299 5,021,100 5,018,750 5,013, P66 / Fannie Mae 0.660% NA* 11/15/ /29/2015 5,000,000 4,970, % A 4,973,518 4,976,184 4,977,200 4,983, G0ES8 / Fannie Mae 1.012% Aaa/AA+ 11/15/ /29/ ,000,000 10,069, % A 10,062,181 10,055,919 10,056,300 10,047, QF0 / US Treasury Note 0.535% Aaa 4/30/ /29/ ,000,000 10,085, % T 10,062,689 10,042,262 10,037,500 10,027, UM0 / US Treasury Note 0.375% Aaa 2/15/ /29/2015 5,000,000 5,008, % T 5,002,471 Matured/Called 5,000,050 Matured/Called KVA5 / Federal Agricultural Mortage Corp % NA* 4/1/ /29/ ,000,000 9,989, % A 9,993,262 9,996,519 9,994,000 9,997, UY3 / Federal Home Loan Bank 0.370% NA* 3/30/ /29/ ,000,000 9,990, % A 9,993,973 9,996,987 9,995,200 9,997, ZQ5 / Federal Home Loan Bank 0.450% AAA 7/20/2016 1/21/2016 5,000,000 4,988, % A 4,989,316 4,991,139 4,989,850 4,992, A74P7 / Federal Home Loan Bank 0.450% AAA 6/30/2016 1/22/2016 5,000,000 5,000, % A 5,000,059 5,000,048 4,999,800 5,000, ZS1 / Federal Home Loan Bank 0.500% AAA 7/22/2016 1/27/2016 5,000,000 4,987, % A 4,987,988 4,990,013 4,989,750 4,992, ZS1 / Federal Home Loan Bank 0.480% AAA 7/22/2016 1/26/2016 5,000,000 4,988, % A 4,988,469 4,990,413 4,989,750 4,992, WX4 / US Treasury Note 0.500% AAA 7/31/2016 1/27/2016 5,000,000 5,013, % T 5,013,493 5,011,331 4,999,450 4,999, ZV8 / Freddie Mac 0.450% NA* 7/25/2016 1/27/2016 5,000,000 4,988, % A 4,989,001 4,990,824 4,989,550 4,992, C98 / Federal Home Loan Bank 0.450% NA* 8/22/2016 2/16/2016 5,000,000 4,988, % A Did Not Own 4,989,067 Did Not Own 4,989, E25 / Freddie Mac 0.430% NA* 8/31/2016 2/17/2016 5,000,000 4,988, % A Did Not Own 4,989,015 Did Not Own 4,989,350 Total General Fund 265,490, ,056, ,414, ,024,996 Construction Fund Interest & Sinking Fund 2008B (Wells Fargo) 0.00% AAAm 3/1/2016 2/29/ ,816 19, % 18,732 19,816 18,732 19,816 Series 2008B DSR (TexStar) 0.31% AAAm 3/1/2016 2/29/2016 4,707,271 4,707, % LGIP 4,707,179 4,707,271 4,707,179 4,707,271 Sales & Use Tax Bonds DSR (TexStar) 0.31% AAAm 3/1/2016 2/29/ ,945,913 20,945, % LGIP 20,940,677 20,945,913 20,940,677 20,945,913 Contractual Obligations DSR (TexStar) 0.31% AAAm 3/1/2016 2/29/2016 8,232,969 8,232, % LGIP 8,230,911 8,232,969 8,230,911 8,232,969 Interest & Sinking Fund (2009 & 2010) (TexStar) 0.31% AAAm 3/1/2016 2/29/2016 8,147,517 8,147, % LGIP 6,110,564 8,147,517 6,110,564 8,147,517 Interest & Sinking Fund 2011A (TexStar) 0.31% AAAm 3/1/2016 2/29/ ,241,490 10,241, % LGIP 7,681,025 10,241,490 7,681,025 10,241,490 Interest & Sinking Fund 2011B (TexStar) 0.31% AAAm 3/1/2016 2/29/2016 1,783,871 1,783, % LGIP 1,337,887 1,783,871 1,337,887 1,783,871 Interest & Sinking Fund 2014 (TexStar) 0.31% AAAm 3/1/2016 2/29/2016 4,177,781 4,177, % LGIP 3,133,298 4,177,781 3,133,298 4,177,781 Proceeds Fund 2014 (TexStar) 0.31% AAAm 3/1/2016 2/29/ ,807,610 13,807, % LGIP 13,804,158 13,807,610 13,804,158 13,807,610 Interest & Sinking Fund 2015A (TexStar) 0.31% AAAm 3/1/2016 2/29/ , , % LGIP 1,219, ,210 1,219, ,210 Interest & Sinking Fund 2015B (TexStar) 0.31% AAAm 3/1/2016 2/29/2016 2,333,896 2,333, % LGIP 1,750,401 2,333,896 1,750,401 2,333,896 Total Construction Fund 68,934,553 74,617,345 68,934,553 74,617,345 General Mobility Fund TexDaily Investment Pool GMP 0.39% AAAm 3/1/2016 2/29/ ,001, ,001, % LGIP 88,150, ,001,490 88,150, ,001,490 Total General Mobility Fund 88,150, ,001,490 88,150, ,001,490 Grand Total All Funds 422,576, ,675, ,499, ,643,831 Notes: AAA is the highest long-term rating. A-1+ is the highest short term rating. DDA: Demand Deposit Account LGIP: Local Government Investment Pool MB: Municipal Bond MCP: Municipal Commercial Paper CD: Certificate of Deposit A: U. S. Agency & Instrumentality Bond MMA: Money Market Account T: U. S. Treasuries NA*: Implicit backing of the Federal Government
50 Metropolitan Transit Authority of Harris County Texas General Mobility Escrow Activity Summary As of February 29, 2016 FY2016 Year to Date Escrow Disbursements Interest to Interest Earned Escrow Description Funding from Escrow General Fund on Escrow Funds Balance Feb-16 Escrow Balance Forward $ 56,192, $ (63,969,868.01) $ - $ 63, $ 88,150, Feb-16 Net Sales Tax Received [((Net Sales Tax X 25%) - FY2014 Feb GMP) / 2 ] + FY2014 Feb GMP [(($73,816, X 25%) - $18,032,868.60) / 2 ] + $18,032, ,243, ,394, Feb-16 Duplicate entry of Net Sales Tax Received (to be corrected) 106,394, Feb-16 City of Houston See attached for details (3,423,073.00) 102,971, Feb-16 Interest Earned 30, ,001, Feb-16 Escrow - Fiscal Year to Date $ 74,435, $ (67,392,941.01) $ - $ 93, $ 103,001,489.99
51 General Mobility Program Political Jurisdictions of Projects Funded in February 2016 Invoiced City Council City of Houston Projects Amount District 17th Pd: West Bellfort Paving & Drainage $ 1,463, F 17th Pd: Traffic Signal Control Software 955, Various 17th Pd: Construction Management & Inspection Services 80, Various 17th Pd: Construction Management & Inspection Services 60, Various $ 2,559, Invoiced County Harris County Projects Amount Precinct 15th Pd: Eldridge Pkwy (San Martin to Alief Clodine) $ 863, $ 863, $ 3,423,073.00
52 METRO DEBT REPORT February 2016
53 Metropolitan Transit Authority of Harris County Texas Debt Report As of February 29, 2016 Type of Debt Purpose Par Value Average Rate Issuance Date Commercial Paper General Mobility $ 169,402,000 Sales & Use Tax Contractual Obligations Series 2009D 40 Orion HEV Buses 20 MCI HEV Buses Wtd. Avg 0.056% Program Inception 10-Jan-06 Maturity / Term Current Wtd. Avg days Cost of Issuance Interest Earned on Disbursements from Proceeds Proceeds Outstanding Balance $ 7,014,204 $ 241,452 $ 169,402,000 $ 96,802,000 $ 35,050, % 30-Dec-09 1-Nov-21 $ 175,686 $ 8,913 $ 35,612,306 $ 19,465,000 Sales & Use Tax Contractual Obligations Series 2010A Sales & Use Tax Contractual Obligations Series 2011B 80 Orion HEV Buses $ 40,290, % 23-Jun-10 1-Nov-22 $ 186,496 $ 27,485 $ 41,902,115 $ 25,855, Orion HEV Buses $ 49,405, % 28-Sep-11 1-Nov-23 $ 93,614 $ 7,784 $ 53,007,784 $ 35,500,000 Sales & Use Tax Contractual Obligations Series Nova Artics 70 Commuter Buses $ 97,953, % 22-Apr-14 1-Nov-29 $ 881,445 $ 11,381 $ 128,853,736 $ 93,457,500 Sales & Use Tax Contractual Obligations Series 2015B 75 NABI Buses 50 NABI CNG Buses 25 MCI Commuter Buses $ 62,485, % 28-Aug Sep-28 $ 514,328 $ 5 $ 72,789,714 $ 62,485,000 Sales & Use Tax Series 2015A CP Take Out $ 52,575, % 28-Aug Sep-20 $ 399,303 $ - $ 60,000,000 $ 52,575,000 Certificates of Participation (COPS) Series 2008A Certificates of Participation (COPS) Series 2008B 46 Orion HEV Buses 52 MCI HEV Buses 10 Signature Orions 50 MCI HEV $ 62,255, % 15-Jul-08 1-Nov-20 $ 215,568 $ 420,316 $ 61,959,754 $ 29,910,000 $ 45,785, % 9-Dec-08 1-Nov-21 $ 151,402 $ 97,461 $ 41,937,000 $ 26,525,000 Total Non-METRORail Expansion $ 615,200, % $ 9,632,046 $ 814,797 $ 665,464,409 $ 442,574,500 Sales & Use Tax Contractual Obligations Series 2009B Rail Vehicles & Set-Up $ 42,780, % 11-Jun-09 1-Nov-33 $ 253,994 $ 83,868 $ 42,161,735 $ 35,745,000 Sales & Use Tax Bonds Series 2009A Sales & Use Tax Bonds Series 2009C - Build America Bonds North and Southeast Corridor Expansion North and Southeast Corridor Expansion $ 94,465, % 11-Jun-09 1-Nov-29 $ 560,859 $ 145,597 $ 96,577,321 $ 75,025,000 $ 82,555, % 11-Jun-09 1-Nov-38 $ 440,193 $ 222,578 $ 77,116,267 $ 82,555,000 Commercial Paper METRORail Expansion Real Estate $ 20,598,000 Wtd. Avg 0.056% Inception 1Wtd. Avg 1 $ 852,967 $ 29,362 $ 20,598,000 $ 20,598,000 Sales & Use Tax Bonds Series 2011A Sales & Use Tax Contractual Obligations Series 2014 North and Southeast Corridor Expansion East Corridor Light Rail Vehicles $ 461,010, % 28-Sep-11 1-Nov-41 $ 869,366 $ 285,759 $ 461,301,403 $ 453,350,000 $ 32,651, % 22-Apr-14 1-Nov-29 $ 293,815 $ 12,941 $ 26,504,415 $ 31,152,500 Total METRORail Expansion $ 734,059, % $ 3,271,194 $ 780,105 $ 724,259,141 $ 698,425,500 Total Debt $ 1,349,260, % $ 12,903,241 $ 1,594,902 $ 1,389,723,550 $ 1,141,000,000
54 DRAFT METRO Fiscal Year 2016 Monthly Board Report Revenue Expense Ridership Performance February /11/2016
55 MONTHLY BOARD REPORT February 2016 Table of Contents Section A Section B Section C Section D Section E Section F Section G Section H Section I Section J Summary Sales Tax Revenue Fare Revenue Grant and Interest & Miscellaneous Revenue Budget and Expense Summary Operating Expenses February 2016 Budget vs. Actual FY2016 YTD Budget vs. Actual FY2016 YTD Major Variance Items FY2016 YTD Operating Budget/Expenses by Department Capital, General Mobility & Debt Service Expenditures Ridership by Service Category Performance Statistics Performance Statistic Notes Balance Sheet
56 MONTHLY BOARD REPORT February 2016 Summary Sales Tax revenue of $352.9 million through March 2016 year-to-date is $11.2 million or 3.3% over estimates. Sales Tax revenue for March 2016 is $50.9 million, $100,000 or 0.1% over estimates. Fare revenue of $26.5 million through February 2016 year-to-date is $2.3 million or 8.1% under budget. February 2016 revenue of $5.4 million is $0.6 million or 10.1% under budget. Service related grant revenue for the year-to-date of $1.6 million through February 2016 is $21.2 million or 93.1% under budget. February 2016 revenue of -$0.03 million is -$21.13 million or 100.1% under budget. Capital Grant revenue year-to-date of $7.2 million through February 2016 is $5.2 million under budget. Interest & Miscellaneous revenue year-to-date of $5.6 million through February 2016 is $1.9 million or 51.1% over budget. February 2016 revenue of $1.1 million is $0.3 million or 37.5% over budget. Operating expenses year-to-date of $211.3 million through February 2016 are $11.8 million or 5.3% under budget. February 2016 expenses of $40.6 million are $2.2 million or 5.1% under budget. METRORail Expansion expenses year-to-date of $25.1 million through February 2016 are $22.0 million or 46.7% under budget. February 2016 expenses of $3.1 million are $3.1 million or 49.7% under budget. Other Capital Improvement Program expenses year-to-date of $11.7 million through February 2016 are $24.9 million or 68.1% under budget. February 2016 expenses of $2.6 million are $8.2 million or 75.8% under budget. General Mobility Program expenses year-to-date of $54.5 million through February 2016 are $16.1 million or 22.8% under budget. February 2016 expenses of $11.9 million are $1.6 million or 11.6% under budget. Debt Service expenses of $43.8 million through February 2016 year-to-date is on budget. Total fixed route ridership year-to-date of 35.8 million through February 2016 is 2.7 million or 8.0% over last year. February 2016 ridership of 7.2 million is 895,000 or 14.2% over last year. METRORail ridership year-to-date of 7.5 million through February 2016 is 2.0 million or 36.8% over last year ridership of 1.6 million is 442,000 or 39.6% over last year. February Performance Indicator Summary: Safety & Security Bus Accidents did not meet the performance goal for the month, but did meet the year-to-date goal. Rail Accidents met the benchmark for the month and for the year-to-date. Total Major Security Incidents met the benchmark for both the month and the year-to-date. Major Security Incidents on METRO properties met the benchmark for both the month and the year-to-date. Service Reliability On-Time Performance for Local Bus routes met the minimum performance standards for the month and for the year-to-date. On-Time Performance for Park & Ride routes met the minimum performance standards for the month and for the year-to-date. On-Time Performance for METROLift met the minimum performance goal for the month but missed the year-to-date goal. On-Time Performance for Rail (red line) missed the benchmark for both the month and year to date. On-Time Performance for Rail (both the green and purple lines) met the benchmark for the month and for the year-to-date. The Mean Distance Between Mechanical Failures (MDBF) for all buses met minimum standards for the month and year-to-date. MDBF for METROLift met minimum standards for the month and yearto-date. Mean Distance Between Service Interruptions for METRORail met minimum standards for the month and year-to-date. Customer Service Complaint Contacts met the goal for the month and for the year-to-date. The number of Commendations exceeded the goal for the month and for the year-to-date. The Average Call Center Answer Delay met the goals for the month and for the year-to-date. Section A Page 1
57 MONTHLY BOARD REPORT February 2016 Sales Tax Revenue thru February 2016 millions $80.0 $70.0 $60.0 $50.0 $40.0 $30.0 $20.0 OCT NOV DEC JAN FEB MAR APR MAY JUN JUL AUG SEP FY2016 Budget FY2016 Actual FY2015 Actual Total FY2016 Sales Tax budget is $695.4 million Budget to Actual FY2016 ($ millions) Budget Actual Variance % October % November % December % January % February (0.9) (1.1%) March % April % May % June % July % August % September % FY 2016 YTD $ $ $ % Prior Year vs. Current Year ($ millions) Prior Year Current Year Variance % October (1.1) (2.0%) November (1.3) (2.1%) December (3.5) (5.9%) January (1.1) (2.0%) February (4.4) (5.6%) March (3.5) (6.4%) April % May % June % July % August % September % FY 2016 YTD $ $ $ (15.1) (4.1%) Section B Page 2
58 MONTHLY BOARD REPORT February 2016 Fare Revenue Total FY2016 Fare Revenue budget is $75.1 million Budget to Actual FY2016 ($ millions) Budget Actual Variance % October (0.6) (8.7%) November (0.3) (6.2%) December % January (1.1) (17.5%) February (0.6) (10.1%) March % April % May % June % July % August % September % FY 2016 YTD $ 28.9 $ 26.5 $ (2.3) (8.1%) Prior Year vs. Current Year ($ millions) Prior Year Current Year Variance % October (0.6) (9.4%) November (0.0) (0.3%) December % January (0.7) (11.1%) February % March % April % May % June % July % August % September % FY 2016 YTD $ 27.7 $ 26.5 $ (1.2) (4.2%) Section C Page 3
59 MONTHLY BOARD REPORT February 2016 Service Related Grant Revenue Total FY2016 Service Related Grant budget is $77.8 million Budget to Actual FY2016 ($ millions) Budget Actual Variance % October % November (0.02) (6.0%) December (0.26) (62.6%) January % February (0.03) (21.13) (100.1%) March % April % May % June % July % August % September % FY 2016 YTD $ $ 1.58 $ (21.19) (93.1%) Capital Grant Revenue Year-to date Capital Grant revenue is $7.2 million versus $12.4 million budgeted Interest & Miscellaneous Revenue Total FY2016 Interest & Miscellaneous Revenue budget is $11.2 million Budget to Actual FY2016 ($ millions) Budget Actual Variance % October % November % December % January % February % March % April % May % June % July % August % September % FY 2016 YTD $ 3.7 $ 5.6 $ % Section D Page 4
60 MONTHLY BOARD REPORT February 2016 Budget and Expense Summary (in $ millions) Operating Budget -5.3% METROLift Budget -2.7% GMP Budget -22.8% Debt Service Budget 0.0% METRORail Expansion -46.7% CIP Program -68.1% Budget Actual $- $40 $80 $120 $160 $200 $240 Section E Page 5
61 MONTHLY BOARD REPORT February 2016 Operating Expenses Comparison of Budget to Actual for the Month (February 2016) FY16 Annual February February $ Variance % Variance Budget Budget Actual (favorable)/unfavorable Labor and Fringe Benefits $ 331,666,613 $ 26,204,079 $ 25,943,783 $ (260,296) (1.0%) Non-Labor 230,648,987 17,797,815 15,919,482 (1,878,333) (10.6%) Subtotal Labor & Non-Labor 562,315,600 44,001,894 41,863,265 (2,138,629) (4.9%) Contingency 10,938, % Allocation to Capital and GMP (14,982,923) (1,214,452) (1,261,195) (46,743) 3.8% Total Operating Budget $ 558,271,000 $ 42,787,442 $ 40,602,070 $ (2,185,372) (5.1%) Comparison of Budget to Actual Year-to-Date February 2016 (5 months) FY16 Annual Year-to-Date Year-to-Date $ Variance % Variance Expense Category Budget Budget Actual (favorable)/unfavorable Wages $ 131,165,999 $ 54,782,895 $ 52,741,976 $ (2,040,919) (3.7%) Union Fringe Benefits 70,129,124 28,275,809 28,341,081 65, % Subtotal Union Labor 201,295,123 83,058,704 81,083,057 (1,975,647) (2.4%) Salaries and Non-Union Wages 91,407,758 36,967,386 36,344,112 (623,274) (1.7%) Non-Union Fringe Benefits 38,963,732 16,104,814 15,702,166 (402,648) (2.5%) Subtotal Non-Union Labor 130,371,490 53,072,200 52,046,278 (1,025,922) (1.9%) Subtotal Labor and Fringe Benefits 331,666, ,130, ,129,335 (3,001,569) (2.2%) Services 42,779,211 17,647,952 12,249,827 (5,398,125) (30.6%) Materials and Supplies 24,871,902 10,090,910 9,178,849 (912,061) (9.0%) Fuel and Utilities 49,403,346 19,695,859 18,665,978 (1,029,881) (5.2%) Casualty and Liability 4,910,742 2,088,950 1,908,065 (180,885) (8.7%) Purchased Transportation 99,584,504 40,292,871 38,727,620 (1,565,251) (3.9%) Leases, Rentals and Misc. 9,099,282 3,232,665 3,723, , % Subtotal Non-Labor 230,648,987 93,049,207 84,453,853 (8,595,354) (9.2%) Subtotal Labor and Non-Labor 562,315, ,180, ,583,188 (11,596,923) (5.1%) Contingency 10,938, % Allocation to Capital and GMP (14,982,923) (6,075,616) (6,276,372) (200,756) (3.3%) Subtotal Contingency / Allocations (4,044,600) (6,075,616) (6,276,372) (200,756) (3.3%) Total Operating Budget $ 558,271, ,104, ,306,816 (11,797,679) (5.3%) Section F Page 6
62 MONTHLY BOARD REPORT February 2016 Major Operating Budget Variance Items - Categories with major variances Expense Type YTD Budget YTD Actual February 2016 Year-to-Date $ Variance (favorable) / unfavorable Union Labor 83,058,704 $ 81,083,057 $ (1,975,647) Wages & Fringe Benefits - primarily mechanic, technician, cleaner, and operator vacancies $ (7,279,000) Underruns noted in active employee health plan elections (80,000) Overtime wages mostly due to vacancies in bus operator positions Overtime wages in rail operations 4,526, ,000 Effect of the unbudgeted rate increase for Benefit Trust for Retirees 439,000 Non-Union Labor 53,072,200 52,046,278 (1,025,922) (1,684,000) (239,000) Savings in salaries and fringes primarily related to vacancies Underruns noted in active employee health plan elections Offset by Authority overtime mostly within the Operations More than expected use and timing of Vacation/401a/Sick/Other Paid Absences Services 17,647,952 12,249,827 (5,398,125) Timing in Delayed start in both system planning and system development projects Change in direction in major advertising programs and related support services Delays in the receipt and processing IT Equipment Maintenance invoices for VCE and WMWare Legal fees - lower than expected case load requiring external legal services Delayed Facility Maintenance BOF maintenace costs and custodial services Delayed contract related projects in Finance (1,349,000) (901,000) (485,000) (412,000) (277,000) (214,000) Delayed radio maintenance (162,000) Delays in the purchasing of ticket and fare collection equipment and the repair and maintenance of existing equipment Delayed work in rail operations for rail grinding, track geometry and vegetation control; delayed billing for completed ultrasonic testing work Support services throughout the Authority excluding Marketing & Corporate Communications Education and training throughout the Authority excluding bus operations training Less than anticipated Legislative coordination activity (142,000) (141,000) (138,000) (136,000) (128,000) HOT lane invoicing activity Less than anticipated BAE warranty expense Delayed bus operator training set to occur later in the year Contract employment services Other miscellaneous services spread across the Authority (113,000) (113,000) (104,000) (95,000) (537,000) Materials & Supplies 10,090,910 9,178,849 (912,061) Credit caused by the return of CAF car parts on loan in the prior year to inventory in the current year (237,000) Underspending in Bus engines (202,000) Bus brakes (246,000) Rail parts (110,000) Minor tools (109,000) Timing delays in the procurement of IT EDP supplies (161,000) Underspending in general bus maintenance parts offset by minor overruns in other expense areas (263,000) Offset by overruns in Exterior Body and Windows in both bus and rail Due to unbudgeted passbooks for drivers in Ticket and Fare collection equipment and supplies Fuel & Utilities 19,695,859 18,665,978 (1,029,881) Favorable gasoline market prices and quantity usage savings due to a switch to using diesel vehicles on certain routes original planned for Arboc vehicle use (373,000) Lower than planned consumption of power (357,000) General underspending in the Authority's routine telephone expenses (245,000) First quarter savings realized from a delay in the service start date of 35/50 CNG buses rescheduled for (191,000) December 2015 Timing delay in propulsion power invoicing and lower than expected consumption in first five months of the (143,000) year Lower than expected natural gas expenses resulting from lower than planned consumption (128,000) Offset by Timing variance resulting from transition of services from AT&T to Verizon. Expected to continue late into the second Quarter 188, , , , ,000 Section F Page 7
63 MONTHLY BOARD REPORT February 2016 Major Operating Budget Variance Items - Categories with major variances Expense Type YTD Budget YTD Actual February 2016 Year-to-Date $ Variance (favorable) / unfavorable Continued on next Page Section F Page 7
64 MONTHLY BOARD REPORT February 2016 Major Operating Budget Variance Items - Categories with major variances Expense Type YTD Budget YTD Actual February 2016 Year-to-Date $ Variance (favorable) / unfavorable Casualty and Liability 2,088,950 1,908,065 (180,885) Higher than expected subrogation recovery (286,000) Offset by Higher than expected vehicle liability costs mainly due to increased reserves required for AON report 117,000 Purchased Transportation 40,292,871 38,727,620 (1,565,251) Due to a 2-month delay in completing the master lease assumption for vanpool leases (1,072,000) Lower than expected service hours operated for Arboc Fixed Route Service and First Transit Fewer vanpools in operation as a result of significant layoffs in the energy sector (298,000) (211,000) Leases, Rentals and Miscellaneous 3,232,665 3,723, ,849 Underspending in discretionary items (Travel, Memberships, Subscriptions, etc.) (167,000) Timing in the receipt and processing of software, equipment usage and licensing fee invoices 664,000 Allocation to Capital and GMP (6,075,616) (6,276,372) (200,756) Higher than expected capital related activity within METRORail operations (318,000) Higher than expected capital related activity within Bus Maintenance (298,000) Timing delays in IT related projects 353,000 Section F Page 8
65 MONTHLY BOARD REPORT February 2016 Total Net Operating Budget / Expenses by Department Authorized EOY Headcount Year-to-Date Current Month-- Department Annual Budget Budget Expense Variance Variance 3,325 Operations, Public Safety and Customer Service $ 435,046,755 $ 177,674,273 $ 170,270,996 $ (7,403,277) $ (2,114,869) 2,935 Operations 400,540, ,703, ,096,973 (6,606,672) (1,928,964) 305 Public Safety 28,438,625 11,425,411 10,934,747 (490,664) (159,530) 76 Customer Service 4,912,604 2,073,039 1,800,462 (272,577) (22,152) 9 EVP Operations, Public Safety & Customer Service 1,154, , ,814 (33,364) (4,223) 309 Finance & Administration 58,923,637 24,188,534 24,261,905 73, , Information Technology 19,304,620 8,106,058 8,616, , , Human Resources 19,420,342 8,060,189 8,238, , , Procurement & Materials 10,179,651 4,187,299 3,904,618 (282,681) (37,593) 78 Finance 9,196,860 3,537,970 3,343,018 (194,952) (3,593) 4 EVP Finance & Administration 822, , ,410 (137,608) (12,745) 250 Planning, Engineering and Construction 35,692,611 14,522,542 11,752,953 (2,769,589) (601,826) 186 Facility Maintenance 29,441,293 12,006,943 10,489,406 (1,517,537) (98,420) 32 Planning 6,570,940 2,733,445 1,249,195 (1,484,250) (550,200) 2 EVP Planning, Engineering and Construction (15,929) (11,876) (14,020) (2,144) 1, Engineering and Construction (303,693) (205,970) 28, ,342 45, Gov't & Public Affairs 8,959,889 3,490,811 2,480,928 (1,009,883) (192,465) 24 Mktg & Corporate Communications 7,161,248 2,734,420 1,904,050 (830,370) (168,294) 4 Government Affairs 666, , ,335 (105,104) (18,028) 5 Public Engagement 682, , ,458 (29,256) (1,756) 6 Stakeholder Affairs 450, , ,085 (45,153) (4,387) 18 Legal 3,808,611 1,588, ,442 (633,479) (146,422) 15 Legal 3,504,971 1,453, ,929 (593,443) (133,214) 3 Records Management 303, ,549 95,513 (40,036) (13,208) 14 Executive & Board 2,542,402 1,022,702 1,045,507 22,805 (303) 11 Audit 1,504, , ,087 (77,625) (6,053) Contingency 10,938, Non Departmental 853, ,966 TOTAL NET OPERATING $ 558,271,000 $ 223,104,495 $ 211,306,818 $ (11,797,677) $ (2,185,371) Per Board authorization, Year End Authorized headcount will increase by 61 in Jan 2016 from 3,905 to 3,966 i.e. 40 for the Alternative Service and Community Connector, and 21 for the Jan 2016 service change. Section F Page 9
66 MONTHLY BOARD REPORT February 2016 Total Net Operating Budget / Expenses by Department as of the end of February FY2016 vs. February FY2015 February FY Year-to-Date February FY Year-to-Date Department Budget Expense Variance Budget Expense Variance Operations, Public Safety and Customer Service $ 177,674,273 $ 170,270,996 $ (7,403,277) $ 162,362,295 $ 153,443,317 $ (8,918,979) Operations 163,703, ,096,973 (6,606,672) 147,833, ,516,991 (7,316,629) Public Safety 11,425,411 10,934,747 (490,664) 12,100,847 10,700,189 (1,400,659) Customer Service 2,073,039 1,800,462 (272,577) 1,916,954 1,753,087 (163,867) EVP Operations, Public Safety & Customer Service 472, ,814 (33,364) 510, ,050 (37,824) Finance & Administration 24,188,534 24,261,905 73,371 23,994,500 22,131,667 (1,862,833) Information Technology 8,106,058 8,616, ,607 8,659,720 8,633,298 (26,422) Human Resources 8,060,189 8,238, ,006 7,654,708 6,716,837 (937,871) Procurement & Materials 4,187,299 3,904,618 (282,681) 3,933,449 3,716,840 (216,609) Finance 3,537,970 3,343,018 (194,952) 3,589,483 2,986,057 (603,426) EVP Finance & Administration 297, ,410 (137,608) 157,140 78,635 (78,505) Planning, Engineering and Construction 14,522,542 11,752,953 (2,769,589) 13,791,220 10,953,158 (2,838,062) Facility Maintenance 12,006,943 10,489,406 (1,517,537) 10,154,304 9,183,499 (970,805) Planning 2,733,445 1,249,195 (1,484,250) 3,607,543 1,761,747 (1,845,796) EVP Planning, Engineering and Construction (11,876) (14,020) (2,144) 6,090 - (6,090) Engineering and Construction (205,970) 28, ,342 23,283 7,912 (15,371) Gov't & Public Affairs 3,490,811 2,480,928 (1,009,883) 2,868,887 1,685,190 (1,183,697) Mktg & Corporate Communications 2,734,420 1,904,050 (830,370) 2,198,605 1,171,267 (1,027,338) Government Affairs 286, ,335 (105,104) 246, ,146 16,371 Public Engagement 282, ,458 (29,256) 311, ,987 (70,035) Stakeholder Affairs 187, ,085 (45,153) 112,485 9,790 (102,695) Legal 1,588, ,442 (633,479) 1,579,539 1,252,091 (327,448) Legal 1,453, ,929 (593,443) 1,409,647 1,087,599 (322,048) Records Management 135,549 95,513 (40,036) 169, ,492 (5,400) Executive & Board 1,022,702 1,045,507 22, , ,538 (73,000) Audit 616, ,087 (77,625) 541, ,426 (19,057) Non-Departmental Contingency TOTAL NET OPERATING $ 223,104,495 $ 211,306,818 $ (11,797,677) $ 205,959,461 $ 190,736,387 $ (15,223,074) Section F Page 10
67 MONTHLY BOARD REPORT February 2016 Capital, General Mobility and Debt Service Expenses Budget vs. Actual - Month and Fiscal Year-to-Date ($ millions) FY2016 Annual Month of February 2016 Variance Fiscal YTD February 2016 Variance Budget Budget Actual $ % Budget Actual $ % METRORail Expansion Capital Improvement Program Total Capital $ 83.2 $ 6.2 $ 3.1 $ (3.1) (49.7%) $ 47.1 $ 25.1 $ (22.0) (46.7%) $ $ 10.8 $ 2.6 $ (8.2) (75.8%) $ 36.6 $ 11.7 $ (24.9) (68.1%) $ $ 17.1 $ 5.8 $ (11.3) (66.3%) $ 83.7 $ 36.8 $ (46.9) (56.0%) General Mobility $ $ 13.5 $ 11.9 $ (1.6) (11.6%) $ 70.6 $ 54.5 $ (16.1) (22.8%) Debt Service $ 96.9 $ 6.9 $ % $ 43.8 $ 43.8 (0.0) (0.0%) Section G Page 11
68 MONTHLY BOARD REPORT February 2016 Ridership by Service Category YTD % Change Feb-16 Feb-15 Feb-16 Feb-16 Service Category Feb-15 Feb-16 vs. YTD YTD vs. Boardings Boardings Feb-15 Boardings Boardings Feb-15 Fixed Route Services Local Network Local Bus 4,510,923 4,911, % 24,238,352 24,849, % METRORail Red Line 1,116,742 1,381, % 5,486,363 6,641, % Green Line (East) 0 68,363 N/A 0 360,567 n/a Purple Line (Southeast) 0 107,063 N/A 0 526,447 n/a METRORail (all lines) 1,116,742 1,557, % 5,486,363 7,528, % METRORail-Bus Bridge 0 1,806 N/A 21,642 4,912 (77.3%) METRORail 1,116,742 1,558, % 5,508,005 7,533, % Subtotal Local Network 5,627,665 6,470, % 29,746,357 32,383, % Commuter Park & Ride 666, , % 3,355,098 3,416, % Subtotal Fixed Route Service 6,294,073 7,189, % 33,101,455 35,799, % Special Events * 19, % 38, (97.5%) Total Fixed Route 6,313,562 7,189, % 33,140,189 35,800, % Customized Bus Services METROLift 147, , % 778, , % METRO STAR Vanpool 201, ,186 (3.2%) 1,016, ,577 (6.5%) Internal Service % % Subtotal Customized Bus 349, , % 1,794,439 1,749,705 (2.5%) HOV/HOT Carpools, Vanpools, and Non-METRO Buses 2,064,800 2,244, % 10,736,960 11,114, % Total System 8,727,570 9,787, % 45,671,588 48,664, % Fixed route ridership is reported on the same basis as in the National Transit Database * The Special Events category of ridership reflects customer service oriented short-term additional motor bus service provided for events at Reliant Park such as football games and RODEO Houston Fixed Route and Total System Ridership FY FY2016 Total System Ridership Millions Fixed Route Ridership FY2015 in Blue FY2016 in Green OCT NOV DEC JAN FEB MAR APR MAY JUN JUL AUG SEP Section H Page 12
69 MONTHLY BOARD REPORT February 2016 Performance Statistics Fiscal Year 2016 Benchmark Met Benchmark Missed FY2016 YTD SAFETY & SECURITY Monthly YTD FY2016 % OCT NOV DEC JAN FEB MAR APR MAY JUN JUL AUG SEP Target GOAL YTD Change Bus Accidents (Includes METROLift) % Bus Accidents per 100,000 vehicle miles % Rail Accidents % Rail Accidents per 100,000 vehicle miles % Major Security Incidents - total % Major Security Incidents per 100,000 boardings % Major Security Incidents - METRO properties % Major Security Incidents per 100,000 boardings % FY2016 YTD SERVICE & RELIABILITY Monthly YTD FY2016 % OCT NOV DEC JAN FEB MAR APR MAY JUN JUL AUG SEP Target GOAL YTD Change Local Bus OTP 72.9% 76.0% 74.8% 70.0% 78.7% 70% 69% 74.5% 8.3% Park & Ride Bus OTP 76.9% 75.4% 74.8% 74.8% 77.5% 75% 75% 75.9% 1.2% Weighted Average Bus OTP 73.9% 75.9% 74.8% 71.1% 78.3% 71% 70% 74.8% 6.9% METROLift OTP 90.0% 90.2% 90.0% 90.1% 89.3% 90% 90% 89.9% 0.1% Rail - Red Line OTP 93.4% 94.3% 92.0% 90.5% 86.7% 95% 95.0% 91.4% 3.8% Rail - East End Green Line OTP 93.2% 94.5% 91.5% 95.9% 92.4% 85% 85.0% 93.5% 10.0% Rail - South East Purple Line OTP 95.4% 94.4% 92.1% 92.8% 86.1% 85% 85.0% 92.1% 8.4% MDBF (Mean Distance Between Mechanical Failures) - All Buses MDBF (Mean Distance Between Mechanical Failures) - METROLift MDBSI (Mean Distance Between Service Interruptions) - METRORail 8,960 9,454 10,652 11,776 12,032 9,500 9,150 10, % 13,674 20,606 21,271 17,184 29,574 19,000 19,000 19, % 25,502 34,799 22,948 18,426 35,315 12,000 12,000 25,615 FY2016 YTD CUSTOMER SERVICE Monthly YTD FY2016 % OCT NOV DEC JAN FEB MAR APR MAY JUN JUL AUG SEP Target GOAL YTD Change *Complaint Contacts per 100,000 boardings % Commendations , % Average Call Center Answer Delay (Sec.) % Section I Page 13
70 MONTHLY BOARD REPORT February 2016 Performance Statistic Definitions Bus and Rail Accidents - An accident is a transit incident with passenger injuries that require immediate medical treatment away from the scene or a collision between a revenue vehicle and an object such that the amount of damage exceeds $1,000. Bus accidents (which include METROLift) and rail accidents are reported separately and in terms of the absolute number of accidents and the relative number of accidents per 100,000 vehicle miles. Rail accidents reflect collisions between METRORail and other vehicles, pedestrians, or bicyclists. This definition has been revised beginning in FY2011 to include pedestrian accidents. Major Security Incidents - The total Major Security Incidents is based on two industry standards: the FBI Uniform Crime Report and the National Transit Database (NTD) Report issued by the Federal Transit Administration (FTA). The eight (8) categories included are: homicide, forcible rape, robbery, aggravated assault, burglary, larceny and theft, motor vehicle theft and arson. This metric is reported both in terms of the absolute number of incidents and the number of incidents per 100,000 boardings. Major Security Incidents - METRO Properties - The total Major Security Incidents - METRO Properties is the number of incidents that occur at Park & Ride lots, Transit Centers, on-board buses and trains and on Light Rail Vehicle (LRV) platforms. This metric is reported both in terms of the absolute number of incidents and the number of incidents per 100,000 boardings. On-Time Performance (OTP) - A local bus is considered on-time if it does not leave early and is within a five (5) minute window after the scheduled departure time. A Park & Ride bus is considered on-time if it does not depart early (except in the morning when a bus can leave from a Park & Ride lot when full) and is within a five (5) minute window after the scheduled departure time, with measurements during peak hours. OTP is measured by the IVOMS system which calculates data to the second, and the five (5) minute window is defined as anything less than six (6) minutes. For METRORail, a train departing from the beginning of the line or arriving at the end of the line less than five (5) minutes after the scheduled time is considered on-time. For METROLift, a trip is considered on-time if the vehicle arrives within 30 minutes of the scheduled pick-up time and no later than the appointment time. Mean Distance Between Mechanical Failures (MDBF) - MDBF reflects any mechanical issue encountered during operation of the vehicle in revenue service that requires a maintenance action resulting from a mechanical failure. Mechanical failures include warranty and fleet defects but exclude accidents. Mean Distance Between Service Interruptions (MDBSI) - measures total revenue service miles traveled by Light Rail Vehicles (LRVs) between service interruptions that delay LRVs for one minute or more due to mechanical failures. Complaint Contacts - Patrons may contact METRO s Customer Care Center to express dissatisfaction with METRO Operations. Contacts made via telephone and over the internet which result in a complaint record being generated in the Public Comment System are reported as the number of contacts per 100,000 boardings. Commendations - Patrons may contact METRO's Customer Care Center to recognize, compliment or praise a METRO employee or the METRO organization for exemplary work or performance. Contacts made via telephone, internet, or mail which result in a commendation record being generated in the Public Comment System are reported only on the basis of the absolute number of contacts received. Average Call Center Answer Delay - METRO is committed to providing customers with accurate, customer-friendly bus and service information in a timely manner. Customers may obtain bus information over METRO's website and by telephone using an interactive voice response system without speaking to a representative and with no customer wait time. For those customers who prefer to speak with a representative, METRO's goal is to answer their calls in 120 seconds or less. Section I Page 14
71 MONTHLY BOARD REPORT February 2016 Balance Sheet Feb. 28, 2015 ($) Feb. 29, 2016 ($) Change ($) Cash $ 4,329,679 $ 5,331,363 $ 1,001,684 Receivables 127,470, ,331,772 (9,138,384) Inventory 30,201,790 30,442, ,796 Investments 401,212, ,750,513 41,538,078 Other Assets 40,743,017 11,883,463 (28,859,554) Property Net of Depreciation 2,708,553,941 2,722,458,916 13,904,975 Land & Improvements 388,209, ,936,233 (18,272,892) Deferred Outflow of Resources 1,899,588 47,425,703 45,526,115 Total Assets and Other 3,702,619,731 3,748,560,549 45,940,818 Liabilities Trade Payables 50,889,284 75,978,559 25,089,275 Accrued Payroll 27,234,305 28,147, ,315 Commercial Paper 181,300, ,400,000 (63,900,000) Long-Term Liabilities 1,226,674,475 1,506,177, ,502,956 Other Liabilities 31,382,083 65,113,275 33,731,192 Total Liabilities 1,517,480,147 1,792,816, ,336,738 Deferred Inflow of Resources Net Assets - Retained 2,185,139,584 1,955,743,664 (229,395,920) Total Liabilities and Net Assets $ 3,702,619,731 $ 3,748,560,549 $ 45,940,818 Section J Page 15
72 BOARD BRIEFING SUMMARY SUBJECT: AGENDA ITEM #: Sales Tax Forecast Update AGENDA DATE: 3/21/16 DEPARTMENT: Finance PRESENTER: Philip Brenner SUMMARY: METRO receives updates to Sales Tax forecasts approximately every six months from our economist Dr. William Bill Gilmer, Director, Institute for Regional Forecasting, C.T. Bauer College of Business, University of Houston. The most recent update was provided to METRO in January This briefing will provide the Finance & Audit Committee an overview of Dr. Gilmer's most recent report and the estimated impact on Sales Tax collections.
73 METRO Sales Tax Forecast Update Finance & Audit Committee March
74 January 2016 Sales Tax Forecast Update January forecast of sales tax revenue is based on data through December 2015, and reflects: Declines in drilling following the collapse of oil prices Loss of the fracking boom Timing of recovery and revenue growth depend on unpredictable oil markets 2
75 Short-Term Outlook Factors helping the Houston economy in 2016 Strong U.S. economic expansion Construction of new petrochemical, refining, and liquefied natural gas plants in east Houston Consumer sales have remained stable thus far Recovery will come but the timing is highly uncertain. Dr. Robert W. Bill Gilmer, Institute of Regional Forecasting 3
76 Sales Tax Growth Rate Assumptions are Down FY2016 Budget growth rate reflects a 1% reduction from economic forecast. Source: Dr. William Bill Gilmer June 2015 and January 2016 Economic Forecasts 4

77 Sales Tax Available to METRO is down $251 million for the period Source: Dr. William Bill Gilmer June 2015 and January 2016 Economic Forecasts 5
 to $243 million")
78 GMP Referendum Increment is down $33.5 million for the period Total Increment has decreased $133 million, from $376 million (2013 estimate) to $243 million (2016 estimate) Source: Dr. William Bill Gilmer June 2015 and January 2016 Economic Forecasts 6
79 BOARD BRIEFING SUMMARY SUBJECT: AGENDA ITEM #: Transit Planning 4 All Grant Opportunity AGENDA DATE: 3/21/16 DEPARTMENT: Administration & Finance SUMMARY: PRESENTER: Albert Lyne On March 18, 2016, METRO submitted a grant application with the Transit Planning For All project, sponsored by the US Department of Health and Human Services. If METRO is selected as an award recipient, the grant will provide 100% to install Bluetooth beacons on bus stops and to develop a prototype mobile app to help METRO customers with disabilities to navigate to select bus stops, alert them when they are approaching those stops, and provide them with stop-specific information. This grant opportunity did not allow sufficient time to get Board approval prior to grant submission. An overview of the submission is being presented at the Finance and Safety Committee Meetings.
80 Transit Planning 4 All Grant Opportunity Board of Directors Committee Meeting March 2016
81 2 What is the Transit Planning 4 All grant opportunity? Sponsored by the Department of Health and Human Services Administration for Community Living Created to encourage the development of inclusive coordinated transportation systems Created to assist people with disabilities and older adults
82 3 Grant Opportunity Specifics Maximum grant award amount of $86,000 No local match requirement March 18, 2016 application deadline Award will be announced no later than June 1, 2016 Approximately 8 awards will be made nationwide Requirement to include stakeholders in the project


83 Proposed Project Help visually impaired customers to navigate to METRO bus stops Select pilot participants and accessible bus stops (using TTI study) Develop a prototype mobile application Install Bluetooth beacons on bus stops 4
METRO INVESTMENT REPORT ALL FUNDS
 METRO INVESTMENT REPORT ALL FUNDS June 2016 Investment Report For month ended June 30, 2016 Portfolio Summary Management Report The following is a summary of METRO's Investment Portfolios: Fund: General
METRO INVESTMENT REPORT ALL FUNDS
 METRO INVESTMENT REPORT ALL FUNDS DECEMBER 2012 Metropolitan Transit Authority of Harris County Investment Report Portfolio Summary Management Report The following is a summary of METRO's Investment Portfolios:
METRO INVESTMENT REPORT ALL FUNDS
 METRO INVESTMENT REPORT ALL FUNDS April 2017 Metropolitan Transit Authority of Harris County Monthly Changes in Position As of April 30, 2017 Maturity Purch Book Value Market Value No. Description Coupon
METRO INVESTMENT REPORT ALL FUNDS
 METRO INVESTMENT REPORT ALL FUNDS July 2018 Metropolitan Transit Authority of Harris County Investment Report For month ended July 31, 2018 Portfolio Summary Management Report The following is a summary
METRO INVESTMENT REPORT ALL FUNDS
 METRO INVESTMENT REPORT ALL FUNDS FEBRUARY 2013 Metropolitan Transit Authority of Harris County Investment Report Portfolio Summary Management Report The following is a summary of METRO's Investment Portfolios:
METRO INVESTMENT REPORT ALL FUNDS
 METRO INVESTMENT REPORT ALL FUNDS May 2018 Investment Report For month ended May 31, 2018 Portfolio Summary Management Report The following is a summary of METRO's Investment Portfolios: Fund: General
METRO. Fiscal Year 2012 Monthly Board Report. September 2012 (Fourth Quarter Fiscal Year-to-Date)
") METRO Fiscal Year 2012 Monthly Board Report Revenue Expense Ridership Performance (Fourth Quarter Fiscal Year-to-Date) This report is based on a preliminary closing of the year-end financials for FY2012
METRO Fiscal Year 2012 Monthly Board Report Revenue Expense Ridership Performance (Fourth Quarter Fiscal Year-to-Date) This report is based on a preliminary closing of the year-end financials for FY2012
METRO BOARD OF DIRECTORS Board Meeting Agenda
 Thomas C. Lambert PRESIDENT & CEO METRO BOARD OF DIRECTORS Board Meeting Agenda BOARD MEMBERS Gilbert Andrew Garcia, Chairman 1900 Main Street, Board Room, 2 nd Floor Jim Robinson, Vice Chairman Wednesday,
METRO INVESTMENT REPORT ALL FUNDS
 METRO INVESTMENT REPORT ALL FUNDS August 2018 Investment Report For month ended August 31, 2018 Portfolio Summary Management Report The following is a summary of METRO's Investment Portfolios: Fund: General
METRO. Fiscal Year 2017 Monthly Performance Report. Revenue Expense Ridership Performance. October 2016
 METRO Fiscal Year 2017 Monthly Performance Report Revenue Expense Ridership Performance 11/18/2016 Table of Contents Section A Section B Section C Section D Section E Section F Section G Section H Section
METRO. Fiscal Year 2013 Monthly Board Report. December 2012 (First Quarter Fiscal Year-to-Date)
") METRO Fiscal Year 2013 Monthly Board Report Revenue Expense Ridership Performance (First Quarter Fiscal Year-to-Date) 1/14/2013 Table of Contents Section A Section B Section C Section D Section E Section
METRO Fiscal Year 2013 Monthly Board Report Revenue Expense Ridership Performance (First Quarter Fiscal Year-to-Date) 1/14/2013 Table of Contents Section A Section B Section C Section D Section E Section
METRO. Fiscal Year Monthly Performance Report. Revenue Expense Ridership Performance. November 2018 (Third Quarter Fiscal Year-to Date)
") METRO Fiscal Year 2019 Monthly Performance Report Revenue Expense Ridership Performance (Third Quarter Fiscal Year-to Date) 12/12/2018 Table of Contents Section A Section B Section C Section D Section
METRO Fiscal Year 2019 Monthly Performance Report Revenue Expense Ridership Performance (Third Quarter Fiscal Year-to Date) 12/12/2018 Table of Contents Section A Section B Section C Section D Section
METRO. Fiscal Year 2013 Monthly Board Report. January 2013
 METRO Fiscal Year 2013 Monthly Board Report Revenue Expense Ridership Performance 2/14/2013 Table of Contents Section A Section B Section C Section D Section E Section F Section G Section H Section I Section
Notice and Agenda of a Meeting of the Finance and Audit Committee of the METRO Board of Directors
 FINANCE and AUDIT Thomas C. Lambert President & CEO COMMITTEE MEMBERS Cindy Siegel, Chair Lisa Castañeda Terry Morales Sanjay Ramabhadran Troi Taylor Notice and Agenda of a Meeting of the Finance and Audit
METRO. Fiscal Year Monthly Performance Report. Revenue Expense Ridership Performance. February 2018 (First Quarter Fiscal Year-to Date)
") METRO Fiscal Year 2018 Monthly Performance Report Revenue Expense Ridership Performance (First Quarter Fiscal Year-to Date) 3/12/2018 Table of Contents Section A Section B Section C Section D Section E
METRO Fiscal Year 2018 Monthly Performance Report Revenue Expense Ridership Performance (First Quarter Fiscal Year-to Date) 3/12/2018 Table of Contents Section A Section B Section C Section D Section E
METRO. Fiscal Year 2013 Monthly Board Report. November 2012
 METRO Fiscal Year 2013 Monthly Board Report Revenue Expense Ridership Performance 12/13/2012 Table of Contents Section A Section B Section C Section D Section E Section F Section G Section H Section I
METRO. Monthly Board Report. June 2006
 METRO Monthly Board Report Operating Capital Service Performance June 26 7/17/26 June 26 MONTHLY BOARD REPORT INDEX Section A Section B Section C Section D Section E Section F Section G Operating Budget
METRO. Fiscal Year 2015 Monthly Board Report. February 2015
 METRO Fiscal Year 2015 Monthly Board Report Revenue Expense Ridership Performance 4/2/2015 Table of Contents Section A Section B Section C Section D Section E Section F Section G Section H Section I Section
METRO. Fiscal Year 2012 Monthly Board Report. December 2011 (First Quarter Fiscal Year-to-Date)
") METRO Fiscal Year 2012 Monthly Board Report Revenue Expense Ridership Performance (First Quarter Fiscal Year-to-Date) 1/27/2012 Table of Contents Section A Section B Section C Section D Section E Section
METRO Fiscal Year 2012 Monthly Board Report Revenue Expense Ridership Performance (First Quarter Fiscal Year-to-Date) 1/27/2012 Table of Contents Section A Section B Section C Section D Section E Section
METRO. Fiscal Year 2014 Monthly Board Report. May 2014
 METRO Fiscal Year 2014 Monthly Board Report Revenue Expense Ridership Performance 7/11/2014 Table of Contents Section A Section B Section C Section D Section E Section F Section G Section H Section I Section
Notice and Agenda of a Meeting of the Finance and Audit Committee of the METRO Board of Directors
 Thomas C. Lambert President & CEO Notice and Agenda of a Meeting of the Finance and Audit Committee of the METRO Board of Directors FINANCE and AUDIT COMMITTEE MEMBERS Cindy Siegel, Chair Lisa Castañeda
METRO. Fiscal Year Monthly Performance Report. Revenue Expense Ridership Performance. May 2018 (Second Quarter Fiscal Year-to Date)
") METRO Fiscal Year 2018 Monthly Performance Report Revenue Expense Ridership Performance (Second Quarter Fiscal Year-to Date) 6/12/2018 Table of Contents Section A Section B Section C Section D Section
METRO Fiscal Year 2018 Monthly Performance Report Revenue Expense Ridership Performance (Second Quarter Fiscal Year-to Date) 6/12/2018 Table of Contents Section A Section B Section C Section D Section
Notice and Agenda of a Meeting of the Finance and Audit Committee of the METRO Board of Directors
 FINANCE and AUDIT Thomas C. Lambert President & CEO COMMITTEE MEMBERS Cindy Siegel, Chair Sanjay Ramabhadran Lisa Castañeda Troi Taylor Notice and Agenda of a Meeting of the Finance and Audit Committee
METRO. Fiscal Year 2015 Monthly Board Report. September 2015 (Fourth Quarter Fiscal Year-to-Date)
") METRO Fiscal Year 2015 Monthly Board Report Revenue Expense Ridership Performance (Fourth Quarter Fiscal Year-to-Date) This report is based on a preliminary closing of the year-end financials for FY2015
METRO Fiscal Year 2015 Monthly Board Report Revenue Expense Ridership Performance (Fourth Quarter Fiscal Year-to-Date) This report is based on a preliminary closing of the year-end financials for FY2015
METRO BOARD OF DIRECTORS Board Meeting Agenda
 METRO BOARD OF DIRECTORS Board Meeting Agenda Thomas C. Lambert PRESIDENT & CEO BOARD MEMBERS Carrin F. Patman, Chair 1900 Main Street, Board Room, 2 nd Floor Jim Robinson, First Vice Chair April 27, 2017,
METRO INVESTMENT REPORT ALL FUNDS
 METRO INVESTMENT REPORT ALL FUNDS October 2018 Investment Report For month ended October 31, 2018 Portfolio Summary Management Report The following is a summary of METRO's Investment Portfolios: Fund:
METRO INVESTMENT REPORT ALL FUNDS
 METRO INVESTMENT REPORT ALL FUNDS November 2018 Investment Report For month ended November 30, 2018 Portfolio Summary Management Report The following is a summary of METRO's Investment Portfolios: Fund:
METRO MONTHLY BOARD REPORT
 METRO Revenue Expenses Service Performance Fiscal Year FY2011 Table of Contents Section A Section B Section C Section D Section E Section F Section G Section H Summary Sales Tax Revenue Fare Revenue Operating
~ NOTICE OF MEETING ~ CAPITAL METROPOLITAN TRANSPORTATION AUTHORITY BOARD OF DIRECTORS FINANCE, AUDIT AND ADMINISTRATION COMMITTEE MEETING
 ~ NOTICE OF MEETING ~ CAPITAL METROPOLITAN TRANSPORTATION AUTHORITY BOARD OF DIRECTORS FINANCE, AUDIT AND ADMINISTRATION COMMITTEE MEETING 2910 East Fifth Street Austin, TX 78702 ~ AGENDA ~ Monday, April
METRO. Fiscal Year 2017 Monthly Performance Report. Revenue Expense Ridership Performance. September 2017 (Fourth Quarter Fiscal Year-to Date)
") METRO Fiscal Year 2017 Monthly Performance Report Revenue Expense Ridership Performance (Fourth Quarter Fiscal Year-to Date) 10/13/2017 Table of Contents Section A Section B Section C Section D Section
METRO Fiscal Year 2017 Monthly Performance Report Revenue Expense Ridership Performance (Fourth Quarter Fiscal Year-to Date) 10/13/2017 Table of Contents Section A Section B Section C Section D Section
City Council Work Session Handouts. February 3, 2014
 City Council Work Session Handouts February 3, 2014 I. Review and Discuss the Fiscal Year 2012-2013 Comprehensive Annual Financial Report (CAFR) Presentation II. Review and Discuss the Dallas County Arapaho
METROPOLITAN TRANSIT AUTHORITY OF HARRIS COUNTY, TEXAS. Independent Accountants Report on Applying Agreed-Upon Procedures
 METROPOLITAN TRANSIT AUTHORITY OF HARRIS COUNTY, TEXAS Independent Accountants Report on Applying Agreed-Upon Procedures Year ended September 30, 2012 KPMG LLP 811 Main Street Houston, TX 77002 Independent
METRO. (Fourth Quarter Fiscal Year-to-Date)
") METRO Fiscal Year 2016 Monthly Performance Report Revenue Expense Ridership Performance (Fourth Quarter Fiscal Year-to-Date) 10/25/2016 Table of Contents Section A Section B Section C Section D Section
METRO Fiscal Year 2016 Monthly Performance Report Revenue Expense Ridership Performance (Fourth Quarter Fiscal Year-to-Date) 10/25/2016 Table of Contents Section A Section B Section C Section D Section
Notice and Agenda of a Meeting of the Finance and Audit Committee of the METRO Board of Directors
 FINANCE and AUDIT Thomas C. Lambert President & CEO COMMITTEE MEMBERS Cindy Siegel, Chair Lisa Castañeda Terry Morales Sanjay Ramabhadran Troi Taylor Notice and Agenda of a Meeting of the Finance and Audit
Prepared by the Metropolitan Transit Authority Of Harris County, Texas Divisions of Accounting and Treasury Services
 Metropolitan Transit Authority Transport Workers Union Pension Plan, Local 260, AFL-CIO Comprehensive Annual Financial Report December 31, 2013 and 2012 Prepared by the Metropolitan Transit Authority Of
February 2016 Financial Report
 2016 February 2016 Financial Report Capital Metropolitan Transportation Authority 4/13/2016 Table of Contents SUMMARY REPORT Budgetary Performance - Revenue 2 - Sales Tax Revenue 5 - Operating Expenses
METRO. Fiscal Year Monthly Performance Report. Revenue Expense Ridership Performance. June 2018 (Third Quarter Fiscal Year-to Date)
") METRO Fiscal Year 2018 Monthly Performance Report Revenue Expense Ridership Performance (Third Quarter Fiscal Year-to Date) 7/12/2018 Table of Contents Section A Section B Section C Section D Section E
METRO Fiscal Year 2018 Monthly Performance Report Revenue Expense Ridership Performance (Third Quarter Fiscal Year-to Date) 7/12/2018 Table of Contents Section A Section B Section C Section D Section E
METROPOLITAN TRANSIT AUTHORITY OF HARRIS COUNTY, TEXAS. Independent Accountants Report on Applying Agreed-Upon Procedures
 METROPOLITAN TRANSIT AUTHORITY OF HARRIS COUNTY, TEXAS Independent Accountants Report on Applying Agreed-Upon Procedures Year ended September 30, 2017 KPMG LLP 811 Main Street Houston, TX 77002 Independent
Independent Auditors Report
 Financial Independent Auditors Report KPMG LLP Suite 1900 111 Congress Avenue Austin, TX 78701-4091 Independent Auditors Report The Board of Trustees Texas Municipal Retirement System: We have audited
METROPOLITAN TRANSIT AUTHORITY OF HARRIS COUNTY, TEXAS. Single Audit. September 30, (With Independent Auditors Reports Thereon)
") Single Audit September 30, 2017 (With Independent Auditors Reports Thereon) Table of Contents Independent Auditors Report on Internal Control over Financial Reporting and on Compliance and Other Matters
Single Audit September 30, 2017 (With Independent Auditors Reports Thereon) Table of Contents Independent Auditors Report on Internal Control over Financial Reporting and on Compliance and Other Matters
METRO INVESTMENT REPORT (GENERAL FUND)
") METRO INVESTMENT REPORT (GENERAL FUND) OCTOBER 2010 Metropolitan Transit Authority of Harris County Monthly Investment Report - Board Summary for General Funds For the Month Ended October 31, 2010 Portfolio
METRO INVESTMENT REPORT (GENERAL FUND) OCTOBER 2010 Metropolitan Transit Authority of Harris County Monthly Investment Report - Board Summary for General Funds For the Month Ended October 31, 2010 Portfolio
Central Puget Sound Regional Transit Authority
 Central Puget Sound Regional Transit Authority Single Audit Reports for the Year Ended December 31, 2014 TABLE OF CONTENTS Audited Financial Statements Management s Discussion and Analysis... 1 Independent
April 30, 2016 Financial Report
 2016 April 30, 2016 Financial Report Capital Metropolitan Transportation Authority 6/15/2016 Table of Contents SUMMARY REPORT Budgetary Performance - Revenue 2 - Sales Tax Revenue 6 - Operating Expenses
METROPOLITAN TRANSIT AUTHORITY OF HARRIS COUNTY, TEXAS. Single Audit. September 30, (With Independent Auditors Reports Thereon)
") METROPOLITAN TRANSIT AUTHORITY OF HARRIS COUNTY, TEXAS Single Audit September 30, 2016 (With Independent Auditors Reports Thereon) METROPOLITAN TRANSIT AUTHORITY OF HARRIS COUNTY, TEXAS Table of Contents
METROPOLITAN TRANSIT AUTHORITY OF HARRIS COUNTY, TEXAS Single Audit September 30, 2016 (With Independent Auditors Reports Thereon) METROPOLITAN TRANSIT AUTHORITY OF HARRIS COUNTY, TEXAS Table of Contents
Central Puget Sound Regional Transit Authority
 Central Puget Sound Regional Transit Authority Single Audit Reports for the Year Ended December 31, 2013 TABLE OF CONTENTS Audited Financial Statements Management s Discussion and Analysis...1 Independent
Administrative Services Department
 Administrative Services Department SUBJECT: Presentation of the 2015 Comprehensive Annual Financial Report AGENDA ITEM: 5. a. MEETING DATE: June 21, 2016 VILLAGE BOARD REPORT TO: Village President and
Presentation to. Town of Fairview. Council Meeting March 7, 2017
 Presentation to Town of Fairview Council Meeting March 7, 2017 Overview Introduction Audit Process Required Communications Audit Results Financial Highlights New Accounting Pronouncements Questions 2 Introductions
Assurance. Presentation to audit and reporting committee of Central Puget Sound Regional Transit Authority 2016 Financial statement audit plan
 Assurance Presentation to audit and reporting committee of Central Puget Sound Regional Transit Authority 2016 Financial statement audit plan December 15, 2016 kpmg.com Overview of the audit plan Audit
August 31, 2016 Financial Report
 August 31, 2016 Financial Report Capital Metropolitan Transportation Authority 10/14/2016 Table of Contents SUMMARY REPORTS Budgetary Performance - Revenue 2 - Sales Tax Revenue 6 - Operating Expenses
City and County of Denver Wastewater Management Enterprise Fund. Audit Wrap Up May 24, 2017
 City and County of Denver Wastewater Management Enterprise Fund Audit Wrap Up May 24, 2017 This presentation was prepared as part of our audit, has consequential limitations, is restricted to those charged
Town of Fairview. Council Meeting March 1, 2016
 Town of Fairview Council Meeting March 1, 2016 Overview Introduction Audit Process Required Communications Audit Results Areas of Strength and Accomplishment Financial Highlights New Accounting Pronouncements
1. Approval of the minutes of the board meeting on June 28, 2018 Board Member. 2. Swearing-in ceremony for new and reappointed Board Members C.
 Thomas C. Lambert President & CEO BOARD MEMBERS Carrin F. Patman, Chair Jim Robinson, First Vice Chair Cindy Siegel, Second Vice Chair Troi Taylor, Secretary Sanjay Ramabhadran Lisa Castañeda Christof
University of California
 University of California Required Communications to The Regents Committee on Compliance and Audit Results of the June 30, 2014 Audits November 5, 2014 Members of The Regents Committee on Compliance and
FORT WORTH TRANSPORTATION AUTHORITY
 FINANCIAL REPORT SEPTEMBER 30, 2010 C O N T E N T S INDEPENDENT AUDITOR'S REPORT... 1 MANAGEMENT'S DISCUSSION AND ANALYSIS... 3 Page BASIC FINANCIAL STATEMENTS Statements of Net Assets... 8 Statements
Management Letter. City of Montgomery Montgomery, Minnesota. For the Year Ended December 31, 2016
 Management Letter City of Montgomery Montgomery, Minnesota For the Year Ended December 31, 2016 June 22, 2017 Management, Honorable Mayor and City Council City of Montgomery, Minnesota We have audited
METROPOLITAN TRANSIT AUTHORITY OF HARRIS COUNTY, TEXAS. Single Audit. September 30, 2006
 METROPOLITAN TRANSIT AUTHORITY OF HARRIS COUNTY, TEXAS Single Audit September 30, 2006 (With Independent Auditors Reports Thereon) METROPOLITAN TRANSIT AUTHORITY OF HARRIS COUNTY, TEXAS Table of Contents
INDIANAPOLIS PUBLIC TRANSPORTATION CORPORATION (A COMPONENT UNIT OF THE CONSOLIDATED CITY OF INDIANAPOLIS MARION COUNTY GOVERNMENT REPORTING ENTITY)
") INDIANAPOLIS PUBLIC TRANSPORTATION CORPORATION (A COMPONENT UNIT OF THE CONSOLIDATED CITY OF INDIANAPOLIS MARION COUNTY GOVERNMENT REPORTING ENTITY) FINANCIAL STATEMENTS December 31, 2015 Indianapolis,
INDIANAPOLIS PUBLIC TRANSPORTATION CORPORATION (A COMPONENT UNIT OF THE CONSOLIDATED CITY OF INDIANAPOLIS MARION COUNTY GOVERNMENT REPORTING ENTITY) FINANCIAL STATEMENTS December 31, 2015 Indianapolis,
Southern California Regional Rail Authority. Report to the Executive Management and Audit Committee
 Southern California Regional Rail Authority Report to the Executive Management and Audit Committee February 29, 2012 February 29, 2012 To the Executive Management and Audit Committee Southern California
Financial Report - FY 2017 Year to Date May 31, 2017
 Financial Report - FY 2017 Year to Date July 19, 2017 1 Major Highlights Revenue Sales tax remittances received through YTD April 2017 are 4.2% higher than YTD April 2016 Plaza Saltillo lease income budgeted
SAN JOAQUIN REGIONAL RAIL COMMISSION MEASURE B PROGRAM FUND
 MEASURE B PROGRAM FUND Independent Auditors Report, Financial Statements, Supplementary Information and Other Reports For the Year Ended June 30, 2015 MEASURE B PROGRAM FUND JUNE 30, 2015 TABLE OF CONTENTS
Operating Budget. Third Quarter Financial Report (July 2005 March 2006)
") Third Quarter Financial Report (July 2005 March 2006) INDEX A. Executive Summary...page 2 B. Revenue and Expense Analysis...page 3 C. Budget Variance Reports...page 14 D. Ridership and Performance Measures...page
Third Quarter Financial Report (July 2005 March 2006) INDEX A. Executive Summary...page 2 B. Revenue and Expense Analysis...page 3 C. Budget Variance Reports...page 14 D. Ridership and Performance Measures...page
Management Letter. City of Henderson Henderson, Minnesota. For the Year Ended December 31, 2016
 Management Letter City of Henderson Henderson, Minnesota For the Year Ended December 31, 2016 March 6, 2017 Management, Honorable Mayor and City Council City of Henderson, Minnesota We have audited the
Cash & Liquidity The chart below highlights CTA s cash position at June 2018 compared to June 2017.
 To: Chicago Transit Authority Board From: Jeremy Fine, Chief Financial Officer Re: Financial Results for June 2018 Date: August 15, 2018 I. Summary CTA s financial results are unfavorable to budget for
Financial Management Report... 3
 November 13, 2013 Table of Contents Financial Management Report... 3 OPERATING FUNDS STATEMENT OF REVENUES & EXPENSES... 3 METROPOLITAN COUNCIL INVESTMENT PERFORMANCE SHORT-TERM PORTFOLIO... 4 METROPOLITAN
Skagit County Public Transportation Benefit Area (Skagit Transit)
") Financial Statements and Federal Single Audit Report Skagit County Public Transportation Benefit Area (Skagit Transit) For the period January 1, 2014 through December 31, 2014 Published September 24, 2015
Financial Statements and Federal Single Audit Report Skagit County Public Transportation Benefit Area (Skagit Transit) For the period January 1, 2014 through December 31, 2014 Published September 24, 2015
2
 1 2 3 4 5 6 7 8 9 10 11 12 13 14 15 16 17 18 19 20 21 22 23 24 25 26 27 28 29 30 31 32 33 34 35 36 37 38 39 40 41 42 43 44 45 46 47 48 49 50 51 52 Special Called Meeting of the DCTA Board of Directors
Cash & Liquidity The chart below highlights CTA s cash position at August 2018 compared to August 2017.
 To: Chicago Transit Authority Board From: Jeremy Fine, Chief Financial Officer Re: Financial Results for August 2018 Date: October 10, 2018 I. Summary CTA s financial results are favorable to budget for
Presentation of 2016 Audit Results to the City Council of the City of Simi Valley
 Presentation of 2016 Audit Results to the City Council of the City of Simi Valley Members AICPA Division of Firms Center for Public Company Audit Firms Registered with Public Company Accounting Oversight
8. FINANCIAL ANALYSIS
 8. FINANCIAL ANALYSIS This chapter presents the financial analysis conducted for the Locally Preferred Alternative (LPA) selected by the Metropolitan Transit Authority of Harris County (METRO) for the.
Jefferson County Public Transportation Benefit Area (Jefferson Transit Authority)
") Financial Statements and Federal Single Audit Report Jefferson County Public Transportation Benefit Area (Jefferson Transit Authority) For the period January 1, 2015 through December 31, 2015 Published
Financial Statements and Federal Single Audit Report Jefferson County Public Transportation Benefit Area (Jefferson Transit Authority) For the period January 1, 2015 through December 31, 2015 Published
Washington Metropolitan Area Transit Authority Board Action/Information Summary
 Washington Metropolitan Area Transit Authority Board Action/Information Summary Action Information MEAD Number: 201690 Resolution: Yes No TITLE: FY 2015 External Audit Deliverables PRESENTATION SUMMARY:
Central Puget Sound Regional Transit Authority
 Central Puget Sound Regional Transit Authority Single Audit Reports for the Year Ended December 31, 2017 This page intentionally left blank. TABLE OF CONTENTS Audited Financial Statements Statement of
SUTTER COUNTY MEMORANDUM ON INTERNAL CONTROL AND REQUIRED COMMUNICATIONS FOR THE YEAR ENDED JUNE 30, 2017
 AND REQUIRED COMMUNICATIONS FOR THE YEAR ENDED JUNE 30, 2017 This Page Left Intentionally Blank AND REQUIRED COMMUNICATIONS For the Year Ended June 30, 2017 Table of Contents Page Memorandum on Internal
FY2008 Quarterly Financial & Management Report
 FY2008 Quarterly Financial & Management Report INDEX Page Highlights Strategic Response to Increased Ridership 2 Vanpool Routes Added to Address Growth in Customer Demand 2 Concent Agreement Finalized
City and County of San Francisco Municipal Transportation Agency (SFMTA)
") City and County of San Francisco Municipal Transportation Agency (SFMTA) Audit results Financial statements for the year ended June 30, 2017 December 5, 2017 This presentation to the SFMTA Board of Directors
City and County of San Francisco Municipal Transportation Agency (SFMTA) Audit results Financial statements for the year ended June 30, 2017 December 5, 2017 This presentation to the SFMTA Board of Directors
Texas Local Government Investment Pool Prime. Basic Financial Report August 31, 2017 and 2016
 Texas Local Government Investment Pool Prime Basic Financial Report August 31, 2017 and 2016 Contents Independent Auditor s Report 1-2 Management s Discussion and Analysis 3-8 Financial Statements Statements
OUR RESPONSIBILITY UNDER GENERALLY ACCEPTED AUDITING STANDARDS AND GENERALLY ACCEPTED GOVERNMENT AUDITING STANDARDS
 Deloitte & Touche LLP 361 South Marine Corps Drive Tamuning, GU 96913-3973 USA June 24, 2016 Tel: (671)646-3884 Fax: (671)649-4932 www.deloitte.com The Board of Directors FSM National Government Employees
Assurance. Presentation to audit and reporting committee of Central Puget Sound Regional Transit Authority 2017 Financial statement audit plan
 Assurance Presentation to audit and reporting committee of Central Puget Sound Regional Transit Authority 2017 Financial statement audit plan December 15, 2017 kpmg.com Overview of the audit plan Audit
Performance Management Accountability Meeting Data as of October, 2012
 Performance Management Accountability Meeting Data as of October, 2012 Richard A. Davey, Secretary & CEO Office of Performance Management and Innovation Celia J. Blue, Assistant Secretary November 27,
FUND BALANCES, SCOPE AND AUDITOR OPINION
 FUND BALANCES, SCOPE AND AUDITOR OPINION To the Members of The Board of Education Park Hill School District We have audited the accompanying Statement of Revenues, Expenditures and Changes in Fund Balance
Cash & Liquidity The chart below highlights CTA s cash position at March 2018 compared to March 2017.
 To: Chicago Transit Authority Board From: Jeremy Fine, Chief Financial Officer Re: Financial Results for March 2018 Date: May 9, 2018 I. Summary CTA s financial results are $0.9 million favorable to budget
SAN FRANCISCO COUNTY TRANSPORTATION AUTHORITY: Management Letter for the Financial Statements Audit July 1, 2002, Through June 30, 2003
 SAN FRANCISCO COUNTY TRANSPORTATION AUTHORITY: Management Letter for the Financial Statements Audit July 1, 2002, Through June 30, 2003 Audit Number 03018 March 23, 2004 CITY AND COUNTY OF SAN FRANCISCO
Cash & Liquidity The chart below highlights CTA s cash position at December 2017 compared to December 2016.
 To: Chicago Transit Authority Board From: Jeremy Fine, Chief Financial Officer Re: Financial Results for December 2017 Date: February 14, 2018 I. Summary CTA s financial results are $4.7 million favorable
OUR RESPONSIBILITY UNDER GENERALLY ACCEPTED AUDITING STANDARDS AND GENERALLY ACCEPTED GOVERNMENT AUDITING STANDARDS
 Deloitte & Touche LLP 361 South Marine Corps Drive Tamuning, GU 96913-3911 USA Tel: (671)646-3884 Fax: (671)649-4932 www.deloitte.com February 8, 2013 Board of Directors Guam Visitors Bureau: Dear Members
Report of Independent Accountants on Applying Agreed-Upon Procedures
 KPMG LLP 2001 M Street, NW Washington, DC 20036 Report of Independent Accountants on Applying Agreed-Upon Procedures Board of Directors Washington Metropolitan Area Transit Authority: We have performed
Cash & Liquidity The chart below highlights CTA s cash position at March 2017 compared to March 2016.
 To: Chicago Transit Authority Board From: Jeremy Fine, Chief Financial Officer Re: Financial Results for March 2017 Date: May 10, 2017 I. Summary CTA s financial results are $0.6 million favorable to budget
Health Service System Trust Fund
 Health Service System Trust Fund Audit results City and County of San Francisco Board Presentation for the fiscal years ended June 30, 2017 December 14, 2017 kpmg.com This presentation to the Health Service
CHICAGO TRANSIT AUTHORITY. FINANCIAL STATEMENTS AND SUPPLEMENTARY INFORMATION December 31, 2011 and 2010 (With Independent Auditors Report Thereon)
") FINANCIAL STATEMENTS AND SUPPLEMENTARY INFORMATION (With Independent Auditors Report Thereon) Chicago, Illinois FINANCIAL STATEMENTS CONTENTS Independent Auditors Report... 1 Management s Discussion and
FINANCIAL STATEMENTS AND SUPPLEMENTARY INFORMATION (With Independent Auditors Report Thereon) Chicago, Illinois FINANCIAL STATEMENTS CONTENTS Independent Auditors Report... 1 Management s Discussion and
METROPOLITAN TRANSIT AUTHORITY NASHVILLE, TENNESSEE AUDITED FINANCIAL STATEMENTS AND OTHER FINANCIAL INFORMATION JUNE 30, 2017 AND 2016
 NASHVILLE, TENNESSEE AUDITED FINANCIAL STATEMENTS AND OTHER FINANCIAL INFORMATION JUNE 30, 2017 AND 2016 Table of Contents Page INTRODUCTION... 1-2 INDEPENDENT AUDITOR S REPORT... 3-5 MANAGEMENT S DISCUSSION
MONTHLY FINANCIAL STATUS OCTOBER 2018
 (Millions) MONTHLY FINANCIAL STATUS To: Dave Genova, General Manager and CEO ACTION DISCUSSION INFO From: Heather McKillop, CFO and AGM Administration x Date: December 11, VS. BUDGET YTD VS. BUDGET OCTOBER
City of Fort Worth. City Council Work Session March 28, 2017
 City of Fort Worth City Council Work Session March 28, 2017 Overview Introductions Audit Results Audit Process Required Communications New Standards Discussion 2 Introductions Engagement Leadership Kevin
To the Honorable Mayor and Members of the City Council of the City of San Diego, California:
 Independent Auditors Report on Internal Control Over Financial Reporting and on Compliance and Other Matters Based on an Audit of Financial Statements Performed in Accordance with Government Auditing Standards
Skagit County Public Transportation Benefit Area (Skagit Transit)
") Financial Statements and Federal Single Audit Report Skagit County Public Transportation Benefit Area (Skagit Transit) For the period January 1, 2013 through December 31, 2013 Published September 15, 2014
Financial Statements and Federal Single Audit Report Skagit County Public Transportation Benefit Area (Skagit Transit) For the period January 1, 2013 through December 31, 2013 Published September 15, 2014
January 13, Commissioners Consolidated Commission on Utilities. Dear Commissioners:
 Deloitte & Touche LLP 361 South Marine Corps Drive Tamuning, GU 96913 USA Tel: +1 (671) 646-3884 Fax: +1 (671) 649-4265 www.deloitte.com January 13, 2017 Commissioners Consolidated Commission on Utilities
BUDGET AND STATISTICAL REPORT March 2018
 10 ACTUAL TO FY 2011 ACTUAL BUDGET AND STATISTICAL REPORT March 2018 GENERAL FUND OPERATING REVENUES: YEAR TO DATE COMPARISONS YEAR TO DATE THRU March 2018 $ in millions $300 $250 $200 234.8 257.4 252.8
Report to the Audit Committee of the Board of Governors 2017 Audit Results
 Report to the Audit Committee of the Board of Governors 2017 Audit Results California Independent System Operator Corporation May 16, 2018 Table of Contents Executive Summary 3 Audit Results Audit Risks
Washington Metropolitan Area Transit Authority
 Washington Metropolitan Area Transit Authority Financial Report issued in Accordance with Government Auditing Standards For the Years Ended June 30, 2016 and 2015 Single Audit Reports issued in Accordance
METROPOLITAN COUNCIL ANNUAL AUDIT ENTRANCE MEETING WITH THE AUDIT COMMITTEE YE 12/31/2017
 Date: February 14, 2018 Time: Location: 1:30 pm Robert Street Offices Present: Met Council - Audit Committee Arleen Schilling Director, Program Evaluation and Audit Mary Bogie Chief Financial Officer Marie
MONTHLY FINANCIAL STATUS JANUARY 2019
 (Millions) MONTHLY FINANCIAL STATUS To: Dave Genova, General Manager and CEO ACTION DISCUSSION INFO From: Heather McKillop, CFO and AGM Administration x Date: March 12, 2019 VS. BUDGET YTD 2019 VS. BUDGET
EASTERN SIERRA TRANSIT AUTHORITY ANNUAL FINANCIAL REPORT WITH INDEPENDENT AUDITOR S THEREON. June 30, 2016
 EASTERN SIERRA TRANSIT AUTHORITY ANNUAL FINANCIAL REPORT WITH INDEPENDENT AUDITOR S THEREON June 30, 2016 Annual Financial Report For the Year Ended June 30, 2016 TABLE OF CONTENTS FINANCIAL SECTION Independent