Stormwater Management Fee Policy Options and Recommendations
|
|
|
- Isabella Mills
- 6 years ago
- Views:
Transcription
1 Green Infrastructure Advisory Committee Report Stormwater Management Fee Policy Options and Recommendations Prepared for City of Lancaster, PA March 17, Arch Street Suite 4400 Philadelphia, PA 19103
2
3 Contents Acronyms and Abbreviations... v Executive Summary... ES-1 Background... ES-1 Purpose... ES-2 Benefits of a Dedicated Cost Recovery Source for Stormwater Management... ES-2 Key Findings and Recommendations... ES-3 Summary of Recommendations... ES-9 1 Introduction Purpose Drivers for Dedicated Source of Cost Recovery for Stormwater Management Project History Benefits of a Dedicated Cost Recovery Source for Stormwater Management Impervious Area-based Stormwater User Fee Implementation Steps Green Infrastructure Advisory Committee Composition and Process Policy Options and Recommendations Program Elements, Level of Service, and Costs Program Elements and Regulatory Requirements What does the City need to do and how much does it cost? Level-of-Service Alternatives Level-of-Service Recommendations What are the options to pay for these costs? Rate Structure and Preliminary Rates for Pay-Go and Debt Financing Rate Structure Options - Tiering What is the impact of pay-as-you-go vs. debt financing? Rate Impacts for Different Levels of Service, with Pay-Go Financing Rate Impacts for Different Levels of Service, with Debt Financing Rate Structure Recommendations How can the City incentivize action? Rebates/Grants and Credits Rebates or Grants Credits Incentive Program Recommendations How will the City administer billing? Billing System Options How will the City administer appeals? Appendixes A B C GIAC Participants and Policy Papers Green Infrastructure Advisory Committee Participants Stormwater Utility Program Needs Policy Paper Stormwater Utility Cost Recovery Structure and Policy Paper Stormwater User Charge Rate Structure Policy Paper Stormwater Utility Fee Credits / Incentives Policy Paper Stormwater Utility Impervious Area Fee (SWMF) Billing System Policy Paper Stormwater Utility Impervious Area Fee (SWMF) Appeals Policy Paper Stormwater Management Program Needs Preliminary Stormwater Management Fee Analysis ES BSS III
4 IMPERVIOUS AREA FEE POLICY OPTIONS AND RECOMMENDATIONS Tables ES-1 ES-2 Level of Service Cost Estimate Summary Proposed Four-Tier Rate Structure 2-1 Level of Service Cost Estimate Summary 2-2 Proposed Four-Tier Rate Structure 2-3 Financial Summary for the Medium Level of Service Rate Scenario (Rate Scenario 2) 2-4 Stormwater Utility Rate and Annual SWMF per Property by Tier Medium Level of Service (Rate Scenario 2) 2-5 Example Credit Programs 2-6 Example of Stormwater Facility Classifications for Credits (Montgomery County, MD) Figures ES-1 ES-2 ES-3 Comparison of Program Costs Covered by the SWMF by Rate Scenario (Pay-Go Financing) Comparison of SWMF by Rate Scenario (Pay-Go Financing) Comparison of SWMF Rates with Pay-Go Financing to Debt Financing (Bonds) for Medium Level of Service 1-1 Impervious Area Fee Feasibility Study and Implementation Road Map 2-1 Level of Service Program Needs for the Next 5 Years 2-2 Green Infrastructure Project Status Map 2-3 Comparison of Program Costs Covered by the SWMF by Rate Scenario (Pay-Go Financing) 2-4 Comparison of SWMF by Rate Scenario (Pay-Go Financing) 2-5 Comparison of SWMF Rates with Pay-Go Financing to Debt Financing (Bonds) for Medium Level of Service IV ES BSS
5 Acronyms and Abbreviations AO AWWTF BMP CIP City CSO CSS ERU GI GIAC IA LOS LTCP MS4 NPDES PA DEP sf SFR SWMF TMDL USEPA WIP Administrative Order advanced wastewater treatment facility best management practice (stormwater control, sometimes used interchangeably with GI) Capital Improvement Program City of Lancaster combined sewer overflow combined sewer system equivalent residential unit Green Infrastructure Green Infrastructure Advisory Committee impervious area level of service Long-Term Control Plan for CSOs Municipal Separate Storm Sewer System National Pollutant Discharge Elimination System Pennsylvania Department of Environmental Protection square feet single-family residential stormwater management fee Total Maximum Daily Load U.S. Environmental Protection Agency Watershed Implementation Plan ES BSS V
6
 Plan. In early 2008, the U.S.")

7 Executive Summary Background Numerous drivers requiring changes to the way the City of Lancaster (the City) manages urban stormwater runoff support the need for a dedicated cost recovery source, all of which are addressed in the City s Green Infrastructure (GI) Plan. In early 2008, the U.S. Environmental Protection Agency (USEPA) requested information on the City s Long Term Control Plan (LTCP) for combined sewer overflows (CSOs). In response, the City prepared an update to its LTCP. The City is continuing to discuss the adaptation of the CSO control program, which historically has relied on optimizing the grey infrastructure (underground combined sewers that divert a significant fraction of all sanitary wastes to the City s advanced wastewater treatment facility (AWWTF)). The City has completed upgrades and expansions of all pump stations and a biological nutrient reduction project at the AWWTF over the last 12 years in compliance with the grey infrastructure portion of the LTCP, at a cost of over $32M for city rate payers. More recently the City has moved away from additional storage originally projected to be constructed in the 1998 LTCP towards planning and implementation of GI throughout the city to reduce CSOs as well as to respond to the evolving requirements of the Chesapeake Bay Total Maximum Daily Load (TMDL) and associated Watershed Implementation Plan (WIP) being prepared by Pennsylvania Department of Environmental Protection (PA DEP). Compliance with the Chesapeake Bay TMDL is a requirement of the City s Municipal Separate Storm Sewer Systems (MS4) 1 permit, which sets requirements for stormwater management in areas not served by the City combined sewer system. By managing runoff quantity and quality, implementation of the GI Plan throughout the City helps with compliance with both CSO LTCP and the MS4 permit, and Bay TMDL. In addition, since 2003 the City s first flush ordinance has required that stormwater from new impervious area be managed on-site. Lancaster is in violation of the AO, and needs to address these deficiencies as soon as possible. Violation of the terms of the AO may result in further USEPA enforcement action for violation of the order and for the underlying violations including, but not limited to, imposition of administrative penalties, 33 U.S.C 1319(g), and/or initiation of judicial proceedings that allow for civil penalties of up to $37,500 per day, 33 U.S.C 1319 (b) and (d), for each day of violation. The TMDL is a tool of the federal Clean Water Act and requires the City to reduce pollutant loads to the Chesapeake Bay. The TMDL sets binding limits on nutrient (nitrogen and phosphorus) and sediment pollution, and seeks to ensure that all practices to restore the health of the Bay are in place by 2025, with 60 percent of the actions taken by These regulatory programs will all require the City, like all municipalities in the County, to invest in controls that reduce stormwater runoff, CSOs, and the pollutants they contain. The GI Plan completed by the City in 2010 seeks to address all of these new regulatory requirements in an integrated manner that focuses on fixing other necessary City infrastructure at the same time. The GI Plan will accomplish this objective by providing conceptual 1 US EPA issues permits for stormwater discharges from MS4s, which it defines as a conveyance or system of conveyances that is: Owned by a state, city, town, village, or other public entity that discharges to waters of the U.S.; Designed or used to collect or convey stormwater (including storm drains, pipes, ditches, etc.); Not a combined sewer; and Not part of a Publicly Owned Treatment Works (sewage treatment plant). ES BSS ES-1
8 IMPERVIOUS AREA FEE POLICY OPTIONS AND RECOMMENDATIONS plans that incorporate rain gardens, tree trenches, vegetated curb extensions, and other GI techniques throughout the City s urban environment. A second objective to the City s goal is to enhance the quality of surface and groundwater resources. The City of Lancaster s GI Plan will achieve this objective by providing detailed guidance on demonstration projects that capture stormwater and infiltrate it into the local groundwater table as well as allow for increased evapotranspiration, rather than sending it through the combined sewer system (CSS). In layman s terms, manage rainwater where it falls using the natural ecosystem rather than rely on manmade infrastructure that is costly to construct and maintain. Faced with significant increases in regulatory requirements and anticipated cost recovery gaps, the City has conducted a series of activities to evaluate alternate approaches to complying with regulatory requirements while meeting City goals for economic development, and to evaluate the feasibility of developing an impervious area (IA) -based fee for stormwater management services (sometimes known as a stormwater utility). To attract broad stakeholder input to these studies, the City formed the Green Infrastructure Advisory Committee (GIAC) in 2010, which includes representatives from business owners, citizens, institutions, environmental groups, state government, and Lancaster city and county government. Purpose The purpose of this report is to document the policy options and recommendations of the GIAC for the elected officials of the City to consider with respect to implementing the Green Infrastructure (GI) Plan, maintaining new and existing storm water management systems, complying with increasing federal and state regulatory requirements and avoiding costly litigation that comes along with consent orders and potential fines that many other cities across the country have faced from the USEPA.. Faced with anticipated cost recovery gaps, the City has conducted a series of activities to evaluate alternate approaches to address the capital and ongoing maintenance costs while also meeting City goals for economic development, and to evaluate the feasibility of developing an IA-based fee for stormwater management services (sometimes known as a stormwater utility). Each property contributes to the need for stormwater management based on the volume of runoff generated by their property. That volume of runoff is a direct function of how much impervious surface is on their property, such as rooftops and paved surfaces, which prevent rainfall from infiltrating. So a stormwater management fee is typically assessed based on the amount of impervious surface on each property. The GIAC was initially convened to help in the development of the GI Plan, and was reconvened to evaluate cost recovery options, including implementation of a stormwater management fee (SWMF) based on IA. The GIAC carefully reviewed policy options as described below. What does the City need to do and how much does it cost? Program elements, level of service (LOS), and cost to provide regulatory compliance and improved customer service. What are the options to pay for these costs? What dedicated cost recovery options should be implemented? Continuation of current City reliance on sewer user fees, or implementation of a dedicated property tax based on assessed value, or implementation of a stormwater management fee (SWMF) based on impervious area? What rate structure options for the SWMF is right for our city? Should we use a pay-as-you-go financing program for a 10-year planning horizon or should we use debtfinancing for the stormwater Capital Improvement Program (CIP)? How can the City incentivize action? Incentive options include rebates or grants and/or credits. How will the City administer billing? How will the City manage appeals? Benefits of a Dedicated Cost Recovery Source for Stormwater Management A dedicated cost recovery source, such as an SWMF, provides the City with the benefits listed below: ES-2 ES BSS
9 EXECUTIVE SUMMARY For citizens: Improved public health and safety, Improved customer service and a reduced backlog of customer complaints, Reduced long-term capital costs through proactive maintenance, Local drainage improvements that help to reduce localized flooding, and Other triple bottom line benefits such as potential increased property value (but not property assessments), and improved aesthetic and environmental quality. For businesses: Improved City services, Cleaner streets, which help improve the business climate, and Support of economic development initiatives and public-private partnerships For environmental quality: Meeting local and regional regulations on water quality, reducing the possibility of USEPA fines for compliance with permit requirements, Creating cleaner rivers, creeks and streams, and Providing cleaner waterfront and park areas. There are significant issues related to stormwater management, which are the focus of recent regulatory requirements such as the MS4 permit and consent orders (a legal document signed by a judge that spells out actions required, schedule, and fines should action not be completed) related to combined sewer overflows (CSOs). As described above, the City is facing increased scrutiny from both USEPA and the PA DEP and has been fined, along with numerous other cities, for violations related to interpretations of the Clean Streams Law. Projects and programs related to stormwater are dispersed throughout the City s Department of Public Works, and implementation of a dedicated cost recovery source can help streamline and provide program efficiencies in both projects and programs. One of the main benefits is movement away from a reactive, customer-complaintdriven model for stormwater management to a proactive, strategic, and customer-service-driven approach. Key Findings and Recommendations What does the City need to do and how much does it cost? Program Elements, Level of Service, and Costs The GIAC first considered the requirements to meet the City s regulatory obligations, maintain its existing infrastructure and further reduce combined storm water overflows. These program elements, taken together, represent an LOS. Three LOS alternatives were considered and consisted of the following: Low Medium High Assumes current level of expenditures and MS4 permit implementation (considered to be status quo or no changes to our current program which has been deemed inadequate due to regulations promulgated by USEPA); Assumes GI Plan implementation (public properties only), MS4 permit implementation, increased maintenance and customer service; or Assumes GI Plan implementation (public and private properties), MS4 permit implementation, high level of maintenance and customer service. Table ES-1 summarizes the LOS cost estimates for program elements for the proposed SWMF. The GIAC recommended that dedicated cost recovery options be investigated to provide at least the medium LOS, with a goal of moving towards the higher LOS. It was agreed that the current low LOS would not be adequate to meet regulatory requirements. ES BSS ES-3
10 IMPERVIOUS AREA FEE POLICY OPTIONS AND RECOMMENDATIONS TABLE ES-1 Level of Service Cost Estimate Summary Estimated Annual Costs Low Medium High Operating and Maintenance Green Infrastructure n/a $162,000 $202,500 Dry and Wet Ponds (inspection) $2,300 $2,300 $2,300 Street Sweeping $168,800 $168,800 $234,100 Catch Basin $201,000 $201,000 $402,000 Storm Drainage n/a n/a n/a MS4 Implementation $451,566 $536,412 $612,412 Program Administration $142,000 $219,000 $296,000 Capital Costs Green Infrastructure $730,600 $1,909,100 $3,652,400 Storm Drainage n/a $1,444,000 $1,926,000 Catch Basin $164,000 $164,000 $164,000 Total $1,860,266 $4,806,612 $7,491,712 What are the options to pay for these costs? Rate Structure and Preliminary Rates for Pay-Go and Debt Financing The GIAC reviewed three options for dedicated cost recovery of the GI Plan and permit requirements, including: Continuation of current City reliance on sewer user fees, Implementation of a dedicated property tax based on assessed value, or Implementation of a stormwater management fee (SWMF) based on impervious area. Comparisons of the effects of these three options were done across all the major property classes in the City, including single-family residential, multi-family residential, commercial, industrial, institutional, faith organizations and non-profits. In addition, a review was conducted of what other jurisdictions are doing to meet these cost recovery challenges. Based on that assessment, the GIAC is recommending proceeding with the SWMF because it is more equitable, that is properties pay based on their contributions to stormwater runoff as measured by impervious area, and everyone who contributes to the issue will pay including parking lots who do not currently have water/sewer bills, and tax-exempt properties who do not currently pay property taxes. In addition to the equity of assessing a fee based on impervious area, it is important to note that by investing in GI for the City s overall stormwater and CSO management strategy, all properties avoid paying an additional sewer charge of $0.23-$0.26 per gallon estimated for grey storage. For the SWMF, a number of rate structure options were considered, as discussed below. Rate Structure Options - Tiering There are various approaches to determine rate structure. Properties could be assessed a fee based on whether they are residential, business, multi-unit, institutional or other. However, this approach does not take into consideration the various sized properties and amount of IA on each. As such, it is recommended that the City utilize a tiered approach that is based on the amount of IA. The tiers were derived based on aerial photography. Table ES-2 shows the IA range for the recommended fourtier rate structure. This method groups properties within a range of IA, which are then assessed based on the ES-4 ES BSS
11 EXECUTIVE SUMMARY average. For larger parcels over 3,000 square feet, an actual calculation will be made of IA and applicable fee applied. Three rate structure options were evaluated using impervious estimates based on aerial photography and digitization of IAs included in the City s geographic information system. For the three rate scenarios, the tiering method rate structure, which is applied to all properties, was used. The tiering method groups all properties within a range of IA, which are then assessed a fee based on a representative IA for that range. Based on feedback from the GIAC, using a rate structure based on four tiers was preferred over using actual IA, or lumping all single IA properties by type because it represents the most reasonable and equitable method. TABLE ES-2 Proposed Four-Tier Rate Structure based on Medium LOS a Preliminary Stormwater Charge (Year 1) b Tier Impervious Area Range Annual Quarterly 1 <=1,000 sf $15.48 $ >1,000 sf and <=2,000 sf $46.44 $ >2,000 sf and <=3,000 sf $77.40 $ >3,000 Charge based on total impervious area $30.96/1,000 sf $7.74/1,000 sf a Applies to all properties. b Assumes medium LOS, a $4,800,000 stormwater program and pay-go financing. This represents estimated cost recovery requirement, gross before subtracting grants / PennVest loans. After grants and PennVest loan, the estimated Year 1 net cost recovery requirement is $2,600,000. sf = square feet What is the impact of pay-as-you-go vs. debt financing? Rate Impacts for Different Levels of Service, with Pay-Go Financing Pay-as-you-go implies that you spend only the revenues you have on hand, generated by the stormwater management fee. Figure ES-1 below illustrates the program costs based on the three LOS scenarios evaluated as part of this study. The program costs required to be recovered by the fee in the first 3 years are low compared to years 4 and 5 because the use of grants and loans help reduce the costs that would be recovered by the SWMF. The capital requirements represent the largest expense item and is used to recover costs for projects contemplated in the GI Plan such as green streets, green parks, downspout disconnections (cisterns or rain barrels), etc. The use of grants and loans in early years offset the CIP cost and help to keep the SWMF low. These grants and loans that have been awarded to the City because the GI Plan is innovative and the USEPA s goal is for all municipalities to implement GI projects. Therefore, the City does not expect these sources of cost recovery to be available in the future. However, in years 4 and 5 the capital requirements increase significantly because currently available grants/loans are exhausted, which affects the SWMF. To fund capital requirements in years 4 and 5 without further increases in the SWMF, additional grants/loans would need to be secured or the use of debt financing needs to be considered. Figure ES-2 illustrates the SWMF ($ per 1,000 sf) to recover the program costs identified in Figure ES-1 and to cover the program costs for each rate scenario assuming pay-as-you-go CIP cost recovery. The significant increase in years 4 and 5 are attributable to the increase in capital requirements after currently available grants/loans are used to fund other capital projects. The recommended scenario is Rate Scenario 2 Medium Level of Service, which represents the estimated program needs to satisfy MS4 permit and other regulatory requirements that have been established by USEPA and PA DEP with timelines already established for compliance ES BSS ES-5
12 IMPERVIOUS AREA FEE POLICY OPTIONS AND RECOMMENDATIONS Rate Impacts for Different Levels of Service, with Debt Financing Figure ES-3 illustrates, for Rate Scenario 2 Medium Level of Service, the sensitivity of using pay-as-you-go versus debt financing for the capital requirements starting in Year 4. The use of debt financing helps keep rates low and spreads the costs over time to current and future rate payers. Additionally, as is the City s current practice for all capital expenditures, future rate payers are sharing the cost of the investment made today for assets that last for many decades into the future. Rate Structure Recommendations The GIAC recommends Rate Scenario 2 Medium Level of Service, which represents the estimated program needs to satisfy MS4 permit and other regulatory requirements, and to avoid further enforcement action including consent orders and fines. The following financing options are recommended: Use tiering of all properties, with four tiers based on the IA area ranges shown in Table ES-2; and Use the SWMF to leverage bonds, so that debt financing can be used to keep rates lower over the long term and spread costs over time to current and future rate payers. FIGURE ES-1 Comparison of Program Costs Covered by the SWMF by Rate Scenario (Pay-Go Financing) Millions $11 $10 $9 $8 $7 $6 $5 $4 Low Medium High $3 $2 $1 $ Year ES-6 ES BSS
13 EXECUTIVE SUMMARY FIGURE ES-2 Comparison of SWMF by Rate Scenario (Pay-Go Financing) $160 $ $140 $ $120 IASF ($/1,000 sf) $100 $80 $60 $60.89 $60.89 $71.00 $79.47 $96.32 Low Medium High $40 $30.96 $30.96 $30.96 $20 $19.22 $19.22 $19.22 $19.22 $19.22 $ Year FIGURE ES-3 Comparison of SWMF Rates with Pay-Go Financing to Debt Financing (Bonds) for Medium Level of Service $160 $140 $120 Annual Rate ($/1,000 sf) $100 $80 $60 $79.47 $96.32 $40 $30.96 $30.96 $30.96 $43.65 $44.57 $20 $30.96 $30.96 $30.96 Bonds Pay Go $ Year How can the City incentivize action? Rebates/Grants and Credits Many stormwater utilities that assess fees based on IA provide incentives to properties with onsite stormwater facilities to treat stormwater runoff. As discussed in the GI Plan, there is not enough public property to manage enough stormwater to significantly reduce or eliminate CSOs and therefore the City needs private property ES BSS ES-7
14 IMPERVIOUS AREA FEE POLICY OPTIONS AND RECOMMENDATIONS owners to do their fair share in helping to reduce overflows. There are two types of incentive programs typically are considered: Rebates or grants, and Credits. The purpose of grants or rebates is to provide a one-time subsidy to reduce construction costs associated with installing stormwater facilities on private property. This sort of program is fairly uncommon, but is growing in popularity among jurisdictions with CSO and MS4 permit mandates. The purpose of credits is to help property owners reduce their annual stormwater fee, thus providing an incentive for implementing stormwater management facilities. Historically, credits have been offered only to commercial properties, but recent trends show that single-family properties are now eligible for certain types of credits. The credit amount that a property can receive varies among stormwater utilities. Most utilities provide only a partial credit, while others provide a full credit. The rationale for not providing a 100-percent credit, even if all stormwater is managed onsite, is that property owners should contribute to services provided by the City that are beyond their property lines, such as citywide permit compliance, road drainage maintenance, and GI improvements on public lands. Also, the City must have stormwater management facilities available to deal with extraordinary storms that create run-off from properties that usually do not create run-off. The criteria for determining the credit level typically is based on the type of facility and percent of IA treated (usually just the onsite IA). Incentive Program Recommendations Because the GI Plan requires a significant proportion of new capital facilities to be built on private property, the GIAC recommends providing an incentive program cost recovered by the SWMF. This would include some combination of rebates for facility construction, as well as credits to encourage maintenance of those facilities. Credits have the added benefit of giving property owners some mechanism of reducing the financial impact of the SWMF. A property owner using grants to help pay for GI improvements will also be eligible to receive credits, provided they apply separately for credits. Application for credits typically entails agreeing to maintain the facility and allowing the City to perform inspections. Overtime, cost of the improvements borne by the property owner could be recouped through the reduction in the quarterly fee from the credits. An allowance was included for the cost a credit program in the estimated SWMF scenarios. How will the City administer billing? Billing System Options Three billing methods are commonly used to collect stormwater utility charges around the country: real estate tax bills, water/sewer utility bills, or separate billing systems. Selection of a billing system is unique to the locality establishing a stormwater utility. For example, the water/sewer bill may only cover part of the stormwater utility service area, while the property tax database provides complete coverage. The selection of the billing method should be cost-effective, timely, and capture all affected properties. Billing Recommendations The City administration is currently recommending adding a new line item for the SWMF to the water and sewer bill that is issued quarterly or monthly based on the rate class for the property. Properties that currently do not get a water/sewer bill will be added to the list getting bills for the SWMF, with their water/sewer line item showing a $0 charge. How will the City administer appeals? All stormwater utility charges typically provide a mechanism for rate payers to appeal their bills and allow them the ability to correct erroneous information. However, what can be appealed, when, and the process for submitting and reviewing appeals need to be clearly defined to make the fee defensible and manageable. What can be appealed typically is limited to the following: IA calculation and tier assignment, ES-8 ES BSS
15 EXECUTIVE SUMMARY Determination of exemption status (for example, if the enabling ordinance exempts local and state governments), and Credit calculation, assuming a property owner applied for a credit. Appeals are typically submitted only once per year, well in advance of the billing cycle. Appeals Recommendations The City administration would prefer that appeals be allowed only once per year, to minimize administrative costs and are recommending that a deadline for appeals be set 6 months before the first bills go out in a given fiscal year. Summary of Recommendations The GIAC made the following recommendations for the City of Lancaster to address its stormwater management regulatory obligations and further reduce combined storm water overflows: Recover costs of the stormwater management program at the medium level of service, which assumes GI Plan implementation (public properties only), MS4 permit implementation, increased maintenance and customer service, and rehabilitation of existing stormwater infrastructure. The gross program costs for the medium level of service are estimated to be $4.8 million annually. Recover costs of the program with a stormwater management fee based on impervious area, as the most equitable approach compared to other options such as raising property taxes or sewer fees. Implement the stormwater management fee (SWMF) with a rate structure based on four tiers of impervious area; Tier 1: up to 1000 square feet, Tier 2: from 1000 to 2000 sf, Tier 3: from 2000 to 3000 sf, and Tier 4: over 3000 sf. Initial rates are estimated at $30.96/1000 sf/year. Leverage the SWMF by issuing bonds to keep rates low and spread capital costs over time. Include an incentive program to encourage implementation and maintenance of green infrastructure projects on private property. The incentives could include rebate or grant program to defray one-time upfront capital costs, as well as a credit program to reduce fees and promote facility maintenance. Bill the SWMF as a new line item on the existing sewer bill, which is issued monthly or quarterly depending on the account. Provide an appeals mechanism for property owners to seek corrections to their bills based on impervious area, tier category, or credit calculation. The appeals process would be tied an annual deadline, with the initial appeal cycle starting after assessment notices are issued for the estimated SWMF. ES BSS ES-9
16
17 SECTION 1 Introduction 1.1 Purpose The purpose of this report is to document the policy options and recommendations of the Green Infrastructure Advisory Committee (GIAC) for the elected officials of the City of Lancaster (the City) to consider with respect to implementing the Green Infrastructure (GI) Plan, maintaining new and existing storm water management systems, complying with increasing federal and state regulatory requirements, and avoiding costly litigation that comes along with consent orders and potential fines that many other cities across the country have faced from the U.S. Environmental Protection Agency (USEPA). Faced with anticipated cost recovery gaps, the City has conducted a series of activities to evaluate alternate approaches to address recovery of the capital and ongoing maintenance costs while also meeting City goals for economic development, and to evaluate the feasibility of developing an impervious area (IA) -based fee for stormwater management services (sometimes known as a stormwater utility). Each property contributes to the need for stormwater management based on the volume of runoff generated by their property. That volume of runoff is a direct function of how much impervious surface is on their property, such as rooftops and paved surfaces, which prevent rainfall from infiltrating 2. So a stormwater management fee is typically assessed based on the amount of impervious surface on each property. The GIAC carefully reviewed policy options as described below: What does the City need to do and how much does it cost? Program elements, level of service (LOS), and cost to provide regulatory compliance and improved customer service. What are the options to recover these costs? What dedicated options should be implemented? Continuation of current City reliance on sewer user fees, or implementation of a dedicated property tax based on assessed value, or implementation of a stormwater management fee (SWMF) based on IA? What rate structure options for the SWMF is right for our city? Should we use a pay-as-you-go financing program for a 10-year planning horizon, or should we use debtfinancing for the stormwater Capital Improvement Program (CIP)? How can the City incentivize action? Incentive options include rebates or grants and/or credits. How will the City administer billing? How will the City manage appeals? 1.2 Drivers for Dedicated Source of Cost Recovery for Stormwater Management Numerous drivers requiring changes to the way the City manages urban stormwater runoff support the need for a dedicated cost recovery source, all of which are addressed in the City s GI Plan. In early 2008, the USEPA requested information on the City s Long Term Control Plan (LTCP) for combined sewer overflows (CSOs). In response, the City prepared an update to its LTCP. The City is continuing to discuss the adaptation of the CSO control program, which historically has relied on optimizing the grey infrastructure (underground combined sewers that divert a significant fraction of all sanitary wastes to the City s advanced 2 Impervious surfaces will need to be clearly defined within the ordinance establishing the stormwater management fee. The following is a typical definition provided in a stormwater management fee ordinance from Montgomery County, MD: Any surface that prevents or significantly impedes the infiltration of water into the underlying soil, including any structure, building, patio, deck sidewalk, compacted gravel, pavement, asphalt, concrete, stone, brick, tile, swimming pool, or artificial turf. Impervious surface also includes any area used by or for motor vehicles or heavy commercial equipment, regardless of surface type or material, including any road, road shoulder driveway, or parking area. The City would need to decide whether or not to include compacted soil and grass, as has been done in the example above. Some jurisdictions count that as impervious, others say that counts as half. Lancaster County s model ordinance says that gravel is considered impervious. ES BSS 1-1
18 IMPERVIOUS AREA FEE POLICY OPTIONS AND RECOMMENDATIONS wastewater treatment facility (AWWTF)). The City has completed upgrades and expansions of all pump stations and a biological nutrient reduction project at the AWWTF over the last 12 years in compliance with the grey infrastructure portion of the LTCP, at a cost of over $32M for city rate payers. More recently, the City has moved away from additional storage originally projected to be constructed in the 1998 LTCP towards planning and implementation of GI throughout the city to reduce CSOs as well as to respond to the evolving requirements of the Chesapeake Bay Total Maximum Daily Load (TMDL) and associated Watershed Implementation Plan (WIP) being prepared by Pennsylvania Department of Environmental Protection (PA DEP). Compliance with the Chesapeake Bay TMDL is a requirement of the City s Municipal Separate Storm Sewer Systems (MS4) 3 permit, which sets requirements for stormwater management in areas not served by the City combined sewer system. By managing runoff quantity and quality, implementation of the GI Plan throughout the City helps with compliance with both CSO LTCP and the MS4 permit, and Bay TMDL. In addition, since 2003 the City s first flush ordinance has required that stormwater from new impervious area be managed on-site. The TMDL is a tool of the federal Clean Water Act and requires the City to reduce pollutant loads to the Chesapeake Bay. The TMDL sets binding limits on nutrient (nitrogen and phosphorus) and sediment pollution, and seeks to ensure that all practices to restore the health of the Bay are in place by 2025, with 60 percent of the actions taken by These regulatory programs will all require the City, like all municipalities in the County, to incur costs for controls that reduce stormwater runoff, CSOs, and the pollutants they contain. The GI Plan completed by the City in 2010 seeks to address all of these new regulatory requirements in an integrated manner that focuses on fixing other necessary City infrastructure at the same time. The GI Plan will accomplish this objective by providing conceptual plans that incorporate rain gardens, tree trenches, vegetated curb extensions, and other GI techniques throughout the City s urban environment. A second objective to the City s goal is to enhance the quality of surface and groundwater resources. The City of Lancaster s GI Plan will achieve this objective by providing detailed guidance on demonstration projects that capture stormwater and infiltrate it into the local groundwater table as well as allow for increased evapotranspiration, rather than sending it through the combined sewer system (CSS). In layman s terms, this means managing rainwater where it falls using the natural ecosystem rather than relying on manmade infrastructure that is costly to construct and maintain. 1.3 Project History Faced with significant increases in regulatory requirements and anticipated cost recovery gaps, the City has conducted a series of activities to evaluate alternate approaches to address the capital and ongoing maintenance costs while also meeting City goals for economic development, and to evaluate the feasibility of developing an IA - based fee for stormwater management services (sometimes known as a stormwater utility). Each property contributes to the need for stormwater management based on the volume of runoff generated by the property. That volume of runoff is a direct function of how much impervious surface is on the property, such as rooftops and paved surfaces, which prevent rainfall from infiltrating. So a stormwater management fee is typically assessed based on the amount of impervious surface on each property. Based on the GIAC s recommendations, the City retained CH2M HILL in March 2012 to assist in moving towards implementing an IA-based fee. Studies and activities completed before the current implementation efforts include the following: Stormwater Utility Feasibility Analysis Status Briefing (CDM, November 2010), 3 US EPA issues permits for stormwater discharges from MS4s, which it defines as a conveyance or system of conveyances that is: Owned by a state, city, town, village, or other public entity that discharges to waters of the U.S.; Designed or used to collect or convey stormwater (including storm drains, pipes, ditches, etc.); Not a combined sewer; and Not part of a Publicly Owned Treatment Works (sewage treatment plant). 1-2 ES BSS
19 SECTION 1 INTRODUCTION Urban Tree Canopy: A Report on the City of Lancaster s Existing and Possible Tree Canopy (Pennsylvania Department of Conservation and Recreation and University of Vermont, February 2011), Stormwater Fee Structure Evaluation (CDM, March 2011), Green Infrastructure Master Plan for the City of Lancaster (CH2M HILL, April 2011), Lancaster City Tree Inventory and Summary Report (Draft, Penn State, October 2011), Keith Campbell Grant: Stormwater Utility Credits and Incentives for Green Infrastructure A Case Study Assessment (CH2M HILL, November 2011), Stormwater Management: Program Needs, Levels of Service, and Cost (Draft Technical Memorandum, CH2M HILL, August 2012), Stormwater Management: Program Needs, Levels of Service, and Cost (Draft Technical Memorandum No.1, CH2M HILL, August 2012), and Preliminary Stormwater Management Fee (SWMF) Analysis (Draft Technical Memorandum No.2, CH2M HILL, September 2012). 1.4 Benefits of a Dedicated Cost Recovery Source for Stormwater Management A dedicated cost recovery source, such as an SWMF, provides the City with the benefits listed below: For citizens Improved public health and safety, Improved customer service and a reduced backlog of customer complaints, Reduced long-term capital costs through proactive maintenance, Local drainage improvements that help reduce localized flooding, and Other triple bottom line benefits such as potential increased property value (but not property assessments), and improved aesthetic and environmental quality. For businesses Improved City services, Cleaner streets, which help improve the business climate, and Support of economic development initiatives and public-private partnerships. For environmental quality Meeting local and regional regulations on water quality, reducing the possibility of USEPA fines for compliance with permit requirements, Creating cleaner rivers, creeks and streams, and Providing cleaner waterfront and park areas. There are significant issues related to stormwater management, which are the focus of recent regulatory requirements such as the Municipal Separate Storm Sewer Systems (MS4) 4 permit and consent orders (a legal document signed by a judge that spells out actions required, schedule, and fines should action not be completed) 4 US EPA issues permits for stormwater discharges from MS4s, which it defines as a conveyance or system of conveyances that is: Owned by a state, city, town, village, or other public entity that discharges to waters of the U.S.; Designed or used to collect or convey stormwater (including storm drains, pipes, ditches, etc.); Not a combined sewer; and Not part of a Publicly Owned Treatment Works (sewage treatment plant). ES BSS 1-3
20 IMPERVIOUS AREA FEE POLICY OPTIONS AND RECOMMENDATIONS related to CSOs. As described above, the City is facing increased scrutiny from both USEPA and the PA DEP and has been fined, along with numerous other cities, for violations related to interpretations of the Clean Streams Law. Projects and programs related to stormwater are dispersed throughout the City s Department of Public Works, and implementation of a dedicated cost recovery source can help streamline and provide program efficiencies in both projects and programs. One of the main benefits is movement away from a reactive, customer-complaint-driven model for stormwater management to a proactive, strategic, and customer-servicedriven approach. 1.5 Impervious Area-based Stormwater User Fee Implementation Steps Figure 1-1 shows the overall sequence of tasks that are being followed to move towards implementing an IAbased stormwater user fee. The review of program requirements and level of service (LOS) options were developed in Task A. Those program costs are being used to evaluate staffing needs in Task B, and cost recovery options and policy implications in Tasks D and C, with review and input by the GIAC. The GIAC s input constitutes the first step of a concerted public outreach program in Task F that will continue with a series of public outreach activities targeting a cross-section of stakeholder groups. Materials for public outreach are currently being developed, including powerpoint presentations, fact sheets, and a frequently asked questions (FAQ) document. FIGURE 1-1 Impervious Area Fee Feasibility Study and Implementation Road Map 1.6 Green Infrastructure Advisory Committee Composition and Process To attract broad stakeholder input to these studies, the City formed the GIAC in 2010, which includes representatives from the business and faith communities, city residents, non-profit institutions, environmental groups, state government, and Lancaster city and county government. Following its work on development of the GI Plan, the GIAC was reconvened to support the SWMF evaluation through a series of meetings to evaluate policy options. These options, deliberations, and recommendations are documented in this report. For the SWMF evaluation, the GIAC participated in a total of six meetings between May and September The meetings were structured to educate the GIAC on policy options, solicit feedback on additional analyses needed, and obtain recommendations. One or two policy issues were discussed in each meeting, with each successive meeting allowing for a recap of discussion and preliminary recommendations, before being finalized. A series of policy papers were prepared, with a new policy paper being distributed ahead of each meeting. Policy papers were also used to capture discussion and decisions by the GIAC, with updated policy papers distributed after each 1-4 ES BSS
21 SECTION 1 INTRODUCTION meeting to reflect the discussion and recommendations. Appendix A provides a list of GIAC members, City staff members, and consultants who supported this effort. ES BSS 1-5
22
23 SECTION 2 Policy Options and Recommendations 2.1 Program Elements, Level of Service, and Costs Appendix A contains the policy paper that was prepared and reviewed by the GIAC on program elements, LOS, and costs. Appendix B contains the Technical Memorandum that was prepared to document the analysis of program costs and level of service. Key issues and recommendations are summarized below Program Elements and Regulatory Requirements What does the City need to do and how much does it cost? An analysis was performed to document the various activities of the bureaus within the City s Department of Public Works that contribute to stormwater management and watershed protection and to document the baseline and potential program enhancements and cost recovery requirements that will provide for regulatory compliance and improved customer service. A stormwater management program assessment was developed for the following program elements and their respective costs: Program administration, Inspection and maintenance of stormwater best management practices (BMPs) and GI, National Pollutant Discharge Elimination System (NPDES) Phase II permit implementation for MS4, Compliance with TMDL and WIP, Flood control and floodplain management programs, Wet-weather-related wastewater treatment, and Wet weather CIP, including GI. For each of these program elements, the project team analyzed and summarized internal and external program costs for a 5-year period for three different LOS alternatives and compared these to the current program. Although no two stormwater utilities (IA-based user fee programs) are exactly alike, the program costs recovered by the fee are generally similar. In order to identify the program costs for the proposed fee, individual program elements were evaluated and estimates were developed based on a combination of previous studies, staff salaries, estimated time spent on stormwater-related functions/services, and other expenditures Level-of-Service Alternatives The GIAC first considered the requirements to meet the City s regulatory obligations and further reduce combined storm water overflows. These program elements, taken together, represent an LOS. Three LOS alternatives were considered and consisted of the following: Low Medium High Assumes current level of expenditures and MS4 permit implementation (considered to be status quo or no changes to our current program, which has been deemed inadequate due to regulations promulgated by USEPA); Assumes GI Plan implementation (public properties only), MS4 permit implementation, increased maintenance and customer service; or Assumes GI Plan implementation (public and private properties), MS4 permit implementation, high level of maintenance and customer service. Table 2-1 summarizes the LOS cost estimates for program elements for the proposed SWMF. Figure 2-1 shows how costs are assumed to be distributed over the first 5 years of the program for the medium and high LOS alternatives. ES BSS 2-1
24 IMPERVIOUS AREA FEE POLICY OPTIONS AND RECOMMENDATIONS TABLE 2-1 Level of Service Cost Estimate Summary Estimated Annual Costs Low Medium High Operating and Maintenance Green Infrastructure* n/a $162,000 $202,500 Dry and Wet Ponds (inspection) $2,300 $2,300 $2,300 Street Sweeping $168,800 $168,800 $234,100 Catch Basin $201,000 $201,000 $402,000 Storm Drainage n/a n/a n/a MS4 Implementation $451,566 $536,412 $612,412 Program Administration $142,000 $219,000 $296,000 Capital Costs Green Infrastructure $730,600 $1,909,100 $3,652,400 Storm Drainage n/a $1,444,000 $1,926,000 Catch Basin $164,000 $164,000 $164,000 Total $1,860,266 $4,806,612 $7,491, Level-of-Service Recommendations The GIAC recommended that dedicated cost recovery options be investigated to provide at least the medium LOS, with a goal of moving towards the higher LOS. It was agreed that the current low LOS would not be adequate to meet regulatory requirements. FIGURE 2-1 Level of Service Program Needs for the Next 5 Years Total Estimate Annual Costs $8,000,000 $7,000,000 $6,000,000 $5,000,000 $4,000,000 High Medium Low $3,000,000 $2,000,000 $1,000,000 $ Year 2-2 ES BSS
25 SECTION 2 POLICY OPTIONS AND RECOMMENDATIONS As part of the City s GI program, the SWMF would cover costs associated with ongoing planning, engineering, and construction of projects shown in Figure 2-2. FIGURE 2-2 Green Infrastructure Project Status Map ES BSS 2-3
26 IMPERVIOUS AREA FEE POLICY OPTIONS AND RECOMMENDATIONS 2.2 What are the options to pay for these costs? Rate Structure and Preliminary Rates for Pay-Go and Debt Financing The GIAC reviewed three options for dedicated cost recovery of the GI Plan and permit requirements, including: Continuation of current City reliance on sewer user fees, Implementation of a dedicated property tax based on assessed value, or Implementation of a stormwater management fee (SWMF) based on IA. Comparisons of the effects of these three options were done across all the major property classes in the city, including single-family residential, multi-family residential, commercial, industrial, institutional, faith organizations and non-profits. In addition, a review was conducted of what other jurisdictions are doing to meet these cost recovery challenges. Based on that assessment, the GIAC is recommending proceeding with the SWMF because it is more equitable, that is properties pay based on their contributions to stormwater runoff as measured by impervious area, and everyone who contributes to the issue will pay including parking lots who do not currently have water/sewer bills, and tax-exempt properties who do not currently pay property taxes. In addition to the equity of assessing a fee based on impervious area, it is important to note that by investing in GI for the City s overall stormwater and CSO management strategy, all properties avoid paying an additional sewer charge of $0.23-$0.26 per gallon estimated for grey storage. For the SWMF, a number of rate structure options were considered, as discussed below. Appendix A contains the policy papers that were prepared and reviewed by the GIAC on rate structure alternatives and preliminary rates for the option to pay all costs annually (Pay-Go), or issue bonds to finance the capital improvement program. Appendix C contains the Technical Memorandum that was prepared to document the analysis of financing options, fees and rate structure options. Key issues and recommendations are summarized below. The City of Lancaster Department of Public Works currently provides stormwater management functions and services, which fall under several bureaus. The stormwater program is cost recovered through the Sewer Fund and General Fund. As part of this study, a rate model was prepared to evaluate an SWMF to fund the City s stormwater management program. A separate effort will look at how to organize the overall stormwater management functions to provide the higher level of service recommended by the GIAC. It is anticipated that stormwater management functions will be moved from various bureaus into a single stormwater management bureau, which will improve efficiency by being directed by one program manager, and will alleviate the burden on the general fund (i.e. street sweeping), and ensures compliance with current and future regulations Rate Structure Options - Tiering There are various approaches to determine rate structure. Properties could be assessed a fee based on whether they are residential, business, multi-unit, institutional or other. However, this approach does not take into consideration the various sized properties and amount of IA on each. As such, it is recommended that the city utilize a tiered approach that is based on the amount of IA. Three rate structure options were evaluated using impervious estimates based on aerial photography and digitization of IAs included the City s geographic information system. For the three rate scenarios, the tiering method (4 tiers) rate structure, which is applied to all properties, was used. Table 2-2 shows the IA range for the recommended four-tier rate structure. The tiering method groups all properties within a range of IA, which are then assessed a fee based on a representative IA for that range. For larger parcels over 3,000 square feet, an actual calculation will be made of IA and applicable fee applied. Based on feedback from the GIAC, the tiering method was preferred over using actual IA or lumping all single IA properties by type because it represents the most reasonable and equitable method. 2-4 ES BSS
27 SECTION 2 POLICY OPTIONS AND RECOMMENDATIONS TABLE 2-2 Proposed Four-Tier Rate Structure based on Medium LOS a Preliminary Stormwater Charge (Year 1) b Tier Impervious Area Range Annual Quarterly 1 <=1,000 sf $15.48 $ >1,000 sf and <=2,000 sf $46.44 $ >2,000 sf and <=3,000 sf $77.40 $ >3,000 Charge based on total impervious area $30.96/1,000 sf $7.74/1,000 sf a Applies to all properties. b Assumes medium LOS, a $4,800,000 stormwater program and pay-go financing. This represents estimated program costs covered by the SWMF, gross before subtracting grants / PennVest loans. After grants and PennVest loan, the estimated Year 1 net program cost coverage requirement is $2,600,000. sf = square feet What is the impact of pay-as-you-go vs. debt financing? Rate Impacts for Different Levels of Service, with Pay-Go Financing Pay-as-you-go implies that you spend only the money on hand, generated by the stormwater management fee. The SWMF rate model evaluated the program costs based on three LOS alternatives identified in Policy Paper No.1. 5 The recommended rate scenario is Rate Scenario 2 Medium Level of Service, which represents the estimated program needs to satisfy MS4 permit and other regulatory requirements. The capital requirements represent the largest expense item and are used to pay for projects contemplated in the GI Plan such as green streets, green parks, downspout disconnections (cisterns or rain barrels), etc. The use of grants and loans in early years offset the CIP cost and help to keep the SWMF low. These grants and loans that have been awarded to the City because the GI Plan is innovative and the USEPA s goal is for all municipalities to implement GI projects. Therefore, the City does not expect these sources of cost recovery to be available in the future. However, in years 4 and 5 the capital requirements increase significantly because currently available grants/loans are exhausted, which affects the SWMF. To fund capital requirements in years 4 and 5 without further increases in the SWMF, additional grants/loans would need to be secured or the use of debt financing needs to be considered. Figure 2-3 illustrates the program costs based on the three LOS scenarios evaluated as part of this study. The program costs required to be recovered by the fee in the first 3 years are low compared to years 4 and 5 because the use of grants and loans help reduce the costs that would be covered by the SWMF. Figure 2-4 illustrates the SWMF ($ per 1,000 sf) to cover the program costs identified in Figure 2-3 and to cover the program costs for each rate scenario, assuming pay-go CIP cost recovery. The significant increase in years 4 and 5 are attributable to the increase in capital requirements after currently available grants/loans are used to fund other capital projects. Table 2-3 provides the financial summary for Rate Scenario 2 Medium Level of Service. Table 2-3 summarizes the SWMF rate and annual SWMF per property by tier for Rate Scenario 2 Medium Level of Service Rate Impacts for Different Levels of Service, with Debt Financing Figure 2-5 illustrates, for Rate Scenario 2 Medium Level of Service, the sensitivity of using pay-go versus debt financing for the capital requirements starting in Year 4. The use of debt financing helps keep rates low and spreads the costs over time to current and future rate payers. Additionally, as is the City s current practice for all 5 Details of program costs are documented in Technical Memorandum No. 1 (CH2M HILL, August 2012). Details of the rate model assumptions are documented in Technical Memorandum No. 2 (Ch2M HILL, September 2012). ES BSS 2-5
28 IMPERVIOUS AREA FEE POLICY OPTIONS AND RECOMMENDATIONS capital expenditures, future rate payers are sharing the cost of the investment made today for assets that last for many decades into the future Rate Structure Recommendations The GIAC recommends Rate Scenario 2 Medium Level of Service, which represents the estimated program needs to satisfy MS4 permit and other regulatory requirements, and to avoid further enforcement action including consent orders and fines. The following financing options are recommended: Use tiering of all properties, with four tiers based on the IA ranges shown in Table 2-3 and Table 2-4; and Use the SWMF to leverage bonds, so that debt financing can be used to keep rates lower over the long term and spread costs over time to current and future rate payers. FIGURE 2-3 Comparison of Program Costs Covered by the SWMF by Rate Scenario (Pay-Go Financing) Millions $11 $10 $9 $8 $7 $6 $5 $4 Low Medium High $3 $2 $1 $ Year 2-6 ES BSS
29 SECTION 2 POLICY OPTIONS AND RECOMMENDATIONS FIGURE 2-4 Comparison of SWMF by Rate Scenario (Pay-Go Financing) $160 $ $140 $ $120 IASF ($/1,000 sf) $100 $80 $60 $60.89 $60.89 $71.00 $79.47 $96.32 Low Medium High $40 $30.96 $30.96 $30.96 $20 $19.22 $19.22 $19.22 $19.22 $19.22 $ Year FIGURE 2-5 Comparison of SWMF Rates with Pay-Go Financing to Debt Financing (Bonds) for Medium Level of Service $160 $140 $120 Annual Rate ($/1,000 sf) $100 $80 $60 $79.47 $96.32 $40 $30.96 $30.96 $30.96 $43.65 $44.57 $20 $30.96 $30.96 $30.96 Bonds Pay Go $ Year ES BSS 2-7
30 IMPERVIOUS AREA FEE POLICY OPTIONS AND RECOMMENDATIONS TABLE 2-3 Financial Summary for the Medium Level of Service Rate Scenario (Rate Scenario 2) Year 1 Year 2 Year 3 Year 4 Year 5 Stormwater Utility Fee ($/1,000 sf) $ $30.96 $30.96 $79.47 $96.32 Equivalent Residential Units (=1,000 sf) 83,745 83,787 83,829 83,870 83,912 Operating Revenues SWMF $2,592,738 $2,594,030 $2,595,330 $6,665,180 $8,082,440 less Allowance for Uncollectable Accounts ($259,274) ($259,403) ($259,533) ($666,518) ($808,244) less Credits/Incentives $0 ($210,859) ($210,964) ($541,786) ($656,989) Interest Income $600 $1,900 $2,700 $2,200 $1,400 Total Revenues $2,334,064 $2,125,668 $2,127,533 $5,459,076 $6,618,607 Program Costs Operation And Maintenance $1,289,512 $1,328,197 $1,368,043 $1,409,085 $1,451,357 Non-operating Debt Service $104,700 $104,700 $255,000 $405,200 $405,200 Stormwater CIP (Pay-Go) $295,000 $118,000 $240,000 $4,423,000 $4,739,000 Total Expenditures $1,689,212 $1,550,897 $1,863,043 $6,237,285 $6,595,557 Beginning Balance $0 $644,852 $1,219,623 $1,484,113 $705,904 Ending Balance $644,852 $1,219,623 $1,484,113 $705,904 $728,954 TABLE 2-4 Stormwater Utility Rate and Annual SWMF per Property by Tier Medium Level of Service (Rate Scenario 2) Low Year 1 Year 2 Year 3 Year 4 Year 5 SWMF ($ per 1,000 sf) $30.96 $30.96 $30.96 $79.47 $96.32 Percent Increase 0.0% 0.0% 156.7% 21.2% Annual SWMF per Property Tier 1 (<=1,000 sf) $15.48 $15.48 $15.48 $39.74 $48.16 Tier 2 (>1,000 sf and <=2,000 sf) $46.44 $46.44 $46.44 $ $ Tier 3 (>2,000 sf and <=3,000 sf) $77.40 $77.40 $77.40 $ $ Tier 4 (>3,000) Properties pay based on total impervious area / SWMF. 2.3 How can the City incentivize action? Rebates/Grants and Credits Many stormwater utilities that assess fees based on IA provide incentives to properties with onsite stormwater facilities to treat stormwater runoff. As discussed in the GI Plan, there is not enough public property to manage enough stormwater to significantly reduce or eliminate CSOs, and therefore the City needs private property 2-8 ES BSS
31 SECTION 2 POLICY OPTIONS AND RECOMMENDATIONS owners to do their fair share in helping to reduce overflows. Two types of incentive programs typically are considered: Rebates or grants, and Credits Appendix A contains the policy paper that was prepared and reviewed by the GIAC on incentive program options. Key issues and recommendations are summarized below Rebates or Grants The purpose of grants or rebates is to provide a one-time subsidy to reduce construction costs associated with installing stormwater facilities on private property. This sort of program is fairly uncommon, but is growing in popularity among jurisdictions with CSO and MS4 permit mandates. Examples include Philadelphia s Stormwater Management Incentives Program - Business Improvement District Grant; Montgomery County, Maryland s RainScapes program; and Washington, DC s RiverSmart Homes. For example, RainScapes provides grants of up to $1,200 for residential property and up to $5,000 for commercial, multi-family, or institutional property, depending on project type. Eligible practices include but are not limited to rain gardens, tree canopy, permeable pavers, green roofs, and rain barrels. RainScapes is cost recovered by the County s stormwater utility. Similarly, DC s RiverSmart Homes program funds up to $1,200 for similar project types, but is restricted to private residences Credits The purpose of credits is to help property owners reduce their annual stormwater fee, thus providing an incentive for implementing stormwater management facilities. Historically, credits have been offered only to commercial properties, but recent trends show that single-family properties are now eligible for certain types of credits. The credit amount that a property can receive varies among stormwater utilities. Most utilities provide only a partial credit, while others provide a full credit. The rationale for not providing a 100-percent credit, even if all stormwater is managed onsite, is that property owners should contribute to services provided by the City that are beyond their property lines, such as citywide permit compliance, road drainage maintenance, and GI improvements on public lands. The criteria for determining the credit level typically are based on the type of facility and percent of IA treated (usually just the onsite IA). Some utilities provide credits to property owners who do not have qualifying facilities but agree to participate in public education or outreach programs. Table 2-5 provides a summary of credit programs around the United States. Table 2-6 provides a list of potential credit amounts by stormwater project type being considered by Montgomery County, Maryland Incentive Program Recommendations Because the GI Plan requires a significant proportion of new capital facilities to be built on private property, the GIAC recommends providing an incentive program cost recovered by the SWMF. This would include some combination of rebates for facility construction, as well as credits to encourage maintenance of those facilities. Credits have the added benefit of giving property owners some mechanism for reducing the financial impact of the SWMF. A property owner using grants to help pay for GI improvements will also be eligible to receive credits, provided they apply separately for credits. Application for credits typically entails agreeing to maintain the facility and allowing the City to perform inspections. Overtime, cost of the improvements borne by the property owner could be recouped through the reduction in the quarterly fee from the credits. An allowance was included for the cost a credit program in the estimated SWMF scenarios. ES BSS 2-9
32 IMPERVIOUS AREA FEE POLICY OPTIONS AND RECOMMENDATIONS TABLE 2-5 Example Credit Programs Municipality Single Family Residential? Non-residential and Multi-family residential? Types of Credits Maximum Credit Allowed Chesapeake, VA No Yes Prince William County, VA No Yes Application of onsite BMPs that provide water quality or water quantity benefits.. Control stormwater onsite; non-structural program participation Water quality (20%) Water quantity (20%) Maximum of 40% 50% for structural control 30% for non-structural controls compiled as follows: 30% for nutrient mgmt. plan 30% for public education program 10% for attending workshop 10% site cleanup Virginia Beach, VA No Yes Manage stormwater quality onsite 30% for management to pre-developed condition 20% for management to Chesapeake Bay standards Portland, OR Yes Yes Low-impact development (ecoroof, rainbarrel, rain garden) Tree canopy Downspout disconnect Stormwater quality Stormwater quantity Stormwater planters 35% of total stormwater charges Credit for tree canopy based on number of trees greater than 15 feet. Philadelphia, PA No Yes, must have >500 sf impervious area IA Gross area NPDES credit Application and renewal fee apply Except monthly minimum charge. Up to 100% of stormwater charge for IA and gross area credit 7% for NPDES credit NEORSD, Cleveland, OH Yes Yes Stormwater quality credit (25%) Stormwater quantity credit (50%) Education credit (25%) Up to 75% Up to 100% for public/private schools 2-10 ES BSS
33 SECTION 2 POLICY OPTIONS AND RECOMMENDATIONS TABLE 2-6 Example of Stormwater Facility Classifications for Credits (Montgomery County, MD) Pretreatment 10% credit Water Quality (WQ) 25% credit Water Quantity (QN) 25% credit Both (B) 50% credit Green Infrastructure (lowimpact development, ESD, etc.) 25% credit Programmatic 15% credit (regardless of IA treated) AQSW aquaswirl AQFIL aquafilter PDQN Dry Pond DS dry swale RG rain garden Adopt-a-Stream BAYSAV baysaver BSFS baysaver flow splitter BF Bayfilter INF Infiltration Trench PDQNED Dry Pond with extended detention UG underground storage facility BR bioretention PP permeable pavement Adopt-a-Road BRQN bioretention Rain barrel Integrated Pest Management SEP oil/grit separator INFIL Infiltrator UGINF underground storage facility with infiltration BS bioswale Cistern *Other DEP-approved program participation SNOUT INFU Infiltration Trench, buried by design INFQN infiltration with quality and quantity control Micro bioretention Industrial Permit STC stormceptor PDIB Infiltration basin INFUQN underground infiltration with quality and quantity control Submerged gravel wetlands V2B1 PSF Peat sand filter PDQNSF dry pond with sand filter base Landscape Infiltration VORTEC - vortechnics SC stormchamber PDIBQN infiltration basin with quantity control Infiltration Berm SEPSF separator sand filter PDWD constructed wetland Swales SF surface sand filter PDWDED constructed wetland with extended detention Green Roofs SFU underground sand filter PDWT Wet pond Reinforced Turf STFIL storm filter PDWTED wet pond with extended detention SFQN surface sand filter with quantity control TB tree box Disconnection Sheet Flow Dry well ES BSS 2-11
34 IMPERVIOUS AREA FEE POLICY OPTIONS AND RECOMMENDATIONS 2.4 How will the City administer billing? Billing System Options Three billing methods are commonly used to collect stormwater utility charges around the country: real estate tax bills, water/sewer utility bills, or separate billing systems. Selection of a billing system is unique to the locality establishing a stormwater utility. For example, the water/sewer bill may only cover part of the stormwater utility service area, while the property tax database provides complete coverage. Water/sewer bills are not normally sent to parking lots and vacant properties with no water/sewer connection. Similarly, property tax bills are not usually sent to owners of tax-exempt properties. It may be the case that the stormwater utility service area is not covered by either database system. The selection of the billing method should be cost-effective, timely, and capture all affected properties. Appendix A presents the policy paper that was developed and reviewed with the GIAC on billing options. The City administration is currently recommending adding a new line item for the SWMF to the water and sewer bill that is issued quarterly or monthly based on the rate class for the property. Properties that currently do not get a water/sewer bill will be added to the list getting bills for the SWMF, with their water/sewer line item showing a $0 charge. 2.5 How will the City administer appeals? All stormwater utility charges typically provide a mechanism for rate payers to appeal their bills and allow them the ability to correct erroneous information. However, what can be appealed, when, and the process for submitting and reviewing appeals need to be clearly defined to make the fee defensible and manageable. Appendix A presents the policy paper that was developed and reviewed with the GIAC on appeals options. What can be appealed typically is limited to the following: IA calculation and tier assignment, Determination of exemption status (for example, if the enabling ordinance exempts local and state governments), and Credit calculation, assuming a property owner applied for a credit. Appeals are typically submitted only once per year, well in advance of the billing cycle (60-90 days), but with a quarterly billing cycle this could be done more frequently. The City administration would prefer that appeals be allowed only once per year to minimize administrative costs. The City administration is recommending that a deadline for appeals be set 6 months before the first bills go out in a given fiscal year. Assuming the first bills go out July 1, for example, then appeals would be due no later than January 1 of each calendar year ES BSS
35 Appendix A GIAC Participants and Policy Papers
36
37 Green Infrastructure Advisory Committee Participants
38
39 Green Infrastructure Advisory Committee Member List Peter Barber Two Dudes Painting Company Cathy Blantz School District of Lancaster Janine Boyle PA Department of Environmental Protection Jay Braund PA Department of Environmental Protection Beth Detz Lancaster City Housing Authority Michael Domin Lancaster County Planning Commission Frank Polan General Growth Properties, Inc. Lydia Pease City Resident Chris Peiffer PA Department of Conservation and Natural Resources Keith Orris Lancaster General Hospital Marshall Snively James Street Improvement District Jake Romig Alliance for the Chesapeake Bay Matt Earhart Chesapeake Bay Foundation Lamonte Garber Chesapeake Bay Foundation Mary Gattis Lancaster County Planning Commission Tom Hassler City Resident Paula Jackson City of Lancaster Charlotte Katzenmoyer City of Lancaster Craig Lenhard City of Lancaster Brian Marengo CH2M HILL Tim Roschel City Councilman Robert Ruth City of Lancaster Robert Schellhamer Lancaster City Housing Authority Fritz Schroeder LIVE Green/Lancaster County Conservancy Danene Sorace LIVE Green/Lancaster County Conservancy Laurens van der Tak CH2M HILL Bill Worley First Reformed Church Lori Yeich PA Department of Conservation and Natural Resources Randy Patterson City of Lancaster
40
41 Stormwater Utility Program Needs Policy Paper
42
43 Stormwater Utility Program Needs Policy Development Summary Lancaster, PA Policy Paper No. 1 Date Prepared: April 25, 2012 Date Revised: May 9, 2012 Date Final: September 13, 2012 Policy Issue: What is funded by the proposed Stormwater Utility? Overview There are several types of funding sources, which may include one or a combination of ad valorem taxes, grants, loans, and/or user charges. A stormwater utility is a funding mechanism that is dedicated for a variety of stormwater program elements, which may include conveyance, maintenance, and capital improvements. Currently, the City s General Fund and Sewer Fund are the source of funding for stormwater programs. In order to consider funding source, it is important to define the costs and level of service (LOS) for stormwater programs. The purpose of this policy paper is to define which program elements (Operations and Maintenance [O&M] and Capital Improvement Program [CIP]) should be funded by the proposed stormwater utility fee pursuant to Pennsylvania law. A stormwater utility can fund O&M and/or capital projects. O&M can include administrative costs, inspection/maintenance costs, billing/collection costs, and other stormwater-related functions. Capital project costs can include rehabilitation and replacement of stormwater facilities. Program elements that could be funded by the stormwater utility fee include the following: Capital Improvement Projects Green Infrastructure (GI) Program (Tables 5.9 and 5.10 from GI plan) Combined sewer overflow (CSO) / wet-weather-related projects from wastewater CIP (funding source = Sewer Fund) Catch Basin Rehabilitation and Replacement Storm Drain Rehabilitation and Replacement Stormwater / Drainage Master Plan CIP, for flood relief (not funded) Program Administration Billing and Collection Incentive/Credit Program (costs of administering program) Inspections and Maintenance GI Dry and Wet Ponds (inspection only, privately owned so not currently maintained by the City) Street Sweeping Catch Basin Drainage Ditch CSO / wet-weather facilities (funded by Sewer Fund) o Diversion Chambers o Junction Chambers o Manholes o Outfalls o Pressure Junction o Pump Station o Force Main Sewer o Gravity Main Sewer o Flow Monitoring National Pollutant Discharge Elimination System (NPDES) Phase II Implementation (Municipal Separate Storm Sewer System [MS4] Permit) Public Education Public Participation / Involvement Illicit Discharge Detection / Elimination Construction Site Runoff Control Post-Construction Stormwater Management Pollution Prevention Water Quality Monitoring (Total Maximum Daily Load compliance) Floodplain Management (not funded) Wastewater Treatment (funding source = Sewer Fund) Exhibits 1a- e provide summary tables of the LOS assumptions. Exhibit 2 shows the estimated maintenance costs by LOS. Exhibits 3a-c summarize the estimated capital costs for the low, medium, and high LOS options. Exhibits 4a-b summarize the estimated capital costs for the high LOS option. Exhibits 5a-b summarize overall capital and maintenance costs for three levels of service options. PAGE 1 OF 13
44 Stormwater Utility Program Needs Policy Development Summary Lancaster, PA Policy Paper No. 1 Date Prepared: April 25, 2012 Date Revised: May 9, 2012 Date Final: September 13, 2012 Policy Issue: What is funded by the proposed Stormwater Utility? Policy Options LOS Alternative 1 Current LOS and MS4 Permit Implementation LOS Alternative 2 GI Plan Implementation (public only), MS4 Permit Implementation, Increased Maintenance and Customer Service LOS Alternative 3 GI Plan Implementation, MS4 Permit Implementation, High Level of Maintenance and Customer Service Issues, Concerns, Benefits LOS Alternative 3 would provide funding for a comprehensive program that includes preventive and corrective maintenance, inspection of facilities, additional CIP projects, and drainage master planning. However, the rate per equivalent residential unit may not be politically acceptable. LOS Alternative 1 provides only the bare-bones program with very little advancement above the current program. The fee is nominal, but the services are not comprehensive. LOS Alternative 2 provides advancement above the current program, including implementation of GI Plan elements on public property. Related policy issues include debt financing of CIP and payment of existing debt service for current CIP. A separate policy decision will be needed on whether existing program elements funded by the Sewer Fund will be funded by an impervious area fee, or whether new program costs due to regulatory drivers would be paid by the fee. Advisory Committee Comments What is funded by the Program? The City clarified that currently the potable water consumption is used to apportion costs for all sewer-related City services, including stormwater management. Question: is the user fee going to just reapportion existing costs, or will it also pay for the increase in program costs due to new elements and LOS increases? Response: it was clarified that this is a key decision that needs to be made. But the purpose of considering low, medium, and high program costs in developing fees is to bracket likely choices in terms of what programs could be funded by the fee. It was indicated that there is an inequity in using the current water/sewer fee system (based on water usage) to pay for stormwater/cso issues, that are based on volume of runoff from each property. It was recommended to add flood relief to clarify the result of a stormwater/drainage master plan on the CIP list The City indicated that the CSO and treatment facility cost would remain in Sewer Fund Illicit discharge detection and elimination and cross-connections were discussed as a cost due to the need to inspect the system to locate cross-connected laterals, illegal connections, and sources of wet-weather flow into the sanitary sewer system, including sump pumps. It was suggested that we consider including a provision for expenses that we may not be thinking of (such as nutrient trading). The City clarified the role of the budget for nutrient credit purchase/sale in the sewer fund that provides the City with a cost benefit for its treatment of nutrients at the advanced wastewater treatment plant beyond the level required in its current allocation. PAGE 2 OF 13
45 Stormwater Utility Program Needs Policy Development Summary Lancaster, PA Policy Paper No. 1 Date Prepared: April 25, 2012 Date Revised: May 9, 2012 Date Final: September 13, 2012 Policy Issue: What is funded by the proposed Stormwater Utility? What LOS scenarios should be included in rate structure analysis? It was questioned whether the LOS would result in U.S. Environmental Protection Agency (EPA) acceptance of programs. Response: EPA rarely goes on record approving programs, so there s no certainty in what LOS is acceptable to meet EPA goals. The regulatory drivers for the program were discussed, including the uncertainties imposed by the EPA administrative order, the Total Maximum Daily Load, and future changes that are likely to occur in the City s MS4 permit. It was suggested to have an LOS between 2 and 3 to provide more granularity in options for LOS and to help clarify the understanding of the potential acceptability of the various Program components. It was suggested that LOS1 might be worth taking off the table. However, others pointed out that LOS1 illustrates the concept of the equity principle and is important to keep. The City indicated that the permit requirement is to clean once a year. Action - Fix LOS for street sweeping (CH2M HILL). Need to clarify the pollutant removal benefits of street sweeping (City has provided estimates for the Watershed Implementation Plan) It was noted that outreach could help reduce investments in ongoing street sweeping and inlet cleaning. Action - Need to include more intuitive metrics (CH2M HILL). Consultant Recommendation The consultant recommended LOS2 or greater. Decision/Action The GIAC recommended that dedicated funding options be investigated to provide at least the medium level of service, with a goal of moving towards the higher level of service. It was generally agreed that the current low level of service would not be adequate to meet regulatory requirements. PAGE 3 OF 13
46 EXHIBIT 1A Catch Basin (n = 1,910) LOS 1 LOS 2 LOS 3 Activity Number/ Linear feet Frequency Number/ Linear feet Frequency Number/ Linear feet Frequency Inlet Cleaning 2,747 1x per year 2,747 1x per year 2,747 2x per year Rehabilitation / Replacement 72 Per year 72 Per year 72 Per year EXHIBIT 1B Street Sweeping (~300 miles) LOS 1 LOS 2 (current funding) LOS 3 Activity Frequency Frequency Frequency Routes per month 2 per month 3 per month Development Route 2 per month 2 per month 3 per month Alleys 2 per month 2 per month 3 per month Park City Route 2 per month 2 per month 3 per month 5th Week Route 2 per month 2 per month 3 per month Downtown District 5 per week 5 per week 5 per week EXHIBIT 1C Storm Sewer (79 mi MS4, 26 mi CSS) LOS 1 LOS 2 LOS 3 Maintenance Activity Number/ Linear feet Frequency Number/ Linear feet Frequency Number/ Linear feet Frequency Current Funding Level Rehabilitation None N/A 80% 100 yrs 80% 75 yrs Replacement None N/A 20% 100 yrs 20% 75 yrs CSS = combined sewer system mi - miles PAGE 4 OF 13
47 EXHIBIT 1D GI Infrastructure (O&M) LOS 1 LOS 2 LOS 3 Vegetated Roof Inspection Activity Number/ Linear feet Frequency Number/ Linear feet Frequency Number/ Linear feet Frequency Maintenance 30,300 sf Per year 30,300 sf Per year Infiltration Trenches w/ Pretreatment Inlets Inspection Maintenance 115 ea Per year 115 ea Per year Porous Pavement Systems Inspection Maintenance 142,900 sf Per year 142,900 sf Per year Bioretention/Rain Gardens Inspection Maintenance 66,000 sf Per year 66,000 sf Per year Tree Plantings/Trenches Cisterns Inspection Maintenance 1,250 ea Per year 1,250 ea Per year Inspection Maintenance 5 ea Per year 5 ea Per year PAGE 5 OF 13
48 EXHIBIT 1E MS4 Implementation (6 minimum controls) LOS 1 LOS 2 LOS 3 Activity Number/ Linear feet Frequency Number/ Linear feet Frequency Number/ Linear feet Frequency Public Education Public Participation / Involvement Illicit Discharge Detection / Elimination Construction Site Runoff Control Post-Construction Stormwater Management Pollution Prevention PAGE 6 OF 13
49 EXHIBIT 2 Estimated Annual Inspection/Maintenance Costs Maintenance Low Medium* High* Green Infrastructure Green Streets $29,000 $36,250 Park Improvements / Greening $24,000 $30,000 Disconnection, Porous Pavement $16,000 $20,000 Porous Pavement, Bioretention $3,000 $3,750 Vegetated Roofs / Disconnection $10,000 $12,500 Disconnection/Rain Gardens Enhanced Tree Planting $50,000 $62,500 Green Schools $30,000 $37,500 Sub-total Green Infrastructure $162,000 $202,500 Dry and Wet Ponds (inspection only) $2,300 $2,300 $2,300 Street Sweeping $168,800 $168,800 $234,100 Catch Basin $201,000 $201,000 $402,000 Storm Drainage n/a n/a n/a MS4 Implementation Public Education $15,692 $92,000 $136,000 Public Participation / Involvement $6,462 $15,000 $47,000 Illicit Discharge Detection / Elimination $53,800 $53,800 $53,800 Construction Site Runoff Control [1] $52,600 $52,600 $52,600 Post-Construction Stormwater Management $17,800 $17,800 $17,800 Pollution Prevention $305,212 $305,212 $305,212 Program Administration Billing and Collection $90,000 $90,000 $90,000 Incentive/Credit Program n/a $77,000 $154,000 NPDES permit $29,000 $29,000 $29,000 Plan Review $23,000 $23,000 $23,000 *GI Plan annual maintenance costs are for the fifth year of GI implementation. [1] This function is provided by the Lancaster County Conservation District at no cost to the City of Lancaster, and is paid for through plan review fees assessed by the Conservation District. PAGE 7 OF 13
50 EXHIBIT 3A Capital Costs (Low LOS) Year 1 Year 2 Year 3 Year 4 Year 5 Green Infrastructure Green Streets $132,600 $132,600 $132,600 $132,600 $132,600 Park Improvements / Greening $50,000 $50,000 $50,000 $50,000 $50,000 Disconnection, Porous Pavement $58,200 $58,200 $58,200 $58,200 $58,200 Porous Pavement, Bioretention $70,200 $70,200 $70,200 $70,200 $70,200 Vegetated Roofs / Disconnection $93,600 $93,600 $93,600 $93,600 $93,600 Disconnection/Rain Gardens $131,000 $131,000 $131,000 $131,000 $131,000 Enhanced Tree Planting $143,800 $143,800 $143,800 $143,800 $143,800 Green Schools $51,200 $51,200 $51,200 $51,200 $51,200 Storm Drainage MS4 Rehabilitation Replacement Information Management CSS Rehabilitation Replacement Information Management Catch Basin Rehabilitation $82,000 $82,000 $82,000 $82,000 $82,000 Replacement $82,000 $82,000 $82,000 $82,000 $82,000 Total $894,600 $894,600 $894,600 $894,600 $894,600 PAGE 8 OF 13
51 EXHIBIT 3B Capital Costs (Medium LOS) Year 1 Year 2 Year 3 Year 4 Year 5 Green Infrastructure Green Streets $530,000 $530,000 $530,000 $530,000 $530,000 Park Improvements / Greening $199,800 $199,800 $199,800 $199,800 $199,800 Disconnection, Porous Pavement $232,400 $232,400 $232,400 $232,400 $232,400 Porous Pavement, Bioretention $28,100 $28,100 $28,100 $28,100 $28,100 Vegetated Roofs / Disconnection $138,800 $138,800 $138,800 $138,800 $138,800 Disconnection/Rain Gardens $0 $0 $0 $0 $0 Enhanced Tree Planting $575,000 $575,000 $575,000 $575,000 $575,000 Green Schools $205,000 $205,000 $205,000 $205,000 $205,000 Storm Drainage MS4 Rehabilitation $667,000 $667,000 $667,000 $667,000 $667,000 Replacement $417,000 $417,000 $417,000 $417,000 $417,000 Information Management $2,000 $2,000 $2,000 $2,000 $2,000 CSS Rehabilitation $220,000 $220,000 $220,000 $220,000 $220,000 Replacement $137,000 $137,000 $137,000 $137,000 $137,000 Information Management $1,000 $1,000 $1,000 $1,000 $1,000 Catch Basin Rehabilitation $82,000 $82,000 $82,000 $82,000 $82,000 Replacement $82,000 $82,000 $82,000 $82,000 $82,000 Total $3,517,100 $3,517,100 $3,517,100 $3,517,100 $3,517,100 PAGE 9 OF 13
52 EXHIBIT 3C Estimated Capital Costs for Medium LOS $4,000,000 $3,500,000 $3,000,000 $2,500,000 $2,000,000 $1,500,000 Catch Basin Storm Drainage Green Infrastructure $1,000,000 $500,000 $ Year PAGE 10 OF 13
53 EXHIBIT 4A Capital Costs (High LOS) Year 1 Year 2 Year 3 Year 4 Year 5 Green Infrastructure Green Streets $662,600 $662,600 $662,600 $662,600 $662,600 Park Improvements / Greening $249,800 $249,800 $249,800 $249,800 $249,800 Disconnection, Porous Pavement $290,600 $290,600 $290,600 $290,600 $290,600 Porous Pavement, Bioretention $351,200 $351,200 $351,200 $351,200 $351,200 Vegetated Roofs / Disconnection $468,000 $468,000 $468,000 $468,000 $468,000 Disconnection/Rain Gardens $655,200 $655,200 $655,200 $655,200 $655,200 Enhanced Tree Planting $718,800 $718,800 $718,800 $718,800 $718,800 Green Schools $256,200 $256,200 $256,200 $256,200 $256,200 Storm Drainage MS4 Rehabilitation $890,000 $890,000 $890,000 $890,000 $890,000 Replacement $556,000 $556,000 $556,000 $556,000 $556,000 Information Management $3,000 $3,000 $3,000 $3,000 $3,000 CSS Rehabilitation $293,000 $293,000 $293,000 $293,000 $293,000 Replacement $183,000 $183,000 $183,000 $183,000 $183,000 Information Management $1,000 $1,000 $1,000 $1,000 $1,000 Catch Basin Rehabilitation $82,000 $82,000 $82,000 $82,000 $82,000 Replacement $82,000 $82,000 $82,000 $82,000 $82,000 Total $5,637,400 $5,637,400 $5,637,400 $5,637,400 $5,637,400 PAGE 11 OF 13
54 EXHIBIT 4B Estimated Capital Costs for High LOS $7,000,000 $6,000,000 $5,000,000 $4,000,000 $3,000,000 Catch Basin Storm Drainage Green Infrastructure $2,000,000 $1,000,000 $ Year EXHIBIT 5A Estimated Annual Costs Low Medium High Operating and Maintenance Green Infrastructure* n/a $162,000 $202,500 Dry and Wet Ponds (inspection $2,300 $2,300 $2,300 Street Sweeping $168,800 $168,800 $234,100 Catch Basin $201,000 $201,000 $402,000 Storm Drainage n/a n/a n/a MS4 Implementation $451,566 $536,412 $612,412 Program Administration $142,000 $219,000 $296,000 Capital Costs Green Infrastructure $730,600 $1,909,100 $3,652,400 Storm Drainage n/a $1,444,000 $1,926,000 Catch Basin $164,000 $164,000 $164,000 Total $1,860,266 $4,806,612 $7,491,712 *GI Plan annual maintenance costs are for the fifth year of GI implementation. PAGE 12 OF 13
55 EXHIBIT 5B Total Estimate Annual Costs $8,000,000 $7,000,000 $6,000,000 $5,000,000 $4,000,000 High Medium Low $3,000,000 $2,000,000 $1,000,000 $ Year PAGE 13 OF 13
56
57 Stormwater Utility Cost Recovery Structure and Policy Paper
58
59 Stormwater Utility Rate Structure and Rates Policy Development Summary Lancaster, PA Policy Paper No. 2 Date Prepared: May 10, 2012 Date Revised: June 5, 2012 Date Final: September 13, 2012 Policy Issue: What type of rate structure should be used for the Stormwater Utility? What is the likely range for the initial rate for the stormwater utility fee? The rate structure for most stormwater utilities is set up so that single-family residential (SFR) properties pay 1 ERU (Equivalent Residential Unit) and multi-family or non-residential properties pay based on actual IA. The ERU is calculated through statistical analysis of the imperviousness of single-family residential parcels. The number of ERUs (billing units) for multi-family or non-residential properties is based on total IA divided by the ERU or base unit. In order to help with equity and fairness of the stormwater charge, municipalities are now starting to develop and implement tiered rate structures that break properties into tiers based on amount of IA. This could be applied for single-family properties or all properties. For example, there may be a statistical justification to break SFR properties into several categories (small, medium, large). Or, a tiered rate structure could be applied to all properties. The total number of billing units, based on the rate structure, is then used to determine the rate. That is, the rate is set to recover total program costs, debt service, equity funded CIP, reserves (revenue requirements). The rate could be expressed as $/ERU or $/1,000 sf. Policy Options Categories Based on Property Class For this option, there would be multiple categories based on property class. For this option, SFR properties would be charged 1 ERU. All other property classes would be charged based on total IA. This method is perhaps the simplest and requires minimal analysis of the residential land use category. This method also has the lowest cost for billing system database implementation and maintenance. However, using 1 ERU for SFR properties is less equitable than ERU categories based size, or tiers. Categories Based on Size For this option, there would be multiple categories, such as small, medium, and large properties. These categories could also be applied to all properties (commercial, institutional, industrial, faith and non-profit properties) if they fall within the IA tier ranges. Properties with IAs greater than the largest tier would pay based on actual IA. Two options were considered based on the size of all properties: 4 tiers 7 tiers Issues, Concerns, Benefits A primary issue or concern involves equity. Does a smaller single family property (which contributes less stormwater) pay the same as a larger single family property (which contributes more stormwater), while each receive the same benefit(s) from the citywide program? The benefits of breaking SFR properties into several categories or tiers (i.e., more precision) needs to be weighed against the implementation costs of developing and maintaining a tiered rate structure. This would require additional analysis for billing system implementation and maintenance of IA data. However, it more equitably links fees to IA size. The more tiers, the higher administrative cost and the greater likelihood of categorizing properties into the wrong tier, and therefore a possibly higher number of appeals. Another related consideration is whether gathering and maintaining data for more-detailed classification (more tiers) will result in noticeable differences in charges to customers. Based on existing geographic information system data and the property tax database, Figure 1 shows the distribution of IA for SFR properties based on available IA data 1. The median value is 1,165 sf and the average is 1,368 sf, with a 95 percent confidence of 16 sf. For purpose of this analysis, the rate is expressed as $/1,000 sf. 1 IAs were adjusted based on review of 199 properties from 2008 aerial photos and 2011 parcel boundaries to estimate missing or incorrectly digitized IA mapping, and a median deviation was applied to adjust the IA of each property, by class: residential, multi-family, commercial, industrial, institutional, government, or parking lot. PAGE 1 OF 8
60 Stormwater Utility Rate Structure and Rates Policy Development Summary Lancaster, PA Policy Paper No. 2 Date Prepared: May 10, 2012 Date Revised: June 5, 2012 Date Final: September 13, 2012 Policy Issue: What type of rate structure should be used for the Stormwater Utility? What is the likely range for the initial rate for the stormwater utility fee? Table 1 provides a tabular summary of number of properties, IA, and ERUs for three rate structures. Figure 1 shows the frequency distribution of IA for SFR properties. Figure 2 shows the frequency distribution of IA for all properties based on a rate structure with four tiers. Figure 3 shows the distribution for all properties based on a rate structure with 7 tiers. Figure 4 compares number of properties and ERUs by property class. This helps illustrate the equity and fairness of basing the stormwater charge on a measure of imperviousness. A tiered rate structure can help maintain equity for properties with IAs of less than 3,000 sf. Properties with IAs greater than 3,000 sf pay based on total IA. For illustrative purposes, Tables 2 to 4 show the estimated stormwater charges for three rate structures, on both an annual or a quarterly basis. The rates assume a medium LOS program of $4,800,000. Rates can increase over time depending on the operation and maintenance programs, CIP, availability of grants/loans, debt service, credits/incentives, and collection rate. Figure 5 illustrates how rates could increase over time assuming the use of grants/loans, pay-go CIP, and repayment of Penn Vest debt service (loan to fund CIP). The low LOS does not assume grants/loans or debt service because the CIP is minimal compared to the medium and high LOS. Consultant Recommendation Based on the analyses presented, it is evident that justification for multiple tiers exists. However, although the equity issue could be used to justify a tiered rate structure, these considerations need to be balanced against considerations of simplicity and implementation/ database maintenance costs. More tiers are recommended for equity reasons, but only if the quality of the IA data is high enough to that properties can be categorized with confidence into more bins, i.e., smaller IA ranges. Current data probably do not justify that approach, but the City expects to get new IA data based on a 2012 aerial flyover. Assuming these data are captured at a high resolution, the seven-tier option is recommended, applied to all property types. PAGE 2 OF 8
61 Stormwater Utility Rate Structure and Rates Policy Development Summary Lancaster, PA Policy Paper No. 2 Date Prepared: May 10, 2012 Date Revised: June 5, 2012 Date Final: September 13, 2012 Policy Issue: What type of rate structure should be used for the Stormwater Utility? What is the likely range for the initial rate for the stormwater utility fee? Decision/Action Reviewed Rate Structure Options and Preliminary Rates Property owners pay based on their contribution to stormwater runoff as determined by a measure of IA. There is agreement that the assessed value of a property does not provide equity in computing the stormwater charge. To evaluate rate structure options, a statistical analysis of IA was conducted to obtain the median and average IA for SFR properties. The typical measure of IA is the ERU, and is based on the median or average IA of SFR properties. A recent trend among stormwater utilities is to implement a tiered rate structure based on IA. The tiers can be applied to SFR properties only or to all properties. A proposed rate structure with four tiers was presented. The number of tiers included depends on characteristics of the municipality. For the City of Lancaster, development can be characterized as urban, with many mixed use buildings and attached row houses, and public/private alleys. Can a property owner have a stormwater charge of $0? Some municipalities offer 100-percent credit for onsite stormwater facilities that a property owner owns and maintains. Most municipalities offer partial credit because of offsite benefits received by property owners that the stormwater utility funds. The City is considering a system of credits that will allow property owners to reduce their stormwater charge based on the amount of IA treated by eligible stormwater facilities. This is the subject of a separate Policy Paper. Based on feedback from the GIAC committee during the May 10 and 31, 2012 meetings: There is agreement that a tiered rate structure will help achieve equity and fairness among all properties. This is true because of small non-residential / mixed-use buildings that would fall within the lower tiers. During the May 31 meeting, the contrast between four- and seven-tier options was presented in terms of rates and numbers of properties in each tier. Most participants preferred the four-tier option because it provided the right balance of equity/fairness based on property size and the increased data administration issues expected with more tiers. However, some participants preferred the greater number of tiers because it increases the connection of property size with rates and therefore adds further incentives for property owners to manage their IAs. There is an agreement that a tiered rate structure that is applied to all properties makes the most sense. Evaluating a tiered rate structure with more than four tiers is recommended. Should Quality of Runoff be Reflected in Rates? Property owners pay based on contribution to stormwater runoff as determined by a measure of IA. Some properties are likely to be sources of pollutants that are picked up and washed away by stormwater runoff. The difficulty is making categorical limits based on property type because not all owners within a property type will be the source of pollutants. Some properties are required to have stormwater permits that identify stormwater facilities that treat stormwater runoff before being discharged into the system or waterway. As part of the City s MS4 permit, there are requirements to help control pollutants PAGE 3 OF 8
62 Stormwater Utility Rate Structure and Rates Policy Development Summary Lancaster, PA Policy Paper No. 2 Date Prepared: May 10, 2012 Date Revised: June 5, 2012 Date Final: September 13, 2012 Policy Issue: What type of rate structure should be used for the Stormwater Utility? What is the likely range for the initial rate for the stormwater utility fee? Need Public Outreach Plan to Prevent Politicizing New Fees There is concern about the proposed IAF becoming politicized because it may be viewed as something the sewer charge already pays for or that this is just another tax. The Public Education Plan can help identify ways to gain support for the fee, with a focus on communicating the value of the program. During the May 31, 2012, GIAC meeting, it was suggested that the outreach program should be specific about what specific enhancements to the program are being added, and what the program would fund that s currently already funded. It was pointed out that, in addition to several new and enhanced elements, the fee will be used to support a number of functions currently supported by the sewer fees and the General Fund, because an IA -based charge is a more equitable way to support the stormwater program. Business owners preferred a phased-in approach for the increases, and at a minimum would like to see advance assessments so that the fee can be budgeted for. It was pointed out that grants and loans in the early years do result in a lower initial projected charge compared with the example bills shown during the meeting, which are based on projected charges in Year 4 when grants and loans are not assumed. These lower initial fees act in a similar fashion to phasing-in fees. PAGE 4 OF 8
63 TABLE 1 Number of Properties and ERUs by Stormwater Class Stormwater Class Estimated Impervious Area (sf) Number of Properties ERUs No Tiers* 4 Tiers 7 Tiers Single-Family 18,337,179 13,407 13,407 18,364 18,280 Multi-Family 9,909,174 1,976 9,909 9,904 9,894 Commercial 29,093,647 1,626 29,094 29,095 29,096 Industrial 15,205, ,205 15,205 15,205 Non-Profit 2,643, ,644 2,643 2,643 Institutional 4,824, ,824 4,825 4,825 Government 3,707, ,707 3,708 3,708 Total 83,720,461 17,353 78,790 83,745 83,651 *Assumes 1 ERU = 1,000 sf and SFR properties charge 1 ERU. FIGURE 1 Impervious Area Distribution of Residential Properties 6,000 5,624 Number of Parcels 5,000 4,000 3,000 2,000 1, ,068 1, Impervious Area (square feet) PAGE 5 OF 8
64 FIGURE 2 Impervious Area Distribution of All Properties and Four-Tier Rate Structure 10,000 Tier 1 Tier 2 Tier 3 Tier 4 100% 9,000 90% 8,000 80% Number of Parcels 7,000 6,000 5,000 4,000 3,000 2,000 1, ,358 4,259 2,591 1, % 60% 50% 40% 30% 20% 10% 0% Cumulative Percent Impervious Area (square feet) Number Parcels Cumulative Percent FIGURE 3 Impervious Area Distribution of All Properties and Four-Tier Rate Structure 10,000 Tier 1 Tier 2 Tier 3 Tier 4 Tier 5 Tier 6 Tier 7 100% 9,000 90% 8,000 80% Number of Parcels 7,000 6,000 5,000 4,000 3,000 2,000 1, ,358 4,259 2,591 1, % 60% 50% 40% 30% 20% 10% 0% Cumulative Percent Impervious Area (square feet) Number Parcels Cumulative Percent PAGE 6 OF 8
65 FIGURE 4 Number of properties and ERUs (No Tier Option) by Stormwater Class Number of Properties Number of ERUs Institutional, 0.25% Industrial, 1% Non- Profit, 1% Commercial 9% Government, 0.32% Government Institutional 5% 6% Non-Profit 3% Single Family 17% Multi-Family 12% Industrial 19% Multi-Family 13% Single Family 77% Commercial 37% Single Family Multi-Family Commercial Industrial Non-Profit Institutional Government TABLE 2 Proposed No Tier Rate Structure Annual Preliminary Stormwater Charge a Quarterly Single Family Residential $61 $15.25 Non-Residential Multi-Family Charge based on total impervious area $61/1,000 sf $15.25/1,000 sf Charge based on total impervious area $61/1,000 sf $15.25/1,000 sf a Assumes medium LOS, a $4,800,000 stormwater program, and 78,790 ERUs. TABLE 3 Proposed Four-Tier Rate Structure a Tier Impervious Area Range Preliminary Stormwater Charge b Annual Quarterly 1 <=1,000 sf $28.50 $ >1,000 sf and <=2,000 sf $85.50 $ >2,000 sf and <=3,000 sf $ $ >3,000 Charge based on total impervious area $57/1,000 sf a Applies to all properties. b Assumes medium LOS, a $4,800,000 stormwater program, and 83,745 ERUs. $14.25/1,000 sf PAGE 7 OF 8
66 TABLE 4 Proposed Seven-Tier Rate Structure a Tier Impervious Area Range Preliminary Stormwater Charge b Annual Quarterly 1 <=500 sf $14.25 $ >500 sf and <=1,000 sf $42.75 $ >1,000 sf and <=1,500 sf $71.25 $ >1,500 sf and <=2,000 sf $99.75 $ >2,000 sf and <=2,500 sf $ $ >2,500 sf and <=3,000 sf $ $ >3,000 Charge based on total impervious area $57/1,000 sf $14.25/1,000 sf a Applies to all properties. b Assumes medium LOS, a $4,800,000 stormwater program, and 83,651 ERUs. FIGURE 5 Revenue Requirements by Level of Service $12,000,000 $10,000,000 $8,000,000 Low $6,000,000 Medium High $4,000,000 $2,000,000 $ Year Assumes: Penn Vest debt service, but no new debt service, Use grants and Penn Vest loan to fund CIP. PAGE 8 OF 8
67 Stormwater User Charge Rate Structure Policy Paper
68
69 Stormwater User Charge Rate Structure Policy Development Summary City of Lancaster, PA Policy Paper No. 3 Date Prepared: May 31, 2012 Date Revised: June 5, 2012 Date Final: September 13, 2012 Policy Issue: For CIP projects with a useful life longer than 20 to 30 years, should the stormwater utility fund the CIP through rates (i.e., pay-as-you-go), or should long-term financing be used? Overview CIP projects are relatively major improvements that the City needs to maintain adequate stormwater management services. In addition, the CIP identifies projects related to the GI Plan. The activities involve development, design, scheduling, funding, permitting, and construction of the projects. These projects may include drainage improvements, storm sewer rehabilitation or replacement, catch basin rehabilitation and replacement, and/or drainage master planning studies. Figure 1 shows the total CIP for the each LOS alternative considered. Figure 2 shows the net effect of using grants / loans to help reduce the capital costs funded by the stormwater utility. For the low LOS, the CIP is entirely funded by grants/loans and assumes no new debt service. For the high LOS, only a portion of the CIP is funded by grants/loans. The difference would need to be funded by the stormwater utility (i.e., pay-go or long-term financing). Assuming grants/loans are used to fund the CIP and the difference is bond-funded starting in Year 4, Figure 3 shows the rate impacts for the medium LOS and compares pay-go versus bond financing. Figure 4 shows the rate impacts for the high LOS and compares pay-go versus bond financing. Bond financing is not assumed for the low LOS. Based on feedback from City, the debt financing assumptions include: General Obligation Bonds (using full faith and credit of the City and pledge of stormwater utility revenues) Next likely bond issue in % interest rate (subject to change based on market conditions) 20year term (subject to change based on average useful life of projects being financed) As a starting point, a target debt service coverage ratio of 1.5 Policy Options Option 1 Do not fund CIP with IAF Option 2 Pay-As-You-Go through IAF rates Option 3 Long term financing and/or Pay-As-You-Go Issues, Concerns, Benefits Other municipalities have issued bonds to finance stormwater capital projects, including Griffin, GA; City of Miami Beach, FL; Clearwater, FL; and Charlotte, NC. Montgomery County, MD is in the process of issuing bonds to fund projects related to its MS4 permit. Based on experience from those locations and others, the following issues have been identified related to debt financing that Lancaster might need to consider: Issues may include overseeing the administration of the debt service payments. As a stormwater utility startup, revenue bonds would not likely be an option because underwriting agencies would require an established track record of stormwater utility fee revenues. Nonetheless, General Obligation bonds could be used, while using the full faith and credit of the City and/or the revenue from the utility fee. Concerns may include the City s fiscal policy regarding debt financing and any established caps on debt financing. The type of bond financing can help avoid affecting a cap on debt financing (i.e., using revenues generated by the IAF). Bond proceeds can be used to finance stormwater projects that meet average useful life requirements. Depending on the tax status of the bonds (tax-exempt vs. taxable), there could be restrictions on the types of projects financed with the bond proceeds (public vs. private facilities). In addition, if bond proceeds are used to finance projects, providing incentives/credits to the property owner could be limited. These issues are subject to review by the Bond Counsel during the bond issuance process. Debt-financing of significant CIP projects could be a benefit because the capital costs are spread out over time. In addition, longterm financing provides a form of fairness in the sense that existing residents do not pay for all of the costs up-front and new resident will share some of the costs. PAGE 1 OF 5
70 Stormwater User Charge Rate Structure Policy Development Summary City of Lancaster, PA Policy Paper No. 3 Date Prepared: May 31, 2012 Date Revised: June 5, Date Final: September 13, 2012 Policy Issue: For CIP projects with a useful life longer than 20 to 30 years, should the stormwater utility fund the CIP through rates (i.e., pay-as-you-go), or should long-term financing be used? Consultant Recommendation Decision/Action Recommend going forward with debt financing. Further discussion and need for public understanding of risks / misconceptions of taking on debt and long-term implications. Need to overcome reluctance to debt. Additional discussion of this issue should be presented, including examples of other comparable communities that have used debt to support their stormwater capital programs. PAGE 2 OF 5
71 FIGURE 1 Summary of Stormwater CIP by Levels of Service Stormwater CIP $7,000,000 $6,000,000 $5,000,000 $4,000,000 Low $3,000,000 Medium High $2,000,000 $1,000,000 $ Year PAGE 3 OF 5
72 FIGURE 2 Summary of Medium Level of Service Stormwater CIP Net of Grants and Loans $80 $70 Rate Impacts for Medium Level of Service: Bond Financing versus Pay-Go $74 $74 $74 $74 $74 $74 $60 Annual Rate ($/1,000 sf) $50 $40 $30 $30 $30 $30 $30 $30 $30 $52 $39 $47 $47 $48 $49 $50 $51 $20 Bonds Pay-Go $10 $ Year PAGE 4 OF 5
73 FIGURE 3 Rate Impact of Using Bond Financing (Net of Grants and Loans) $120 Rate Impacts for High Level of Service: Bond Financing versus Pay-Go $100 $103 $108 $108 $108 $108 $108 $108 Annual Rate ($/1,000 sf) $80 $60 $40 $53 $53 $53 $53 $53 $53 $53 $61 $61 $62 $63 $65 $66 $20 Bonds Pay-Go $ Year PAGE 5 OF 5
74
75 Stormwater Utility SWU Fee Credits / Incentives Policy Paper
76
77 Stormwater Utility Fee Credits / Incentives Policy Development Summary Lancaster, PA Policy Paper No. 5 Date Prepared: May 24, 2012 Date Revised: Date Final: September 17, 2012 Policy Issue: What type of type of credits or incentives should be provided to property owners for on-site facilities or green infrastructure? What is the likely impact on the range for the initial rate for the stormwater utility fee? Many stormwater utilities provide incentives for properties with onsite stormwater facilities to treat stormwater runoff. Two types of incentive programs typically are considered: Rebates or grants Credits The purpose of grants or rebates is to provide one-time subsidy to reduce construction costs associated with installation of stormwater facilities on private property. This sort of program is fairly uncommon, but is growing in popularity among jurisdictions with CSO and MS4 permit mandates. Examples include Montgomery County, Maryland s RainScapes program, Washington, DC s RiverSmart Homes, and Portland, Oregon s program (links are provided below). For example, RainScapes provides grants of up to $1,200 for residential property and up to $5,000 for commercial, multi-family, or institutional properties, depending on project type. Eligible practices include but are not limited to rain gardens, tree canopy, permeable pavers, green roofs, and rain barrels. RainScapes is funded by the County s stormwater utility. Similarly, DC s RiverSmart Homes program funds up to $1,200 for similar project types, but is restricted to private residences. The purpose of credits is to help property owners reduce their stormwater charge, thus providing an incentive for implementing stormwater management facilities. Historically, credits have been offered to commercial properties, but recent trends show that singlefamily properties are now eligible for certain types of credits. The credit amount that a property can receive varies among stormwater utilities. Most utilities provide only a partial credit, while others provide a full credit. The criteria for determining the credit amount typically are based on type of facility, and percent of impervious area treated (usually just the onsite impervious area). Some utilities provide credits to properties that do not have qualifying facilities but agree to participate in public education or outreach programs. Exhibit 1 provides a summary of credit programs around the United States. Exhibit 2 provides a list of potential credit amounts by stormwater project type being considered by Montgomery County, Maryland. As part of a grant to evaluate GI, the City has identified possible credit scenario case studies based on implementing GI. These case studies consider residential and commercial facilities and are summarized in Exhibit 3. Links to sample rebate/grant programs: Links to sample credit programs: PAGE 1 OF 6
78 Stormwater Utility Fee Credits / Incentives Policy Development Summary Lancaster, PA Policy Paper No. 5 Date Prepared: May 24, 2012 Date Revised: Date Final: September 17, 2012 Policy Issue: What type of type of credits or incentives should be provided to property owners for on-site facilities or green infrastructure? What is the likely impact on the range for the initial rate for the stormwater utility fee? Policy Options 1) Rebates or grants: a) Property Eligibility for Credits i) Provide credits to only commercial properties ii) Provide credits to all properties b) Amount of Credit i) $ limits by project type ii) $ limits by property type c) Qualifying Facilities / Activities 2) Credits: i) Approved BMPs, GI a) Property Eligibility for Credits i) Provide credits to only commercial properties ii) Provide credits to all properties b) Amount of Credit i) Partial (less than 100-percent reduction in charge) ii) Full (complete waiver of charge) c) Qualifying Facilities / Activities i) Approved BMPs, GI ii) Issues, Concerns, Benefits Participation in activities (such as public education program, adopt-a-highway) Both rebates and credit programs represent a policy option to increase stormwater treatment and improve compliance with permit requirements by incentivizing property owners to build stormwater facilities on private property. But these programs represent a cost (in the case of rebates) or a reduction in revenue, in the case of credits. Both types of programs have administrative costs that should be considered. All credit programs typically require some sort of maintenance agreement between the property owner and the utility to ensure that the facility is built appropriately and maintained in proper working order according to established design standards. The City of Portland s Clean River Rewards stormwater credit program required 2 full-time personnel one to administer and promote the program and another to conduct inspections to be sure facilities are being maintained. Credits typically require submittal of an application to be eligible for the credit, with residential programs typically being granted without inspection of more than a small sample of properties, and nonresidential facility credits requiring a site inspection. The period for which credits are kept in place varies, with some utilities requiring annual re-application, some granting credits for longer periods (3-5 years), and some granting credits indefinitely without reapplying. The question of what is the maximum level of credit is a policy question. Few jurisdictions grant 100-percent credit (essentially a waiver). Often these are situations in which the facility is an industrial facility with its own stormwater permit, or they discharge entirely directly to waters of the U.S. without passing through the MS4 system. More often, only partial credits are allowed (25-, 35- or 50-percent reduction, for example), with the rationale being that even if the property controls 100 percent of stormwater onsite, the municipality still has costs to manage stormwater offsite that everyone benefits from (for example, program administration for the permit, drainage from public roads). Consultant Recommendation The consultant recommends developing both a credit and a rebate program to support MS4 and CSO LTCP compliance, with credits of not more than 50 percent. These programs could be phased in after initial implementation of an impervious arear fee, largely to allow time to set up administrative systems and outreach programs to support them. PAGE 2 OF 6
79 Stormwater Utility Fee Credits / Incentives Policy Development Summary Lancaster, PA Policy Paper No. 5 Date Prepared: May 24, 2012 Date Revised: Date Final: September 17, 2012 Policy Issue: What type of type of credits or incentives should be provided to property owners for on-site facilities or green infrastructure? What is the likely impact on the range for the initial rate for the stormwater utility fee? Decision/Action Because the GI Plan requires a significant proportion of new capital facilities to be built on private property, the GIAC recommends providing an incentive program funded by the IAF. This would include some combination of rebates for facility construction, as well as credits to encourage maintenance of those facilities. Credits have the added benefit of giving property owners some mechanism of reducing the financial impact of the IAF. PAGE 3 OF 6
80 EXHIBIT 1 Example Credit Programs Municipality Single Family Residential? Non-Residential and Multi-Family Residential? Types of Credits Maximum Credit Allowed Chesapeake, VA No Yes Prince William County, VA No Yes Application of onsite BMPs that provide water quality or water quantity benefits.. Control stormwater onsite; non-structural program participation Virginia Beach, VA No Yes Manage stormwater quality onsite Portland, OR Yes Yes Philadelphia, PA No Yes, must have >500 sf impervious area Low-impact development (ecoroof, rain barrel, rain garden) Tree canopy Downspout disconnect Stormwater quality Stormwater quantity Stormwater planters IA Gross Area NPDES Credit Application and renewal fee apply Water quality (20%) Water quantity (20%) Maximum of 40% 50% for structural control; 30% for non-structural controls compiled as follows: 30% for nutrient mgmt. plan 30% for public education program 10% for attending workshop 10% site cleanup 30% for management to pre-developed condition 20% for management to Chesapeake Bay standards 35% of total stormwater charges Credit for tree canopy based on number of trees greater than 15 feet. Except monthly minimum charge. Up to 100% of stormwater charge for IA and Gross Area credit 7% for NPDES Credit NEORSD, Cleveland, OH Yes Yes Stormwater quality credit (25%) Stormwater quantity credit (50%) Education credit (25%) Up to 75% Up to 100% for public/private schools PAGE 4 OF 6
81 EXHIBIT 2 Example of Stormwater Facility Classifications for Credits (Montgomery County MD) Pretreatment 10% credit AQSW aquaswirl Water Quality (WQ) 25% credit Water Quantity (QN) 25% credit Both (B) 50% credit Green Infrastructure (Low Impact Development, ESD, etc.) 25% credit Programmatic 15% credit (regardless of impervious area treated) AQFIL aquafilter PDQN Dry Pond DS dry swale RG rain garden Adopt-a-Stream BAYSAV baysaver BF Bayfilter PDQNED Dry Pond with extended detention BSFS baysaver flow splitter SEP oil/grit separator SNOUT INF Infiltration Trench INFIL Infiltrator INFU Infiltration Trench, buried by design UG underground storage facility UGINF underground storage facility with infiltration BR bioretention PP permeable pavement Adopt-a-Road BRQN bioretention Rainbarrel Integrated Pest Management BS bioswale Cistern *Other DEP-approved program participation INFQN infiltration with quality and quantity control STC stormceptor PDIB Infiltration basin INFUQN underground infiltration with quality and quantity control Micro bioretention Submerged gravel wetlands Industrial Permit V2B1 PSF Peat sand filter PDQNSF dry pond with sand filter base Landscape Infiltration VORTEC - vortechnics SC stormchamber PDIBQN infiltration basin with quantity control Infiltration Berm SEPSF separator sand filter PDWD constructed wetland Swales SF surface sand filter PDWDED constructed wetland with extended detention Green Roofs SFU underground sand filter PDWT Wet pond Reinforced Turf STFIL stormfilter PDWTED wet pond with extended detention Disconnection SFQN surface sand filter with quantity control Sheet Flow TB tree box Dry well PAGE 5 OF 6
82 EXHIBIT 3 Summary of Case Studies from Keith Campbell Grant Study Report (CH2M HILL, 2011) Property ID Property Name Land Use Category Annual Stormwater Charge Charge after Credits Payback (Years) Median Impervious Area (sf) for Group Impervious Area (sf) for Property P-21 Two Dudes Painting Commercial $1,600 $ ,800 19,900 P-82 Sundown Lounge Commercial $200 $ ,800 2,600 P-111 Ace Rents Industrial $21,300 $10, , ,800 P-25 Novelty Brush Industrial $2,600 $1, ,200 32,600 P-47 Lancaster County Library Institutional $2,300 $1, ,400 29,000 P-100 Water Street Mission Institutional $9,400 $8, , ,100 P-34 Public Parking: Dauphin St Local Govt. $1,700 $ ,300 21,750 P-84 Apts at Mulberry Ct Multi-Family $1,000 $ ,200 12,900 P-51 Private Parking Water St Parking $5,100 $2, ,800 63,200 P-85 James St Mennonite Church Religious $2,300 $1, ,600 28,800 P-99 Trinity Lutheran Church Religious $3,500 $2, ,600 43,500 SFR block Ocean Ave Single Family $40 $ SFR Poplar St Single Family $80 $ SFR Block Lehigh Ave Single Family $120 $ ,800 P-106 Green Alley at Alley 7 (Option #1) P-106 Green Alley at Alley 7 (Option #2) Single Family $80 $ ,300 Single Family $80 $ ,340 Note: Charges assume $5/month/1000 sf of IA. PAGE 6 OF 6
83 Stormwater Utility Impervious Area Fee (SWMF) Billing System Policy Paper
84
85 Stormwater Utility Impervious Area Fee (IAF) Billing System Policy Development Summary Lancaster, PA Policy Paper No. 5 Date Prepared: August 29, 2012 Date Revised: September 11, 2012 Date Final: Policy Issue: Should the proposed IAF appear on the property tax bill, water/sewer bill, or be a separate, stand- alone billing system? Overview Three billing methods are commonly used to collect stormwater utility charges: real estate tax bills, water/sewer utility bills, or separate billing systems. Selection of a billing system is unique to the locality establishing a stormwater utility. The water/sewer bill may only cover part of the stormwater utility service area, whereas the property tax database provides complete coverage. It may be the case that the stormwater utility service area is not covered by either database system. The selection of the billing method should be cost- effective, timely, and capture all affected properties. Policy Options Line item on the real estate tax bill Line item on the water/sewer bill Stand-alone stormwater bill Issues, Concerns, Benefits Water/Sewer Bills Pros Provides near full coverage of all properties in the City, except for properties not receiving water and sewer bills, such as parking lots and vacant lots with IAs. Established enforcement mechanism is in place for collecting delinquent bills, that is, by shutting off water. Quarterly billing cycle reduces the charge paid per bill and improves cash flow. The City has 13 billing quarterly billing cycles, so bills are going out every week to a different group of accounts, each of which receives bills quarterly. Reinforces perception that the IAF is a fee for service, not a tax. Existing water/sewer billing system will allow the addition of another line item on the existing bill layout. Cons Collection rate is typically lower than real estate tax bill. Lancaster imposes a payment order whereby the first dollar received is applied tosewer, and the last to water, and it aggressively uses water shutoffs to improve collections. Therefore current collection rates are. The IAF could be similar in magnitude to existing water/sewer fees, thus drawing attention. Could require additional non-water/sewer accounts to be added to current master billing file (such as parking lots or vacant land with IA). There are approximately XX non-water/sewer accounts. Bills are sent to tenants, not owners. Tenants are less likely to be interested in incentive programs for managing IA on the property. Approximately 3,000 to 6,000 accounts out of nearly 16,000 are tenant-occupied in Lancaster. The City is in the midst of converting its billing system software and has not selected a vendor yet for the new system. Therefore there are uncertainties as to how the IAF would be integrated with the new billing system. PAGE 1 OF 3
86 Stormwater Utility Impervious Area Fee (IAF) Billing System Policy Development Summary Lancaster, PA Policy Paper No. 5 Date Prepared: August 29, 2012 Date Revised: September 11, 2012 Date Final: Policy Issue: Should the proposed IAF appear on the property tax bill, water/sewer bill, or be a separate, stand- alone billing system? Issues, Concerns, Benefits (continued) Real Estate Tax Bill Pros Provides near full coverage of all properties in the City, except for properties that are tax-exempt, such as faith community, nonprofits, and government. There are approximately 700 accounts that would need to be added to the billing database to cover these tax-exempt properties if this approach is used. Established enforcement mechanism is in place for collecting delinquent bills, by placing a lien on a property. Payment of many bills through escrow payments to mortgage companies and typically increases collection rate. The IAF could be smaller than real-estate taxes, thus not drawing attention. Bills are sent to owners, not tenants. Owners are more likely to be interested in incentive programs for managing IAs area on their properties. Cons Reinforces perception that the IAF is a tax, not a fee for service. The IAF is not based on property value. Rather, it is based on a property s IA and its contribution to stormwater runoff. Creates confusion on whether fee is tax-deductable. Requires special handling of tax-exempt accounts. For example, separate assessment notices may be required. Annual billing cycle increases the charge paid per bill, and affects cash flow (i.e., once or twice per year depending on tax assessment cycles). Existing real estate tax bill may not allow the addition another line item or could require additional cost to add another line item. Stand-Alone Bill Pros Can be used if existing water/sewer and real estate billing systems require significant reprogramming to accommodate another line item. Cons High initial cost to set up and increased administrative tasks to send bills out and track accounts receivable. Results in high level of non-payment. Enforcement could be limited to collection agencies, which require additional costs. PAGE 2 OF 3
87 Stormwater Utility Impervious Area Fee (IAF) Billing System Policy Development Summary Lancaster, PA Policy Paper No. 5 Date Prepared: August 29, 2012 Date Revised: September 11, 2012 Date Final: Policy Issue: Should the proposed IAF appear on the property tax bill, water/sewer bill, or be a separate, stand- alone billing system? Issues, Concerns, Benefits (continued) Implementation Issues Most billing options will calculate stormwater fees and credits external to the actual billing system that prints bills and tracks account receivable. Bills can be calculated manually with a series of geographic information system data and billing data queries, but these are often better accomplished if a custom database software application is developed that tracks all the billing rules reflected in the ordinance and policy decisions. Key implementation issues for any billing method will include the following: Coding/programming for IA-based fees/charges Creation of database for properties currently not charged Hardware Software Integration with existing systems may require modification or replacement of legacy billing systems. Funding for these activities, sometimes taken as a loan against the Sewer Fund or the General Fund that is subsequently paid back by the user fee. Coding/programming for exemptions, credits. Handling delinquent accounts and late payments? Some utilities will assess a late payment (typically 10 percent). Public/stakeholder education/awareness Before billing begins (see outreach strategy, which includes assessment notices, mailers, web sites, and stakeholder meetings and presentations) After first bills are issued (use a phone bank/call center, with operators trained to respond to FAQs; City currently has a call tree set up for different utilities) Ongoing Regardless of the approach taken, need to clearly define who is responsible for maintaining related billing data, which fall into four categories: account information (owner or tenant), and IA information, accounts receivable, and adjustments/credits. One entity needs to manage the overall process. Consultant Recommendation Use the water/sewer bill because it will require fewer new accounts to be billed than the real estate tax bill, and promotes the view that the charge is a fee for service, not a tax. Decision/Action Assume will use the quarterly water/sewer bill. PAGE 3 OF 3
88
89 Stormwater Utility Impervious Area Fee (SWMF) Appeals Policy Paper
90
91 Stormwater Utility Impervious Area Fee (IAF) Appeals Policy Development Summary Lancaster, PA Policy Issue: Should the proposed IAF allow for fees to be appealed, and what issues can be appealed? Overview Policy Paper No. 6 Date Prepared: August 29, 2012 Date Revised: September 11, 2012 Date Final: September 13, 2012 All stormwater utility charges typically provide a mechanism for rate payers to appeal their bills, both to give them the ability to correct erroneous information and allow them the ability to correct erroneous information.. However, what can be appealed, when, and the process for submitting and reviewing appeals need to be clearly defined to make the fee defensible and manageable. Policy Options What can be appealed: IA calculation and tier assignment Determination of exemption status (for example, if the ordinance exempts local and state governments) Credit calculation (assumes a property owner applied for a credit) When are appeals submitted: Typically only once per year, well in advance of billing cycle (60-90 days), but with quarterly billing cycle; perhaps this is done more frequently. Process for submitting appeals: Typically a form is developed that contains basic property owner information, and the onus is on the owner to provide backup information in the form of maps, aerials, or documentation of charges. Review is performed by someone designated as the administrator of the fee or their designee, and within a prescribed time to respond (typically days) Issues, Concerns, Benefits Appeals should be allowed only once per year, to minimize administrative costs. The City recommended that the deadline be 6 months before the first bills go out in a given fiscal year. Assuming first bills go out July 1, appeals would be due on January 1. Note that in the first year of the IAF, the City anticipates issuing an assessment notices\ to allow customers to budget for the new fee. The goal would be to issue that assessment notice well in advance of the appeal date, with a target of July 1. Consultant Recommendation Allow for limited appeals based on IA, tier assignment, charge calculation, or credit calculation. Appeals must be submitted 6 months before new fees, or fee increases, are in effect. Appeals should put the burden of proof on the customer filing the appeal. Decision/Action Include provision for appeals in proposed ordinance that would establish the fee. PAGE 1 OF 1
92
93 Appendix B Stormwater Management Program Needs
94
95 Stormwater Management: Program Needs, Levels of Service, Cost, and Preliminary Rate Projections Prepared for City of Lancaster, PA March 17, Arch Street Suite 4400 Philadelphia, PA 19103
96
97 Contents Acronyms and Abbreviations... v Executive Summary... ES-1 Purpose... ES-1 Benefits of a Dedicated Cost Recovery Source for Stormwater Management... ES-1 Key Findings and Recommendations... ES-2 1 Introduction Purpose Project History Impervious Area-based Stormwater User Fee Implementation Steps Stormwater Management Program Overview Drivers for Dedicated Source of Cost Recovery for Stormwater Management Policy Paper Overview of Current Program Program Elements for Impervious Area User Fee Program Administration Billing and Collection Incentive/Credit Program NPDES Permit Administration Post Construction Stormwater Management Plan Review Inspections and Maintenance Green Infrastructure Existing City-owned Stormwater Management Facilities Street Sweeping Catch Basins and Inlets CSO / Wet-weather Facilities NPDES Phase II Implementation (MS4 Permit) Public Outreach and Education Public Participation / Involvement Illicit Discharge Detection / Elimination Construction Site Runoff Control Post-construction Stormwater Management Pollution Prevention Water Quality Monitoring (TMDL compliance) Flood Control and Floodplain Management Wastewater Treatment Capital Improvement Projects Green Infrastructure Program CSO / Wet-weather Projects (Wastewater CIP) Catch Basin Rehabilitation and Replacement Combined and Separate Storm Sewer Rehabilitation and Replacement Flood Control Master Planning Program Needs for Next 5 Years Low Level of Service Medium Level of Service High Level of Service ES BSS III
98 STORMWATER MANAGEMENT: PROGRAM NEEDS, LEVELS OF SERVICE, COST, AND PRELIMINARY RATE PROJECTIONS Attachments A B C D E Tables ES-1 Stormwater Utility Program Needs Policy Paper Program Administration Costs Inspection and Maintenance Cost Estimates NPDES Phase II Implementation Cost Estimates CSO Wet Weather CIP Level of Service Cost Estimate Summary... ES Budget Summary for Public Works (FY 2012) Cost Recovery Source Summary for Public Works (FY 2012) Level of Service Cost Estimate Summary Allocation of 2012 PAC Costs Estimated Program Administration Costs for Incentive/Credit Program Estimate NPDES AWWTP and CSO Permit Administration Costs Estimate NPDES MS4 Permit Administration Costs Annual Level of Service Cost Estimates for Green Infrastructure Inspections and Maintenance, for the Fifth Year of the Program BMPs inspected by the City Estimate Municipal Owned BMP Inspection Costs Street Sweeping Routes Level of Service Cost Estimates for Street Sweeping Level of Service Cost Estimate for Catch Basin Level of Service Cost Estimates for Public Education MCM Level of Service Cost Estimates for Public Participation MCM Cost Estimates for Illicit Discharge Detection / Elimination Program Cost Estimates for Construction Site Runoff Control* Cost Estimates for Post-Construction Stormwater Management Cost Estimates for Pollution Prevention Capital Cost Estimates for the Green Infrastructure Program Green Infrastructure Capital Costs (Medium LOS) Green Infrastructure Capital Costs (High LOS) CSO and Wet-weather CIP Projects Catch Basin Rehabilitation and Replacement Cost Estimates for Medium LOS Combined and Separate Storm Sewer Rehabilitation and Replacement Cost Estimates for High LOS Combined and Separate Storm Sewer Rehabilitation and Replacement Low Level of Service Cost Estimates Medium Level of Service Cost Estimates High Level of Service Cost Estimates Figures ES-1 Level of Service Program Needs for Next Five Years... ES Impervious Area Fee Feasibility Study and Implementation Road Map City of Lancaster Organizational Chart Organization Chart for the Department of Public Works Allocation of 2012 Personnel Administration Center Costs Level of Service Program Needs for the Next 5 Years High Level of Service Cost Estimates iv ES BSS
99 Acronyms and Abbreviations AWWTP BMP CIP CSS CSO EPA ERU FTE FY GI GIAC IA IDDE LOS LTCP MS4 MCMs NPDES O&M PAC PA DEP TMDL WIP advanced wastewater treatment plant Best Management Practice (stormwater control, sometimes used interchangeably with GI) Capital Improvement Plan combined sewer system combined sewer overflow U.S. Environmental Protection Agency equivalent residential unit full-time equivalent fiscal year Green Infrastructure Green Infrastructure Advisory Committee impervious area illicit discharge detection and elimination level of service Long-Term Control Plan for CSOs Municipal Separate Storm Sewer System minimum control measures (required by NPDES MS4 permit) National Pollutant Discharge Elimination System operation and maintenance Personnel Administration Center Pennsylvania Department of Environmental Protection Total Maximum Daily Load Watershed Implementation Plan ES BSS V
100
101 Executive Summary Purpose The purpose of this technical memorandum is to document the various activities of the bureaus within the City of Lancaster (the City) Department of Public Works that contribute to stormwater management and watershed protection and to document the baseline and potential program enhancements and cost recovery requirements that will provide for regulatory compliance and improved customer service. A stormwater management program assessment was developed for the following program elements and their respective costs: Program Administration Inspection and maintenance of Stormwater Best Management Practices (BMPs) and Green Infrastructure (GI)NPDES Phase II Permit Implementation for Municipal Separate Storm Sewer Systems (MS4)Water Quality Monitoring (TMDL compliance) Compliance with Total Maximum Daily Load (TMDL) and Watershed Implementation plans Flood Control and Floodplain Management Programs Wet Weather related Wastewater Treatment Wet Weather Capital improvement program (CIP) including Green Infrastructure For each of these program elements, the Project Team analyzed and summarized internal and external program costs for a five-year period for three different level-of-service alternatives and compared these to the current program. Staffing needs and preliminary analysis of dedicated cost recovery options and rates associated with these program elements are documented in two separate technical memoranda. Benefits of a Dedicated Cost Recovery Source for Stormwater Management A dedicated cost recovery source, such as an Impervious Area Service Fee, provides the City with the following benefits: For citizens Improved public health and safety Improved customer service and a reduced backlog of customer complaints Reduction of long-term capital costs through proactive maintenance Protection of property value Local drainage improvements that help to reduce localized flooding For businesses Improved City services Cleaner streets, which help improve the business climate Support of economic development initiatives and public-private partnerships For environmental quality Meeting local and regional regulations on water quality, reducing the possibility of US EPA fines for compliance with permit requirements Creating cleaner rivers, creeks and streams Cleaner waterfront and park areas ES BSS ES-1
102 STORMWATER MANAGEMENT: PROGRAM NEEDS, LEVELS OF SERVICE, COST, AND PRELIMINARY RATE PROJECTIONS There are significant issues related to stormwater management, which are the focus of recent regulatory requirements such as the MS4 permit and consent orders related to CSOs. Projects and programs related to stormwater are dispersed throughout Public Works and implementation of a dedicated cost recovery source can help highlight projects and programs. One of the main benefits is movement away from a reactive, customercomplaint driven model for stormwater management to a proactive, strategic and customer-service driven approach. Key Findings and Recommendations Although no two stormwater utilities (IA-based user fee programs) are exactly alike, the program elements cost recovered by the fee are generally similar. In order to identify the program costs for the proposed fee, individual program elements were evaluated and estimates were developed based on a combination of previous studies, staff salaries, estimated time spent on stormwater-related functions/services, and other expenditures. Level-of-Service Alternatives Level-of-Service (LOS) considerations were made in order to identify a range of program costs. The LOS alternatives considered consist of the following: Low Medium High Assumes current level of expenditures and MS4 permit implementation Assumes GI Plan implementation (public properties only), MS4 permit implementation, increased maintenance and customer service Assumes GI Plan implementation (public and private properties), MS4 permit implementation, high level of maintenance and customer service Table ES-1 summarizes the LOS cost estimates for program elements for the proposed impervious area service fee. Figure ES-1 shows how costs are assumed to be distributed over the first 5 years of the program, for the medium and high LOS alternatives. TABLE ES-1 Level of Service Cost Estimate Summary Estimated Annual Costs Low Medium High Operating and Maintenance Green Infrastructure* n/a $162,000 $202,500 Dry and Wet Ponds (inspection) $2,300 $2,300 $2,300 Street Sweeping $168,800 $168,800 $234,100 Catch Basin $201,000 $201,000 $402,000 Storm Drainage n/a n/a n/a MS4 Implementation $451,566 $536,412 $612,412 Program Administration $142,000 $219,000 $296,000 Capital Costs Green Infrastructure $730,600 $1,909,100 $3,652,400 Storm Drainage n/a $1,444,000 $1,926,000 Catch Basin $164,000 $164,000 $164,000 Total $1,860,266 $4,806,612 $7,491,712 ES-2 ES BSS
103 EXECUTVE SUMMARY FIGURE ES-1 Level of Service Program Needs for Next Five Years Total Estimate Annual Costs $8,000,000 $7,000,000 $6,000,000 $5,000,000 $4,000,000 High Medium Low $3,000,000 $2,000,000 $1,000,000 $ Year As part of the City s green infrastructure program, the Impervious Area Fee would cover costs associated with ongoing planning, engineering and construction of projects shown in Figure ES-2. ES BSS ES-3
104 STORMWATER MANAGEMENT: PROGRAM NEEDS, LEVELS OF SERVICE, COST, AND PRELIMINARY RATE PROJECTIONS FIGURE ES-2 Green Infrastructure Project Status Map ES-4 ES BSS
105 SECTION 1 Introduction 1.1 Purpose The purpose of this technical memorandum is to document the various activities of the bureaus within the City of Lancaster (the City) Department of Public Works that contribute to stormwater management and watershed protection and to document potential program enhancements and cost recovery requirements that will provide for regulatory compliance and improved customer service. A stormwater management program assessment was developed for the following program elements: Program administration Inspection and maintenance of stormwater Best Management Practices (BMPs) and Green Infrastructure (GI) National Pollutant Discharge Elimination System Phase II Permit Implementation for Municipal Separate Storm Sewer Systems (MS4) Water quality monitoring Compliance with Total Maximum Daily Load (TMDL) and Watershed Implementation Plans (WIPs) Flood control and floodplain management programs Wet-weather-related wastewater treatment Wet-weather Capital improvement Program (CIP), including GI 1.2 Project History Faced with significant increases in regulatory requirements and anticipated cost recovery gaps, the City has conducted a series of activities to evaluate alternate approaches to complying with regulatory requirements while meeting City goals for economic development, and to evaluate the feasibility of developing an impervious area (IA) -based user fee (sometimes known as a stormwater utility). To attract broad stakeholder input to these studies, the City formed the Green Infrastructure Advisory Committee (GIAC) in 2010, including representatives from business owners, citizens, institutions, environmental groups, state government, and Lancaster city and county government. Based on the GIAC s recommendations, the City retained CH2M HILL in March 2012 to assist in moving towards implementing an IA-based fee. Studies and activities completed before the current implementation efforts include the following: Stormwater Utility Feasibility Analysis Status Briefing (CDM, November 2010) Urban Tree Canopy: A Report on the City of Lancaster s Existing and Possible Tree Canopy (DCNR and UVM, February 2011) Stormwater Fee Structure Evaluation (CDM, March 2011) Green Infrastructure Master Plan for the City of Lancaster (CH2M HILL, April 2011) Lancaster City Tree Inventory and Summary Report (Draft, Penn State, October 2011) Keith Campbell Grant: Stormwater Utility Credits and Incentives for Green Infrastructure A Case Study Assessment (CH2M HILL, November 2011) The GIAC has continued to support the impervious area fee evaluation through a series of meetings to evaluate policy options. These options, deliberations, and recommendations by the GIAC will be documented in a separate report. ES BSS 1-1

106 STORMWATER MANAGEMENT: PROGRAM NEEDS, LEVELS OF SERVICE, COST, AND PRELIMINARY RATE PROJECTIONS 1.3 Impervious Area-based Stormwater User Fee Implementation Steps Figure 1-1 shows the overall sequence of tasks that are being followed to move towards implementing an IAbased stormwater user fee. This technical memorandum documents the review of program requirements and level of service (LOS) options in Task A. Those costs are being used to evaluate staffing needs in Task B, and cost recovery options and policy implications in Tasks D and C, with review and input by the GIAC. The GIAC s input constitutes the first step of a concerted public outreach program in Task F that will continue with a series of public outreach activities targeting a cross-section of stakeholder groups. FIGURE 1-1 Impervious Area Fee Feasibility Study and Implementation Road Map 1.4 Stormwater Management Program Overview Public Works consists of seven bureaus, and the stormwater management-related functions and services are provided primarily by the Operations and Wastewater Operations bureaus. The stormwater functions/services currently provided by Public Works include: Street sweeping Catch basin cleaning and maintenance Inspection of stormwater BMPs NPDES Phase II (MS4) implementation GI project planning and implementation 1.5 Drivers for Dedicated Source of Cost Recovery for Stormwater Management Numerous drivers requiring changes to the way the City manages urban runoff support the need for a dedicated cost recovery source, all of which are addressed in the City s GI Plan. In early 2008, the U.S. Environmental Protection Agency (EPA) initiated correspondence with the City requesting information on the City s Long Term Control Plan (LTCP) for combined sewer overflows (CSOs). In response, the City prepared an update to its LTCP in mid 2009 and continues to make system upgrades and communicate progress on these improvements and the ongoing long-term planning. The City is continuing to discuss the adaptation of the CSO control program to include GI through this planning effort and has already started implementing GI throughout the city to reduce CSOs as well as to respond to the evolving requirements of the Chesapeake Bay Total Maximum Daily Load (TMDL) and associated WIP being prepared by Pennsylvania Department of Environmental Protection (PA DEP). 1-2 ES BSS
107 SECTION 1 INTRODUCTION Under the Chesapeake Bay Program, EPA is leading a major initiative to restore polluted streams in the Chesapeake Bay watershed that currently do not meet water quality standards. Working with state partners, EPA is setting binding limits on nutrient (nitrogen and phosphorus) and sediment pollution through a TMDL analysis or pollution diet. The TMDL is a tool of the federal Clean Water Act and requires the City to reduce pollutant loads to the Chesapeake Bay. The present program seeks to ensure that all practices to fully restore the health of the Bay are in place by 2025, with 60 percent of the actions taken by In September 2010, PA DEP released a Draft Phase 1 WIP and on November 29, 2010, released the Final Phase 1 WIP as mandated by EPA. The Phase 1 WIP identifies pollution reduction targets by major watershed and source sector (agriculture, stormwater, wastewater treatment plants, etc.) and provides a description and schedule of actions to be taken to achieve the reductions. Now that EPA has approved the WIP, the plan will be supported by a series of 2-year milestones for achieving specific near-term pollution reductions needed to keep pace with longterm restoration commitments. Pennsylvania and EPA will monitor the effectiveness of those actions in order to assess progress and water quality improvement. EPA would take federal steps if there are insufficient commitments in a jurisdiction s implementation plan or a failure to meet the established 2-year milestones. These regulatory programs will all require the City to invest in controls that reduce stormwater runoff, CSOs, and the pollutants they contain. The GI Plan completed by the City in 2010 seeks to address all of these new regulatory requirements in an integrated manner that focuses on fixing other necessary City infrastructure at the same time. The GI Plan will accomplish this objective by providing conceptual plans that incorporate rain gardens, tree trenches, vegetated curb extensions, and other GI techniques throughout the City s urban environment. A second objective to the County s goal is to enhance the quality of surface and groundwater resources. The City of Lancaster s GI Plan will achieve this objective by providing detailed guidance on demonstration projects that capture stormwater and infiltrate it into the local groundwater table as well as allow for increased evapotranspiration, rather than sending it through the combined sewer system (CSS). 1.6 Policy Paper As part of this study, a policy paper was developed and presented to the GIAC. The purpose of the policy paper is to identify the stormwater programs to be cost recovered by the IA service fee. In addition, the policy paper discusses the issues, concerns, and benefits associated with cost recovery for the program with dedicated cost recovery sources. Lastly, the policy paper documents the GIAC s comments. The policy paper on program needs is provided in Attachment A. ES BSS 1-3
108

109 SECTION 2 Overview of Current Program Information on current (existing) stormwater program functions and cost recovery has been developed through a number of sources and meetings in Figure 2-1 shows the overall organization of City of Lancaster government. FIGURE 2-1 City of Lancaster Organizational Chart Figure 2-2 shows the organization of the City s Department of Public Works. The project team has met with various entities within the Department of Public Works. Stormwater functions/services currently provided by the Department include the following: MS4 permit compliance Street sweeping Catch basin cleaning GI planning The primary cost recovery sources for the Department of Public Works are the Solid Waste and Recycling Fund, Water Fund, and Sewer Fund. Currently, stormwater functions/services are cost recovered through the sewer charge and/or the General Fund. The Bureau of Public Art receives cost recovery from the Lancaster County Community Foundation. There are six operating bureaus under the Department of Public Works, with Wastewater Operations currently providing most of the stormwater services and functions. ES BSS 2-1
110 STORMWATER MANAGEMENT: PROGRAM NEEDS, LEVELS OF SERVICE, COST, AND PRELIMINARY RATE PROJECTIONS FIGURE 2-2 Organization Chart for the Department of Public Works Director of Public Works Bureau of Operations Bureau of Engineering Bureau of Parks and Public Property Bureau of Water Bureau of Wastewater Operations Bureau of Solid Waste / Recycling Services Director of Public Works Includes Director of Public Works and secretary. Provides oversight of entire department, including stormwater functions/services. The Director also administers the City s Capital Improvement Plan (CIP), serves as chief technical advisor/liaison with community on behalf of the Mayor and Council, and represents the City on boards and commissions. Includes Public Art manager (reimbursed by Lancaster County Community Foundation), who provides coordination of public art and educational signage for GI projects Bureau of Operations Includes Streets, Parks, Motor Vehicles, and Traffic sections Stormwater functions/services provided by Streets Section include street cleaning (sweeping). Bureau of Engineering Stormwater functions/services include: Technical review of stormwater management plans submitted by developers Development and review of plans and specification for GI projects to reduce stormwater runoff Administration of the wet-weather planning and capital program Bid and construction management for CSO, GI, and stormwater drainage improvement projects Bureau of Parks and Public Property Stormwater functions/services include: Maintenance of GI facilities at parks Ongoing maintenance and replacement of street trees that reduce stormwater Administration and distribution of wholesale trees to support the residential planting program Bureau of Water No stormwater functions/services provided. Bureau of Wastewater Operations Stormwater functions/services include catch basin cleaning, inspection of municipally owned stormwater facilities, and operation and maintenance (O&M) and capital improvements for improving and maintaining the collection system and advanced wastewater treatment plant (AWWTP) ability to process wet-weather flows. Bureau of Solid Waste and Recycling No stormwater functions/services provided. 2-2 ES BSS
111 SECTION 2 OVERVIEW OF CURRENT PROGRAM Table 2-1 summarizes the fiscal year (FY) 2012 budget for Public Works and includes expenditures for salaries, benefits, equipment, capital outlay (CIP), principal and interest on debt, transfers to the General Fund, as well as employees for each bureau. Table 2-2 summarizes the total number of employees by cost recovery source. TABLE 2-1 Budget Summary for Public Works (FY 2012) FY2012 Bureau Employees Budget Total Cost Recovery Source Director of Public Works 3 $1,020,844 General Fund Operations Administration 0 $155,515 General Fund Streets 23 $1,878,010 General Fund Motor Vehicles 4 $193,008 General Fund Parks & Public Property 22 $1,882,021 General Fund Engineering 4 $383,808 General Fund Water Administration 12 $13,727,755 Water Fund Susquehanna Treatment 18 $2,721,476 Water Fund Conestoga Treatment 16 $2,410,242 Water Fund Transmission & Distribution 20 $2,131,305 Water Fund Meter Shop 13 $1,062,596 Water Fund Grounds Maintenance 11 $424,026 Water Fund Laboratory 4 $244,951 Water Fund Wastewater Operations Administration 6 $5,125,526 Sewer Fund Collections 11 $664,443 Sewer Fund Pumping Stations 15 $1,168,134 Sewer Fund Treatment 17 $4,769,572 Sewer Fund Grounds Maintenance 3 $121,042 Sewer Fund Solid Waste Recycling Service 8 $3,889,712 Solid Waste & Recycling Fund TABLE 2-2 Cost Recovery Source Summary for Public Works (FY 2012) Public Works Employees FY2012 Budget Total $5,513,206 Sewer Fund $11,848,717 Water Fund $22,722,351 Solid Waste & Recycling Fund 7.63 $3,889,712 Total $43,973,986 Source: FY 2012 Budget. The total General Fund FY 2012 budget for the City is $46,271,459 and Public Works accounts for $5,513,206 (approximately 12 percent of the total General Fund). The portion that relates to stormwater functions/services is estimated to be $455,638 for street cleaning (approximately 1 percent of the total General Fund). As the City ES BSS 2-3
112 STORMWATER MANAGEMENT: PROGRAM NEEDS, LEVELS OF SERVICE, COST, AND PRELIMINARY RATE PROJECTIONS considers implementing an IA-based stormwater user fee, these expenditures for stormwater functions/services would be cost recovered by the IA -based fee and no longer by the General Fund. The total Sewer Fund FY 2012 O&M expenditures is $11,848,717. The portion that relates to stormwater functions/services is estimated to be $ 614,162 (approximately 5.2 percent of the total sewer O&M allocation). As the City considers implementing the Stormwater Utility, these expenditures for stormwater functions/services would be fund by the IA-based fee and no longer by the Sewer Fund. This will help offset sewer rate increases. In addition to the Department of Public Works, stormwater functions and services are provided by the Bureau of Planning, which is in the Department of Economic Development and Neighborhood Revitalization (see Figure 2-1).Stormwater functions of the Bureau of Planning include administration of the post-construction stormwater management program, review of development plan submittals, and administration and inspection of the First Flush ordinance to reduce stormwater pollutants from redevelopment projects. 2-4 ES BSS
113 SECTION 3 Program Elements for Impervious Area User Fee Although no two stormwater utilities (IA-based user fee programs) are exactly alike, the program elements cost recovered by the Stormwater Utility are generally similar. In order to identify the program costs for the proposed Stormwater Utility, individual program elements were evaluated and estimates were developed based on a combination of previous studies, staff salaries, estimated time spent on stormwater-related functions/services, and other expenditures. In addition, LOS considerations were made in order to identify a range of program costs. The LOS alternatives considered consist of the following: Low Medium High Assumes current level of expenditures Includes current level of expenditure, plus additional program elements Includes higher level of service for current program, plus additional program elements Table 3-1 summarizes the LOS cost estimates for program elements for the proposed Stormwater Utility. TABLE 3-1 Level of Service Cost Estimate Summary Estimated Annual Costs Low Medium High O&M GI n/a $162,000 $202,500 Dry and Wet Ponds (inspection) $2,300 $2,300 $2,300 Street Sweeping $168,800 $168,800 $234,100 Catch Basin $201,000 $201,000 $402,000 Storm Drainage n/a n/a n/a MS4 Implementation $451,566 $536,412 $612,412 Program Administration $142,000 $219,000 $296,000 Capital Costs GI $730,600 $1,909,100 $3,652,400 Storm Drainage n/a $1,444,000 $1,926,000 Catch Basin $164,000 $164,000 $164,000 Total $1,860,266 $4,806,612 $7,491, Program Administration Program administration components and their respective costs for the proposed Stormwater Utility are discussed in the following sections Billing and Collection Billing and collection is for the cost of generating data to be included in Stormwater Utility bill item and allocation of postage and other costs. The City provided the 2012 Personnel Administration Center (PAC) cost allocation. These costs include expenditures for billing and collections personnel, postage, printing, equipment, supplies, etc. Based on feedback from Public Works, for purpose of this study, allocation for the proposed Stormwater Utility assumes half of the sewer 2012 PAC costs, amounting to approximately $90,000. For purpose of this study, it was assumed that the Stormwater Utility charge will be a line item on the existing utility bill. Figure 3-1 and Table 3-2 summarize the allocation of administrative costs provided in the 2012 PAC. The 2012 PAC details are provided in Attachment B. ES BSS 3-1
114 STORMWATER MANAGEMENT: PROGRAM NEEDS, LEVELS OF SERVICE, COST, AND PRELIMINARY RATE PROJECTIONS FIGURE 3-1 Allocation of 2012 Personnel Administration Center Costs $450,000 $400,000 $407,987 Allocation of 2012 PAC Costs $350,000 $300,000 $250,000 $200,000 $178,960 $150,000 $135,951 $149,733 $100,000 $50,000 $26,193 $20,115 $0 General Fund Water Sewer Trash Housing Police Source: City of Lancaster Treasury Bureau. TABLE 3-2 Allocation of 2012 PAC Costs Expense Item Total General Fund Water Sewer Trash Housing Police Personnel (salary, temporary, overtime) $587,397 $98,948 $272,264 $119,426 $96,758 $0 $0 Uniforms (mail clerk) Equipment Maintenance 21,644 4,071 9,611 4,216 3, Dues & Subscriptions Postage 193,940 13,693 74,058 32,485 29,213 26,193 17,707 Printing 33,679 3,429 15,376 6,745 5, ,408 Telephone 5, ,480 1, Travel Miscellaneous Office Supplies 10,000 1,786 4,493 1,971 1, Minor Equipment 65,660 11,727 29,498 12,939 11, Total $919,530 $135,951 $407,987 $178,960 $149,733 $26,193 $20,115 Source: City of Lancaster Treasury Bureau. 3-2 ES BSS
115 3.1.2 Incentive/Credit Program SECTION 3 PROGRAM ELEMENTS FOR IMPERVIOUS AREA USER FEE It is not uncommon for stormwater utilities to offer incentives/credits to property owners who own and maintain stormwater management facilities. The incentives are typically one-time rebates, while credits are annual deductions towards the property owner s stormwater bill. In order to properly implement an incentive/credit program, it is necessary to process application forms, conduct periodic inspections, address inquiries from the public, and develop reports. Based on experience and feedback from other stormwater programs (such as the City of Portland, OR program), one to two full-time equivalents FTEs are required. Table 3-3 summarizes the estimated costs for administering the incentive/credit program. TABLE 3-3 Estimated Program Administration Costs for Incentive/Credit Program Credits and Incentives Low (1) Medium (2) High (3) Program Administrator (4) 0 $ 43,000 $ 86,000 Program Inspector (5) 0 $ 34,000 $ 68,000 Total $ - $ 77,000 $ 154,000 (1) For the low LOS, no costs are assumed because the City does not currently have an incentive/credit program. (2) For the medium LOS, 0.5 FTE for a Program Administrator and 0.5 FTE for an Inspector. (3) For the high LOS, 1 FTE for a Program Administrator and 1 FTE for an Inspector. (4) The assumed salary and benefits for the Program Administrator is $85,900 (5) The assumed salary and benefits for the Inspector is $67, NPDES Permit Administration The City holds NPDES permits with PA DEP for its AWWTP that include requirements for the ongoing performance, maintenance, and capital improvements to wet-weather collection and treatment capacity to convey and treat wetweather flows. The programs in this permit (# ) require upgrades to these systems and an updated CSO LTCP that the City continues to negotiate with PA DEP and EPA. In addition, the permit requires the following programs: Documentation of the implementation of the Nine Minimum Controls, including: 1. Proper O&M of the sewer system and CSO outfalls 2. Maximize use of the collection system for storage 3. Review and modification of the industrial pretreatment program to minimize industrial pollutants in CSO discharges 4. Maximization of flow to the AWWTP 5. Elimination of dry-weather CSOs 6. Control of solids and floatables in CSOs 7. Pollution prevention programs to reduce contaminants in CSO discharges 8. Public notification programs to ensure the public receives adequate notification of CSO impacts 9. Monitoring to effectively characterize CSO impacts and the efficacy of CSO controls Ongoing monitoring requirements and annual status reports MS4 permit - The City also holds an NPDES permit (#133577, expired March 9, 2008) that identifies the conditions for the six minimum control measures (MCMs) to be implemented in the City, including: 1. Public outreach and education 2. Public participation / involvement 3. Illicit discharge detection / elimination 4. Construction site runoff control ES BSS 3-3
116 STORMWATER MANAGEMENT: PROGRAM NEEDS, LEVELS OF SERVICE, COST, AND PRELIMINARY RATE PROJECTIONS 5. Post-construction stormwater management 6. Pollution prevention In addition, EPA has been conducting program audits of the MS4 and CSO system components and the AWWTP and requiring additional evaluations and operational improvements. The details and cost estimates for each of these are provided in Section 3.3. This section is concerned with the overall administration of the permit. Table 3-4 summarizes the cost estimates for administering the permit. It is assumed that there is no difference in LOS. The same LOS for plan review is assumed because NPDES permit administrative costs do not vary. TABLE 3-4 Estimate NPDES AWWTP and CSO Permit Administration Costs Low Medium High NPDES Permit Administration for AWWTP and CSOs* $29,000 $29,000 $29,000 * Assumes Manager, Wastewater hrs / yr (for MS4) and City Engineer -- 6 hrs / wk = 312 hrs / yr Post Construction Stormwater Management Plan Review The Bureau of Planning, in conjunction with the Bureau of Engineering, reviews development plans and postconstruction stormwater management plans that accompany the development plan submittal for technical adequacy in reducing stormwater volume, rate, and pollutants. The same LOS for administration of plan review is assumed because plan review activities do not vary or increase according to LOS assumptions. TABLE 3-5 Estimate NPDES MS4 Permit Administration Costs Low Medium High Post-construction Stormwater Management Plan Review* $23,000 $23,000 $23,000 * Assumes Manager, Wastewater - 52 hrs / yr; City Engineer hrs / yr; Senior Planner hrs / yr. 3.2 Inspections and Maintenance Green Infrastructure The GI plan consists of the following project/program types: Green streets Park improvements / greening Disconnection, porous pavement Porous pavement, bioretention Vegetated roofs / disconnection Disconnection/rain gardens Enhanced tree planting Green schools The annual maintenance costs for these GI plan projects/programs are based on a percentage of capital costs (details are provided in Attachment C). Table 3-6 summarizes the annual LOS cost estimates for the fifth year of the program. It is assumed that these costs are phased in over a 5-year period. For example, the cost presented in Section 4 will show total first-year costs of $32,400 ($162,000/5) (medium LOS). The City does not currently provide maintenance for the GI Plan projects/programs, so there is no cost for the low LOS scenario. 3-4 ES BSS
117 SECTION 3 PROGRAM ELEMENTS FOR IMPERVIOUS AREA USER FEE TABLE 3-6 Annual Level of Service Cost Estimates for Green Infrastructure Inspections and Maintenance, for the Fifth Year of the Program GI Facility Type Low Medium High Green Streets $0 $29,000 $36,250 Park Improvements / Greening $0 $24,000 $30,000 Disconnection, Porous Pavement $0 $16,000 $20,000 Porous Pavement, Bioretention $0 $3,000 $3,750 Vegetated Roofs / Disconnection $0 $10,000 $12,500 Enhanced Tree Planting $0 $50,000 $62,500 Green Schools $0 $30,000 $37,500 Sub-total GI $0 $162,000 $202, Existing City-owned Stormwater Management Facilities The MS4 stormwater management program protocols developed by PA DEP specifies that municipally owned stormwater facilities (typically extended detention or retention ponds) be inspected and maintained to correct indentified deficiencies. As part of the Pollution Prevention MCM, the protocol calls for baseline inspection to document current conditions and required maintenance. As part the City s MS4 permit, municipally owned BMPs are required to be inspected. The City does not currently perform maintenance, nor does it currently inspect privately owned BMPs. Based on information provide the City, nine BMPs are inspected (Table 3-7). Based on feedback from the City staff, it takes 3 days to inspect these facilities. Table 3-8 provides estimated inspection costs. The same LOS for plan review is assumed because plan review activities do not vary. TABLE 3-7 BMPs inspected by the City ID # Project Owner Structural BMP 1 Lowes of Lancaster PR Lancaster, LP Detention Basins 2 Lancaster Leaf Lancaster Leaf Tobacco Co. of Lancaster Leaf Tobacco Co. of PA, Inc Constructed Wetland Constructed Wetland Infiltration Basins 3 George Washington Elementary School District of Lancaster Infiltration Basin & Detention Basin 4 Lafayette Elementary School School District of Lancaster Detention Basin & Infiltration Trench 5 Sheetz 1081 Dillerville Road, LP Underground Detention Basin 7 F&M New College House Franklin & Marshall College Stormwater Ponds, Swale 8 F&M Race Avenue F&M Race Avenue Parking Lot Franklin & Marshall College Vegetated Infiltration Beds & Porous Paving 10 Conestoga WTP Upgrade City of Lancaster Retention Basin and Swale 11 Armstrong Building 800 Expansion Armstrong World Industries Infiltration Basin, Detention Basin TABLE 3-8 Estimate Municipal Owned BMP Inspection Costs Low Medium High BMP inspection* $2,300 $2,300 $2,300 * Assumes Manager, Wastewater - 24 hrs / yr and vehicle costs. ES BSS 3-5
118 STORMWATER MANAGEMENT: PROGRAM NEEDS, LEVELS OF SERVICE, COST, AND PRELIMINARY RATE PROJECTIONS Street Sweeping The City conducts street sweeping for approximately 379 miles of streets. There are several routes maintained by the City (Table 3-9). Table 3-10 summarizes the LOS cost estimates for street sweeping. The details for street sweeping maintenance are provided in Attachment C. TABLE 3-9 Street Sweeping Routes Route Miles Frequency of Sweeping Normal Route (8) 151 2x per month Development Route 25 2x per month Alleys 45 2x per month Park City Route 22 2x per month 5 th Week Route 8 2x per month Downtown District 10 5x per week Miscellaneous Sweeping 118 2x per month Total 379 TABLE 3-10 Level of Service Cost Estimates for Street Sweeping Cost Item Cost/mile Low LOS* Medium LOS* High LOS^ Maintenance Cost $2.18 $24,900 $24,900 $34,600 Disposal Cost $4.03 $46,100 $46,100 $63,900 Fuel Costs $1.17 $13,400 $13,400 $18,600 Personnel $7.37 $84,400 $84,400 $117,000 Total $168,800 $168,800 $234,100 * Assumes Downtown District maintained 5 times per week, all other routes 2 times per month. ^ Assumes Downtown District maintained 5 times per week, all other routes 3 times per month Catch Basins and Inlets The City currently maintains 2,747 catch basin / inlets once a year. To perform this maintenance, two operators and one vactor truck operate 8 hours a day, 5 days a week. Sometimes a second vactor truck may be used. Table 3-11 summarizes the LOS cost estimates for catch basin and inlet cleaning and disposal. TABLE 3-11 Level of Service Cost Estimate for Catch Basin Low* Medium* High^ Maintenance Cost $2,000 $2,000 $4,000 Fuel Cost $5,000 $5,000 $10,000 Labor $134,000 $134,000 $268,000 Disposal Costs $60,000 $60,000 $120,000 Total Costs $201,000 $201,000 $402,000 * Assumes 2,747 catch basins maintained once per year; two operators and one vactor truck operating 8 hours a day, 5 days a week. ^ Assumes 2,747 catch basins maintained twice per year; two operators and one vactor truck operating 8 hours a day, 5 days a week. 3-6 ES BSS
119 SECTION 3 PROGRAM ELEMENTS FOR IMPERVIOUS AREA USER FEE This maintenance schedule helps the City achieve the MS4 permit Pollution Prevention MCM CSO / Wet-weather Facilities The City s Bureau of Wastewater Operations provides maintenance for the following CSO and wet-weather facilities: Diversion chambers Junction chambers Manholes Outfalls Pressure junction Pump station Force main sewer Gravity main sewer Flow monitoring The costs for maintaining these facilities are cost recovered by the Sewer Fund. For purposes of this study, it was assumed that the proposed IA service fee does not fund these maintenance activities. 3.3 NPDES Phase II Implementation (MS4 Permit) PA DEP issued guidance (protocols) to help municipalities comply with their MS4 permits. The following sections provide an overview of the protocols identified in PA DEP s guidance. Protocols are identified for each MCM Public Outreach and Education Protocols for public outreach and education include the following: Develop and update a Public Education Plan. Develop and update target audiences. Disseminate materials to all target audiences using appropriate distribution channels. Advertise in newspapers. In addition to these activities, outreach pertaining to incentives/credits for the IA service fee is conducted. This includes developing and providing dedicated materials explaining the incentives, how to calculate them, and how to apply. A detailed program was developed by LiveGreen and CH2M HILL public outreach specialists, and it is provided in Attachment D. Table 3-12 summarizes the LOS cost estimates for public outreach and education. TABLE 3-12 Level of Service Cost Estimates for Public Education MCM Public Education LOS 1 LOS 2 LOS 3 Assumed Avg Salary + Benefits $120,000 $120,000 $120,000 FTEs Salary + Benefits $12,692 $72,000 $108,000 Misc Expenses $3,000 $20,000 $28,000 Public Outreach and Education (MCM 1) $15,692 $92,000 $136, Public Participation / Involvement Protocols for public participation / involvement include the following: Develop public involvement plan. Notify and solicit public input/involvement on stormwater plan development and implementation ES BSS 3-7
120 STORMWATER MANAGEMENT: PROGRAM NEEDS, LEVELS OF SERVICE, COST, AND PRELIMINARY RATE PROJECTIONS Notify public as needed. Involve the public in the development and evaluation of alternatives. Obtain public input on the selection and implementation of the long-term plan. Table 3-13 provides LOS cost estimates for public participation / involvement, though some items are overlapping with Public Outreach and Education and are captured in Table The details for public participation / involvement are provided in Attachment D. TABLE 3-13 Level of Service Cost Estimates for Public Participation MCM Public Education LOS 1 LOS 2 LOS 3 Assumed Avg Salary + Benefits $120,000 $120,000 $120,000 FTEs Salary + Benefits $3,462 $12,000 $36,000 Misc Expenses $3,000 $3,000 $11,000 Public Outreach and Education (MCM 1) $6,462 $15,000 $47, Illicit Discharge Detection / Elimination Protocols for illicit discharge detection and elimination (IDDE) include the following: Develop a map of MS4, including outfalls and receiving surface water bodies. Complete mapping by Year 1. Establish priority areas for 25 percent of the system each year for years 2 through 5. Adopt/enact an ordinance that prohibits illicit discharges in Year 1. Implement and enforce ordinance years 2 through 5. Implement an IDDE program that includes field screening program/procedures and elimination of illicit discharges. Screening and corrective actions to remove illicit discharges occur in years 2 through 5. Conduct public awareness and reporting program (see also the Public Education and Outreach portion of this manual). In Year 1, distribute education material about the IDDE program. Continue distribution of education materials in years 2 through 5. Cost estimates for IDDE developed previously by CDM were reviewed and are summarized in Table Attachment D provides the source information from the CDM report. TABLE 3-14 Cost Estimates for Illicit Discharge Detection / Elimination Program CDM Estimate Item FTE Estimated Total Cost Map MS $8,650 Adopt/Enact an Ordinance that Prohibits 0.15 $7,150 Illicit Discharges Implement and Enforce IDDE ordinance 0.25 $12,750 Implement screening program for IDDE 0.15 $11,150 Conduct public awareness (CDM identifies employee training) 0.10 $14,100 Source: CDM Report, Attachment A Construction Site Runoff Control Protocols for construction site runoff control include the following: 3-8 ES BSS
121 SECTION 3 PROGRAM ELEMENTS FOR IMPERVIOUS AREA USER FEE If not already part of stormwater ordinance, enact, implement and enforce a stormwater control ordinance that requires the review of erosion and sediment control plans for earth disturbance of 1 acre or more in which runoff enter the MS4. Also applies to any earth disturbance of 5 acres or more regardless of the planned runoff. In addition, preparation of erosion and sediment control plans should be a prerequisite for obtaining land development plans and building permits. To assist in meeting the Public Education MCM, distribute educational materials to land developers with the applications for building permits and other land development/redevelopment permits or approvals. Cost estimates for construction site runoff control developed previously by CDM were reviewed and are summarized in Table Attachment D provides the source information from the CDM report. However, this function is currently provided by the Lancaster County Conservation District at no cost to the City of Lancaster, and is paid for through plan review fees assessed by the Conservation District. TABLE 3-15 Cost Estimates for Construction Site Runoff Control* CDM Estimate Item FTE Estimated Total Cost Review and adopt/enact an ordinance that 0.10 $5,100 requires erosion and sediment control plans for earth disturbance. Implement / enforce ordinance by requiring 0.50 $22,500 construction site operators to use BMPs to control erosion and sediment. Also, require the control waste that could impact water quality. Site plan review procedures for water 0.15 $8,650 quality impacts Develop procedures for public comments 0.10 $5,100 Site inspections 0.25 $11,250 Source: CDM Report, Attachment A. *Note: This function is provided by the Lancaster County Conservation District at no cost to the City of Lancaster, and is paid for through plan review fees assessed by the Conservation District City Planning inspects BMPs at completion for compliance with plans and Wastewater Operations inspects annually for the permit Post-construction Stormwater Management Protocols for post-construction stormwater management include the following: If not already part of stormwater ordinance, enact and implement ordinance that requires post-construction stormwater controls before approval of land development plans and building permits. If there is no PA DEP review of post-construction controls, coordinate with County Conservation District. The standard for design, construction, and maintenance of post-construction BMPs is to comply with Act 167. For each year, ensure that BMPs are built, operated, and maintained as designed. Cost estimates for post-construction stormwater management developed previously by CDM were reviewed and are summarized in Table Attachment D provides the source information from the CDM report. ES BSS 3-9
122 STORMWATER MANAGEMENT: PROGRAM NEEDS, LEVELS OF SERVICE, COST, AND PRELIMINARY RATE PROJECTIONS TABLE 3-16 Cost Estimates for Post-Construction Stormwater Management Item Implement strategies for BMPs (structural and non-structural). Adopt ordinance to address postconstruction runoff BMPs are built, operating, and maintained as designed. Source: CDM Report, Attachment A. FTE CDM Estimate Estimated Total Cost 0.15 $9, $5, $3, Pollution Prevention Protocols for pollution prevention include the following: Develop inventory of BMPs. Develop stormwater facility O&M program. Inspect municipally owned stormwater facilities. Develop a vehicle O&M program. Conduct employee training on O&M programs. Cost estimates for pollution prevention developed previously by CDM were reviewed and are summarized in Table Attachment D provides the source information from the CDM report. TABLE 3-17 Cost Estimates for Pollution Prevention Item FTE CDM Estimate Estimated Total Cost Develop O&M Program 0.25 $15,250 Conduct employee training on O&M 0.10 $14,100 programs Stormwater Inspectors 1 $123,000 Administrative 1 $152,862 Source: CDM Report, Attachment A. The Pollution Prevention MCM requires inspection of municipally owned BMPs. A separate cost estimate is provided in Section 3.2. In addition, the Pollution Prevention MCM requires maintenance (cleaning) of catch basins. A separate cost estimate is provided in Section Water Quality Monitoring (TMDL compliance) Water quality monitoring for compliance with TMDLs is conducted by PA DEP and is not assumed to be cost recovered by the IA user fee. 3.5 Flood Control and Floodplain Management Flood control and floodplain management typically refers to mapping of riverine flooding areas, such as might occur from overtopping the banks of the Conestoga River. The City does not currently have authority over those programs, which generally are administered by the Federal Emergency Management Agency. Therefore these are not assumed to incur costs that would be cost recovered by the IA user fee ES BSS
123 3.6 Wastewater Treatment SECTION 3 PROGRAM ELEMENTS FOR IMPERVIOUS AREA USER FEE As part of a separate analysis, CDM identified wet-weather flow treatment costs of $780,000 ( Stormwater Fee Structure Evaluation, March 23, 2011). This analysis estimated a wet-weather flow fee based on equivalent residential units (ERUs) and a program costs requirement of $748,565 (2011 dollars). Assuming total ERUs of approximately 62,000, this is a rate of $12.07 per ERU. The current feedback from the City is that treatment of wet-weather flows will be cost recovered by the Sewer Fund. 3.7 Capital Improvement Projects Green Infrastructure Program Table 3-18 summarizes capital cost estimates for GI projects. Because the GI is only just being implemented this year, the low LOS assumes no costs for GI projects. The medium LOS assumes public projects and the high LOS assumes public and private projects. For purposes of this study, it was assumed that these costs are equally distributed over 5 years (Tables 3-19 and 3-20). Details of the GI Program capital costs are provided in Attachment C. TABLE 3-18 Capital Cost Estimates for the Green Infrastructure Program Project / Program Type Estimated Capital Cost for Public Property (Medium LOS) 1 Estimated Capital Cost for Public and Private (High LOS) 2 Green Streets $2,650,000 $3,313,000 Park Improvements / Greening $999,000 $1,249,000 Disconnection, Porous Pavement $1,162,000 $1,453,000 Porous Pavement, Bioretention $140,500 $1,756,000 Vegetated Roofs / Disconnection $694,000 $2,340,000 Disconnection/Rain Gardens --- $3,276,000 Enhanced Tree Planting $2,875,000 $3,594,000 Green Schools $1,025,000 $1,281,000 1 Estimated construction costs for public property (e.g., rights-of-way, parks, sidewalks, schools, 10% of parking lots, and a portion of roofs) 2 Estimated capital/implementation costs includes an additional 25% for survey, site testing, design, construction oversight, etc. TABLE 3-19 Green Infrastructure Capital Costs (Medium LOS) Green Infrastructure Project Year 1 Year 2 Year 3 Year 4 Year 5 Total Green Streets $530,000 $530,000 $530,000 $530,000 $530,000 $2,650,000 Park Improvements / Greening $199,800 $199,800 $199,800 $199,800 $199,800 $999,000 Disconnection, Porous Pavement $232,400 $232,400 $232,400 $232,400 $232,400 $1,162,000 Porous Pavement, Bioretention $28,100 $28,100 $28,100 $28,100 $28,100 $140,500 Vegetated Roofs / Disconnection $138,800 $138,800 $138,800 $138,800 $138,800 $694,000 Enhanced Tree Planting $575,000 $575,000 $575,000 $575,000 $575,000 $2,875,000 Green Schools $205,000 $205,000 $205,000 $205,000 $205,000 $1,025,000 Total $1,909,100 $1,909,100 $1,909,100 $1,909,100 $1,909,100 $9,545,500 ES BSS 3-11
124 STORMWATER MANAGEMENT: PROGRAM NEEDS, LEVELS OF SERVICE, COST, AND PRELIMINARY RATE PROJECTIONS TABLE 3-20 Green Infrastructure Capital Costs (High LOS) Green Infrastructure Project Year 1 Year 2 Year 3 Year 4 Year 5 Total Green Streets $662,600 $662,600 $662,600 $662,600 $662,600 $3,313,000 Park Improvements / Greening $249,800 $249,800 $249,800 $249,800 $249,800 $1,249,000 Disconnection, Porous Pavement $290,600 $290,600 $290,600 $290,600 $290,600 $1,453,000 Porous Pavement, Bioretention $351,200 $351,200 $351,200 $351,200 $351,200 $1,756,000 Disconnection/Rain Gardens $468,000 $468,000 $468,000 $468,000 $468,000 $2,340,000 Vegetated Roofs / Disconnection $655,200 $655,200 $655,200 $655,200 $655,200 $3,276,000 Enhanced Tree Planting $718,800 $718,800 $718,800 $718,800 $718,800 $3,594,000 Green Schools $256,200 $256,200 $256,200 $256,200 $256,200 $1,281,000 Total $3,652,400 $3,652,400 $3,652,400 $3,652,400 $3,652,400 $18,262, CSO / Wet-weather Projects (Wastewater CIP) Based on feedback provide by the City staff, Table 3-21 provides a list of CIP projects related to CSO and wet weather. For purposes of this study, it was assumed that these projects are cost recovered by the Sewer Fund. Attachment E provides the details of the CIP for CSO and wet-weather projects. TABLE 3-21 CSO and Wet-weather CIP Projects ID Project Name 1a North Pumping Station (NPS) Expansion 1b NPS FM Surge Control System 2 NPS Basin Screening and Grit Removal Facility 3 NPS Basin CSO Diversion Chamber & Deflection Screen 4 WWTP Solids Dewatering & Maintenance Buildings Roof Replacements 5 NPS & SAPS Force Main Upgrade 6 WWTP Facilities Plan 7 North Pumping Station Sewershed Evaluation 8 Stevens Avenue Pumping Station Sewershed Evaluation 9 North PS CSO Storage 10 WWTP Upgrade/Expansion 11 WWTP Anoxic Zone Modifications 12 WWTP North Final Clarifier Drive Mechanisms 13 WWTP North A/O Building MCC and Primary Sludge Pumping Upgrade 14 WWTP North A/O Distribution Box Corrosion Repair 15 WWTP Chlorination Building MCC Upgrade 16 WWTP Oxygen Plant Instrumentation Upgrade 17 Collection System Improvements 18 Maple Grove Pumping Station Expansion 19 Engleside Sewershed 20 Stevens Ave & Engleside Bar Screen Replacement 21 Engleside CSO Parallel Outfall Culvert Catch Basin Rehabilitation and Replacement Based on feedback from the City staff, Table 3-22 summarizes estimated costs for catch basin rehabilitation and replacement, which are typically performed in conjunction with street repairs. The estimates are the same for all LOS alternatives ES BSS
125 SECTION 3 PROGRAM ELEMENTS FOR IMPERVIOUS AREA USER FEE TABLE 3-22 Catch Basin Rehabilitation and Replacement Catch Basin Year 1 Year 2 Year 3 Year 4 Year 5 Rehabilitation* $82,000 $82,000 $82,000 $82,000 $82,000 Replacement* $82,000 $82,000 $82,000 $82,000 $82,000 50% of 4 staff members total of $134,000 + $15,000 (fuel, vehicle maintenance) Combined and Separate Storm Sewer Rehabilitation and Replacement The City has an estimated 105 miles of storm sewer, with approximately 79 miles as part of the MS4 and 26 miles in the CSS. As this infrastructure ages, the storm sewers need to rehabilitated or replaced. Tables 3-23 and 3-24 summarize LOS cost estimates for the storm sewer rehabilitation or replacement. The City does not currently fund storm sewer rehabilitation or replacement, so cost estimates for the low LOS are not provided. Detailed cost estimates are provided in Attachment C. TABLE 3-23 Cost Estimates for Medium LOS Combined and Separate Storm Sewer Rehabilitation and Replacement Year 1 Year 2 Year 3 Year 4 Year 5 MS4 Rehabilitation* $667,000 $667,000 $667,000 $667,000 $667,000 Replacement^ $417,000 $417,000 $417,000 $417,000 $417,000 Information Management $2,000 $2,000 $2,000 $2,000 $2,000 CSS Rehabilitation* $220,000 $220,000 $220,000 $220,000 $220,000 Replacement^ $137,000 $137,000 $137,000 $137,000 $137,000 Information Management $1,000 $1,000 $1,000 $1,000 $1,000 *Assume 80% requires rehab every 100 years. ^Assume 20% requires rehab every 100 years. TABLE 3-24 Cost Estimates for High LOS Combined and Separate Storm Sewer Rehabilitation and Replacement MS4 Year 1 Year 2 Year 3 Year 4 Year 5 Rehabilitation* $890,000 $890,000 $890,000 $890,000 $890,000 Replacement^ $556,000 $556,000 $556,000 $556,000 $556,000 Information Management $3,000 $3,000 $3,000 $3,000 $3,000 CSS Rehabilitation* $293,000 $293,000 $293,000 $293,000 $293,000 Replacement^ $183,000 $183,000 $183,000 $183,000 $183,000 Information Management $1,000 $1,000 $1,000 $1,000 $1,000 *Assume 80% requires rehab every 75 years. ^Assume 20% requires rehab every 75 years Flood Control Master Planning Based on discussions with the City, it was assumed that the City has no immediate needs to develop a flood control master plan and therefore it was not assumed to be required for the IA user fee program. ES BSS 3-13
126
127 SECTION 4 Program Needs for Next 5 Years The program needs for the next 5 years for stormwater functions/services include O&M and capital costs. LOS cost estimates described in Section 3 were used define total program needs. LOS Alternative 1 Current LOS and MS4 permit implementation LOS Alternative 2 GI Plan implementation (public only), MS4 permit implementation, increased customer service LOS Alternative 3 GI Plan implementation (public and private), MS4 permit implementation, high level of customer service Figure 4-1 summarizes these estimates for the low, medium and high LOS evaluated during this study. FIGURE 4-1 Level of Service Program Needs for the Next 5 Years Total Estimate Annual Costs $8,000,000 $7,000,000 $6,000,000 $5,000,000 $4,000,000 High Medium Low $3,000,000 $2,000,000 $1,000,000 $ Year LOS Alternative 3 would provide cost recovery for a comprehensive program that includes preventive and corrective maintenance, inspection of facilities, additional CIP projects, including implementation of GI Plan elements on both public and private property. However, the resulting rate would be higher and may not be politically acceptable. LOS Alternative 1 provides only the bare bones program with very little advancement above the current program. The resulting rate could be nominal, but the services are not comprehensive. ES BSS 4-1
128 STORMWATER MANAGEMENT: PROGRAM NEEDS, LEVELS OF SERVICE, COST, AND PRELIMINARY RATE PROJECTIONS LOS Alternative 2 provides advancement above the current program, including implementation of GI Plan elements on public property. This alternative could be more acceptable because it attempts to provide a balance between the rates and the programs needed to comply with state and federal regulations. In addition to considering policies related to the program costs recoveredby the rate, related policy issues include debt financing of CIP and payment of existing debt service for current CIP. These issues will be addressed in a separate TM on rate structures and rates. 4.1 Low Level of Service LOS Alternative 1 (low LOS) consists of programs that are currently cost recovered by Public Works using General Fund resources. The current programs include items related to the City s existing MS4 permit and are geared toward satisfying the six MCMs. Table 4-1 summarizes the estimated program costs for the low LOS (Alternative 1). Underlying assumptions for each item are provided in Section 3. TABLE 4-1 Low Level of Service Cost Estimates O&M Year 1 Year 2 Year 3 Year 4 Year 5 GI Dry and Wet Ponds (inspection) $2,300 $2,300 $2,300 $2,300 $2,300 Street Sweeping $168,800 $168,800 $168,800 $168,800 $168,800 Catch Basin $201,000 $201,000 $201,000 $201,000 $201,000 Storm Drainage MS4 Implementation $452,000 $452,000 $452,000 $452,000 $452,000 Program Administration $142,000 $142,000 $142,000 $142,000 $142,000 Capital Costs GI $730,600 $730,600 $730,600 $730,600 $730,600 Storm Drainage Catch Basin Total $1,696,700 $1,696,700 $1,696,700 $1,696,700 $1,696, Medium Level of Service LOS Alternative 2 (medium LOS) consists of programs that are currently cost recovered by Public Works using General Fund resources, plus additional programs and greater LOS. The current programs include items related to the City s existing MS4 permit and are geared toward satisfying the six MCMs. In comparison to the low LOS, the medium LOS includes O&M for GI facilities constructed as part of the GI plan. There are no capital cost assumed for the low LOS, whereas capital costs for the public facilities identified in the GI Plan are included in the medium LOS. Capital costs related to rehabilitation and replacement of storm drains is also included. The medium LOS cost estimate in Year 5 is approximately $3,000,000 greater than the low LOS estimate and provides additional O&M for facilities and greater emphasis on capital projects. Table 4-2 summarizes the estimated program costs for the medium LOS (Alternative 2). Underlying assumptions for each item are provided in Section 3. TABLE 4-2 Medium Level of Service Cost Estimates O&M Year 1 Year 2 Year 3 Year 4 Year 5 GI $32,400 $64,800 $97,200 $129,600 $162,000 Dry and Wet Ponds (inspection) $2,300 $2,300 $2,300 $2,300 $2,300 Street Sweeping $168,800 $168,800 $168,800 $168,800 $168,800 Catch Basin $201,000 $201,000 $201,000 $201,000 $201,000 Storm Drainage MS4 Implementation $536,000 $536,000 $536,000 $536,000 $536, ES BSS
129 SECTION 4 PROGRAM NEEDS FOR NEXT 5 YEARS TABLE 4-2 Medium Level of Service Cost Estimates O&M Year 1 Year 2 Year 3 Year 4 Year 5 Program Administration $219,000 $219,000 $219,000 $219,000 $219,000 Capital Costs GI $1,909,100 $1,909,100 $1,909,100 $1,909,100 $1,909,100 Storm Drainage $1,444,000 $1,444,000 $1,444,000 $1,444,000 $1,444,000 Catch Basin $164,000 $164,000 $164,000 $164,000 $164,000 Total $4,676,600 $4,709,000 $4,741,400 $4,773,800 $4,806, High Level of Service LOS Alternative 3 (high LOS) consists of programs that are currently cost recovered by Public Works using General Fund resources plus additional programs and greater LOS. The current programs include items related to the City s existing MS4 permit and are geared toward satisfying the six MCMs. In comparison to the medium LOS, the high LOS includes additional O&M for green infrastructure facilities constructed on private property as part of the GI Plan, as well as capital costs for private and public facilities identified in the GI Plan. Capital costs related to a higher frequency of rehabilitation and replacement of storm drains is also included. The high LOS cost estimate in Year 5 is approximately $2,600,000 greater than the medium LOS and provides additional O&M for facilities and greater emphasis on capital projects. Table 4-3 summarizes the estimated program costs for the high LOS (Alternative 3). Underlying assumptions for each item are provided in Section 3. TABLE 4-3 High Level of Service Cost Estimates TABLE 4-3 High Level of Service Cost Estimates O&M Year 1 Year 2 Year 3 Year 4 Year 5 GI $40,500 $81,000 $121,500 $162,000 $202,500 Dry and Wet Ponds (inspection) $2,300 $2,300 $2,300 $2,300 $2,300 Street Sweeping $234,100 $234,100 $234,100 $234,100 $234,100 Catch Basin $402,000 $402,000 $402,000 $402,000 $402,000 Storm Drainage MS4 Implementation $612,000 $612,000 $612,000 $612,000 $612,000 Program Administration $296,000 $296,000 $296,000 $296,000 $296,000 Capital Costs GI $3,652,400 $3,652,400 $3,652,400 $3,652,400 $3,652,400 Storm Drainage $1,926,000 $1,926,000 $1,926,000 $1,926,000 $1,926,000 Catch Basin $164,000 $164,000 $164,000 $164,000 $164,000 Total $7,329,300 $7,369,800 $7,410,300 $7,450,800 $7,491,300 ES BSS 4-3
130
131 Attachment A Stormwater Utility Program Needs Policy Paper
132
133 Stormwater Utility Program Needs Policy Development Summary Lancaster, PA Policy Paper No. 1 Date Prepared: April 25, 2012 Date Revised: May 9, 2012 Date Final: September 13, 2012 Policy Issue: What is funded by the proposed Stormwater Utility? Overview There are several types of funding sources, which may include one or a combination of ad valorem taxes, grants, loans, and/or user charges. A stormwater utility is a funding mechanism that is dedicated for a variety of stormwater program elements, which may include conveyance, maintenance, and capital improvements. Currently, the City s General Fund and Sewer Fund are the source of funding for stormwater programs. In order to consider funding source, it is important to define the costs and level of service (LOS) for stormwater programs. The purpose of this policy paper is to define which program elements (Operations and Maintenance [O&M] and Capital Improvement Program [CIP]) should be funded by the proposed stormwater utility fee pursuant to Pennsylvania law. A stormwater utility can fund O&M and/or capital projects. O&M can include administrative costs, inspection/maintenance costs, billing/collection costs, and other stormwater-related functions. Capital project costs can include rehabilitation and replacement of stormwater facilities. Program elements that could be funded by the stormwater utility fee include the following: Capital Improvement Projects Green Infrastructure (GI) Program (Tables 5.9 and 5.10 from GI plan) Combined sewer overflow (CSO) / wet-weather-related projects from wastewater CIP (funding source = Sewer Fund) Catch Basin Rehabilitation and Replacement Storm Drain Rehabilitation and Replacement Stormwater / Drainage Master Plan CIP, for flood relief (not funded) Program Administration Billing and Collection Incentive/Credit Program (costs of administering program) Inspections and Maintenance GI Dry and Wet Ponds (inspection only, privately owned so not currently maintained by the City) Street Sweeping Catch Basin Drainage Ditch CSO / wet-weather facilities (funded by Sewer Fund) o Diversion Chambers o Junction Chambers o Manholes o Outfalls o Pressure Junction o Pump Station o Force Main Sewer o Gravity Main Sewer o Flow Monitoring National Pollutant Discharge Elimination System (NPDES) Phase II Implementation (Municipal Separate Storm Sewer System [MS4] Permit) Public Education Public Participation / Involvement Illicit Discharge Detection / Elimination Construction Site Runoff Control Post-Construction Stormwater Management Pollution Prevention Water Quality Monitoring (Total Maximum Daily Load compliance) Floodplain Management (not funded) Wastewater Treatment (funding source = Sewer Fund) Exhibits 1a- e provide summary tables of the LOS assumptions. Exhibit 2 shows the estimated maintenance costs by LOS. Exhibits 3a-c summarize the estimated capital costs for the low, medium, and high LOS options. Exhibits 4a-b summarize the estimated capital costs for the high LOS option. Exhibits 5a-b summarize overall capital and maintenance costs for three levels of service options. PAGE 1 OF 13
134 Stormwater Utility Program Needs Policy Development Summary Lancaster, PA Policy Paper No. 1 Date Prepared: April 25, 2012 Date Revised: May 9, 2012 Date Final: September 13, 2012 Policy Issue: What is funded by the proposed Stormwater Utility? Policy Options LOS Alternative 1 Current LOS and MS4 Permit Implementation LOS Alternative 2 GI Plan Implementation (public only), MS4 Permit Implementation, Increased Maintenance and Customer Service LOS Alternative 3 GI Plan Implementation, MS4 Permit Implementation, High Level of Maintenance and Customer Service Issues, Concerns, Benefits LOS Alternative 3 would provide funding for a comprehensive program that includes preventive and corrective maintenance, inspection of facilities, additional CIP projects, and drainage master planning. However, the rate per equivalent residential unit may not be politically acceptable. LOS Alternative 1 provides only the bare-bones program with very little advancement above the current program. The fee is nominal, but the services are not comprehensive. LOS Alternative 2 provides advancement above the current program, including implementation of GI Plan elements on public property. Related policy issues include debt financing of CIP and payment of existing debt service for current CIP. A separate policy decision will be needed on whether existing program elements funded by the Sewer Fund will be funded by an impervious area fee, or whether new program costs due to regulatory drivers would be paid by the fee. Advisory Committee Comments What is funded by the Program? The City clarified that currently the potable water consumption is used to apportion costs for all sewer-related City services, including stormwater management. Question: is the user fee going to just reapportion existing costs, or will it also pay for the increase in program costs due to new elements and LOS increases? Response: it was clarified that this is a key decision that needs to be made. But the purpose of considering low, medium, and high program costs in developing fees is to bracket likely choices in terms of what programs could be funded by the fee. It was indicated that there is an inequity in using the current water/sewer fee system (based on water usage) to pay for stormwater/cso issues, that are based on volume of runoff from each property. It was recommended to add flood relief to clarify the result of a stormwater/drainage master plan on the CIP list The City indicated that the CSO and treatment facility cost would remain in Sewer Fund Illicit discharge detection and elimination and cross-connections were discussed as a cost due to the need to inspect the system to locate cross-connected laterals, illegal connections, and sources of wet-weather flow into the sanitary sewer system, including sump pumps. It was suggested that we consider including a provision for expenses that we may not be thinking of (such as nutrient trading). The City clarified the role of the budget for nutrient credit purchase/sale in the sewer fund that provides the City with a cost benefit for its treatment of nutrients at the advanced wastewater treatment plant beyond the level required in its current allocation. PAGE 2 OF 13
135 Stormwater Utility Program Needs Policy Development Summary Lancaster, PA Policy Paper No. 1 Date Prepared: April 25, 2012 Date Revised: May 9, 2012 Date Final: September 13, 2012 Policy Issue: What is funded by the proposed Stormwater Utility? What LOS scenarios should be included in rate structure analysis? It was questioned whether the LOS would result in U.S. Environmental Protection Agency (EPA) acceptance of programs. Response: EPA rarely goes on record approving programs, so there s no certainty in what LOS is acceptable to meet EPA goals. The regulatory drivers for the program were discussed, including the uncertainties imposed by the EPA administrative order, the Total Maximum Daily Load, and future changes that are likely to occur in the City s MS4 permit. It was suggested to have an LOS between 2 and 3 to provide more granularity in options for LOS and to help clarify the understanding of the potential acceptability of the various Program components. It was suggested that LOS1 might be worth taking off the table. However, others pointed out that LOS1 illustrates the concept of the equity principle and is important to keep. The City indicated that the permit requirement is to clean once a year. Action - Fix LOS for street sweeping (CH2M HILL). Need to clarify the pollutant removal benefits of street sweeping (City has provided estimates for the Watershed Implementation Plan) It was noted that outreach could help reduce investments in ongoing street sweeping and inlet cleaning. Action - Need to include more intuitive metrics (CH2M HILL). Consultant Recommendation The consultant recommended LOS2 or greater. Decision/Action The GIAC recommended that dedicated funding options be investigated to provide at least the medium level of service, with a goal of moving towards the higher level of service. It was generally agreed that the current low level of service would not be adequate to meet regulatory requirements. PAGE 3 OF 13
136 EXHIBIT 1A Catch Basin (n = 1,910) LOS 1 LOS 2 LOS 3 Activity Number/ Linear feet Frequency Number/ Linear feet Frequency Number/ Linear feet Frequency Inlet Cleaning 2,747 1x per year 2,747 1x per year 2,747 2x per year Rehabilitation / Replacement 72 Per year 72 Per year 72 Per year EXHIBIT 1B Street Sweeping (~300 miles) LOS 1 LOS 2 (current funding) LOS 3 Activity Frequency Frequency Frequency Routes per month 2 per month 3 per month Development Route 2 per month 2 per month 3 per month Alleys 2 per month 2 per month 3 per month Park City Route 2 per month 2 per month 3 per month 5th Week Route 2 per month 2 per month 3 per month Downtown District 5 per week 5 per week 5 per week EXHIBIT 1C Storm Sewer (79 mi MS4, 26 mi CSS) LOS 1 LOS 2 LOS 3 Maintenance Activity Number/ Linear feet Frequency Number/ Linear feet Frequency Number/ Linear feet Frequency Current Funding Level Rehabilitation None N/A 80% 100 yrs 80% 75 yrs Replacement None N/A 20% 100 yrs 20% 75 yrs CSS = combined sewer system mi - miles PAGE 4 OF 13
137 EXHIBIT 1D GI Infrastructure (O&M) LOS 1 LOS 2 LOS 3 Vegetated Roof Inspection Activity Number/ Linear feet Frequency Number/ Linear feet Frequency Number/ Linear feet Frequency Maintenance 30,300 sf Per year 30,300 sf Per year Infiltration Trenches w/ Pretreatment Inlets Inspection Maintenance 115 ea Per year 115 ea Per year Porous Pavement Systems Inspection Maintenance 142,900 sf Per year 142,900 sf Per year Bioretention/Rain Gardens Inspection Maintenance 66,000 sf Per year 66,000 sf Per year Tree Plantings/Trenches Cisterns Inspection Maintenance 1,250 ea Per year 1,250 ea Per year Inspection Maintenance 5 ea Per year 5 ea Per year PAGE 5 OF 13
138 EXHIBIT 1E MS4 Implementation (6 minimum controls) LOS 1 LOS 2 LOS 3 Activity Number/ Linear feet Frequency Number/ Linear feet Frequency Number/ Linear feet Frequency Public Education Public Participation / Involvement Illicit Discharge Detection / Elimination Construction Site Runoff Control Post-Construction Stormwater Management Pollution Prevention PAGE 6 OF 13
139 EXHIBIT 2 Estimated Annual Inspection/Maintenance Costs Maintenance Low Medium* High* Green Infrastructure Green Streets $29,000 $36,250 Park Improvements / Greening $24,000 $30,000 Disconnection, Porous Pavement $16,000 $20,000 Porous Pavement, Bioretention $3,000 $3,750 Vegetated Roofs / Disconnection $10,000 $12,500 Disconnection/Rain Gardens Enhanced Tree Planting $50,000 $62,500 Green Schools $30,000 $37,500 Sub-total Green Infrastructure $162,000 $202,500 Dry and Wet Ponds (inspection only) $2,300 $2,300 $2,300 Street Sweeping $168,800 $168,800 $234,100 Catch Basin $201,000 $201,000 $402,000 Storm Drainage n/a n/a n/a MS4 Implementation Public Education $15,692 $92,000 $136,000 Public Participation / Involvement $6,462 $15,000 $47,000 Illicit Discharge Detection / Elimination $53,800 $53,800 $53,800 Construction Site Runoff Control [1] $52,600 $52,600 $52,600 Post-Construction Stormwater Management $17,800 $17,800 $17,800 Pollution Prevention $305,212 $305,212 $305,212 Program Administration Billing and Collection $90,000 $90,000 $90,000 Incentive/Credit Program n/a $77,000 $154,000 NPDES permit $29,000 $29,000 $29,000 Plan Review $23,000 $23,000 $23,000 *GI Plan annual maintenance costs are for the fifth year of GI implementation. [1] This function is provided by the Lancaster County Conservation District at no cost to the City of Lancaster, and is paid for through plan review fees assessed by the Conservation District. PAGE 7 OF 13
140 EXHIBIT 3A Capital Costs (Low LOS) Year 1 Year 2 Year 3 Year 4 Year 5 Green Infrastructure Green Streets $132,600 $132,600 $132,600 $132,600 $132,600 Park Improvements / Greening $50,000 $50,000 $50,000 $50,000 $50,000 Disconnection, Porous Pavement $58,200 $58,200 $58,200 $58,200 $58,200 Porous Pavement, Bioretention $70,200 $70,200 $70,200 $70,200 $70,200 Vegetated Roofs / Disconnection $93,600 $93,600 $93,600 $93,600 $93,600 Disconnection/Rain Gardens $131,000 $131,000 $131,000 $131,000 $131,000 Enhanced Tree Planting $143,800 $143,800 $143,800 $143,800 $143,800 Green Schools $51,200 $51,200 $51,200 $51,200 $51,200 Storm Drainage MS4 Rehabilitation Replacement Information Management CSS Rehabilitation Replacement Information Management Catch Basin Rehabilitation $82,000 $82,000 $82,000 $82,000 $82,000 Replacement $82,000 $82,000 $82,000 $82,000 $82,000 Total $894,600 $894,600 $894,600 $894,600 $894,600 PAGE 8 OF 13
141 EXHIBIT 3B Capital Costs (Medium LOS) Year 1 Year 2 Year 3 Year 4 Year 5 Green Infrastructure Green Streets $530,000 $530,000 $530,000 $530,000 $530,000 Park Improvements / Greening $199,800 $199,800 $199,800 $199,800 $199,800 Disconnection, Porous Pavement $232,400 $232,400 $232,400 $232,400 $232,400 Porous Pavement, Bioretention $28,100 $28,100 $28,100 $28,100 $28,100 Vegetated Roofs / Disconnection $138,800 $138,800 $138,800 $138,800 $138,800 Disconnection/Rain Gardens $0 $0 $0 $0 $0 Enhanced Tree Planting $575,000 $575,000 $575,000 $575,000 $575,000 Green Schools $205,000 $205,000 $205,000 $205,000 $205,000 Storm Drainage MS4 Rehabilitation $667,000 $667,000 $667,000 $667,000 $667,000 Replacement $417,000 $417,000 $417,000 $417,000 $417,000 Information Management $2,000 $2,000 $2,000 $2,000 $2,000 CSS Rehabilitation $220,000 $220,000 $220,000 $220,000 $220,000 Replacement $137,000 $137,000 $137,000 $137,000 $137,000 Information Management $1,000 $1,000 $1,000 $1,000 $1,000 Catch Basin Rehabilitation $82,000 $82,000 $82,000 $82,000 $82,000 Replacement $82,000 $82,000 $82,000 $82,000 $82,000 Total $3,517,100 $3,517,100 $3,517,100 $3,517,100 $3,517,100 PAGE 9 OF 13
142 EXHIBIT 3C Estimated Capital Costs for Medium LOS $4,000,000 $3,500,000 $3,000,000 $2,500,000 $2,000,000 $1,500,000 Catch Basin Storm Drainage Green Infrastructure $1,000,000 $500,000 $ Year PAGE 10 OF 13
143 EXHIBIT 4A Capital Costs (High LOS) Year 1 Year 2 Year 3 Year 4 Year 5 Green Infrastructure Green Streets $662,600 $662,600 $662,600 $662,600 $662,600 Park Improvements / Greening $249,800 $249,800 $249,800 $249,800 $249,800 Disconnection, Porous Pavement $290,600 $290,600 $290,600 $290,600 $290,600 Porous Pavement, Bioretention $351,200 $351,200 $351,200 $351,200 $351,200 Vegetated Roofs / Disconnection $468,000 $468,000 $468,000 $468,000 $468,000 Disconnection/Rain Gardens $655,200 $655,200 $655,200 $655,200 $655,200 Enhanced Tree Planting $718,800 $718,800 $718,800 $718,800 $718,800 Green Schools $256,200 $256,200 $256,200 $256,200 $256,200 Storm Drainage MS4 Rehabilitation $890,000 $890,000 $890,000 $890,000 $890,000 Replacement $556,000 $556,000 $556,000 $556,000 $556,000 Information Management $3,000 $3,000 $3,000 $3,000 $3,000 CSS Rehabilitation $293,000 $293,000 $293,000 $293,000 $293,000 Replacement $183,000 $183,000 $183,000 $183,000 $183,000 Information Management $1,000 $1,000 $1,000 $1,000 $1,000 Catch Basin Rehabilitation $82,000 $82,000 $82,000 $82,000 $82,000 Replacement $82,000 $82,000 $82,000 $82,000 $82,000 Total $5,637,400 $5,637,400 $5,637,400 $5,637,400 $5,637,400 PAGE 11 OF 13
144 EXHIBIT 4B Estimated Capital Costs for High LOS $7,000,000 $6,000,000 $5,000,000 $4,000,000 $3,000,000 Catch Basin Storm Drainage Green Infrastructure $2,000,000 $1,000,000 $ Year EXHIBIT 5A Estimated Annual Costs Low Medium High Operating and Maintenance Green Infrastructure* n/a $162,000 $202,500 Dry and Wet Ponds (inspection $2,300 $2,300 $2,300 Street Sweeping $168,800 $168,800 $234,100 Catch Basin $201,000 $201,000 $402,000 Storm Drainage n/a n/a n/a MS4 Implementation $451,566 $536,412 $612,412 Program Administration $142,000 $219,000 $296,000 Capital Costs Green Infrastructure $730,600 $1,909,100 $3,652,400 Storm Drainage n/a $1,444,000 $1,926,000 Catch Basin $164,000 $164,000 $164,000 Total $1,860,266 $4,806,612 $7,491,712 *GI Plan annual maintenance costs are for the fifth year of GI implementation. PAGE 12 OF 13
145 EXHIBIT 5B Total Estimate Annual Costs $8,000,000 $7,000,000 $6,000,000 $5,000,000 $4,000,000 High Medium Low $3,000,000 $2,000,000 $1,000,000 $ Year PAGE 13 OF 13
146
147 Attachment B Program Administration Costs
148
149 Estimate Program Administration Costs Hours Per Year Manager City Engineer Planner Total NPDES permit Plan Review Total Hours Estimate Program Costs Manager City Engineer Planner Total NPDES permit $ 6,925 $ 21,912 $ - $ 29,000 Plan Review $ 3,001 $ 7,304 $ 12,390 $ 23,000 Total Estimated Program Costs $ 9,926 $ 29,216 $ 12,390 $ 52,000
150
151 Estimated Administrative Costs for Credits and Incentives Program Level of Service Item Low Medium High Progarm Adminstration [1] $ - $ 43,000 $ 86,000 Program Inspector [2] $ - $ 34,000 $ 68,000 Total $ - $ 77,000 $ 154,000 [1] Medium LOS assumes 0.5 FTE of Senior Planner, High LOS assumes 1 FTE of Senior Planner [2] Medium LOS assumes 0.5 FTE of Inspector, High LOS assumes 1 FTE of Inspector, 1 FTE = $68,000
152 .
153 2012 PAC COSTS AND ALLOCATED COSTS 2012 ALLOCATED COSTS TABLE GF Water Sewer Trash Housing Police TYPE OF ALLOCATION GF/Water/Sewer/Trash Allocation % % A % % % % PAC/Police/Water/Sewer/Trash Allocation % % P 9.390% % % % 8.470% General Fund Only % B % Water/Sewer/Trash Allocation % % C % % % Water/Sewer Allocation % % D % % 2012 ALLOCATED COSTS TABLE GF Water Sewer Trash Housing Police Salary --Bureau Chief Bureau Chief J Rhinier 61,025 10,899 27,415 12,026 10, Total Salary--Bureau Chief 61,025 10,899 27,415 12,026 10, Salary--Personnel CC Supervisor J Taylor 44,037 A 7,865 19,784 8,678 7,710 Admin Support Supv-PROMOTION M Dunn 41,305 A 7,377 18,556 8,140 7,232 CCC D McCLymont 39,630 A 7,078 17,804 7,809 6,939 Data Coord D Kilhefner 41,310 A 7,378 18,559 8,141 7,233 CCC C Kelly 38,953 A 6,957 17,500 7,676 6,820 Utility Service Coordinator R Maldonado 34,526 D - 23,999 10,527 - CCC L Parson 39,731 A 7,096 17,849 7,829 6,957 Cashier F Peters 35,146 A 6,277 15,789 6,926 6,154 Cashier Z Burgos 31,691 A 5,660 14,237 6,245 5,549 Billing Coordinator D Toy Rebert 34,979 A 6,247 15,714 6,893 6,124 Revenue Clerk V Kong Chiem 33,779 A 6,033 15,175 6,656 5,914 Mail Clerk Vacant 30,409 A 5,431 13,661 5,992 5,324 CCC---NEW Vacant 36,541 A 6,526 16,416 7,201 6,398 Admin Support Clert--NEW Vacant 31,689 A 5,660 14,236 6,245 5,548 Data Entry O Nguyen 12,396 A 2,214 5,569 2,443 2, Total Salary--Personnel 526,122 87, , ,401 86, Temporary Employee Temporary Cashier - A Total Temporary Employee
154 2012 PAC COSTS AND ALLOCATED COSTS 2012 ALLOCATED COSTS TABLE GF Water Sewer Trash Housing Police TYPE OF ALLOCATION GF/Water/Sewer/Trash Allocation % % A % % % % PAC/Police/Water/Sewer/Trash Allocation % % P 9.390% % % % 8.470% General Fund Only % B % Water/Sewer/Trash Allocation % % C % % % Water/Sewer Allocation % % D % % 2012 ALLOCATED COSTS TABLE GF Water Sewer Trash Housing Police Overtime 250 B 250 Total Overtime Rental of Uniforms Shirts for Mail Clerk Mail Clerk 460 A Total Rental of Uniforms Equipment Maintenance Conestoga Business Systems Time Clock 125 A Frasier PAC Copier 780 A OPEX Mail Machine 11,090 A 1,981 4,982 2,185 1,942 BARSA (3yr maint pd in 2011) IBM Infoprint - A NMS Imaging Imaging 1,255 A RP Solutions RP Machine 6,344 A 1,133 2,850 1,250 1,111 CS Electronics Tadiran Phone Sys Phone Module 1,800 A Miscellaneous Repair 250 B Total Equipment Maintenance 21,644 4,071 9,611 4,216 3, Dues & Subscriptions NIGP Dues Government Finance County Co-Op Dues PLCM Dues Pa Public PAC--Rhinier Pa Public PAC--Dunn 15 15
155 2012 PAC COSTS AND ALLOCATED COSTS 2012 ALLOCATED COSTS TABLE GF Water Sewer Trash Housing Police TYPE OF ALLOCATION GF/Water/Sewer/Trash Allocation % % A % % % % PAC/Police/Water/Sewer/Trash Allocation % % P 9.390% % % % 8.470% General Fund Only % B % Water/Sewer/Trash Allocation % % C % % % Water/Sewer Allocation % % D % % 2012 ALLOCATED COSTS TABLE GF Water Sewer Trash Housing Police Pcard Fee--Rhinier Pcard Fee--Dunn Total Dues & Subscriptions Postage Real Estate Taxes 10,320 10,320 Housing 26,193 26,193 Fire 591 Water/Sewer 105,699 D 73,471 32,227 Trash 28,984 28,984 Police 17,707 17,707 Miscellaneous GF Bills 1,939 1,939 Post Office Box A Post Office Box A Bulk Mail Permit Fee 399 A PAC Office Postage 1,200 1, Total Postage 193,940 13,693 74,058 32,485 29,213 26,193 17,707 Printing # 9 Regular 24 WW 10,490 P ,712 2,067 1, #10 Window 24 WW Blue Ink 10,868 P 1,020 4,882 2,142 1, White Laser Paper 7,072 P 664 3,177 1,394 1, Zip-4 Software Annual Fee 2,400 A 429 1, Applications for Water Service Cards 1,000 C Pitney Bowes Supplies 1,850 A Total Printing 33,679 3,429 15,376 6,745 5,722-2,408
156 2012 PAC COSTS AND ALLOCATED COSTS 2012 ALLOCATED COSTS TABLE GF Water Sewer Trash Housing Police TYPE OF ALLOCATION GF/Water/Sewer/Trash Allocation % % A % % % % PAC/Police/Water/Sewer/Trash Allocation % % P 9.390% % % % 8.470% General Fund Only % B % Water/Sewer/Trash Allocation % % C % % % Water/Sewer Allocation % % D % % 2012 ALLOCATED COSTS TABLE GF Water Sewer Trash Housing Police Telephone Regular Phone Costs 5,520 A 986 2,480 1, Total Telephone 5, ,480 1, Travel Pappa Meetings 200 A Co-Op Meetings 50 A 50 Total Travel Miscellaneous Repairs not covered by Contract 250 A 250 Total Miscellaneous Training/School Tuition Reimbursement - A Total Training/School Office Supplies PAC Office Supplies 10,000 A 1,786 4,493 1,971 1, Total Office Supplies 10,000 1,786 4,493 1,971 1, Minor Equipment Frasier--Copier w/fax Rental 1,464 A Replacement Printers 700 A Replacement Calculators 200 A
157 2012 PAC COSTS AND ALLOCATED COSTS 2012 ALLOCATED COSTS TABLE GF Water Sewer Trash Housing Police TYPE OF ALLOCATION GF/Water/Sewer/Trash Allocation % % A % % % % PAC/Police/Water/Sewer/Trash Allocation % % P 9.390% % % % 8.470% General Fund Only % B % Water/Sewer/Trash Allocation % % C % % % Water/Sewer Allocation % % D % % 2012 ALLOCATED COSTS TABLE GF Water Sewer Trash Housing Police Receipt Printers 400 A Scanners (check) 850 A OPEX/RP Machine Lease 21,162 A 3,780 9,507 4,170 3,705 Pitney Bowes Mail Machine 27,204 A 4,859 12,221 5,361 4,763 Pitney Bowes Mail Steam Upgrade 13,680 A 2,443 6,146 2,696 2, Total Minor Equipment 65,660 11,727 29,498 12,939 11, TOTAL 919, , , , ,733 26,193 20,115
158
159 Attachment C Inspection and Maintenance Cost Estimates
160
161 Med_LOS 1 of 2 Miles of Pipe (MS4) 79 Miles of Pipe (CSS) 26 Linear feet of Storm Drain 554,400 Routine Maintenance Assumptions for Storm Drain Frequency (years between maintenance events) (A) Staff Cost/8 hour day (B) Linear Feet / day (C) Materials & Incidentals (D) (dollars per lf) % storm drain (LF) Per Year That Is Budgeted for Rehabilitation/ Replacement Rehabilitation MS $ % Rehabilitation CSS $ % Replacement MS $ % Replacement CSS $ % Information Management (Rehabilitation) $ % Information Management (Replacement) $ % LF of Storm Drain Maintained per Estimated Annual Costs (assumes 3% inflation) year that is budgeted for maintenance Year 1 Year 2 Year 3 Year 4 Year 5 Rehabilitation MS4 3,337 $ 667,392 $ 687,414 $ 708,036 $ 729,277 $ 751,156 Rehabilitation CSS 1,098 $ 219,648 $ 226,237 $ 233,025 $ 240,015 $ 247,216 Replacement MS4 834 $ 417,120 $ 429,634 $ 442,523 $ 455,798 $ 469,472 Replacement CSS 275 $ 137,280 $ 141,398 $ 145,640 $ 150,010 $ 154,510 Information Management (MS4) 4,171 $ 2,086 $ 2,148 $ 2,213 $ 2,279 $ 2,347 Information Management (CSS) 1,373 $ 686 $ 707 $ 728 $ 750 $ 773 $ 1,444,212 $ 1,487,538 $ 1,532,165 $ 1,578,129 $ 1,625,473 Rehabilitation CSS Replacement MS4 $ 1,444,000 $ 1,488,000 $ 1,532,000 $ 1,578,000 $ 1,625,000
162 High_LOS 2 of 2 Miles of Pipe (MS4) 79 Miles of Pipe (CSS) 26 Linear feet of Storm Drain 554,400 Routine Maintenance Assumptions for Storm Drain Frequency (years between maintenance events) (A) Staff Cost/8 hour day (B) Linear Feet / day (C) Materials & Incidentals (D) (dollars per lf) % storm drain (LF) Per Year That Is Budgeted for Rehabilitation/ Replacement Rehabilitation MS $ % Rehabilitation CSS $ % Replacement MS $ % Replacement CSS $ % Information Management (Rehabilitation) $ % Information Management (Replacement) $ % LF of Storm Drain Maintained per Estimated Annual Costs (assumes 3% inflation) year that is budgeted for maintenance Year 1 Year 2 Year 3 Year 4 Year 5 Rehabilitation MS4 4,449 $ 889,856 $ 916,552 $ 944,048 $ 972,370 $ 1,001,541 Rehabilitation CSS 1,464 $ 292,864 $ 301,650 $ 310,699 $ 320,020 $ 329,621 Replacement MS4 1,112 $ 556,160 $ 572,845 $ 590,030 $ 607,731 $ 625,963 Replacement CSS 366 $ 183,040 $ 188,531 $ 194,187 $ 200,013 $ 206,013 Information Management (MS4) 5,562 $ 2,781 $ 2,864 $ 2,950 $ 3,039 $ 3,130 Information Management (CSS) 1,830 $ 915 $ 943 $ 971 $ 1,000 $ 1,030 $ 1,925,616 $ 1,983,384 $ 2,042,886 $ 2,104,173 $ 2,167,298 $ 1,926,000 $ 1,983,000 $ 2,043,000 $ 2,104,000 $ 2,167,000
163 Catch Basin Maintenance Costs Level of Service Inlets Maintenance Cost Fuel Cost Labor Disposal Costs Total Costs Crew / Equipment Low LOS (inlets once per year) 2747 $2,000 $5,000 $134,000 $60,000 $201,000 2 operators, 1 vac truck Medium LOS (inlets once per year) 2747 $2,000 $5,000 $134,000 $60,000 $201,000 2 operators, 1 vac truck High LOS (inlets 2x per year) 2747 $4,000 $10,000 $268,000 $120,000 $402,000 4 operators, 2 vac truck
164
165 Inventory of BMPs inspected as required by NPDES Permit ID # Project Structural BMP BMP Street Address 1 Lowes of Lancaster Detention Basins 1801 Hempstead Road, Lancaster, PA Lancaster Leaf Constructed Wetland Constructed Wetland 209 Pitney Road,209 Pitney Road, Lancaster, PA George Washington Elementary Infiltration Basin & Detention Basin 545 South Ann Street, Lancaster, PA Lafayette Elementary School Detention Basin & Infiltration Trench 1000 St. Joseph Street, Lancaster, PA Sheetz Underground Detention Basin 1080 Dillerville Road, Lancaster, PA F&M New College House Stormwater Ponds, Swale 601 College Avenue, Lancaster, PA (Race and Harrisb 8 F&M Race AvenueF&M Race Avenue Parking Lot Vegetated InfiltrationVegetated Infiltration B 601 College Avenue, Lancaster, PA (RaceLancaster, 10 Conestoga WTP Upgrade Retention Basin and Swale 150 Pitney Road, Lancaster, PA Armstrong Building 800 Expansion Infiltration Basin, Detention Basin 1215 Loop Road, Lancaster, PA Estimated Annual BMP Inspection Costs assume 3 days to complete inspection, document BMP facilities deficiencies and mail letters 1 person (annual salary of $120,000) $ 2,000 vehicle $ 300 Total Estimated Annual BMP Inspection Costs $ 2,300
166
167 City of Lancaster Street Cleaning Costs Year 2011 There are three (3) street sweepers running Monday thru Friday, one of them sweeping the downtown are nightly, one is a relief sweeper. Sweeper #111: ran 857 hours 3375 miles Cost for maintenance - $1, Cost for Fuel $4, Sweeper #118: ran 1027 hours 3988 miles Cost for maintenance - $14, Cost for Fuel $4, Sweeper #129: ran 548 hours 2293 miles Cost for maintenance - $1, Cost for Fuel $2,082,05 Sweeper #133: ran 380 hours 1791 miles Cost for maintenance - $7, Cost for Fuel $2, Three (3) Street Sweeper Operators: Operator #1 hourly $17.19 annually $35, Operator #2 hourly $18.60 annually $38, Operator #3 hourly $17.15 annually $35, *Fringe Benefit rate for 2011 was 69.9% Sweeper Debris: tons 2, cubic yards $46, total cost for the year
168 Routes: Route #1 Route #2 Route #3 Route #4 Route #5 Route #6 Route #7 Route #8 16 miles 12 miles 33. Miles 18 miles 20 miles 15.5 miles 19 miles 17 miles Development Route 25 miles Alleys 45 miles Park City Route 22 miles 5 th Week Route 8 miles Downtown District 10 miles *all routes are swept twice per month except for the Downtown District which is swept 5 nights per week.
169 Hours Miles Maintenance Cost Fuel Cost Labor Disposal Costs Total Costs Sweeper # ,375 $1,952 $4,670 $25,710 $13,599 $45,931 Sweeper # ,988 $14,186 $4,548 $30,810 $16,068 $65,612 Sweeper # ,293 $1,604 $2,082 $16,440 $9,239 $29,365 Sweeper # ,791 $7,189 $2,111 $11,400 $7,216 $27,917 Total ,447 $24,930 $13,412 $84,360 $46,122 $168,825 Debris Disposal cost $46,122 tons cubic yards 2, tons per mile $ / ton $76 Maintenance Cost/mile $2.18 Disposal Cost/mile $4.03 Fuel Costs/mile $1.17 Labor Cost/mile $7.37 Operator #1 $ $60,748 $ % Operator #2 $ $65,731 $ % Operator #3 $ $60,607 $ % $ $187,086 Low Medium (current) High Route Miles Frequency Time Period Miles Frequency Time Period Miles Frequency Time Period Miles Route # month month month 576 Route # month month month 432 Route # month month month 1,188 Route # month month month 648 Route # month month month 720 Route # month month month 558 Route # month month month 684 Route # month month month 612 Development Route 25 2 month month month 900 Alleys 45 2 month 1,080 2 month 1,080 3 month 1,620 Park City Route 22 2 month month month th Week Route 8 2 month month month 288 Downtown District 10 5 week 2,600 5 week 2,600 5 week 2,600 Misc. Sweeping to fill 2011 mile gap month 2,835 2 month 2,835 3 month 4,253 Total ,447 11,447 15,871 Cost Item Cost/mile Low LOS Medium LOS High LOS Maintenance Cost $2.18 $24,900 $24,900 $34,600 Disposal Cost $4.03 $46,100 $46,100 $63,900 Fuel Costs $1.17 $13,400 $13,400 $18,600 Personnel $7.37 $84,400 $84,400 $117,000 Total $168,800 $168,800 $234,100 Route Miles Frequency of Sweeping Normal Route (8) 151 2x per month Development Route 25 2x per month Alleys 45 2x per month Park City Route 22 2x per month 5 th Week Route 8 2x per month Downtown District 10 5x per week Miscellaneous Sweeping 118 2x per month Total 379
170
171 General Green Infrastructure Type Unit Estimated Quantity for GI Plan, 5 year Implementation Estimated Annual Maintenance Costs Maintenance Cost Assumptions Quantity Assumptions Vegetated Roof SF 30,300 $10,000 Jorg: $0.10 $0.30/SF. Assume estimated quantity for PENNVEST (PV) is the total for the 5 year period Infiltration Trenches w/ Pretreatment Inlets EA 115 $29,000 OC Memo [$200/inlet/year plus $500 for flushing 10% per year] Assume all of streets/alleys category with 1 inlet per 1000 SF of GI (based on PV projects) Porous Pavement Systems SF 142,900 $33,000 4 x OC Memo [$500/acre/year ($0.011/SF) for vacuuming + Assume all of sidewalk GI plus half of parks $0.02/SF for pavement patching] plus $250 per 2500 SF and schools plus 10% of parking lot GI (inlet cleaning/mobilization) 5 times OC Memo plus $500 per 1000 SF area for Bioretention/Rain Gardens SF 66,000 $38,000 mobilization (OC Memo: ~1.4 person hour/2500 Assume half of parks and schools GI $25/hour ($0.014/SF)) Tree Plantings/Trenches EA 1250 $50,000 $40/year assumed based on conversations with OC arborist Directly from GI Plan (250 trees/year) Cisterns EA 5 $3,000 $500/cistern/year assumed Assume 1 cistern per year Total $163,000 Estimated Total Construction Cost $8,850,000 Total of 5 public GI programs plus 10% of parkin Annual Maintenance Cost (% of Total Construction Cost) 1.84% 11
172 General Green Infrastructure Type Unit Estimated Quantity for Public PENNVEST Projects Estimated Annual Maintenance Costs Source Vegetated Roof SF 30,300 $9,100 Infiltration Trenches w/ Pretreatment Inlets EA 32 $10,400 Jorg: $0.10 $0.30/SF. OC Memo [$75/1000SF/year ($0.075/SF) for weeding and $0.04/SF for fertilization] plus $250 per roof for mobilization OC Memo [$200/inlet/year plus $500 (+40% TBD) for flushing 1 system per year] SF 31,200 $3,500 2 x OC Memo [$500/acre/year ($0.012/SF) for vacuuming + $0.02/SF for pavement patching] Porous Pavement Systems plus $500 per event (2 times per year) SF 8,700 $2,900 4 times OC Memo plus $300 per area for mobilization (OC Memo: ~1.4 person hour/2500 Bioretention/Rain Gardens $25/hour ($0.014/SF)) EA 57 $4,300 OC Memo wasn't clear (maybe $100/year for mulch and pruning?), so $75/year assumed (also based on informal conversations with OC Tree Plantings/Trenches arborist) Cisterns EA 3 $1,500 $500/cistern/year assumed. Total $32,000 Approximate Total Construction Cost $3,000, %
173 ESTIMATED PUBLIC CONSTRUCTION, CAPITAL, AND MAINTENANCE COSTS FOR 5 YEAR GREEN INFRASTRUCTURE IMPLEMENTATION Area / Impervious Source Green Infrastructure Project / Program Type Area / Number of Green Infrastructure (ac. or no.) Total Marginal Cost Estimated Cost from GI Plan 1 Estimated Cost from GI Plan w/ Contingency 2 Estimated Construction Cost for Public Property 3 Estimated Capital/ Implementation Cost 4 Estimated Annual Public GI Maintenance Cost, Med LOS Estimated Annual Public GI Maintenance Cost, High LOS Roads / Alleys Green Streets 2.64 $1,728,000 $2,304,000 $2,650,000 $2,650,000 $3,313,000 $29,000 $36,250 Parks Park Improvements / Greening 1.33 $435,000 $869,000 $999,000 $999,000 $1,249,000 $24,000 $30,000 Sidewalks Disconnection, Porous Pavement 1.55 $505,000 $1,010,000 $1,162,000 $1,162,000 $1,453,000 $16,000 $20,000 Parking Lots Porous Pavement, Bioretention 2.16 $611,000 $1,222,000 $1,405,000 $140,500 $1,756,000 $3,000 $3,750 Flat Roofs Vegetated Roofs / Disconnection 2.08 $452,000 $1,628,000 $1,872,000 $694,000 $2,340,000 $10,000 $12,500 Sloping Roofs Disconnection/Rain Gardens 3.27 $1,709,000 $2,279,000 $2,621,000 $3,276,000 Street Trees Enhanced Tree Planting 1250 $625,000 $2,500,000 $2,875,000 $2,875,000 $3,594,000 $50,000 $62,500 Public Schools Green Schools 1.70 $445,000 $891,000 $1,025,000 $1,025,000 $1,281,000 $30,000 $37,500 Various (Ordinance) Revised First Flush Ordinance $1,290,000 $1,290,000 $1,484,000 $1,855,000 TOTAL $7,800,000 $13,990,000 $16,090,000 $9,550,000 $20,120,000 $162,000 $203,000 1 Estimated costs from the Green Infrastructure Plan which did not include contingency or design/engineering costs 2 Estimated costs from the Green Infrastructure Plan including a 15% allowance for contingency 3 Estimated construction costs for public property (e.g., ROW, parks, sidewalks, schools, 10% of parking lots, and a portion of roofs) 4 Estimated capital/implementation costs includes an additional 25% for survey, site testing, design, construction oversight, etc.
174
175 Attachment D NPDES Phase II Implementation Cost Estimates
176
177 City of Lancaster Public Involvement, Outreach and Participation for Storm Water Program Activity LOS 1 (existing) LOS 2 LOS 3 MS4 Protocol -- Public Outreach and Education Develop and update Public Education Plan Develop and update target audiences Disseminate materials to all target audiences using appropriate distribution channels. Newspaper advertisement Plan completed; reviewed annually. Target audience list reviewed and updated annually. "When it Rains, It Drains" on City website and in public information stands in City Hall "After the Storm" pamphlet added to public info stands in City Hall City mailed a spring 2010 newsletter to all City residents describing the MS4 and ways to reduce water pollution. Ran ad in Lancaster Sunday News (2/20/11) Solicited the School District to help the City distribute/post educational materials; provided materials Continued to maintain City's website for public education on SW issues; PADEP link is included. Distribute pamphlets in water bills Distribute bi-annual newsletter to raise public awareness (not mail) Run quarterly newspaper ads to raise public awareness Place posters in other public places, such as libraries. Follow up with schools to see whether posters are displayed and materials sent home with students. City developed Green Infrastructure Plan with additional public outreach materials and opportunities. LIVE Green conducted workshops focusing on reducing stormwater volume and pollution. Mail quarterly newsletter to raise public awareness Run monthly ads to raise public awareness Rotate posters so that target audiences see new posters periodically. Develop Lancaster-specific posters. "Other components of the plan" Continue to build and update LIVE Green's "Save It!"website with additional stormwater resources for various stakeholders. ANNUAL COST: Create a "speakers bureau" of people available to conduct civic and club presentations as needed. City signed a MOU with Lancaster County Conservation District (LCDD) which included LCCD distributing public educational materials. Prepare public service announcements for radio (biannually) Translate 2-4 public information materials into Spanish to better reach target audiences. Produce "give-aways" for fairs and public events. Develop a display to be used at fairs and public events; actively participate in such events. Prepare public service announcements for radio (quarterly). Translate 5+ public information materials into Spanish to better reach target audiences. as per Bryan Harner: 120 hours per year + $3, FTE + $10, FTE + $12,000 CH2M HILL Confidential 6/7/2012 Page 1
178 City of Lancaster Public Involvement, Outreach and Participation for Storm Water Program Activity LOS 1 (existing) LOS 2 LOS 3 MS-4 Protocol -- Public Involvement and Participation Develop public involvement plan. Notify and solicit public input/involvement on SW Plan development and implementation. Notify public as needed Reviewed Public Involvement and Look for additional volunteer opportunities. Participation Plan Table for accuracy and Provide information to volunteer groups to updated information about target audiences. send out in their own mailings. Public meeting held on 11/22/04 with the Community Development and Planning Committee. Information presented to City None because SW Management Program was not modified. Annual presentation to City Council on progress. Solicit interest with stakeholders in a volunteer stream monitoring program and/or storm sewer stenciling program. Plan and conduct annual public meeting or "open house" workshop on progress. Initiate and actively support a volunteer stream monitoring program and/or storm sewer stenciling program. ANNUAL COST: No additional cost - included in Bryan Harners's estimate above No additional cost - overlaps with additional activities above. 0.1 FTE + $3,000 CSO (Guidance for Nine Minimum Controls) - Public Education Conduct public education program (e.g., proper application of fertilizers, pesticides, and herbicides; public service announcements, advertising, storm drain stenciling, distribution of information through water and sewer bills, etc.) (Accomplished through MS4 public education on stormwater issues.) Issue Lancaster-specific fact sheets and Conduct pre- and post-surveys to assess brochures through water bills or as handouts awareness of stormwater issues. ANNUAL COST: (no additional cost above current MS4 program).10 FTE + $ FTE + $8,000 CSO (Guidance for Long-Term Control Plan) - Public Participation and Agency Interaction Develop public participation program during system characterization. Involve the public in the development and evaluation of alternatives for CSO control. Develop a public participation plan based on knowledge of the community. Use the GIAC as an advisory committee to obtain input. Use the GIAC as an advisory committee to obtain input. Develop a public participation plan by interviewing key stakeholders and planning how the public will be kept informed and provided opportunities for involvement. Hold a series of GIAC meetings to obtain input; invite other stakeholders to participate, advertise the meetings as public workshops in newspaper advertisements and public service announcements on the radio Hold a series of GIAC meetings to obtain input; invite other stakeholders to participate, advertise the meetings as public workshops in newspaper advertisements and public service announcements on the radio Distribute informational materials in water bills and through the mail and schools. Develop and release information for the media; meet with media representatives (e.g., editors, environmental reporters) to provide background information Interview other community leaders to obtain input. Hold a series of workshops or go to existing civic and club meetings to present information and obtain input. Develop an educational program for children, conduct activities and workshops in schools. Hold periodic media briefings about specific projects or issues. Conduct a series of neighborhood meetings and do presentations at existing civic and club meetings CH2M HILL Confidential 6/7/2012 Page 2
179 City of Lancaster Public Involvement, Outreach and Participation for Storm Water Program Activity LOS 1 (existing) LOS 2 LOS 3 Obtain public input on the selection and implementation of the long-term plan. ANNUAL COST: Use the GIAC as an advisory committee to obtain input. 60 hours (PI plan + support for GIAC meetings) Hold a series of GIAC meetings to obtain input; invite other stakeholders to participate, advertise the meetings as public workshops in newspaper advertisements and public service announcements on the radio Distribute informational materials in water bills and through the mail and schools. Develop and release information for the media; meet with media representatives (e.g., editors, environmental reporters) to provide background information. Interview other community leaders to obtain additional input. Hold a series of workshops or go to existing civic and club meetings to present information and obtain input. Develop an educational program for children, conduct activities and workshops in schools. Adapt existing educational software. Hold periodic media briefings about specific projects or issues. Conduct a series of neighborhood meetings and do presentations at existing civic and club meetings 0.1 FTE + $ FTE + $8,000 Stormwater Utility Incentive Program Dedicated materials explaining the incentives, how to calculate them, and how to apply Develop series of brochures on various Develop two brochures for distribution to ways to obtain credits and add more stakeholders and one new page on website. information to website, including examples and case-studies from other locations. Develop series of brochures and conduct workshops and audits with various stakeholders and stakeholder groups to guide them through incentives. Develop Powerpoint presentation to be used at workshops and meetings. ANNUAL COST: 100 hours + $3,000 (printing, supplies, no separate mailing) 0.1 FTE + $ FTE + $8,000 TOTAL by LOS: 280 hours + $6, FTE + $23, FTE + $39,000 LOS 1 (existing) LOS 2 LOS 3 Assumed Avg Salary + Benefits $120,000 $120,000 $120,000 FTEs Salary + Benefits $16,154 $84,000 $144,000 Misc Expenses $6,000 $23,000 $23,001 Public Education and Participation (MCM 1 and 2) $22,154 $107,000 $167,001 CDM's Estimates for MCMs 1 and 2 $20,350 $20,350 $20,350 Difference $1,804 $86,650 $146,651 CH2M HILL Confidential 6/7/2012 Page 3
180
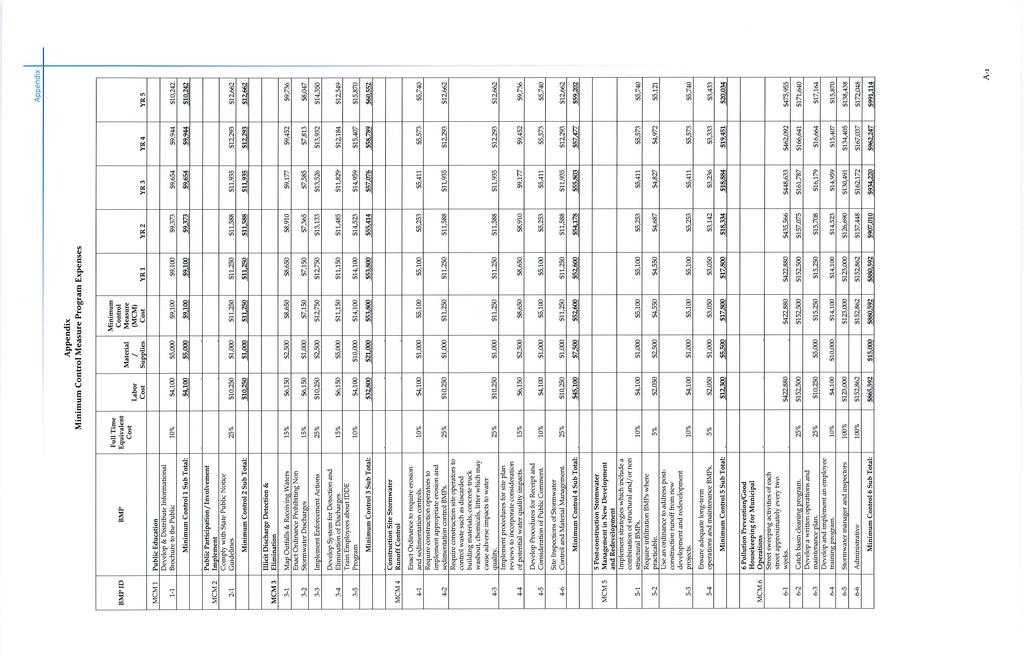
181
182
183 Attachment E CSO Wet Weather CIP
184
185 May 1, 2012 City of Lancaster CAPITAL SEWER PROJECTS Engineering Construction Total Partners Cost Share Distribution Escrow Cost Cost Cost City ELSA SLSA LSA LASA Payment Schedule Project/Description ($) ($) ($) (%) ($) (%) ($) (%) ($) (%) ($) (%) ($) Date Start End 1a North Pumping Station (NPS) Expansion Construction 0 9,700,000 9,700, % 3,347, % 1,718, % % 487, % 4,145,780 Jan-13 Jun-13 Nov-14 Construction Management/RE 1,020, ,020, % 352, % 180, % % 51, % 435,948 Jan-13 Mar-13 Nov-14 1b NPS FM Surge Control System Construction 1,700,000 1,700, % 586, % 301, % % 85, % 726,580 Jan-13 Jun-13 Nov-14 Construction Management/RE 90,000 90, % 31, % 15, % % 4, % 38,466 Jan-13 Mar-13 Nov-14 2 NPS Basin Screening and Grit Removal Facility Design 422, , % 422, % % % % May-11 Feb-13 Construction 5,500,000 5,500, % 5,500, % % % % Jun-13 Nov-14 Construction Management/RE 590, , % 590, % % % % Mar-13 Nov-14 3 NPS Basin CSO Diversion Chamber & Deflection Screen Design 117, , % 117, % % % % May-11 Feb-13 Construction 1,500,000 1,500, % 1,500, % % % % Jun-13 Nov-14 Construction Management/RE 130, , % 130, % % % % Mar-13 Nov-14 4 WWTP Solids Dewatering & Maintenance Buildings Roof Replacements 720, , % 360, % 107, % 100, % 16, % 135,360 Mar-12 Apr-12 Dec-12 5 NPS & SAPS Force Main Upgrade Design % % % % % 0 Jan-15 Jan-15 May-15 Construction % % % % % 0 May-15 Jun-15 Dec-15 6 WWTP Facilities Plan Phase 2 - Alternatives Evaluation/Facilities Plan % % % % % 0 Oct-12 Oct-12 Jun-13 7 North Pumping Station Sewershed Evaluation Phase 2 - Sewer System Capacity Evaluation % % % % % 0 8 Stevens Avenue Pumping Station Sewershed Evaluation Phase 2 - Sewer System Capacity Evaluation % % % % % 0 9 North PS CSO Storage Design 3,500, ,500, % 3,500, % % % % 0 Construction 62,500,000 62,500, % 62,500, % % % % 0 Construction Management/RE 4,000, ,000, % 4,000, % % % % 0 10 WWTP Upgrade/Expansion Design % % % % % 0 Construction % % % % % 0 Construction Management/RE % % % % % 0 11 WWTP Anoxic Zone Modifications Design 270, , % 135, % 40, % 37, % 6, % 50,760 Jun-12 Jun-12 Dec-12 Construction 2,300,000 2,300, % 1,151, % 343, % 321, % 51, % 432,400 Dec-12 Feb-13 Dec-13 Construction Management/RE 330, , % 165, % 49, % 46, % 7, % 62,040 Dec-12 Dec-12 Dec WWTP North Final Clarifier Drive Mechanisms 750, , % 375, % 111, % 104, % 16, % 141, WWTP North A/O Building MCC and Primary Sludge Pumping Upgrade 500, , % 250, % 74, % 69, % 11, % 94, WWTP North A/O Distribution Box Corrosion Repair 700, , % 350, % 104, % 97, % 15, % 131, WWTP Chlorination Building MCC Upgrade 200, , % 100, % 29, % 27, % 4, % 37, WWTP Oxygen Plant Instrumentation Upgrade 300, , % 150, % 44, % 41, % 6, % 56,400 SUBTOTAL PARTNER PROJECTS 10,469,000 86,370,000 96,839, % 85,616, % 3,123, % 847, % 764, % 6,487,934 1 of 2 pw:\\dacpwapp1.cdminc.internal.cdm.com:pw_xm1\documents\20467\69515\01 Project Management\05 Schedule\Capital WW Projects\CapProjList xlsx
186 May 1, 2012 City of Lancaster CAPITAL SEWER PROJECTS Engineering Construction Total Partners Cost Share Distribution Escrow Cost Cost Cost City ELSA SLSA LSA LASA Payment Schedule Project/Description ($) ($) ($) (%) ($) (%) ($) (%) ($) (%) ($) (%) ($) Date Start End 17 Collection System Improvements 3,618,710 3,618, % 3,618, % % % % 0 18 Maple Grove Pumping Station Expansion Design 401, , % 401, % % % % Nov-11 Mar-13 Construction 0 2,500,000 2,500, % 2,500, % % % % Jun-13 Jun-14 Construction Management/RE 375, , % 375, % % % % Apr-13 Jun Engleside Sewershed Phase 2 - Sewer System Capacity Evaluation % % % % % 0 20 Stevens Ave & Engleside Bar Screen Replacement Construction 0 1,500,000 1,500, % 1,500, % % % % Feb-11 May-12 Construction Management/RE 179, , % 179, % % % % Nov-10 May Engleside CSO Parallel Outfall Culvert Final Design 100, , % 100, % % % % Jun-12 Oct-12 Construction 0 1,164,000 1,164, % 1,164, % % % % Jan-13 Jul-13 Construction Management/RE 150, , % 150, % % % % Nov-12 Jul-13 SUBTOTAL CITY ONLY PROJECTS 1,206,200 8,782,710 9,988,910 9,988, TOTAL ALL PROJECTS 11,675,200 95,152, ,827,910 95,604,967 3,123, , ,614 6,487,934 Notes: 1) Most of the costs shown are conceptual or preliminary at best. The costs will be updated as evaluation/design phases progress. 2) Color Coding: Projects with Escrow Agreements needing final signatures and/or deposits New Projects where Escrow Agreements are being drafted 10% Design Level Estimate Conceptual level costs that need to be further developed before finalizing Costs that need to be developed 2 of 2 pw:\\dacpwapp1.cdminc.internal.cdm.com:pw_xm1\documents\20467\69515\01 Project Management\05 Schedule\Capital WW Projects\CapProjList xlsx
187 Appendix C Preliminary Stormwater Management Fee Analysis
188
189 Preliminary Stormwater Management Fee (SWMF) Analysis Prepared for City of Lancaster, PA March 17, Arch St. Suite 4400 Philadelphia, PA 19103
190
191 Contents Acronyms and Abbreviations... vii Executive Summary... ES-1 1 Introduction Purpose Policy Papers Level of Service Alternatives and Program Cost Estimates Program Financial Cost Requirements Overview Operating and Maintenance Allowance for Operating Reserve Allowance for Uncollectible Accounts Allowance for SWMF Credits/Incentives Capital Improvement Projects Debt Service Equity-funded CIP (Pay-Go) Non-rate Revenues Investment Income PennVest Loans Grants Stormwater Utility SWMF Rate Structure Impervious Area Estimates Equivalent Residential Unit Basis Rate Structures ERU Method Total Impervious Area Method Tiering Method Comparison of Methods and Recommendation Rate Scenarios Overview of Scenarios Low Level of Service (Rate Scenario 1) Assumptions Program Financial Cost Requirements Financial Summary Medium Level of Service (Rate Scenario 2) Assumptions Program Financial Cost Requirements Financial Summary Sensitivity Analysis High Level of Service (Rate Scenario 3) Assumptions Program Financial Cost Requirements Financial Summary Sensitivity Analysis Scenario Comparison Alternatives to SWMF ES BSS III
192 PRELIMINARY STORMWATER MANAGEMENT FEE (SWMF) ANALYSIS 5 Summary Results and Recommendation Summary Results Recommendation Attachments A B C D E F G Tables ES-1 ES-2 Stormwater Utility Program Needs Policy Paper Stormwater Utility Rate Structure and Rates Policy Paper Stormwater Utility CIP Policy Paper Stormwater Utility SWU Fee Credits / Incentives Policy Paper PennVest loan repayment schedule Impervious Area and Billing Units Rate Model Output Financial Summary for the Medium Level of Service Rate Scenario (Service Rate Scenario 2)... ES-3 Stormwater Utility Rate and Annual SWMF per Property by Tier... ES Summary of Level of Service Cost Estimates Summary of Grants Summary of Impervious Area and Number of Properties Top 10 Owners Based on Total Estimated Impervious Area Descriptive Statistics for Single Family Properties in the City of Lancaster Summary of ERU Rate Structure Method Descriptive Statistics for All Properties Summary of Total Impervious Area Method Summary of Tiering Method Summary of Billing Units by Stormwater Class and Rate Structure Method Program Cost Coverage Requirements for the Low Level of Service Rate Scenario (Rate Scenario 1) Financial Summary for the Low Level of Service Rate Scenario (Rate Scenario 1) Capital Requirements for the Low Level of Service Rate Scenario (Rate Scenario 1) Stormwater Utility Rate and Annual SWMF per Property by Tier Program Cost Requirements for the Medium Level of Service Rate Scenario (Rate Scenario 2) Financial Summary for the Medium Level of Service Rate Scenario (Service Rate Scenario 2) Capital Requirements for the Medium Level of Service Rate Scenario (Service Rate Scenario 2) Stormwater Utility Rate and Annual SWMF per Property by Tier Capital Requirements and Debt Funding Estimated Debt Service Rate Sensitivity Based on Debt Funding Program Financial Cost Requirements for the High Level of Service Rate Scenario (Rate Scenario 3) Financial Summary for the High Level of Service Rate Scenario (Service Rate Scenario 3) Capital Requirements for the High Level of Service Rate Scenario (Service Rate Scenario 3) Stormwater Utility Rate and Annual SWMF per Property by Tier Capital Requirements and Debt Funding Estimated Debt Service Rate Sensitivity based on Debt Funding Comparison of Alternatives to the SWMF IV ES BSS
193 CONTENTS Figures ES-1 ES-2 Comparison of Program Costs Covered by the SWMF by Rate Scenario (Pay-Go financing)... ES-2 Comparison of SWMF by Rate Scenario (Pay-Go financing)... ES Summary of Impervious Area and Number of Properties Frequency Distribution for All Properties Frequency Distribution for All Properties with Tier Alignment Estimated Stormwater Operating and Maintenance Expenditures Estimated Stormwater CIP (before grants and loans) Estimated Stormwater CIP (after grants and loans) Estimated Net Revenue (Program Financial Cost Coverage) Requirements (after grants and loans) Comparison of SWMF by Rate Scenario (Pay-Go financing) Comparison of Program Cost Covered by the SWMF by Rate Scenario (Pay-Go financing) Sensitivity of Bond versus Pay-Go financing (Rate Scenario 2 Medium Level of Service) Sensitivity of Bond versus Pay-Go financing (Rate Scenario 3 High Level of Service) Comparison of Annual Charge for Alternatives to the SWMF ES BSS V
194
195 Acronyms and Abbreviations CIP City CSO DPW ERU FY GI GIAC IA LOS MS4 O&M Pay Go SF SWMF Capital Improvement Program City of Lancaster combined sewer overflow Department of Public Works equivalent residential unit fiscal year Green Infrastructure Green Infrastructure Advisory Committee impervious area level of service Municipal Separate Storm Sewer System operating and maintenance equity-funded CIP square feet stormwater management facility ES BSS VII
196
197 Executive Summary The City of Lancaster s Department of Public Works currently provides stormwater functions and services, which fall under several bureaus. The stormwater management program is funded by the Sewer Fund and General Fund. There are significant issues related to stormwater management, which are the focus of recent regulatory requirements such as the Municipal Separate Storm Sewer System (MS4) permit and consent orders related to combined sewer overflows. Projects and programs related to stormwater are dispersed throughout the Department of Public Works, and implementation of a dedicated cost recovery source can help highlight projects and programs. Faced with significant increases in regulatory requirements and anticipated cost recovery gaps, the City has conducted a series of activities to evaluate alternate approaches to complying with regulatory requirements while meeting City goals for economic development, and to evaluate the feasibility of developing an impervious area (IA) -based fee for stormwater services (sometimes known as a stormwater utility). As part of this study, a rate model was prepared to evaluate a Stormwater Management Fee (SWMF) to fund the City s stormwater management program. Three rate structure options were evaluated using impervious area (IA) estimates based on aerial photography and digitization of IA included in the the City s geographic information system. For the three rate scenarios, the tiering method rate structure, which is applied to all properties, was used. The tiering method groups all properties within a range of IA, which are then assessed a fee based on a representative IA for that range. Based on feedback from the GIAC, using a rate structure based on four tiers was preferred over using actual IA, or lumping all single IA properties by type because it represents the most reasonable and equitable method. The SWMF rate model evaluated the program costs based on three levels of service alternatives identified in Technical Memorandum #1. The recommended rate scenario is Rate Scenario 2 Medium Level of Service, which represents the estimated program needs to satisfy MS4 permit and other regulatory requirements. The capital requirements represent the largest expense item. The use of grants and loans in early years offset the improvement program (CIP) cost and help to keep the SWMF low. However, in years 4 and 5, the capital requirements increase significantly because available grants/loans are exhausted, which impacts the SWMF. To fund capital requirements in years 4 and 5, identify additional grants/loans or consider the use of debt financing. Figure ES-1 illustrates the potential program costs that could be recovered based on the three rate scenarios evaluated as part of this study. The program costs recovered in the first 3 years are low compared to years 4 and 5 because the use of grants and loans help reduce the program costs that would need to be recovered by the fee. Figure ES-2 illustrates the SWMF ($ per 1,000 square feet [sf]) to cover the program costs identified in Figure ES-1 and to cover the program cost requirements for each rate scenario assuming Pay Go CIP cost recovery. The significant increase in years 4 and 5 are due to the increase in capital requirements after available grants/loans are used to fund other capital projects. Figure ES-3 illustrates, for Rate Scenario 2 Medium Level of Service, the sensitivity of using Pay-Go versus debt financing for the capital requirements starting in Year 4. The use of debt financing helps keep rates low and spreads the costs over time to current and future rate payers. Table ES-1 provides the financial summary for Rate Scenario 2 Medium Level of Service. Table ES-2 summarizes the SWMF rate and annual SWMF per property by tier for Rate Scenario 2 Medium Level of Service. ES BSS ES- 1
198 PRELIMINARY STORMWATER MANAGEMENT FEE (SWMF) ANALYSIS FIGURE ES-1 Comparison of Program Costs Covered by the SWMF by Rate Scenario (Pay-Go financing) Millions $11 $10 $9 $8 $7 $6 $5 $4 Low Medium High $3 $2 $1 $ Year FIGURE ES-2 Comparison of SWMF by Rate Scenario (Pay-Go financing) $160 $140 $ $ $120 IASF ($/1,000 sf) $100 $80 $60 $60.89 $60.89 $71.00 $79.47 $96.32 Low Medium High $40 $30.96 $30.96 $30.96 $20 $19.22 $19.22 $19.22 $19.22 $19.22 $ Year ES-2 ES BSS
199 EXECUTIVE SUMMARY FIGURE ES-2 Comparison of SWMF by Rate Scenario (Pay-Go financing) $160 $140 $120 Annual Rate ($/1,000 sf) $100 $80 $60 $79.47 $96.32 $40 $30.96 $30.96 $30.96 $43.65 $44.57 $20 $30.96 $30.96 $30.96 Bonds Pay Go $ Year TABLE ES-1 Financial Summary for the Medium Level of Service Rate Scenario (Service Rate Scenario 2) Year 1 Year 2 Year 3 Year 4 Year 5 SWU Fee ($/1,000 sf) $30.96 $30.96 $30.96 $79.47 $96.32 Equivalent Residential Units 83,745 83,787 83,829 83,870 83,912 Operating Revenues SWMF $2,592,738 $2,594,030 $2,595,330 $6,665,180 $8,082,440 less Allowance for Uncollectable Accounts ($259,274) ($259,403) ($259,533) ($666,518) ($808,244) less Credits/Incentives $0 ($210,859) ($210,964) ($541,786) ($656,989) Interest Income $600 $1,900 $2,700 $2,200 $1,400 Total Revenues $2,334,064 $2,125,668 $2,127,533 $5,459,076 $6,618,607 Program Costs Covered O&M $1,289,512 $1,328,197 $1,368,043 $1,409,085 $1,451,357 Non Operating Debt Service $104,700 $104,700 $255,000 $405,200 $405,200 Stormwater CIP (Pay Go) $295,000 $118,000 $240,000 $4,423,000 $4,739,000 Total Program Costs Covered $1,689,212 $1,550,897 $1,863,043 $6,237,285 $6,595,557 Beginning Balance $0 $644,852 $1,219,623 $1,484,113 $705,904 Ending Balance $644,852 $1,219,623 $1,484,113 $705,904 $728,954 ES BSS ES-3
200 PRELIMINARY STORMWATER MANAGEMENT FEE (SWMF) ANALYSIS TABLE ES-2 Stormwater Utility Rate and Annual SWMF per Property by Tier Medium Level of Service (Rate Scenario 2) Low Year 1 Year 2 Year 3 Year 4 Year 5 SWMF ($ per 1,000 sf) $30.96 $30.96 $30.96 $79.47 $96.32 Percent Increase 0.0% 0.0% 156.7% 21.2% Annual SWMF per Property Tier 1 (<=1,000 sf) $15.48 $15.48 $15.48 $39.74 $48.16 Tier 2 (>1,000 sf and <=2,000 sf) $46.44 $46.44 $46.44 $ $ Tier 3 (>2,000 sf and <=3,000 sf) $77.40 $77.40 $77.40 $ $ Tier 4 (>3,000) Properties pay based on total IA / SWMF. ES-4 ES BSS
201 SECTION 1 Introduction 1.1 Purpose The City of Lancaster s (City s) Department of Public Works (DPW) currently provides stormwater management functions and services, which fall under several bureaus. There are significant issues related to stormwater management, which are the focus of recent regulatory requirements such as the Municipal Separate Storm Sewer System (MS4) permit and consent orders related to combined sewer overflows (CSOs). Projects and programs related to stormwater are dispersed throughout DPW, and implementation of a dedicated cost recovery source can help highlight projects and programs. Faced with significant increases in regulatory requirements and anticipated cost recovery gaps, the City has conducted a series of activities to evaluate alternate approaches to complying with regulatory requirements while meeting City goals for economic development, and to evaluate the feasibility of developing an impervious area (IA) -based fee for stormwater services (sometimes known as a stormwater utility). As part of this study, a rate model was prepared to evaluate a Stormwater Management Fee (SWMF) to recover the costs of the City s stormwater management program. The purpose of this technical memorandum includes the following: To summarize the impervious area (IA) analysis and recommended equivalent residential unit (ERU). To evaluate three rate structures and identity the advantages and disadvantages of each. To evaluate the program cost-that could be covered of an SWMF. To summarize the rate model results based on the three level of service (LOS) scenarios reported in Technical Memorandum # Policy Papers As part of this study, several policy papers have been developed and presented to the Green Infrastructure Advisory Committee (GIAC) in order to define certain aspects of the proposed stormwater utility and SWMF. In addition, these policy papers also help inform the rate modeling and include the following: Stormwater Utility Program Needs Policy Paper Stormwater Utility Rate Structure and Rates Policy Paper Stormwater Utility Capital Improvement Program (CIP) Policy Paper Stormwater Utility Credits / Incentives Policy Paper The Program Needs Policy Paper identifies the stormwater programs to be cost recovered by the SWMF. In addition, this policy paper discusses the issues, concerns, and benefits associated with cost recovery for the program with dedicated cost recovery sources. Lastly, the policy paper documents the GIAC s feedback. The policy paper on program needs is provided in Attachment A. The Rate Structure and Rates Policy Paper presents a rate structure option and preliminary rate model results. This policy paper discusses the issues, concerns, and benefits associated with the rate structure for the SWMF and resulting fees associated with three LOS scenarios. The policy paper on rate structure and rates is provided in Attachment B. The CIP Policy Paper identifies options regarding CIP financing, including equity (Pay-Go) and debt financing. The capital requirements for the three LOSs and comparison of Pay-Go versus debt financing are summarized. The CIP Policy Paper is provided in Attachment C. The Credits / Incentives Policy Paper identifies options for rate payers to reduce their SWMF by implementing onsite stormwater controls. This policy paper identifies eligibility criteria, qualifying stormwater control facilities, and amount of credit. The Credits / Incentives Policy Paper is provided in Attachment D. ES BSS 1-1
202 PRELIMINARY STORMWATER MANAGEMENT FEE (SWMF) ANALYSIS 1.3 Level of Service Alternatives and Program Cost Estimates Technical Memorandum #1 identified LOS alternatives and program cost estimates. The LOS considerations consist of the following: Low Medium High Assumes current LOS and MS4 permit implementation. Includes current level of expenditure, plus additional program elements. Green Infrastructure (GI) Plan Implementation (public only), MS4 permit implementation, increased maintenance and customer service. Includes higher LOS for current program, plus additional program elements. GI Plan implementation (public and private), MS4 permit implementation, high level of maintenance and customer service. These LOS scenarios are used to define the three rate scenarios. Table 1-1 provides the LOS cost summary presented in Technical Memorandum #1. The rate analysis uses these program cost estimates as a starting point to define the rate scenarios discussed in Section 4. TABLE 1-1 Summary of Level of Service Cost Estimates Estimated Annual Costs Low Medium High Operating and Maintenance GI n/a $162,000 $202,500 Dry and Wet Ponds (inspection) $2,300 $2,300 $2,300 Street Sweeping $168,800 $168,800 $234,100 Catch Basin $201,000 $201,000 $402,000 Storm Drainage n/a n/a n/a MS4 Implementation $451,566 $536,412 $612,412 Program Administration $142,000 $219,000 $296,000 Capital Costs GI $730,600 $1,909,100 $3,652,400 Storm Drainage n/a $1,444,000 $1,926,000 Catch Basin $164,000 $164,000 $164,000 Total $1,860,266 $4,806,612 $7,491, ES BSS
203 SECTION 2 Program Financial Cost Requirements 2.1 Overview Defining program financial cost requirements is one the first steps in conducting a rate study and developing the rate models. For purposes of this study, a cash basis approach was assumed and the program financial cost requirements include the following: Operating and maintenance (O&M) expenditures Allowance for operating reserve Allowance for uncollectible accounts Allowance for stormwater management facility (SWMF) credits/incentives Debt service Equity-cost recovered CIP (Pay-Go) Less non-rate revenues (for example, interest income, grants, etc.) The program financial cost requirements include the amount needed to be generated from rates and other sources (on a cash basis) to meet the stormwater utility s cash needs and other financial commitments. The net financial cost requirements represent the total program financial cost requirements less the non-rate revenues. The net financial cost requirements also represent the portion of the total program cost requirements that needs to be generated through the SWMF to cover stormwater management costs and other financial commitments. The net financial cost requirements are also sometimes referred to as the rate revenue requirements. The following sections describe the components that comprise the net financial cost requirements. Section 4 provides the estimated program financial cost requirements for each rate scenario evaluated. Tabular summaries are not provided here because some values are specific to a respective rate scenario. 2.2 Operating and Maintenance Table 1-1 provides a summary of the O&M costs that are included in the program financial cost requirements. The details for the cost components are provided in Technical Memorandum #1. The rate scenarios presented in Section 4 use the assumed LOS costs. O&M include activities related to the following: GI Inspection of municipally owned best management practices (such as ponds) Street sweeping Catch basins MS4 permit implementation Program administration 2.3 Allowance for Operating Reserve It is common for stormwater utilities to plan for and keep an operating reserve. The intent of the reserve is to provide a cushion for unexpected expenditures. The typical level of reserve is 6 to 9 months of annual operating expenditures. The rate scenarios presented in Section 4 assume a 6-month operating reserve. 2.4 Allowance for Uncollectible Accounts For most utilities, there are some accounts that do not pay. The collection rate for stormwater utilities is a function of the billing mechanism (such as real estate tax bill, water/sewer bill, or standalone bill). For stormwater utilities that use a real estate tax bill, a collection rate of 99 percent is typical because the property owner does not directly pay the stormwater charge; instead it is paid once or twice a year through escrow payments. For stormwater utilities that use a standalone bill, the collection rate is much lower because there is generally no enforcement mechanism. For standalone billing, a collection rate typically ranges from 70 to 80 percent. ES BSS 2-1
204 PRELIMINARY STORMWATER MANAGEMENT FEE (SWMF) ANALYSIS For stormwater utilities that use an existing water/sewer bill, the collection rate is lower than the real estate tax bill method and can be as much as 90 percent. The collection rate will depend on the utility s policy regarding order of payment. For example, if an account pays a partial bill, does the water bill get paid first? For the rate scenarios presented in Section 4, a 90 percent collection rate was assumed. 2.5 Allowance for SWMF Credits/Incentives Some utilities offer credits to accounts that own and maintain SWMFs. The intent is to provide incentive for property owners to manage stormwater on their properties. The level of credit available to property owners is typically based on the amount of IA treated. Some provide a full credit, whereas most offer partial credit. Attachment D provides a policy paper on a proposed system of credits for the City. Because the level of participation in a credit program is uncertain, an allowance for credits was assumed for the rate scenarios presented in Section 4. For planning purpose, a percent of operating program costs was assumed. For example, it was assumed that 10 percent of total operating program costs is reasonable proxy for expected participation in the credit program. Once a stormwater utility is operational, this assumption should be reviewed and the rate model updated to reflect actual level of participation. 2.6 Capital Improvement Projects Table 1-1 provides summary of the CIP costs that are included in the program cost requirements. The details for the CIP components are provided in Technical Memorandum #1. The rate scenarios presented in Section 4 follow the assumed LOS costs estimates. The CIP components include the following: GI Storm drainage Catch basin The distinction between the LOS estimates presented in Technical Memorandum #1 and the rate scenarios presented in Section 4 assume the ramp-up or phase-in of costs. The LOS estimates presented in Technical Memorandum #1 assume an equal annual amount (i.e., total divided by 5 years). The rate scenarios presented in Section 4 assume that costs ramp up over a 5-year period. 2.7 Debt Service The City issues debt to fund municipal projects, including projects related to the Sewer Fund. The debt service on outstanding debt is paid for by a combination of the General Fund, Water Fund, and Sewer Fund. The City s fiscal year (FY) 2011 financial statements reported that $38,860,000 in General Obligation Bonds were issued to fund upgrades and improvements to the water and sewer system. After reviewing the notes to the financial statements, the description of the outstanding debt does not identify stormwater-related projects. However, it is possible that projects categorized as sewer upgrades or improvements could be stormwater-related. It was assumed that there no allocation of debt service for any outstanding debt is financed by the SWMF. As the stormwater utility program evolves and more capital is required to respond to increasing regulatory requirements for stormwater management, debt financing is a possible cost recovery source. Issuing debt to finance capital improvement projects will result in debt service payments and require the stormwater utility to meet debt service coverage requirements (if applicable). Depending on future cost recovery of capital projects, it is possible that the stormwater utility could issue bonds. In Section 4, a cost recovery scenario is described that considers the use of debt financing in FY Attachment C includes the policy paper on CIP and debt financing. Debt service could also include repayment of PennVest Loans. In Section 4, rate scenarios assume repayment of assumed PennVest loans based on the debt service schedule provided by the City (Attachment E). 2-2 ES BSS
205 2.8 Equity-cost recovered CIP (Pay-Go) SECTION 2 REVENUE REQUIREMENTS Equity-finacned CIP (Pay-Go) is the portion of the CIP that is paid for using current revenues generated by the SWMF. For example, if a portion of the CIP is cost recovered by grants, loans, or bonds, then the remaining CIP is typically paid for using current revenues or Pay-Go. The rate scenarios presented in Section 4 evaluate the sensitivity on rates based on Pay-Go versus debt financing. 2.9 Non-rate Revenues Non-rate revenues are derived from sources other than the stormwater utility charge. This includes investment income, grants, developer contributions, and ancillary fees (such as permit fees). Non-rate revenues are subtracted from the annual costs and help reduce the expense burden Investment Income Based on market conditions, the interest rate on money market investments is very low and does not yield much in terms of investment income. As market conditions improve and the stormwater utility fund maintains a target balance, investment income is likely to increase PennVest Loans As part of the Non-point Source Loan Program (PennVest), the City secured a $7,000,000 loan for the design and construction of GI projects. For the rate scenarios presented in Section 4, it was assumed that the loan proceeds are used to fund GI CIP. Certain rate scenarios assume repayment of assumed PennVest loans based on the debt service schedule provided by the City (Attachment E) Grants Depending on availability, state and federal grants for stormwater management may be available. Based on market conditions, state and federal grant programs are limited. The City actively seeks grant financing for GI projects. For the rate scenarios presented in Section 4, it was assumed that $2,500,000 is used to fund GI CIP. Table 2-1 provides a list of grants the City has recently received for GI projects. TABLE 2-1 Summary of Grants Cost Recovery Source Grant Name Year Amount Match PA Dept of Conservation & Natural Resources Community Conservation Partnerships Program 2009 $70,000 National Fish & Wildlife Foundation PA Dept of Community & Economic Development Chesapeake Bay Stewardship Fund, Innovative Nutrient and Sediment Reduction H2O PA - Water Supply, Sanitary Sewer and Storm Water Projects 2010 $400,000 $520, $768,333 $384,167 PA Dept of Environmental Protection Growing Greener 2011 $225,000 PA Dept of Environmental Protection Safe Water Grant 2011 $770,000 PA Office of the Budget Keith Campbell Foundation for the Environment National Fish & Wildlife Foundation Redevelopment & Capital Improvement Assistance Program 2011 $1,500,000 Campbell Foundation s Chesapeake program 2011 $25,000 Chesapeake Bay Stewardship Fund, Innovative Nutrient and Sediment Reduction 2011 $400,000 PA Dept of Environmental Protection Growing Greener Plus 2012 $263,120 ES BSS 2-3
206
207 SECTION 3 Stormwater Utility SWMF Rate Structure To develop a stormwater utility rate structure, the IA of developed properties in the City were analyzed. IA includes buildings, walkways, driveways, parking lots, and other structures. IA does not allow stormwater to infiltrate and flow through the ground and instead directs runoff into the streets and waterways. So, IA is the best available measure of stormwater runoff and is used to develop a fair and equitable rate structure. 3.1 Impervious Area Estimates Based on GIS provided by the City, IA estimates were developed. The IA is based on aerial photography and digitization of IAs. The stormwater class is based on the general land use information recorded in the IA database. The IA estimates are used to develop a rate structure, which begins with defining the ERU. The use of IA as the basis is the most common and appropriate method for distributing the costs associated with stormwater runoff equitably and fairly. As part of this study, a random sample of 199 properties were selected from 2008 aerials and 2011 parcel boundaries and analyzed to estimate missing or incorrectly digitized IA mapping. The details of this analysis are provided in Attachment F. In summary, median deviation between the original data set and the corrected data was used to calculate an adjustment factor for missing IA. These factors were identified for each stormwater class and applied the each record identified in the IA database based on the respective stormwater class.. Adjustment factors ranged from 9 percent for commercial, up to 45 percent for residential. Table 3-1 and Figure 3-1 provide a summary of IA and number of properties by stormwater class. These summaries help illustrate equity and fairness principal of using IA as the basis for the rate structure. For example, single family (residential) stormwater class represents 77 percent of properties but 22 percent of the IA. All other stormwater classes (non-residential) represent 23 percent of the properties and 78 percent of the IA. On a perproperty basis, residential properties would pay a disproportionate share of the cost of stormwater runoff. TABLE 3-1 Summary of Impervious Area and Number of Properties Stormwater Class Number of Properties Percent Impervious Area (sf) Percent Single Family 13, ,337, Multi-Family 1, ,909, Commercial 1, ,093, Industrial ,205, Non-Profit ,643,843 3 Institutional ,824,416 6 Government ,707,181 4 Total 17,353 83,720,461 sf = square feet ES BSS 3-1
208 PRELIMINARY STORMWATER MANAGEMENT FEE (SWMF) ANALYSIS FIGURE 3-1 Summary of Impervious Area and Number of Properties Number of Properties Impervious Area Non-Profit, 0.77% Industrial, 1% Multi-Family 12% Commercial 9% Institutional, 0.25% Government, 0.32% Institutional Non-Profit 6% 3% Industrial 18% Government 4% Single Family 22% Multi-Family 12% Single Family 77% Commercial 35% Single Family Multi-Family Commercial Industrial Non-Profit Institutional Government Figure 3-2 shows the distribution of impervious area across all properties in the City, indicating that the vast majority have small impervious areas, while a few properties have large impervious area. Table 3-2 lists the top 10 property owners and estimated IA of their parcels. In addition, the stormwater class, number of parcels, and percent of total IA are provided. The top 10 list was developed based on grouping by owner name and summing IA and counting the number of parcels. A different ranking is produced if the top 10 list is developed based on sorting by IA for individual parcels. Further, it is possible for a single owner to have multiple parcels with different stormwater class designations (i.e., a group of parcels for a single owner could be identified as commercial and institutional). The top 10 owners / parcels represent approximately 30 percent of the total estimated IA in the city. It is important to understand that property owners shown in Table 3-2 may have parcels that have IAs of less than 10,000 sf. Attachment F provides additional details. 3-2 ES BSS
209 SECTION 3 STORMWATER UTILITY SWMF RATE STRUCTURE FIGURE 3-2 Frequency Distribution for All Properties 10, % 9,000 90% 8,000 80% Number of Parcels 7,000 6,000 5,000 4,000 3,000 4,259 6,358 2,591 70% 60% 50% 40% 30% Cumulative Percent 2,000 1, , % 10% 0% Impervious Area (square feet) Number Parcels Cumulative Percent TABLE 3-2 Top 10 Owners Based on Total Estimated Impervious Area Rank Owner Name Estimated Impervious Area (sf) Percent of Total Impervious Area Number of Parcels 1 Park City Center Business Trust 4,573, RR Donnelley & Sons 4,454, Franklin & Marshall College 2,764, Burle Business Park LP 2,472, School District Of Lancaster 2,425, Redcen Inc 2,160, Amtrak 1,620, Lancaster General Hospital 1,406, Armstrong World Industries Inc 1,401, County of Lancaster 927, Total 24,258, List is based on grouping by owner name and summing estimated IA. ES BSS 3-3
210 PRELIMINARY STORMWATER MANAGEMENT FEE (SWMF) ANALYSIS 3.2 Equivalent Residential Unit Basis The development of a stormwater utility rate structure begins with defining the ERU. For most stormwater utilities, the ERU is defined as the median or average IA for single-family properties. Typically, a single-family property is limited to detached dwellings and is contingent upon available data. A recent trend among stormwater utilities is to base the rate structure on measurement of 1,000 sf instead of the median or average value for single-family properties. For purpose of this study, the rate structure was based on 1,000 sf. 3.3 Rate Structures There are several options for developing a rate structure for a stormwater utility: ERU method Total IA method Tiering method ERU Method One of the most common rate structures among stormwater utilities is the ERU method. The first step in evaluating this method is to develop the descriptive statistics for the single-family residential stormwater class. Table 3-3 summarizes the descriptive statistics for single-family (residential) properties. Attachment F provides additional details of the statistical analysis for other stormwater classes. TABLE 3-3 Descriptive Statistics for Single Family Properties in the City of Lancaster Statistic Total Impervious Area (sf) Minimum 1 25th percentile th percentile (median) 1,165 75th percentile 1,533 Maximum 35,441 Average 1,368 Standard Deviation 957 Mode 933 Skewness 12 Count (number of parcels) 13,407 Sum 18,337,179 Assumes parcels with total IA > 0 Assuming that the ERU would equal the median IA, then 1 ERU would equal 1,165 sf. Under this rate structure option, single-family residential properties would be charged for 1 ERU. All other properties (non-residential) would be charged based their total IA divided by the ERU base unit. For example, if a non-residential property has 11,650 sf of IA, then the property would be charged 10 ERUs (11,650/1,165). Table 3-4 provides a summary of ERUs based on the ERU method. 3-4 ES BSS
211 SECTION 3 STORMWATER UTILITY SWMF RATE STRUCTURE TABLE 3-4 Summary of ERU Rate Structure Method Stormwater Class Impervious Area (sf) Number of ERUs Single Family n/a 13,407 Multi-Family 9,909,174 8,506 Commercial 29,093,647 24,973 Industrial 15,205,021 13,052 Non-Profit 2,643,843 2,269 Institutional 4,824,416 4,141 Government 3,707,181 3,182 Total 69,530 1 ERU = 1,165 (median IA for single-family residential properties) One advantage of this rate structure option is its simplicity. Detailed IA need only be maintained for 23 percent of the properties because single-family residential properties are charged 1 ERU. The disadvantage of this rate structure is the intra-class equity among single-family residential properties. For example, if a property has an 800-sf house, then the owner would be paying more than his or her share of IA area. Conversely, if a property has a 2,500-sf house, then the owner is underpaying. Further, another disadvantage is that non-residential rate payers subsidize residential properties. If IA data are not available to support other rate structure methods, the ERU method is a reasonable estimate of stormwater runoff Total Impervious Area Method Under the total IA method, a uniform rate is applied to all properties based on total IA. That is, each property owner pays based on the total IA calculated for his or her property. Under this option, the rate would be expressed as $ per 1,000 sf. Another way of explaining it would be that 1 ERU equals 1,000 sf. For illustrative purposes, Table 3-5 provides the descriptive statistics for all properties. Table 3-6 provides a summary of the total IA method. TABLE 3-5 Descriptive Statistics for All Properties Statistic Total Impervious Area (sf) Minimum 1 25th percentile th percentile (median) 1,277 75th percentile 1,890 Maximum 4,246,304 Average 4,825 Standard Deviation 52,478 Mode 1,106 Skewness 49 Count (number of parcels) 17,353 Sum 83,720,461 Assumes parcels with total IA > 0 ES BSS 3-5
212 PRELIMINARY STORMWATER MANAGEMENT FEE (SWMF) ANALYSIS TABLE 3-6 Summary of Total Impervious Area Method Stormwater Class Impervious Area (sf) Number of ERUs Single Family 18,337,179 18,337 Multi-Family 9,909,174 9,909 Commercial 29,093,647 29,094 Industrial 15,205,021 15,205 Non-Profit 2,643,843 2,644 Institutional 4,824,416 4,824 Government 3,707,181 3,707 Total 83,720,461 83,720 1 ERU = 1,000 One advantage of this method is equity and fairness. All property owners pay based on their actual contribution to stormwater runoff. One disadvantage is the administrative burden and cost of data requirements. This option assumes that accurate and complete IA data are available for all properties. This option is not advisable because of the data requirements and administrative burden of managing detailed IA information for all properties. Another disadvantage is the likelihood of more appeals from rate payers disputing small differences in the IA calculations Tiering Method Although the ERU method is one of the most common rate structures for most of the stormwater utilities in operation now, recent trends show that utilities are opting for a tiered rate structure. A tiered rate structure defines tier ranges based on IA area and property owners assigned to tiers pay a flat rate. Property owners with an IA that exceeds an upper limit pay based on total IA. For this study, four tier ranges were identified based on increments of 1,000 sf. The upper limit in which property owners pay, based on total IA, is 3,000 sf. The upper limit is based on 90 percentile (see Figure3-3). In order to relate billing units to ERUs, it was assumed that 1 ERU equals 1,000 sf. For the first three tiers, a multiplier is calculated based on the middle value of the IA tier range. For example, the middle value for Tier 1 with range of 0 to 1,000 sf is 500 sf. This is equivalent to 0.5 ERUs or a multiplier of 0.5. Table 3-7 provides a summary of the tiering method. TABLE 3-7 Summary of Tiering Method Stormwater Class Tier 1 (<=1,000 sf) Tier 2 (>1,000 sf and <=2,000 sf) Tier 3 (>2,000 sf and <=3,000 sf) Tier 4 (>3,000 sf) Multiplier n/a Single Family Properties 4,254 7,508 1, ,407 IA n/a n/a n/a 1,862,180 18,620 ERUs* 2,127 11,262 3,113 1,862 18,364 Multi-Family Properties 76 1, ,976 IA n/a n/a n/a 7,110,661 7,110,661 ERUs* 38 1,646 1,110 7,111 9,904 Total 3-6 ES BSS
213 SECTION 3 STORMWATER UTILITY SWMF RATE STRUCTURE TABLE 3-7 Summary of Tiering Method Stormwater Class Commercial Industrial Tier 1 (<=1,000 sf) Tier 2 (>1,000 sf and <=2,000 sf) Tier 3 (>2,000 sf and <=3,000 sf) Tier 4 (>3,000 sf) Properties ,626 IA n/a n/a n/a 28,006,389 28,006,389 ERUs* ,006 29,095 Properties IA n/a n/a n/a 15,192,014 15,192,014 ERUs* ,192 15,205 Non-Profit Properties IA n/a n/a n/a 2,601,572 2,601,572 ERUs* ,602 2,643 Institutional Properties IA n/a n/a n/a 4,814,796 4,814,796 ERUs* ,815 4,825 Government Properties IA n/a n/a n/a 3,695,151 3,695,151 ERUs* ,695 3,708 Total ERUs 2,249 13,424 4,790 63,283 83,745 1 ERU = 1,000 * Number of ERUs for Tiers 1-3 are calculated based Property Count * Multiplier. Number of ERUs for Tier 4 is calculated based on IA / 1,000 sf. ERUs rounded to nearest whole number. Total ES BSS 3-7
214 PRELIMINARY STORMWATER MANAGEMENT FEE (SWMF) ANALYSIS FIGURE 3-3 Frequency Distribution for All Properties with Tier Alignment 10,000 Tier 1 Tier 2 Tier 3 Tier 4 100% 9,000 90% 8,000 80% Number of Parcels 7,000 6,000 5,000 4,000 3,000 6,358 4,259 2,591 70% 60% 50% 40% 30% Cumulative Percent 2,000 1, , % 10% 0% Impervious Area (square feet) Number Parcels Cumulative Percent One advantage of the tiering method is equity and fairness. In addition, the likelihood of appeals decreases because properties are assigned to a tier in which the chances of falling into a different tier are smaller. A disadvantage of the tiering method is additional analysis for billing system implementation and maintenance of IA data to support the assignment of properties to IA tiers. In addition to the scenario based on four tiers, a scenario based on seven tiers was evaluated and presented to the GIAC (see policy paper in Attachment B). The GIAC selected the four-tier option based on a balance of equity versus administrative costs of tracking the IA for additional tiers. 3.4 Comparison of Methods and Recommendation As described in the previous sections, several methods of developing billing units for the SWMF were evaluated. Each method has advantages and disadvantages. Table 3-8 summarizes the number of billing units by stormwater class, for each of the three rate structure methods. The ERU method results in the fewest number of billing units and therefore would require the highest rate per ERU to cover the same program cost as other options with more billing units. While it is the simplest method, a disadvantage is that single-family (residential) properties only pay 1 ERU regardless of IA, which does not promote fairness and equity among rate payers. The total IA and tiering methods generate a similar number of billing units. As noted, the disadvantage of the total IA method is the cost of maintaining IA data for all properties. Although there would be costs for maintaining IA data for the tiering method, it is relatively less. In addition, the tiering method would likely result in fewer appeals from rate payers disputing small differences in the IA calculations than the IA method. 3-8 ES BSS
215 SECTION 3 STORMWATER UTILITY SWMF RATE STRUCTURE The tiering method is the recommended rate structure because it balances a higher level of equity and fairness with reasonable level of costs and billing system maintenance. This method was presented to the GIAC, which supports a tiered rate structure using four tiers. TABLE 3-8 Summary of Billing Units by Stormwater Class and Rate Structure Method Rate Structure Method Stormwater Class ERU a Total Impervious Area b Tiering with 4 Tiers b Single Family 13,407 18,337 18,364 Multi-Family 8,506 9,909 9,904 Commercial 24,973 29,094 29,095 Industrial 13,052 15,205 15,205 Non-Profit 2,269 2,644 2,643 Institutional 4,141 4,824 4,825 Government 3,182 3,707 3,708 Total ERUs 69,530 83,720 83,745 a Assume 1 ERU = 1,165 sf b Assume 1 ERU = 1,000 sf ES BSS 3-9
216
217 SECTION 4 Rate Scenarios 4.1 Overview of Scenarios As noted in Section 1.3, LOS alternatives were evaluated and are documented in Technical Memorandum #1. The LOS alternatives consist of the following: Level of Service Rate Scenario Description Low 1 Assumes current LOS and MS4 permit implementation Medium 2 Includes current level of expenditure, plus additional program elements. GI Plan implementation (on public properties only), MS4 Permit implementation, increased maintenance and customer service High 3 Includes higher LOS for current program, plus additional program elements. GI Plan implementation (on public and private properties), MS4 permit implementation, high level of maintenance and customer service By default, the rate scenarios assume no additional debt financing. However, rate scenarios 2 and 3 evaluate the sensitivity of debt financing in Year 4. This is important because it helps illustrate how sensitive rates are to financing assumptions. For example, if a utility is facing a significant CIP, Pay-Go financing could result in high rates. If debt financing is possible, the utility can generate the necessary capital and the annual debt service payments help keep the rates relatively low. As noted in Section 2, the City has secured a PennVest loan and several grants for funding GI projects. Given the level of CIP projects identified to meet near-term MS4 permit requirements, the loan and grants keep the capital requirements relatively low for several years. When the loan and grant financing is exhausted, the level of CIP increases in the out years and cost recovery decisions are limited to receiving additional loans/grants, bond financing, or current program costs covered by the SWMF (Pay Go). 4.2 Low Level of Service (Rate Scenario 1) The low LOS rate scenario assumes current LOS and MS4 permit implementation. This represents the stormwater function and activities currently provided by DPW Assumptions The assumptions used for the low LOS rate scenario are: Rate Structure = tiering method (see Section 3.3.3) Collection Rate = 90 percent Allowance for operating reserve = 6 months annual O&M expense No allowance for SWMF credits/incentives Inflation Rate = 3 percent (O&M and CIP) No additional debt financing PennVest loans equal entire CIP for Years 1 5. Assumes the SWMF is not used for repayment of loan. No grants Growth in ERUs = 0.5 percent per year Program Financial Cost Requirements Table 4-1 summarizes the revenue requirements for the low LOS (Rate Scenario 1) based on the assumptions identified in Section ES BSS 4-1
218 PRELIMINARY STORMWATER MANAGEMENT FEE (SWMF) ANALYSIS TABLE 4-1 Program Cost Coverage Requirements for the Low Level of Service Rate Scenario (Rate Scenario 1) Year 1 Year 2 Year 3 Year 4 Year 5 O&M $966,000 $995,000 $1,024,000 $1,055,000 $1,087,000 Allowance Uncollectible Accounts $161,000 $161,000 $161,100 $161,200 $161,300 Allowance for SWMF Credits Allowance for Operating Reserve 482, , , , ,400 Debt Service Stormwater CIP 677, , ,000 1,153,000 1,205,000 Less: Non Rate Program Cost Investment Income (500) (1,400) (2,300) (3,100) (3,900) PennVest Loan (677,000) (844,000) (953,000) (1,153,000) (1,205,000) Grants Net Program Cost Requirement $1,609,300 $1,651,900 $1,695,000 $1,740,700 $1,787, Financial Summary Table 4-2 provides a financial summary for the low LOS (Rate Scenario 1). Detailed rate model pro forma tables are provided in Attachment G. It was assumed that the stormwater CIP is cost recovered by the PennVest loan (Table 4-3) and repayment is not provided by the SWMF. Table 4-4 summarizes the rates for Rate Scenario 1. TABLE 4-2 Financial Summary for the Low Level of Service Rate Scenario (Rate Scenario 1) Year 1 Year 2 Year 3 Year 4 Year 5 SWU Fee ($/1,000 sf) $19.22 $19.22 $19.22 $19.22 $19.22 ERUs 83,745 83,787 83,829 83,870 83,912 Operating Revenues SWMF $1,609,575 $1,610,380 $1,611,180 $1,611,990 $1,612,800 Less Allowance for Uncollectable Accounts ($161,000) ($161,000) ($161,100) ($161,200) ($161,300) Less Credits/Incentives $0 $0 $0 $0 $0 Interest Income $500 $1,400 $2,300 $3,100 $3,900 Total Revenues $1,449,075 $1,450,780 $1,452,380 $1,453,890 $1,455,400 Program Costs Covered O&M $965,666 $994,636 $1,024,475 $1,055,209 $1,086,866 Non Operating $0 $0 $0 $0 $0 Debt Service $0 $0 $0 $0 $0 Stormwater CIP $0 $0 $0 $0 $0 Total Program Costs Covered $965,666 $994,636 $1,024,475 $1,055,209 $1,086,866 Beginning Balance $0 $483,409 $939,553 $1,367,458 $1,766,139 Ending Balance $483,409 $939,553 $1,367,458 $1,766,139 $2,134, ES BSS
219 SECTION 4 RATE SCENARIOS TABLE 4-3 Capital Requirements for the Low Level of Service Rate Scenario (Rate Scenario 1) Capital Requirements Year 1 Year 2 Year 3 Year 4 Year 5 Total Stormwater CIP $677,000 $844,000 $953,000 $1,153,000 $1,205,000 Less: PennVest Loan $677,000 $844,000 $953,000 $1,153,000 $1,205,000 Less: Grants $- $- $- $- $- Amount to be funded by SWMF $- $- $- $- $- Percent Debt-Funded 0% 0% 0% 0% 0% Percent Equity-Funded 100% 100% 100% 100% 100% Amount Debt-Funded $- $- $- $- $- Amount Equity-Funded (Pay-Go) $- $- $- $- $- TABLE 4-4 Stormwater Utility Rate and Annual SWMF per Property by Tier Low Level of Service (Rate Scenario 1) Low Year 1 Year 2 Year 3 Year 4 Year 5 SWMF ($ per 1,000 sf) $19.22 $19.22 $19.22 $19.22 $19.22 Percent Increase Annual SWMF per Property Tier 1 (<=1,000 sf) $9.61 $9.61 $9.61 $9.61 $9.61 Tier 2 (>1,000 sf and <=2,000 sf) $28.83 $28.83 $28.83 $28.83 $28.83 Tier 3 (>2,000 sf and <=3,000 sf) $48.05 $48.05 $48.05 $48.05 $48.05 Tier 4 (>3,000) Properties pay based on total IA / SWMF. 4.3 Medium Level of Service (Rate Scenario 2) The medium LOS rate scenario evaluates the current level of expenditure plus additional program elements, such as maintenance for GI, administration of the SWMF credit program, and increased public education/outreach. In addition, this scenario assumes GI Plan implementation for publicly owned properties Assumptions The assumptions used for the low LOS rate scenario are: Rate Structure = tiering method (see Section 3.3.3) Collection Rate = 90 percent Allowance for operating reserve = 6 months annual O&M expense Allowance for SWMF credits/incentives = 10 percent of program costs covered for tiers 3 and 4 Inflation Rate = 3 percent (O&M and CIP) ES BSS 4-3
220 PRELIMINARY STORMWATER MANAGEMENT FEE (SWMF) ANALYSIS No additional debt financing. However, a sensitivity analysis assumes that 80 percent of the CIP in years 4 and 5 is debt-financed. Debt financing assumes an interest rate of 5 percent, 20-year term, 2 percent cost of issuance, 10 percent bond reserve, and target coverage ratio of 1.5. PennVest Loans equal to $7,000,000 and fund part of the CIP. Assumes SWMF is used to repay the loan based on schedule provided in Attachment E. Grants equal to $2,500,000 to fund part of the CIP. Growth in ERUs = 0.5 percent per year Program Financial Cost Requirements Table 4-5 summarizes the program financial cost requirements for the medium LOS (Rate Scenario 2) based on the assumption identified in Section TABLE 4-5 Program Cost Requirements for the Medium Level of Service Rate Scenario (Rate Scenario 2) Year 1 Year 2 Year 3 Year 4 Year 5 O&M $1,290,000 $1,328,000 $1,368,000 $1,409,000 $1,451,000 Allowance Uncollectible Accounts 259, , , , ,000 Allowance for SWMF Credits - 211, , , ,000 Allowance for Operating Reserve 645, , , , ,000 Debt Service 105, , , , ,000 Stormwater CIP 2,946,000 3,425,000 3,782,000 4,423,000 4,739,000 Less: Non Rate Program Cost Investment Income (600) (1,900) (2,700) (2,200) (1,400) Penn Vest Loan (1,473,000) (2,794,000) (2,733,000) - - Grants (1,178,000) (513,000) (809,000) - - Net Program Cost Requirement $2,593,400 $2,683,100 $3,015,300 $8,148,800 $8,784, Financial Summary Table 4-6 provides a financial summary for the medium LOS (Rate Scenario 2). Detailed rate model pro forma tables are provided in Attachment G. It was assumed that part of the stormwater CIP is cost recovered by the PennVest loan and grants (Table 4-7) and repayment is provided by the SWMF. As shown, the capital requirements increase significantly in years 4 and 5 because loan/grant funding is exhausted. In order to maintain an adequate operating reserve, rates increase precipitously. Table 4-8 summarizes the rates for Rate Scenario 2. TABLE 4-6 Financial Summary for the Medium Level of Service Rate Scenario (Service Rate Scenario 2) Year 1 Year 2 Year 3 Year 4 Year 5 SWU Fee ($/1,000 sf) $30.96 $30.96 $ $9.47 $96.32 ERUs 83,745 83,787 83,829 83,870 83,912 Operating Revenues SWMF $2,592,738 $2,594,030 $2,595,330 $6,665,180 $8,082,440 less Allowance for Uncollectable Accounts ($259,274) ($259,403) ($259,533) ($666,518) ($808,244) less Credits/Incentives $0 ($210,859) ($210,964) ($541,786) ($656,989) Interest Income $600 $1,900 $2,700 $2,200 $1,400 Total Revenues $2,334,064 $2,125,668 $2,127,533 $5,459,076 $6,618, ES BSS
221 SECTION 4 RATE SCENARIOS TABLE 4-6 Financial Summary for the Medium Level of Service Rate Scenario (Service Rate Scenario 2) Program Costs Covered Year 1 Year 2 Year 3 Year 4 Year 5 O&M $1,289,512 $1,328,197 $1,368,043 $1,409,085 $1,451,357 Non Operating Debt Service $104,700 $104,700 $255,000 $405,200 $405,200 Stormwater CIP (Pay Go) $295,000 $118,000 $240,000 $4,423,000 $4,739,000 Total Program Costs Covered $1,689,212 $1,550,897 $1,863,043 $6,237,285 $6,595,557 Beginning Balance $0 $644,852 $1,219,623 $1,484,113 $705,904 Ending Balance $644,852 $1,219,623 $1,484,113 $705,904 $728,954 TABLE 4-7 Capital Requirements for the Medium Level of Service Rate Scenario (Service Rate Scenario 2) Medium Level of Service (Rate Scenario 2) Capital Requirements Year 1 Year 2 Year 3 Year 4 Year 5 Total Stormwater CIP $ 2,946,000 $3,425,000 $3,782,000 $4,423,000 $4,739,000 Less: PennVest Loan $1,473,000 $2,794,000 $2,733,000 $- $- Less: Grants $1,178,000 $513,000 $ 809,000 $ - Amount to be funded by SWMF $295,000 $118,000 $240,000 $4,423,000 $4,739,000 Percent Debt-Funded 0% 0% 0% 0% 0% Percent Equity-Funded 100% 100% 100% 100% 100% Amount Debt-Funded $- $- $- $- $- Amount Equity-Funded (Pay-Go) $295,000 $118,000 $240,000 $4,423,000 $4,739,000 TABLE 4-8 Stormwater Utility Rate and Annual SWMF per Property by Tier Medium Level of Service (Rate Scenario 2) Low Year 1 Year 2 Year 3 Year 4 Year 5 SWMF ($ per 1,000 sf) $30.96 $30.96 $30.96 $79.47 $96.32 Percent Increase 0.0% 0.0% 156.7% 21.2% Annual SWMF per Property Tier 1 (<=1,000 sf) $15.48 $15.48 $15.48 $39.74 $48.16 Tier 2 (>1,000 sf and <=2,000 sf) $46.44 $46.44 $46.44 $ $ Tier 3 (>2,000 sf and <=3,000 sf) $77.40 $77.40 $77.40 $ $ Tier 4 (>3,000) Properties pay based on total IA/ SWMF. ES BSS 4-5
222 PRELIMINARY STORMWATER MANAGEMENT FEE (SWMF) ANALYSIS Sensitivity Analysis To test the rate sensitivity based on debt financing the CIP starting in Year 4, Table 4-9 summarizes the capital requirements assuming 80 percent of the CIP is debt financed for years 4 and 5. It was assumed bonds are issued in Year 4 to cover the CIP for years 4 and 5. TABLE 4-9 Capital Requirements and Debt Financing Medium Level of Service (Rate Scenario 2) Capital Requirements Year 1 Year 2 Year 3 Year 4 Year 5 Total Stormwater CIP $2,946,000 $3,425,000 $3,782,000 $4,423,000 $4,739,000 Less: PennVest Loan $1,473,000 $2,794,000 $2,733,000 $- $- Less: Grants $1,178,000 $513,000 $809,000 $- Amount to be funded by SWMF $295,000 $118,000 $240,000 $4,423,000 $4,739,000 Percent Debt-Funded 0% 0% 0% 80% 80% Percent Equity-Funded 100% 100% 100% 20% 20% Amount Debt-Funded $-- $- $- $3,538,400 $3,791,200 Amount Equity-Funded (Pay-Go) $295,000 $118,000 $240,000 $884,600 $ 947,800 The estimated debt service is summarized in Table By issuing bonds in Year 4, the level of CIP funded by Pay- Go decreases and the annual debt service payments are at a level to keep future rate increase relatively low. To help ease the rate shock, one option is to implement periodic rate increases to avoid a sudden spike in rates. For example, in anticipation of significant capital requirements, if rates increase 10 percent annually starting in Year 2, then a significant rate increase can be avoided. Table 4-11 shows the rate sensitivity for Rate Scenario 2 based on debt financing. Another approach would be to set the rate in Year 1 to cover the significant capital requirements in the future. This would allow the stormwater fund to generate adequate reserves and to avoid a significant rate increase in a future year. Often, this approach can result in the lowest long-term rate. TABLE 4-10 Estimated Debt Service Medium Level of Service (Rate Scenario 2) Year 1 Year 2 Year 3 Year 4 Year 5 Projected Debt Issuance Capital Requirements $0 $0 $0 $7,329,600 $0 Cost of Issuance $0 $0 $0 $146,592 $0 Bond Reserve $0 $0 $0 $732,960 $0 Estimated Bond Issue $0 $0 $0 $8,209,152 $0 Projected Debt Service Series Year 1 $0 $0 $0 $0 $0 Series Year 2 $0 $0 $0 $0 Series Year 3 $0 $0 $0 Series Year 4 $658,724 $658,724 Series Year 5 $0 Total Projected Debt Service $0 $0 $0 $658,724 $658, ES BSS
223 SECTION 4 RATE SCENARIOS TABLE 4-11 Rate Sensitivity Based on Debt Financing Medium Level of Service (Rate Scenario 2) Low Year 1 Year 2 Year 3 Year 4 Year 5 SWMF ($ per 1,000 sf) $30.96 $30.96 $30.96 $43.65 $44.57 Percent Increase 0.0% 0.0% 41.0% 2.1% Annual SWMF per Property Tier 1 (<=1,000 sf) $15.48 $15.48 $15.48 $21.83 $22.29 Tier 2 (>1,000 sf and <=2,000 sf) $46.44 $46.44 $46.44 $65.48 $66.86 Tier 3 (>2,000 sf and <=3,000 sf) $77.40 $77.40 $77.40 $ $ Tier 4 (>3,000) Properties pay based on total IA/ SWMF. 4.4 High Level of Service (Rate Scenario 3) The high LOS rate scenario evaluates the highest LOS, such as maintenance for GI, administration of the SWMF credit program, and increased public education/outreach. In addition, this scenario assumes GI Plan implementation for publicly and privately owned properties Assumptions The assumptions used for the high LOS rate scenario are: Rate Structure = tiering method (see Section 3.3.3) Collection Rate = 90 percent Allowance for operating reserve = 6 months annual O&M expense Allowance for SWMF credits/incentives = 10 percent of program costs covered for tiers 3 and 4 Inflation Rate = 3 percent No additional debt financing. However, a sensitivity analysis assumes 80 percent of the CIP in years 4 and 5 are debt-financed. Debt financing assumes an interest rate of 5 percent, 20-year term, 2 percent cost of issuance, 10 percent bond reserve, and target coverage ratio of 1.5. PennVest Loans equal entire CIP for years 1 5. Assumes SWMF is used to repay the loan based on schedule provided in Attachment E. Growth in ERUs = 0.5 percent per year Program Financial Cost Requirements Table 4-12 summarizes the program financial cost requirements for the high LOS (Rate Scenario 3) based on the assumptions identified in Section Under Rate Scenario 2, the net program financial cost requirement nearly doubles because loan/grant funding for CIP ends and decisions regarding the cost recovery of the increase in capital requirements will affect rates. ES BSS 4-7
224 PRELIMINARY STORMWATER MANAGEMENT FEE (SWMF) ANALYSIS TABLE 4-12 Program Financial Cost Requirements for the High Level of Service Rate Scenario (Rate Scenario 3) Year 1 Year 2 Year 3 Year 4 Year 5 O&M $1,749,000 $1,802,000 $1,856,000 $1,912,000 $1,969,000 Allowance Uncollectible Accounts 510, , ,000 1,175,000 1,238,000 Allowance for SWMF Credits - 415, , ,000 1,007,000 Allowance for Operating Reserve 875, , , , ,000 Debt Service 105, , , , ,000 Stormwater CIP 4,647,000 5,537,000 6,158,000 7,283,000 7,735,000 Less: Non Rate Revenue Investment Income (900) (1,800) (1,900) (1,900) (1,900) PennVest Loan (1,858,000) (2,768,000) (2,374,000) - - Grants (929,000) (553,000) (1,018,000) - - Net Program Cost Financial Requirement $5,098,100 $5,947,200 $6,882,100 $12,684,100 $13,336, Financial Summary Table 4-13 provides a financial summary for the high LOS (Rate Scenario 3). Detailed rate model pro forma tables are provided in Attachment G. It is assumed that part of the stormwater CIP is cost recovered by the PennVest loan and grants (Table 4-14) and repayment is provided by the SWMF. Table 4-15 summarizes the rates for Rate Scenario 3. TABLE 4-13 Financial Summary for the High Level of Service Rate Scenario (Service Rate Scenario 3) Year 1 Year 2 Year 3 Year 4 Year 5 SWU Fee ($/1,000 sf) $60.89 $60.89 $71.00 $ $ ERUs 83,745 83,787 83,829 83,870 83,912 Operating Revenues SWMF $5,099,218 $5,101,770 $5,951,830 $11,754,440 $12,383,790 less Allowance for Uncollectable Accounts ($509,922) ($510,177) ($595,183) ($1,175,444) ($1,238,379) less Credits/Incentives $0 ($414,702) ($483,800) ($955,472) ($1,006,629) Interest Income $900 $1,800 $1,900 $1,900 $1,900 Total Program Costs $4,590,196 $4,178,691 $4,874,747 $9,625,424 $10,140,682 Program Costs Covered O&M $1,749,312 $1,801,791 $1,855,845 $1,911,520 $1,968,866 Non Operating Debt Service $104,700 $104,700 $255,000 $405,200 $405,200 Stormwater CIP (Pay-Go) $1,860,000 $2,216,000 $2,766,000 $7,283,000 $7,735,000 Total Program Costs Covered $3,714,012 $4,122,491 $4,876,845 $9,599,720 $10,109,066 Beginning Balance $0 $876,184 $932,384 $930,285 $955,989 Ending Balance $876,184 $932,384 $930,285 $955,989 $987, ES BSS
225 SECTION 4 RATE SCENARIOS TABLE 4-14 Capital Requirements for the High Level of Service Rate Scenario (Service Rate Scenario 3) Capital Requirements Year 1 Year 2 Year 3 Year 4 Year 5 Total Stormwater CIP $4,647,000 $5,537,000 $6,158,000 $7,283,000 $7,735,000 Less: PennVest Loan $1,858,000 $2,768,000 $2,374,000 $- $- Less: Grants $929,000 $553,000 $1,018,000 $- $- Amount to be funded by SWMF $1,860,000 $2,216,000 $2,766,000 $7,283,000 $7,735,000 Percent Debt-Funded 0% 0% 0% 0% 0% Percent Equity-Funded 100% 100% 100% 100% 100% Amount Debt-Funded $- $- $- $- $- Amount Equity-Funded (Pay-Go) $1,860,000 $2,216,000 $2,766,000 $7,283,000 $7,735,000 TABLE 4-15 Stormwater Utility Rate and Annual SWMF per Property by Tier Medium Level of Service (Rate Scenario 2) Low Year 1 Year 2 Year 3 Year 4 Year 5 SWMF ($ per 1,000 sf) $60.89 $60.89 $71.00 $ $ Percent Increase 0.0% 16.6% 97.4% 5.3% Annual SWMF per Property Tier 1 (<=1,000 sf) $30.45 $30.45 $35.50 $70.08 $73.79 Tier 2 (>1,000 sf and <=2,000 sf) $91.34 $91.34 $ $ $ Tier 3 (>2,000 sf and <=3,000 sf) $ $ $ $ $ Tier 4 (>3,000) Properties pay based on total impervious area / SWMF Sensitivity Analysis Similar to Rate Scenario 2, to test the rate sensitivity based on debt financing the CIP starting in Year 4, Table 4-16 summarizes the capital requirements assuming 80 percent of the CIP is debt financed for years 4 and 5. It was assumed bonds are issued in Year 4 to cover the CIP for years 4 and 5. Table 4-17 summarizes the estimate debt service for Rate Scenario 3. Table 4-18 summarize the rate sensitivity for Rate Scenario 3 based on debt financing. TABLE 4-16 Capital Requirements and Debt Financing High Level of Service (Rate Scenario 3) Capital Requirements Year 1 Year 2 Year 3 Year 4 Year 5 Total Stormwater CIP $4,647,000 $5,537,000 $6,158,000 $7,283,000 $7,735,000 Less: Penn Vest Loan $1,858,000 $2,768,000 $2,374,000 $- $- Less: Grants $ 929,000 $553,000 $1,018,000 $- $- Amount to be funded by SWMF $1,860,000 $2,216,000 $2,766,000 $ 7,283,000 $7,735,000 ES BSS 4-9
226 PRELIMINARY STORMWATER MANAGEMENT FEE (SWMF) ANALYSIS TABLE 4-16 Capital Requirements and Debt Financing High Level of Service (Rate Scenario 3) Capital Requirements Year 1 Year 2 Year 3 Year 4 Year 5 Percent Debt-Funded 0% 0% 0% 80% 80% Percent Equity-Funded 100% 100% 100% 20% 20% Amount Debt-Funded $- $- $- $5,826,400 $6,188,000 Amount Equity-Funded (Pay-Go) $1,860,000 $2,216,000 $2,766,000 $1,456,600 $1,547,000 TABLE 4-17 Estimated Debt Service High Level of Service (Rate Scenario 3) Projected Debt Issuance Year 1 Year 2 Year 3 Year 4 Year 5 Capital Requirements $0 $0 $0 $12,014,400 $0 Cost of Issuance $0 $0 $0 $240,288 $0 Bond Reserve $0 $0 $0 $1,201,440 $0 Estimated Bond Issue $0 $0 $0 $13,456,128 $0 Projected Debt Service Series Year 1 $0 $0 $0 $0 $0 Series Year 2 $0 $0 $0 $0 Series Year 3 $0 $0 $0 Series Year 4 $1,079,755 $1,079,755 Series Year 5 $0 Total Projected Debt Service $0 $0 $0 $1,079,755 $1,079,755 TABLE 4-18 Rate Sensitivity based on Debt Financed High Level of Service (Rate Scenario 3) Low Year 1 Year 2 Year 3 Year 4 Year 5 SWMF ($ per 1,000 sf) $60.89 $60.89 $71.00 $71.07 $73.20 Percent Increase 0.0% 16.6% 0.1% 3.0% Annual SWMF per Property Tier 1 (<=1,000 sf) $30.45 $30.45 $35.50 $35.54 $36.60 Tier 2 (>1,000 sf and <=2,000 sf) $91.34 $91.34 $ $ $ Tier 3 (>2,000 sf and <=3,000 sf) $ $ $ $ $ Tier 4 (>3,000) Properties pay based on total impervious area / SWMF ES BSS
227 4.5 Scenario Comparison SECTION 4 RATE SCENARIOS The three rate scenarios were evaluated and sensitivity analyses regarding capital financing were considered for rate scenarios 2 and 3. Operating expenses for Rate Scenario 2 are approximately $320,000 greater than for Rate Scenario 1. Operating expenses for Rate Scenario 3 are approximately $460,000 greater than for Rate Scenario 2. For the 5-year study period, operating expenses increase slightly due to an inflation assumption of 3 percent. Figure 4-1 compares the operating expense for each scenario. FIGURE 4-1 Estimated Stormwater Operating and Maintenance Expenditures $2,500,000 O&M Expenses $2,000,000 $1,500,000 $1,000,000 Low Medium High $500,000 $ Year One of the major cost items is the CIP, which for rate scenarios 2 and 3 is approximately three times operating expenses. Rate Scenario 1 is unlike scenarios 2 and 3 because it considers current stormwater functions/service provided by DPW. It does not consider the additional LOS needed to meet MS4 permit requirements and to address the City s stormwater needs. There are no capital requirements for Rate Scenario 1 because it is assumed that the PennVest loan will fund capital projects. In contrast, rate scenarios 2 and 3 consider the additional programs and LOS needed to meet MS4 permit requirements and the City s stormwater needs. Loans and grants are assumed to fund the capital requirements in the early years, but the capital requirements increase dramatically in years 4 and 5. Figure 4-2 compares the estimated stormwater CIP by rate scenario before consideration of grants and loans. The capital requirements for the SWMF after consideration of grants and loans is summarized in Figure 4-3. As shown, there is a significant increase in years 4 and 5 that would need to be cost recovered by additional grants/loans, current revenue from the SWMF (Pay Go), or bond proceeds. ES BSS 4-11
228 PRELIMINARY STORMWATER MANAGEMENT FEE (SWMF) ANALYSIS FIGURE 4-2 Estimated Stormwater CIP (before grants and loans) Stormwater CIP Millions $9 $8 $7 $6 $5 Low $4 Medium High $3 $2 $1 $ Year FIGURE 4-3 Estimated Stormwater CIP (after grants and loans) Stormwater CIP Millions $9 $8 $7 $6 $5 Low $4 Medium High $3 $2 $1 $ Year 4-12 ES BSS
229 SECTION 4 RATE SCENARIOS Figure 4-4 compares the net program financial cost requirements for each rate scenario, which also shows the significant increase associated with the capital requirements in years 4 and 5. There are a couple options for cost recovery of the capital requirements. Additional loans/grants would need to be identified to reduce the portion cost recoveredby the SWMF to a level that does not require significant rate increases. Assuming that no additional loans/grants are available, the SWMF would need to fund the capital requirements with current revenues (Pay- Go) or debt financing. FIGURE 4-4 Estimated Net Revenue (Program Financial Cost Coverage) Requirements (after grants and loans) Millions $14 $12 Net Revenue Requirements $10 $8 $6 Low Medium High $4 $2 $ Year To finance the net program cost requirements identified in Figure 4-4 and assuming Pay-Go for financing the CIP, Figure 4-5 summarizes the resulting SWMF by rate scenario. Figure 4-6 summarizes the program costs covered by rate scenario assuming Pay-Go financing. As shown, in order to fund the CIP starting in Year 4, the SWMF for rate scenarios 2 and 3 must increase by at least 100 percent. Consideration of cost recovery for the CIP in years 4 and 5 are important because the same level of capital expenditures may not extend beyond Year 5. For rate scenarios 2 and 3, a sensitivity analysis of Pay-Go versus debt financing in Year 4 was evaluated. This is important because it helps illustrate how sensitive rates are to financing assumptions. Figure 4-7 summarizes the sensitivity analysis for Rate Scenario 2 and Figure 4-8 summarizes the sensitivity analysis for Rate Scenario 3. The SWMF under the debt financing analysis is lower because the bond proceeds provide the capital to design and construct projects. The annual debt service (to pay for principal and interests on the bond) helps keep the SWMF relatively low by spreading the costs over the useful life of the stormwater facilities. ES BSS 4-13
230 PRELIMINARY STORMWATER MANAGEMENT FEE (SWMF) ANALYSIS FIGURE 4-5 Comparison of SWMF by Rate Scenario (Pay-Go financing) $160 $140 $ $ $120 IASF ($/1,000 sf) $100 $80 $60 $60.89 $60.89 $71.00 $79.47 $96.32 Low Medium High $40 $30.96 $30.96 $30.96 $20 $19.22 $19.22 $19.22 $19.22 $19.22 $ Year FIGURE 4-6 Comparison of Program Cost Covered by the SWMF by Rate Scenario (Pay-Go financing) $11 Millions $10 $9 $8 $7 $6 $5 $4 Low Medium High $3 $2 $1 $ Year 4-14 ES BSS
231 SECTION 4 RATE SCENARIOS FIGURE 4-7 Sensitivity of Bond versus Pay-Go financing (Rate Scenario 2 Medium Level of Service) $160 $140 $120 Annual Rate ($/1,000 sf) $100 $80 $60 $79.47 $96.32 $40 $30.96 $30.96 $30.96 $43.65 $44.57 $20 $30.96 $30.96 $30.96 Bonds Pay Go $ Year FIGURE 4-8 Sensitivity of Bond versus Pay-Go financing (Rate Scenario 3 High Level of Service) $160 $140 $ $ $120 Annual Rate ($/1,000 sf) $100 $80 $60 $60.89 $60.89 $60.89 $60.89 $71.00 $71.00 $71.07 $73.20 $40 $20 Bonds Pay Go $ Year ES BSS 4-15
232 PRELIMINARY STORMWATER MANAGEMENT FEE (SWMF) ANALYSIS 4.6 Alternatives to SWMF For comparative purposes, a simple analysis of alternatives to the SWMF was prepared. This analysis evaluated Rate Scenario 2 Medium Level of Service only. The alternatives include a dedicated portion of the millage rate (the City s property tax) and an incremental increase to the sewer rate. The alternatives were compared to the tiering method rate structure (Section 3.3.3). Table 4-19 and Figure 4-9 compare the alternatives and annual charges for example properties to generate $2,593,400 (i.e., net program financial cost requirements for Rate Scenario 2 - Medium Level of Service Pay-Go Year 1.). Based on the example presented in Table 4-19, some properties would pay less with the SWMF than a dedicated tax or sewer charge. For properties with large amount of IA, the SWMF could be higher than a dedicated tax or sewer charge. This underscores the equity and fairness principal of the SWMF. Because IA generates stormwater runoff that affects water quality and the environment, an IA- based fee is the most appropriate mechanism. TABLE 4-19 Comparison of Alternatives to the SWMF Impervious Area Fee Dedicated Tax Sewer Charge Rate to generate $2,593,400 (d) $31 $1.329 $1.69 Units $ / 1,000 sf (a) $ per mil (b) $ per 1,000 gal (c) Single-Family Residential - Tier 1 $15 $73 $ sf $55,200 58,000 gallons Single-Family Residential - Tier 2 $46 $79 $144 1,155 sf $59,500 85,000 gallons Single-Family Residential - Tier 3 $104 $216 $44 3,373 sf $162,900 26,000 gallons Multi-Family Residential $1,322 $439 $127 28,578 sf $330, ,000 gallons Industrial $10,603 $2,787 $ ,842 sf $2,096, ,000 gallons Commercial $600 $321 $46 19,389 sf $241,700 27,000 gallons Private Parking Lot $1,822 $382 $0 58,859 sf $287,400 0 gallons (a) assumes 83,745 ERUs based on tiering method (4 tiers). (b) assumes FY 2011 $1,951,689,300 of total assessed property value. A mill is equal to $1 in taxation for every $1,000 of assessed value of the property. The 2011 millage rate for the City of Lancaster is mils. This analysia is not based on an actual fiscal impact analysis and is provided for illustrative purposes. (c) assumes FY ,532 million gallons for in-city water consumption, based on 247 gallons per day per account and 17,000 in-city accounts. Sewer bills are issued quarterly and based on declining block rate structure. The first 75,000 gallons is $ per 1,000 gallons; the next 925,000 gallons is $ per 1,000 gallons; and additional usage greater than 1,000,000 is $ This analysis is not based on an actual cost of service rate study and is provided for illustrative purposes. (d) assumes Net Program Financial Cost Requirements for Rate Scenario 2 - Medium Level of Service Pay-Go Year ES BSS
233 SECTION 4 RATE SCENARIOS FIGURE 4-9 Comparison of Annual Charge for Alternatives to the SWMF $12,000 $10,000 $8,000 Annual Charge $6,000 $4,000 Impervious Area Service Fee Dedicated Tax Sewer Charge $2,000 $0 ES BSS 4-17
234
235 SECTION 5 Summary Results and Recommendation 5.1 Summary Results The City of Lancaster is faced with recent regulatory requirements such as the MS4 permit and consent orders related to CSOs, both of which are associated with stormwater runoff. Several policy papers have been developed and presented to the GIAC in order to review aspects of the proposed SWMF. In addition, these policy papers also help inform the SWMF rate modeling. The SWMF Rate Model evaluated the program costs based on three LOS alternatives identified in Technical Memorandum #1. These were aligned with the three rate scenarios. The low LOS represents the current conditions and does not consider the program needs to meet all MS4 permit and other regulatory requirements. The high LOS considers program needs above and beyond MS4 permit and other regulatory requirements. The medium LOS represents the estimated program needs to stratify MS4 permit and other regulatory requirements. IA estimates were developed based on aerial photography and digitization of IAs included the City s geographic information system. The geographic information system data were analyzed to develop three rate structure options (ERU method, total IA method, and tiering method). The top 10 property owners based on total IA represents approximately 30 percent of the total IA in the city. Based on feedback from the GIAC, the tiering method was used in the three rate scenarios because it represents the most reasonable and equitable method. The program financial cost requirements include the program costs, debt service, and equity cost recovered CIP (Pay-Go) plus allowances for operating reserve, uncollectible accounts, and SWMF credits. Non-rate program financial costs (i.e., interest income, grants/loans) are subtracted from the costs and help to minimize the impacts on the SWMF. The net program financial cost requirements also represent the portion of the total program financial cost requirements that needs to be generated through the SWMF to cover stormwater management costs and other financial commitments. The capital requirements represent the largest expense item. The use of grants and loans in early years offset the CIP cost and help to keep the SWMF low. However, in years 4 and 5 the capital requirements increase significantly because available grants/loans are exhausted, which affects the SWMF. For rate scenarios 2 and 3, a sensitivity analysis of Pay-Go versus debt financing was considered. This is important because it helps illustrate how sensitive rates are to financing assumptions. For example, if a utility is facing a significant CIP, Pay-Go financing could result in high rates. If debt financing is possible, the utility can generate the necessary capital and the annual debt service payments help keep the rates relatively low. Alternatives to the SWMF include a dedicated portion of the millage rate or addition to the sewer charge. The equivalent rates to fund the Year 1 of Rate Scenario 2 (medium LOS) were evaluated. Although these alternative rates could cover the program costs, they do not address the equity and fairness principle in that the charge is not based on contribution to stormwater runoff. 5.2 Recommendation Our recommendation is the cost recovery plan identified under Rate Scenario 2, including the following: Use the program costs for the medium LOS. Use of PennVest loan and other grants to fund capital requirements in years 1-3. Use the tiering method (four tiers) rate structure, which is applied to all properties. ES BSS 5-1
236 PRELIMINARY STORMWATER MANAGEMENT FEE (SWMF) ANALYSIS To fund capital requirements in years 4 and 5, identify additional grants/loans or consider the use of debt financing. 5-2 ES BSS
237 Attachment A Stormwater Utility Program Needs Policy Paper
238
239 Stormwater Utility Program Needs Policy Development Summary Lancaster, PA Policy Issue: What is funded by the proposed Stormwater Utility? Policy Paper No. 1 Date Prepared: April 25, 2012 Date Revised: May 9, 2012 Date Final: Overview There are several types of funding sources, which may include one or a combination of Ad valorem taxes, grants, loans, and/or user charges. A stormwater utility is a funding mechanism that is dedicated for a variety of stormwater program elements, which may include conveyance, maintenance, and capital improvements. Currently, the City s General Fund and Sewer Fund are the source of funding for stormwater programs. In order to consider funding source, it is important to define the costs and level of service for stormwater programs. The purpose of this policy paper is to define what program elements (O&M and CIP) should be funded by the proposed stormwater utility fee pursuant to Pennsylvania law. A stormwater utility can fund O&M and/or capital projects. O&M can include administrative costs, inspection/maintenance costs, billing/collection costs, and other stormwater related functions. Capital project costs can include rehabilitation and replacement of stormwater facilities. Program elements that could be funded by the stormwater utility fee include the following: Capital Improvement Projects o Green Infrastructure Program (tables 5.9 and 5.10 from GI plan) o CSO / wet weather related projects from wastewater CIP (funding source = sewer fund) o Catch Basin Rehabilitation and Replacement o Storm Drain Rehabilitation and Replacement o Stormwater / Drainage Master Plan CIP, for flood relief (not funded) Program Administration o Billing and Collection o Incentive/Credit Program (costs of administering program) Inspections and Maintenance o Green Infrastructure o Dry and Wet Ponds (inspection only, privately owned so not currently maintained by the City) o Street Sweeping o Catch Basin o Drainage Ditch o CSO / wet weather facilities (funded by sewer fund) o Diversion Chambers o Junction Chambers o Manholes o Outfalls o Pressure Junction o Pump Station o Force Main Sewer o Gravity Main Sewer o Flow Monitoring NPDES Phase II Implementation (MS4 Permit) o Public Education o Public Participation / Involvement o Illicit Discharge Detection / Elimination o Construction Site Runoff Control o Post Construction Stormwater Management o Pollution Prevention Water Quality Monitoring (TMDL compliance) Floodplain Management (not funded) Wastewater Treatment (funding source = sewer fund) Exhibits 1a e provides summary tables of the level of service assumptions. Exhibit 2 shows the estimated maintenance costs by level of service. Exhibits 3a c summarizes the estimated capital costs for the low, medium, and high level of service options. Exhibits 4a b summarizes the estimated capital costs for the high level of service option. Exhibit 5a b summarizes overall capital and maintenance costs for 3 levels of service options. PAGE 1 OF 14
240 Stormwater Utility Program Needs Policy Development Summary Lancaster, PA Policy Issue: What is funded by the proposed Stormwater Utility? Policy Paper No. 1 Date Prepared: April 25, 2012 Date Revised: May 9, 2012 Date Final: Consultant Recommendation Policy Options Level of Service Alternative 1 Current Level of Service and MS4 Permit Implementation Level of Service Alternative 2 GI Plan Implementation (public only), MS4 Permit Implementation, Increased Maintenance and Customer Service Level of Service Alternative 3 GI Plan Implementation, MS4 Permit Implementation, High Level of Maintenance and Customer Service Issues, Concerns, Benefits Level of Service Alternative 3 would provide funding for a comprehensive program that includes preventive and corrective maintenance, inspection of facilities, additional CIP projects, drainage master planning. However, the rate per ERU may not be politically acceptable. Level of Service Alternative 1 provides only the bare bones program with very little advancement above the current program. The fee is nominal, but the services are not comprehensive. Level of Service Alternative 2 provides advancement above the current program, including implementation of GI Plan elements on public property Related policy issues include debt financing of CIP, payment of existing debt service for current CIP. A separate policy decision will need to be made on whether existing program elements funded by the sewer fund will be funded by an impervious area fee, or whether new program costs due to regulatory drivers would be paid by the fee. PAGE 2 OF 14
241 Stormwater Utility Program Needs Policy Development Summary Lancaster, PA Policy Issue: What is funded by the proposed Stormwater Utility? Policy Paper No. 1 Date Prepared: April 25, 2012 Date Revised: May 9, 2012 Date Final: Advisory Committee Comments What is funded by the Program? The City clarified that currently the potable water usage is used to apportion costs for all sewer related city services including storm water Question: is the user fee going to just reapportion existing costs or will it also pay for the increase in program costs due to new elements and LOS increases? Response: it was clarified that this is a key decision that needs to be made. But the purpose of considering low, medium and high program costs in developing fees is to bracket likely choices in terms of what programs could be funded by the fee. It was indicated that there is an inequity in using the current water/sewer fee system (based on water usage) to pay for stormwater/cso issues, that are based on volume of runoff from each property. It was recommended to add flood relief to clarify the result of a storm water/drainage master plan on the CIP list The City indicated that the CSO and treatment facility cost would remain in sewer fund Illicit discharge detection and elimination (IDDE) and cross-connections were discussed as a cost due to the need to inspect the system to determine presence of cross connected laterals, illegal connections, and sources of wet weather flow into the sanitary sewer system including sump pumps. It was suggested that we consider including a provision for expenses that we may not be thinking of (e.g. nutrient trading). The City clarified the role of the budget for nutrient credit purchase/sale in the sewer fund that provides the City with a cost benefit for its treatment of nutrients at the AWWTP beyond the level required in its current allocation. What Level of Service (LOS) Scenarios should be included in rate structure analysis It was questioned if the LOS would result in EPA acceptance of programs. Response: EPA rarely goes on record approving programs, so there s no certainty in what LOS is acceptable to meet EPA goals. The regulatory drivers for the program were discussed including the uncertainties imposed by the EPA administrative order, the TMDL and future changes that are likely to occur in the City s MS4 permit It was suggested have a level of service between 2&3 to provide more granularity in options for LOS to help clarify the understanding of the potential acceptability of the various program components. It was suggested that LOS1 might be worth taking off the table. However, others pointed out that LOS1 illustrates the concept of the equity principle and is important to keep City indicated that the permit requirement is to clean once / year Action - Fix level of service for street sweeping (CH2MHILL) Need to clarify the pollutant removal benefits of Street sweeping (City has provided estimates for the WIP) It was noted that outreach could help reduce investments in ongoing street sweeping and inlet cleaning Action - Need to include more intuitive metrics (CH2M HILL) PAGE 3 OF 14
242 Stormwater Utility Program Needs Policy Development Summary Lancaster, PA Policy Issue: What is funded by the proposed Stormwater Utility? Policy Paper No. 1 Date Prepared: April 25, 2012 Date Revised: May 9, 2012 Date Final: Decision/Action PAGE 4 OF 14
243 Exhibit 1a Catch Basin (n = 1,910) Level of Service 1 Level of Service 2 Level of Service 3 Activity Number/ Linear feet Frequency Number/ Linear feet Frequency Number/ Linear feet Frequency Inlet Cleaning 2,747 1x per year 2,747 1x per year 2,747 2x per year Rehabilitation / Replacement 72 Per year 72 Per year 72 Per year Exhibit 1b Street Sweeping (~300 miles) Level of Service 1 Level of Service 2 (current funding) Level of Service 3 Activity Frequency Frequency Frequency Routes per month 2 per month 3 per month Development Route 2 per month 2 per month 3 per month Alleys 2 per month 2 per month 3 per month Park City Route 2 per month 2 per month 3 per month 5th Week Route 2 per month 2 per month 3 per month Downtown District 5 per week 5 per week 5 per week Exhibit 1c Storm Sewer (79 mi MS4, 26 mi CSS) Level of Service 1 Level of Service 2 Level of Service 3 Activity Number/ Linear feet Frequency Number/ Linear feet Frequency Number/ Linear feet Frequency Maintenance Current Funding Level Rehabilitation None N/A 80% 100 yrs 80% 75 yrs Replacement None N/A 20% 100 yrs 20% 75 yrs PAGE 5 OF 14
244 Exhibit 1d GI Infrastructure (O&M) Level of Service 1 Level of Service 2 Level of Service 3 Activity Number/ Linear feet Frequency Number/ Linear feet Frequency Number/ Linear feet Frequency Vegetated Roof Inspection Maintenance 30,300 sf Per year 30,300 sf Per year Infiltration Trenches w/ Pretreatment Inlets Inspection Maintenance 115 ea Per year 115 ea Per year Porous Pavement Systems Inspection Maintenance 142,900 sf Per year 142,900 sf Per year Bioretention/Rain Gardens Inspection Maintenance 66,000 sf Per year 66,000 sf Per year Tree Plantings/Trenches Inspection Maintenance 1,250 ea Per year 1,250 ea Per year Cisterns Inspection Maintenance 5 ea Per year 5 ea Per year PAGE 6 OF 14
245 Exhibit 1e MS4 Implementation (6 minimum controls) Level of Service 1 Level of Service 2 Level of Service 3 Activity Number/ Linear feet Frequency Number/ Linear feet Frequency Number/ Linear feet Frequency Public Education Public Participation / Involvement Illicit Discharge Detection / Elimination Construction Site Runoff Control Post Construction Stormwater Management Pollution Prevention PAGE 7 OF 14
246 Exhibit 2 Estimated Annual Inspection/ Maintenance Costs Maintenance Low Medium* High* Green Infrastructure Green Streets $29,000 $36,250 Park Improvements / Greening $24,000 $30,000 Disconnection, Porous Pavement $16,000 $20,000 Porous Pavement, Bioretention $3,000 $3,750 Vegetated Roofs / Disconnection $10,000 $12,500 Disconnection/Rain Gardens Enhanced Tree Planting $50,000 $62,500 Green Schools $30,000 $37,500 Sub total Green Infrastructure $162,000 $202,500 Dry and Wet Ponds (inspection only) TBD TBD TBD Street Sweeping $168,800 $168,800 $234,100 Catch Basin TBD $112,000 $155,000 Storm Drainage TDB TBD TBD MS4 Implementation Public Education $9,100 $9,100 Public Participation / Involvement $11,250 $11,250 Illicit Discharge Detection / Elimination $53,800 $53,800 Construction Site Runoff Control $52,600 $52,600 Post Construction Stormwater Management $17,800 $17,800 Pollution Prevention $305,212 $305,212 Program Administration Billing and Collection TBD TBD TBD Incentive/Credit Program TBD TBD TBD NPDES permit $36,000 $36,000 $36,000 Plan Review $23,000 $23,000 $23,000 *GI Plan Annual Maintenance Costs are for the 5 th Year of GI Implementation PAGE 8 OF 14
247 Exhibit 3a Capital Costs (Low LOS) Year 1 Year 2 Year 3 Year 4 Year 5 Green Infrastructure Green Streets $132,600 $132,600 $132,600 $132,600 $132,600 Park Improvements / Greening $50,000 $50,000 $50,000 $50,000 $50,000 Disconnection, Porous Pavement $58,200 $58,200 $58,200 $58,200 $58,200 Porous Pavement, Bioretention $70,200 $70,200 $70,200 $70,200 $70,200 Vegetated Roofs / Disconnection $93,600 $93,600 $93,600 $93,600 $93,600 Disconnection/Rain Gardens $131,000 $131,000 $131,000 $131,000 $131,000 Enhanced Tree Planting $143,800 $143,800 $143,800 $143,800 $143,800 Green Schools $51,200 $51,200 $51,200 $51,200 $51,200 Storm Drainage MS4 Rehabilitation Replacement Information Management CSS Rehabilitation Replacement Information Management Catch Basin Rehabilitation $82,000 $82,000 $82,000 $82,000 $82,000 Replacement $82,000 $82,000 $82,000 $82,000 $82,000 Total $894,600 $894,600 $894,600 $894,600 $894,600 PAGE 9 OF 14
248 Exhibit 3b Capital Costs (Medium LOS) Year 1 Year 2 Year 3 Year 4 Year 5 Green Infrastructure Green Streets $530,000 $530,000 $530,000 $530,000 $530,000 Park Improvements / Greening $199,800 $199,800 $199,800 $199,800 $199,800 Disconnection, Porous Pavement $232,400 $232,400 $232,400 $232,400 $232,400 Porous Pavement, Bioretention $28,100 $28,100 $28,100 $28,100 $28,100 Vegetated Roofs / Disconnection $138,800 $138,800 $138,800 $138,800 $138,800 Disconnection/Rain Gardens $0 $0 $0 $0 $0 Enhanced Tree Planting $575,000 $575,000 $575,000 $575,000 $575,000 Green Schools $205,000 $205,000 $205,000 $205,000 $205,000 Storm Drainage MS4 Rehabilitation $667,000 $667,000 $667,000 $667,000 $667,000 Replacement $417,000 $417,000 $417,000 $417,000 $417,000 Information Management $2,000 $2,000 $2,000 $2,000 $2,000 CSS Rehabilitation $220,000 $220,000 $220,000 $220,000 $220,000 Replacement $137,000 $137,000 $137,000 $137,000 $137,000 Information Management $1,000 $1,000 $1,000 $1,000 $1,000 Catch Basin Rehabilitation $82,000 $82,000 $82,000 $82,000 $82,000 Replacement $82,000 $82,000 $82,000 $82,000 $82,000 Total $3,517,100 $3,517,100 $3,517,100 $3,517,100 $3,517,100 Exhibit 3c Estimated Capital Costs for Medium LOS $4,000,000 $3,500,000 $3,000,000 $2,500,000 $2,000,000 $1,500,000 Catch Basin Storm Drainage Green Infrastructure $1,000,000 $500,000 $ Year PAGE 10 OF 14
249 PAGE 11 OF 14
250 Exhibit 4a Capital Costs (High LOS) Year 1 Year 2 Year 3 Year 4 Year 5 Green Infrastructure Green Streets $662,600 $662,600 $662,600 $662,600 $662,600 Park Improvements / Greening $249,800 $249,800 $249,800 $249,800 $249,800 Disconnection, Porous Pavement $290,600 $290,600 $290,600 $290,600 $290,600 Porous Pavement, Bioretention $351,200 $351,200 $351,200 $351,200 $351,200 Vegetated Roofs / Disconnection $468,000 $468,000 $468,000 $468,000 $468,000 Disconnection/Rain Gardens $655,200 $655,200 $655,200 $655,200 $655,200 Enhanced Tree Planting $718,800 $718,800 $718,800 $718,800 $718,800 Green Schools $256,200 $256,200 $256,200 $256,200 $256,200 Storm Drainage MS4 Rehabilitation $890,000 $890,000 $890,000 $890,000 $890,000 Replacement $556,000 $556,000 $556,000 $556,000 $556,000 Information Management $3,000 $3,000 $3,000 $3,000 $3,000 CSS Rehabilitation $293,000 $293,000 $293,000 $293,000 $293,000 Replacement $183,000 $183,000 $183,000 $183,000 $183,000 Information Management $1,000 $1,000 $1,000 $1,000 $1,000 Catch Basin Rehabilitation $82,000 $82,000 $82,000 $82,000 $82,000 Replacement $82,000 $82,000 $82,000 $82,000 $82,000 Total $5,637,400 $5,637,400 $5,637,400 $5,637,400 $5,637,400 PAGE 12 OF 14
251 Exhibit 4b Estimated Capital Costs for High LOS $7,000,000 $6,000,000 $5,000,000 $4,000,000 $3,000,000 Catch Basin Storm Drainage Green Infrastructure $2,000,000 $1,000,000 $ Year PAGE 13 OF 14
252 Exhibit 5a Estimated Annual Costs Low Medium High Operating and Maintenance Green Infrastructure* TBD $162,000 $202,500 Dry and Wet Ponds (inspection TBD TBD TBD Street Sweeping $168,800 $168,800 $234,100 Catch Basin TBD $201,000 $402,000 Storm Drainage TBD TBD TBD MS4 Implementation $449,762 $449,762 $449,762 Program Administration $149,000 $226,000 $303,000 Capital Costs Green Infrastructure $730,600 $1,909,100 $3,652,400 Storm Drainage $1,444,000 $1,926,000 Catch Basin $164,000 $164,000 $164,000 Total $1,662,162 $4,724,662 $7,333,762 *GI Plan Annual Maintenance Costs are for the 5 th Year of GI Implementation Exhibit 5b Total Estimate Annual Costs $8,000,000 $7,000,000 $6,000,000 $5,000,000 $4,000,000 High Medium Low $3,000,000 $2,000,000 $1,000,000 $ PAGE 14 OF 14
253 Attachment B Stormwater Utility Rate Structure and Rates Policy Paper
254
255 Stormwater Utility Rate Structure and Rates Policy Development Summary Lancaster, PA Policy Paper No. 2 Date Prepared: May 10, 2012 Date Revised: May 24, 2012 Date Final: Policy Issue: What type of rate structure should be used for the Stormwater Utility? What is the likely range for the initial rate for the stormwater utility fee? The rate structure for most stormwater utilities is setup so that single-family residential properties pay 1 ERU (Equivalent Residential Unit) and multi-family or non-residential properties pay based on actual impervious area. The ERU is determined through statistical analysis of the imperviousness of single-family residential parcels. The number of ERUs (billing units) for multi-family or non-residential properties is based on total impervious area divided by the ERU or base unit. In order to help with equity and fairness of the stormwater charge, municipalities are now starting to develop and implement tiered rate structures that break properties into tiers based on amount of impervious area. This could be applied for single-family properties or all properties. For example, there may be a statistical justification to break single-family residential properties into several categories (i.e., small, medium, large). Or, a tiered rate structure could be applied to all properties. The total number of billing units, based on the rate structure, is then used to determine the rate. That is, the rate is set to recover total program costs, debt service, equity funded CIP, reserves (revenue requirements). The rate could be expressed as $/ERU or $/1,000 sf. Policy Options Categories Based on Property Class for this option, there would be multiple categories based on property class. For this option single-family residential (SFR) properties would be charged 1 ERU. All other property classed would be charged based on total impervious area. This method is perhaps the simplest and requires minimal analysis of the residential land use category. This method also has the lowest cost for billing system database implementation and maintenance. However, using 1 ERU for SFR properties is less equitable than ERU categories based size, or tiers. Categories Based on Size for this option, there would be multiple categories, such as small-, medium-, and large sized properties. These categories could also be applied to all properties (commercial, institutional, industrial, faith and non-profit properties) if they fall within the impervious area tier ranges. Properties with impervious area greater than the largest tier would pay based on actual impervious area. Issues, Concerns, Benefits A primary issue or concern involves equity issues. Does a smaller single family property (which contributes less stormwater) pay the same as a larger single family property (which contributes more stormwater), while each receive the same benefit(s) from the city-wide program. The benefits of breaking single family residential properties into several categories or tiers (i.e., more precision) needs to be weighed against the implementation costs of developing and maintaining a tiered rate structure. This method involves additional analysis for billing system implementation and maintenance of impervious area data. However, it more equitably links fees to impervious area size. The more tiers, the higher administrative cost and the greater likelihood of categorizing properties into the wrong tier, and therefore a possibly higher number of appeals of bills. Another related consideration is whether gathering and maintaining data for more detailed classification (more tiers) will result in noticeable differences in charges to customers. Based on existing GIS data and the property tax database, Figure 1 shows the distribution of impervious area for single-family residential properties, based on available impervious area data 1. The median value is 1,165 sf and the average 1,368 sf with a 95 percent confidence of 16 sf. For purpose of this analysis, the rate is expressed as $/1,000 sf. 1 Impervious area were adjusted based on review of 199 properties from 2008 aerials and 2011 parcel boundaries to estimate missing or incorrectly digitized impervious area mapping, and median deviation was applied to adjust the impervious of each property, by class: residential, multi-family, commercial, industrial, institutional, government, parking lot. Adjustment factors ranged from 9 percent for commercial, up to 45 percent for residential. PAGE 1 OF 7
256 Stormwater Utility Rate Structure and Rates Policy Development Summary Lancaster, PA Policy Paper No. 2 Date Prepared: May 10, 2012 Date Revised: May 24, 2012 Date Final: Policy Issue: What type of rate structure should be used for the Stormwater Utility? What is the likely range for the initial rate for the stormwater utility fee? Table 1 provides a tabular summary of number properties, impervious area, and ERUs for three rate structures. Figure 1 shows the frequency distribution of impervious area for single-family residential properties. Figure 2 shows the frequency distribution of impervious for all properties based on a rate structure with 4 tiers. Figure 3 shows the distribution for all properties based on a rate structure with 7 tiers. Figure 4 compares number of properties and ERUs by property class. This helps illustrate the equity and fairness of basing the stormwater charge on a measure of imperviousness. A tiered rate structure can help maintain equity for properties with impervious area less than 3,000 sf. Properties with impervious area greater than 3,000 sf pay based on total impervious area. For illustrative purposes, Tables 2 to 4 show the estimated stormwater charges for three rate structures, on both an annual or a quarterly basis. The rates assume a medium level of service program of $4,800,000. Rates can increase overtime depending on the O&M programs, CIP, availability of grants/loans, debt service, credits/incentives, and collection rate. Figure 5 illustrates how rates could increase over time assuming the use of grants/loans, pay-go CIP, and repayment of Penn Vest debt service (loan to fund CIP). The low LOS does not assume grants/loans or debt service because the CIP is minimal compared to the medium and high LOS. Consultant Recommendation Based on the analyses presented, it is evident that justification for multiple tiers exists. However, while the equity issue could be used to justify a tiered rate structure, these considerations need to be balanced against considerations of simplicity and implementation/ database maintenance costs. More tiers are recommended for equity reasons, but only if the quality of the impervious area data is high enough to have confidence in categorizing properties into more bins, i.e. smaller impervious area ranges. Current data probably not justify that, but the City expects to get new impervious area data based on a 2012 aerial flyover. Assuming these data are captured at a high resolution, the 7 tier option is recommended, applied to all property types. PAGE 2 OF 7
257 Stormwater Utility Rate Structure and Rates Policy Development Summary Lancaster, PA Policy Paper No. 2 Date Prepared: May 10, 2012 Date Revised: May 24, 2012 Date Final: Policy Issue: What type of rate structure should be used for the Stormwater Utility? What is the likely range for the initial rate for the stormwater utility fee? Decision/Action Reviewed Rate Structure Options and Preliminary Rates Properties pay based contribution to stormwater runoff as determined by a measure of impervious area. There is agreement that Assessed Value of a property does not provide equity in determining the stormwater charge. To evaluate rate structure options, a statistical analysis of impervious area was conducted to determine the median and average impervious area for single-family residential properties. The typical measure of impervious area is the equivalent residential unit and is based on the median or average impervious area of single-family residential properties. A recent trend among stormwater utilities is to implement a tier rate structure based on impervious area. The tiers can be applied to single-family residential properties only or they can be applied to all properties. A proposed rate structure with four tiers was presented. The number of tiers included depends on characteristics of the municipality. For the City of Lancaster, development can be characterized as urban, many mixed use buildings and attached row houses, and public/private alleys. Can a property owner have a stormwater charge of $0? Some municipalities offer 100% credit for on-site stormwater facilities that a property owns and maintains. Majority of municipalities offer partial credit because of off-site benefits received by property owners that the SWU funds. The City is considering a system of credits that will provide property owners the ability to reduce their stormwater charge based on the amount of impervious area treated by eligible stormwater facilities. This is the subject of a separate Policy Paper. Based on feedback from the GIAC committee during the May 10, 2012 meeting: There is agreement that a tiered rate structure will help achieve equity and fairness among all properties. This is true because of small non-residential / mixed-use buildings that would fall within the lower tiers. There is an agreement that a tiered rate structure that is applied to all properties makes the most sense. Evaluating a tiered rate structure with more than four tiers is recommended. Should Quality of Runoff be Reflected in Rates? Properties pay based on contribution to stormwater runoff as determined by a measure of impervious area. Some properties are likely to be sources of pollutants that are picked up and washed away by stormwater runoff. The difficulty is making categorical limits based on property type because not all owners within a property type will be the source of pollutants. Some properties are required to have stormwater permits that identify stormwater facilities that treat stormwater runoff before being discharged into the system or waterway. As part of the City s MS4 permit there are requirements to help control pollutants Need Public Outreach Plan to Prevent Politicizing New Fees There is concern about the proposed Stormwater Fee becoming politicized because it may be viewed as something the sewer charge already pays for or that this is just another tax. The Public Education Plan can help identify ways to gain support the stormwater charge. PAGE 3 OF 7
258 TABLE 1 Number of properties and ERUs by stormwater class ERUs Stormwater Class Estimated Impervious Area (sf) Number of Properties No Tiers* 4 Tiers 7 Tiers Single Family 18,337,179 13,407 13,407 20,491 21,532 Multi-Family 9,909,174 1,976 9,909 9,942 10,299 Commercial 29,093,647 1,626 29,094 29,176 29,270 Industrial 15,205, ,205 15,206 15,207 Non-Profit 2,643, ,644 2,644 2,649 Institutional 4,824, ,824 4,826 4,826 Government 3,707, ,707 3,710 3,710 Total 83,720,461 17,353 78,790 85,993 87,491 *Assumes 1 ERU = 1,000 sf and single-family residential properties charge 1 ERU. FIGURE 1 Impervious Area Distribution of Residential Properties 6,000 5,624 Number of Parcels 5,000 4,000 3,000 2,000 1, ,068 1, Impervious Area (square feet) PAGE 4 OF 7
259 FIGURE 2 Impervious Area Distribution of All Properties and 4 Tier Rate Structure 10,000 Tier 1 Tier 2 Tier 3 Tier 4 100% 9,000 90% 8,000 80% Number of Parcels 7,000 6,000 5,000 4,000 3,000 2,000 1, ,358 4,259 2,591 1, % 60% 50% 40% 30% 20% 10% 0% Cumulative Percent Impervious Area (square feet) Number Parcels Cumulative Percent FIGURE 3 Impervious Area Distribution of All Properties and 4 Tier Rate Structure 10,000 Tier 1 Tier 2 Tier 3 Tier 4 Tier 5 Tier 6 Tier 7 100% 9,000 90% 8,000 80% Number of Parcels 7,000 6,000 5,000 4,000 3,000 2,000 1, ,358 4,259 2,591 1, % 60% 50% 40% 30% 20% 10% 0% Cumulative Percent Impervious Area (square feet) Number Parcels Cumulative Percent PAGE 5 OF 7
260 FIGURE 4 Number of properties and ERUs (no tier option) by stormwater class Number of Properties Number of ERUs Institutional, 0.25% Industrial, 1% Non- Profit, 1% Commercial 9% Government, 0.32% Government Institutional 5% 6% Non-Profit 3% Single Family 17% Multi-Family 12% Industrial 19% Multi-Family 13% Single Family 77% Commercial 37% Single Family Multi-Family Commercial Industrial Non-Profit Institutional Government TABLE 2 Proposed No Tier Rate Structure Preliminary Stormwater Charge^ Annual Quarterly Single Family Residential $61 $15.25 Non-Residential Charge based on total impervious area $61/1,000 sf $15.25/1,000 sf Multi-Family Charge based on total impervious area $61/1,000 sf $15.25/1,000 sf ^Assumes medium level of service, a $4,800,000 stormwater program. TABLE 3 Proposed 4 Tier Rate Structure* Tier Impervious Area Range Preliminary Stormwater Charge^ Annual Quarterly 1 <=1,000 sf $56 $14 2 >1,000 sf and <=2,000 sf $84 $21 3 >2,000 sf and <=3,000 sf $140 $35 4 >3,000 Charge based on total impervious area $56/1,000 sf $14/1,000 sf *Applies to all properties ^Assumes medium level of service, a $4,800,000 stormwater program. PAGE 6 OF 7
261 TABLE 4 Proposed 7 Tier Rate Structure* Tier Impervious Area Range Preliminary Stormwater Charge^ Annual Quarterly 1 <=500 sf $24 $ >500 sf and <=1,000 sf $55 $ >1,000 sf and <=1,500 sf $82 $ >1,500 sf and <=2,000 sf $110 $ >2,000 sf and <=2,500 sf $137 $ >2,500 sf and <=3,000 sf $165 $ >3,000 Charge based on total impervious area $55/1,000 sf $13.75/1,000 sf *Applies to all properties ^Assumes medium level of service, a $4,800,000 stormwater program. FIGURE 5 Revenue requirements by level of service Revenue Requirements $12,000,000 $10,000,000 $8,000,000 Low $6,000,000 Medium High $4,000,000 $2,000,000 $ Year Assumes: Penn Vest debt service, but no new debt service, Use grants and Penn Vest loan to fund CIP PAGE 7 OF 7
262
263 Attachment C Stormwater Utility CIP Policy Paper
264
265 Stormwater User Charge Rate Structure Policy Development Summary City of Lancaster, PA Policy Paper No. 3 Date Prepared: May 31, 2012 Date Revised: Date Final: Policy Issue: For CIP projects with a useful life greater than years, should the stormwater utility fund the CIP through rates (i.e. pay-as-you-go), or should long-term financing be used? Overview Capital Improvement Program (CIP) projects are relatively major improvements that the City needs to maintain adequate stormwater management services. In addition, the CIP identifies projects related to the Green Infrastructure Plan. The activities involve development, design, scheduling, funding, permitting, and construction of the projects. These projects may include drainage improvements, storm sewer rehabilitation or replacement, catch basin rehabilitation and replacement, and/or drainage master planning studies. Figure 1 shows the total CIP for the each level of service alternative considered. Figure 2 shows the net effect of using grants / loans to help reduce the capital costs funded by the stormwater utility. For the low level of service, the CIP is entirely funded by grants/loans. For the high level of service, only a portion of the CIP is funded by grants/loans. The difference would need to be fund by the stormwater utility (i.e., pay-go or long-term financing). Assuming grants/loans are used to fund the CIP and the difference is bond funded starting in Year 4, Figure 3 shows the rate impacts. Figure 4 shows the rate impacts if bond financing is not used (i.e., pay go). Based on feedback from City, the debt financing assumptions include: GO Bonds (using full faith and credit of the City and pledge of stormwater utility revenues) Next likely bond issue would be % interest rate (subject to change based on market conditions) 20 year term (subject to change based on average useful live of projects being financed) As a starting point, assume a target debt service coverage ratio of 1.5. Policy Options Option 1 Do not fund CIP with Stormwater Utility Option 2 Pay As You Go through rates Option 3 Long Term Financing and/or Pay As You Go Issues, Concerns, Benefits Issues may include overseeing the administration of the debt service payments. As a stormwater utility startup, revenue bonds would not likely be an option since under-writing agencies would require an established track record of stormwater utility fee revenues. Nonetheless, General Obligation bonds could be used, while using the full faith and credit of the City and/or the revenue from the utility fee. Concerns may include the City s Fiscal Policy regarding debt financing and any established caps on debt financing. Debt financing significant CIP projects could be a benefit because the capital costs are spread out over time. In addition, long-term financing provides a form of fairness in the sense that exiting residents do not pay for all of the costs up-front and new resident will share some of the costs. Consultant Recommendation Decision/Action PAGE 1 OF 5
266 FIGURE 1 Summary of Stormwater CIP by Levels of Service Stormwater CIP $7,000,000 $6,000,000 $5,000,000 $4,000,000 Low $3,000,000 Medium High $2,000,000 $1,000,000 $ Year PAGE 2 OF 5
267 FIGURE 2 Summary of Stormwater CIP by Levels of Service Net of Grants and Loans $7,000,000 Stormwater CIP $6,000,000 $5,000,000 $4,000,000 Low $3,000,000 Medium High $2,000,000 $1,000,000 $ Year PAGE 3 OF 5
268 FIGURE 3 Rate impact of using bond financing (Net of Grants and Loans) $80.00 $70.00 $69.00 $69.00 $70.00 $72.00 $73.00 $74.00 $60.00 $60.00 $60.00 $60.00 $60.00 $53.00 $53.00 $54.00 $55.00 $57.00 $58.00 SWU Fee ($/1,000 sf) $50.00 $40.00 $30.00 $33.00 $33.00 $33.00 $44.00 High Medium Low $20.00 $21.00 $21.00 $21.00 $21.00 $21.00 $21.00 $21.00 $21.00 $21.00 $21.00 $10.00 $ Year PAGE 4 OF 5
269 FIGURE 4 Rate impact of not using bond financing (Pay Go) (Net of Grants and Loans) $ SWU Fee ($/1,000 sf) $123 $123 $123 $123 $123 $123 $ $115 $ $80.00 $82 $82 $82 $82 $82 $82 $60.00 $60 $60 $60 $62 Low Medium High $40.00 $33 $33 $33 $20.00 $21 $21 $21 $21 $21 $21 $21 $21 $21 $21 $ Year PAGE 5 OF 5
270
271 Attachment D Stormwater Utility SWU Fee Credits / Incentives Policy Paper
272
273 Stormwater Utility SWU Fee Credits / Incentives Policy Development Summary Lancaster, PA Policy Paper No. 5 Date Prepared: May 24, 2012 Date Revised: Date Final: Policy Issue: What type of type of credits or incentives should be provided to property owners for on-site facilities or green infrastructure? What is the likely impact on the range for the initial rate for the stormwater utility fee? Many stormwater utilities provide incentives to properties that have on-site stormwater facilities that treat stormwater runoff. There are two types of incentive programs typically considered: Rebates or grants Credits The purpose of grants or rebates is to provide one-time subsidy to reduce construction costs associated with installation of stormwater facilities on private property. This sort of program is fairly uncommon, but is growing in popularity among jurisdictions with CSO and MS4 permit mandates. Examples include Montgomery County, Maryland s RainScapes program, DC s RiverSmart Homes, and Portland, Oregon s (links are provided at end of this section, below). For example, RainScapes provides grants up to $1,200 for residential property and up to $5000 for Commercial, multi-family, or institutional property, depending on project type. Eligible practices include but are not limited to rain gardens, tree canopy, permeable pavers, green roofs and rain barrels. RainScapes is funded by the County s stormwater utility. Similarly, DC s RiverSmart Homes program funds up to $1,200 for similar project types, but is restricted to private residences. The purpose of credits is to help properties reduce their stormwater charge, thus providing an incentive for implementation of stormwater facilities. Historically, credits have been offered to commercial properties but recent trends show that single-family properties are now eligible for certain types of credits. The credit amount that a property can receive varies among stormwater utilities. Most utilities provide only a partial credit while others provide a full credit. The criteria for determining the credit amount typically are based on type of facility, and percent of impervious area treated (usually just the onsite impervious area). Some utilities provide credits to properties that do not have qualifying facilities but agree to participate in public education or outreach programs. Exhibit 1 provides a summary of credit programs around the US. Exhibit 2 provides a list of potential credit amounts by stormwater project type being considered by Montgomery County, Maryland. As part of a grant to evaluate green infrastructure, the City has identified possible credit scenario case studies based on implementation of green infrastructure. These case studies consider residential and commercial facilities and are summarized in Exhibit 3. Links to Sample Rebate/Grant Programs: Links to Sample Credit Programs: PAGE 1 OF 5
274 Stormwater Utility SWU Fee Credits / Incentives Policy Development Summary Lancaster, PA Policy Paper No. 5 Date Prepared: May 24, 2012 Date Revised: Date Final: Policy Issue: What type of type of credits or incentives should be provided to property owners for on-site facilities or green infrastructure? What is the likely impact on the range for the initial rate for the stormwater utility fee? Policy Options 1) Rebates or grants: a) Property Eligibility for Credits i) Provide credits to only commercial properties ii) Provide credits to all properties b) Amount of Credit i) $ limits by project type ii) $ limits by property type c) Qualifying Facilities / Activities 2) Credits: i) Approved BMPs, green infrastructure a) Property Eligibility for Credits i) Provide credits to only commercial properties ii) Provide credits to all properties b) Amount of Credit i) Partial (less than 100% reduction in charge) ii) Full (complete waiver of charge) c) Qualifying Facilities / Activities i) Approved BMPs, green infrastructure ii) Issues, Concerns, Benefits Participation in activities (i.e., public education, adopt-a-highway) Both rebates and credit programs represent a policy option to increase stormwater treatment and improve compliance with permit requirements by incentivizing property owners to build stormwater facilities on private property. But these programs represent a cost (in the case of rebates) or a reduction in revenue, in the case of credits. Both types of programs have administrative costs that should be considered. All credit programs typically require some sort of maintenance agreement between the property owner and the utility to insure that the facility is built appropriately and maintained in proper working order according to established design standards. The City of Portland s Clean River Rewards, stormwater credit program required 2 full time staff, one to administer and promote the program, the other to conduct inspections to be sure facilities are being maintained. Credits typically require an application be submitted to be eligible for the credit, with residential programs typically being granted without inspection of more than a small sample of properties, and nonresidential facility credits requiring a site inspection. The period for which credits are kept in place varies, with some utilities requiring annual re-application, and some granting credits for longer periods (3-5 years), and some granting credits indefinitely without reapplying. The question of what is the maximum level of credit is a policy question. Few jurisdictions grant 100% credit (essentially a waiver). Often these are situations where the facility is an industial facility with its own stormwater permit, or they discharge entirely directly to waters of the US without passing through the MS4 system. More often only partial credits are allowed (25%, 35% or 50% reduction, for example), with the rationale being that even if the property controls 100% of stormwater on-site, the municipality still has costs to manage stormwater offsite that everyone benefits from (for example, program administration for the permit, drainage from public roads). Consultant Recommendation The consultant recommends developing both a credit and a rebate program to support MS4 and CSO LTCP compliance, with credits of not more than 50%. These programs could be phased in after initial implementation of a stormwater fee, largely to allow time to set up administrative systems and outreach programs to support them. Decision/Action PAGE 2 OF 5
275 EXHIBIT 1 Example Credit Programs Municipality Single Family Residential? Non-residential and Multi- Family residential? Types of Credits Maximum Credit Allowed Chesapeake, VA No Yes Prince William County, VA No Yes Application of onsite BMPs that provide water quality or water quantity benefits.. Control stormwater on-site; non-structural program participation Water quality (20%) Water quantity (20%) Maximum of 40% 50% for structural control; 30% for non-structural controls compiled as follows: 30% for nutrient mgmt. plan 30% for public education program 10% for attending workshop 10% site cleanup Virginia Beach, VA No Yes Manage stormwater quality on-site 30% for management to pre-developed condition 20% for management to Chesapeake Bay standards Portland, OR Yes Yes LID (ecoroof, rainbarrel, rain garden) Tree Canopy Downspout disconnect Stormwater Quality Stormwater Quantity Stormwater Planters 35% of total stormwater charges Credit for tree canopy based on number of trees greater than 15 feet. Philadelphia, PA No Yes, must have >500 sf impervious area Impervious Area (IA) Gross Area (GA) NPDES Credit Application and renewal fee apply Except monthly minimum charge. Up to 100% of stormwater charge for IA and GA credit 7% for NPDES Credit NEORSD, Cleveland, OH Yes Yes Stormwater Quality Credit (25%) Stormwater Quantity Credit (50%) Education Credit (25%) Up to 75% Up to 100% for public/private schools PAGE 3 OF 5
276 EXHIBIT 2 Example of Stormwater Facility Classifications for Credits (Montgomery County MD) Pretreatment 10% credit Water Quality (WQ) 25% credit Water Quantity (QN) 25% credit Both (B) 50% credit Green Infrastructure (LID, ESD, etc) 25% credit AQSW aquaswirl AQFIL aquafilter PDQN Dry Pond DS dry swale RG rain garden Adopt-a-Stream BAYSAV baysaver BSFS baysaver flow splitter BF Bayfilter INF Infiltration Trench PDQNED Dry Pond with extended detention UG underground storage facility BR bioretention PP permeable pavement Adopt-a-Road Programmatic 15% credit (regardless of impervious area treated) BRQN bioretention Rainbarrel Integrated Pest Management SEP oil/grit separator INFIL Infiltrator UGINF underground storage facility with infiltration BS bioswale Cistern *Other DEP-approved program participation SNOUT INFU Infiltration Trench, buried by design INFQN infiltration with quality and quantity control Micro bioretention Industrial Permit STC stormceptor PDIB Infiltration basin INFUQN underground infiltration with quality and quantity control Submerged gravel wetlands V2B1 PSF Peat sand filter PDQNSF dry pond with sand filter base Landscape Infiltration VORTEC - vortechnics SC stormchamber PDIBQN infiltration basin with quantity control Infiltration Berm SEPSF separator sand filter PDWD constructed wetland Swales SF surface sand filter PDWDED constructed wetland with extended detention Green Roofs SFU underground sand filter PDWT Wet pond Reinforced Turf STFIL stormfilter PDWTED wet pond with extended detention Disconnection SFQN surface sand filter with quantity control Sheet Flow TB tree box Dry well PAGE 4 OF 5
277 EXHIBIT 3 Summary of Case Studies from Keith Campbell Grant Study Report (CH2M HILL, 2011) Property ID Property Name Land Use Category Annual Stormwater Charge Charge after Credits Payback (Years) Median Impervious Area (sf) for Group Impervious Area (sf) for Property P-21 Two Dudes Painting Commercial $1,600 $ ,800 19,900 P-82 Sundown Lounge Commercial $200 $ ,800 2,600 P-111 Ace Rents Industrial $21,300 $10, , ,800 P-25 Novelty Brush Industrial $2,600 $1, ,200 32,600 P-47 Lancaster County Library Institutional $2,300 $1, ,400 29,000 P-100 Water Street Mission Institutional $9,400 $8, , ,100 P-34 Public Parking: Dauphin St Local Govt. $1,700 $ ,300 21,750 P-84 Apts at Mulberry Ct Multi-Family $1,000 $ ,200 12,900 P-51 P-85 Private Parking Water St Parking $5,100 $2, ,800 63,200 James St Mennonite Church Religious $2,300 $1, ,600 28,800 P-99 Trinity Lutheran Church Religious $3,500 $2, ,600 43,500 SFR block Ocean Ave Single Family $40 $ SFR Poplar St Single Family $80 $ SFR Block Lehigh Ave Single Family $120 $ ,800 P-106 P-106 Green Alley at Alley 7 (Option #1) Single Family $80 $ ,300 Green Alley at Alley 7 (Option #2) Single Family $80 $ ,340 Note: Charges assume $5/month/1000 sf of impervious area. PAGE 5 OF 5
278
279 Attachment E PennVest Loan Repayment Schedule
280
281 City of Lancaster Loan is a Drawdown Note with Interest Only Highlighted section includes Guaranteed Sewer Revenue Bond Period for up to 36 Months 36 month "not to exceed" Series of 2012 Interest shown is presented as "Not to Exceed" interest period. PennVest Loan ME Payment P&I Balance Principal Debt Annual Annual Summary Number # After Payment Date Installment Rate Interest Service Debt Service Years Interest Only and 5 Years of Repayment Years 6-20 or Principal Repayment , , ,000, /1/ , ,000, /1/ , , Begin Repayment 2 7,000, /1/ , , , ,000, /1/ , , ,000, /1/ , , , ,000, /1/ , , ,000, /1/ , , , , ,000, /1/ , , ,000, /1/ , , , ,000, /1/ , , ,000, /1/ , , , ,000, /1/ , , Rate Change - Year ,000, /1/ , , , ,000, /1/ , , ,000, /1/ , , , ,000, /1/ , , ,000, /1/ , , , ,000, /1/ , , ,000, /1/ , , , , ,000, /1/ , , ,000, /1/ , , , ,000, /1/ , , ,000, /1/ , , , ,000, /1/ , , ,000, /1/ , , , ,000, /1/ , , ,000, /1/ , , , ,000, /1/ , , ,000, /1/ , , , ,000, /1/ , , ,000, /1/ , , , , ,000, /1/ , , ,000, /1/ , , , ,000, /1/ , , ,000, /1/ , , , Est Completion 35 7,000, /1/ , , ,000, /1/ , , , Begin Repayment ,974, /1/ , , , ,949, /1/ , , , , ,924, /1/ , , , ,899, /1/ , , , , ,874, /1/ , , , ,849, /1/ , , , , , ,824, /1/ , , , ,798, /1/ , , , ,773, /1/ , , , ,748, /1/ , , , Total 9,086, ,722, /1/ , , , ,086, ,697, /1/ , , , ,672, /1/ , , , ,646, /1/ , , , ,621, /1/ , , , ,595, /1/ , , , ,570, /1/ , , , ,544, /1/ , , , , ,518, /1/ , , , ,493, /1/ , , , ,467, /1/ , , , ,441, /1/ , , , Concord Public Financial Advisors, Inc. Page 1 3/27/2012
282 ,416, /1/ , , , ,390, /1/ , , , ,364, /1/ , , , ,338, /1/ , , , ,312, /1/ , , , ,286, /1/ , , , ,260, /1/ , , , ,235, /1/ , , , , ,209, /1/ , , , ,183, /1/ , , , ,156, /1/ , , , ,130, /1/ , , , ,104, /1/ , , , ,078, /1/ , , , ,052, /1/ , , , ,026, /1/ , , , ,999, /1/ , , , ,973, /1/ , , , ,947, /1/ , , , ,920, /1/ , , , , ,894, /1/ , , , ,868, /1/ , , , ,841, /1/ , , , ,815, /1/ , , , ,788, /1/ , , , ,762, /1/ , , , ,735, /1/ , , , ,708, /1/ , , , ,682, /1/ , , , ,655, /1/ , , , ,628, /1/ , , , ,602, /1/ , , , , ,575, /1/ , , , ,548, /1/ , , , ,521, /1/ , , , ,494, /1/ , , , ,467, /1/ , , , End of 5 Years ,440, /1/ , , , ,416, /1/ , , , ,392, /1/ , , , ,368, /1/ , , , ,344, /1/ , , , ,320, /1/ , , , ,295, /1/ , , , , ,271, /1/ , , , ,246, /1/ , , , ,222, /1/ , , , ,197, /1/ , , , ,173, /1/ , , , ,148, /1/ , , , ,123, /1/ , , , ,098, /1/ , , , ,074, /1/ , , , ,049, /1/ , , , ,024, /1/ , , , ,999, /1/ , , , , ,973, /1/ , , , ,948, /1/ , , , ,923, /1/ , , , ,898, /1/ , , , ,872, /1/ , , , ,847, /1/ , , , ,821, /1/ , , , ,796, /1/ , , , ,770, /1/ , , , ,744, /1/ , , , ,719, /1/ , , , ,693, /1/ , , , , ,667, /1/ , , , ,641, /1/ , , , ,615, /1/ , , , ,589, /1/ , , , ,563, /1/ , , , ,537, /1/ , , , ,510, /1/ , , , ,484, /1/ , , , Concord Public Financial Advisors, Inc. Page 2 3/27/2012
283 ,458, /1/ , , , ,431, /1/ , , , ,405, /1/ , , , ,378, /1/ , , , , ,351, /1/ , , , ,325, /1/ , , , ,298, /1/ , , , ,271, /1/ , , , ,244, /1/ , , , ,217, /1/ , , , ,190, /1/ , , , ,163, /1/ , , , ,136, /1/ , , , ,108, /1/ , , , ,081, /1/ , , , ,054, /1/ , , , , ,026, /1/ , , , ,999, /1/ , , , ,971, /1/ , , , ,943, /1/ , , , ,916, /1/ , , , ,888, /1/ , , , ,860, /1/ , , , ,832, /1/ , , , ,804, /1/ , , , ,776, /1/ , , , ,748, /1/ , , , ,719, /1/ , , , , ,691, /1/ , , , ,663, /1/ , , , ,634, /1/ , , , ,606, /1/ , , , ,577, /1/ , , , ,549, /1/ , , , ,520, /1/ , , , ,491, /1/ , , , ,462, /1/ , , , ,433, /1/ , , , ,404, /1/ , , , ,375, /1/ , , , , ,346, /1/ , , , ,317, /1/ , , , ,288, /1/ , , , ,258, /1/ , , , ,229, /1/ , , , ,199, /1/ , , , ,170, /1/ , , , ,140, /1/ , , , ,110, /1/ , , , ,081, /1/ , , , ,051, /1/ , , , ,021, /1/ , , , , ,991, /1/ , , , ,961, /1/ , , , ,931, /1/ , , , ,900, /1/ , , , ,870, /1/ , , , ,840, /1/ , , , ,809, /1/ , , , ,779, /1/ , , , ,748, /1/ , , , ,717, /1/ , , , ,687, /1/ , , , ,656, /1/ , , , , ,625, /1/ , , , ,594, /1/ , , , ,563, /1/ , , , ,532, /1/ , , , ,500, /1/ , , , ,469, /1/ , , , ,438, /1/ , , , ,406, /1/ , , , ,375, /1/ , , , ,343, /1/ , , , ,311, /1/ , , , ,280, /1/ , , , , Concord Public Financial Advisors, Inc. Page 3 3/27/2012
284 ,248, /1/ , , , ,216, /1/ , , , ,184, /1/ , , , ,152, /1/ , , , ,120, /1/ , , , ,087, /1/ , , , ,055, /1/ , , , ,023, /1/ , , , ,990, /1/ , , , ,958, /1/ , , , ,925, /1/ , , , ,892, /1/ , , , , ,859, /1/ , , , ,826, /1/ , , , ,793, /1/ , , , ,760, /1/ , , , ,727, /1/ , , , ,694, /1/ , , , ,661, /1/ , , , ,627, /1/ , , , ,594, /1/ , , , ,560, /1/ , , , ,527, /1/ , , , ,493, /1/ , , , , ,459, /1/ , , , ,425, /1/ , , , ,391, /1/ , , , ,357, /1/ , , , ,323, /1/ , , , ,289, /1/ , , , ,255, /1/ , , , ,220, /1/ , , , ,186, /1/ , , , ,151, /1/ , , , ,117, /1/ , , , ,082, /1/ , , , , ,047, /1/ , , , ,012, /1/ , , , , /1/ , , , , /1/ , , , , /1/ , , , , /1/ , , , , /1/ , , , , /1/ , , , , /1/ , , , , /1/ , , , , /1/ , , , , /1/ , , , , , /1/ , , , , /1/ , , , , /1/ , , , , /1/ , , , , /1/ , , , , /1/ , , , , /1/ , , , , /1/ , , , , /1/ , , , /1/ , , , /1/ , , , /1/ , , , , /1/ , , , /1/ , , , /1/ , , , /1/ , , , /1/ , , /1/ , , /1/ /1/ /1/ /1/ /1/ /1/ , Totals 7,000, ,086, ,086, ,086, Concord Public Financial Advisors, Inc. Page 4 3/27/2012
285 Attachment F Impervious Area and Billing Units
286
287 TECHNICAL MEMORANDUM Lancaster Utility GIS IAQC Executive Summary This TM documents a QC assessment of the accuracy of IAs found in the existing Lancaster geographic information system (GIS) dataset prepared by CH2M HILL for the 2011 GI Plan. These data are critical in supporting ratestructure analysis, policy setting and ultimately, the billing master account file. The QC assessment began with review and streamlining of the existing GI file [Section 1]. Exploratory analyses of the resulting file were used to identify a subset of representative parcel accounts to be redigitized [Section 2]. The IA of the sample set was updated using the best available aerial photography [2008 imagery] to supplement original IA estimates in the original GIS [Section 3]. Results [Section 4] indicate that updated total IAs exceed results from the original file in 92 percent of the sampled accounts; the remaining 8 percent of accounts exhibited no difference in IA. Adjustments considered to account for changes in the remaining IAs of accounts from the original file that were not updated by redigitizing included: regression analyses, class-specific factors, and substitution of updated IAs. Although adjustments have been applied to the final database used in the rate-structure evaluation and development of proposed rates per account, the QC indicates that IAs have changed sufficiently to require a system-wide redigitizing process to support developing the billing master account. 1 Data Processing The parcel GIS data and attribute information received from Lancaster County Information Technology/GIS Department was exported to an Excel worksheet consisting of 18,407 account records. Included in the attribute table was a field denoted LANDUSECD, which defined the assessment land use for every parcel. The 119 land use codes were classified into 7 land use classifications to simplify the data. Before the factors potentially affecting selection of a representative file could be evaluated, two major data processing issues record uniqueness and definition of stormwater class based on the land use class required resolution. Resolutions to these two primary data processing issues are summarized as follows: Record Uniqueness In the GIS parcel file received, units within condominium complexes were assigned individual unit account numbers by the County Board of Assessment. Parent and subunit accounts for condominium properties could be distinguished from account number suffixes but aggregation into a single account was required before exploratory analyses and rate development could take place. Resolution of the condominium issue is exhibited in Table 1, in which 619 subunit accounts have been consolidated into 28 condominium parent-specific accounts. Resolution of the condominium multiple records and additional nonunique records resulted in a final GIS database consisting of 17,361 unique accounts. Stormwater Class Land Use Class Stormwater utility rate development is a function of both stormwater and land use classifications [SW LU]. The original file received included three distinct variables containing use classifications with multiple codes, resulting in the 119 different class combinations listed in Table 2. As designated in the table below, the 119 codes have been simplified into the following 7 classes of land use: Class SW LU Combinations Accounts Commercial 60 1,625 Government Industrial Institutional Multi-Family Residential 14 1,976 Not For Profit Residential 5 13, ,361 1
288 LANCASTER UTILITY GIS IAQC 2 Sample Selection The primary objective behind QC of the existing GIS data was to ensure that the IA metric is as accurate and representative of on-ground conditions as possible, without committing to a complete and costly survey of the existing accounts. Selecting a representative subset of accounts to be redigitized requires understanding of the quantitative relationships between factors potentially affecting the value and/or quantitation of IA on individual account parcels. If factors covary with the existing measure of IA, then distributing the samples across the range of values of the factor (for example, parcel size) would ensure representative coverage of the metric without depending upon the metric itself in selecting the subset of accounts to redigitize. Additionally, distributing samples throughout the utility network ensures that any systematic differences within the system are sufficiently covered to develop a reasonable estimate of incremental differences in IA resulting from additional development since the maps used to estimate the original IA were created. Relationships of the main response variable, IA, and numeric and categorical factors with respect to system accounts were examined using the set of 17,361 records where the reported IA exceeds zero (excluding 328 accounts with zero IA). Results from the exploratory evaluations that established the criteria and process for selecting the subset of accounts to be redigitized are summarized as follows: Numeric Variables The Lancaster system includes 17,361 unique accounts with IAs ranging between and 3,900,000 square feet (ft 2 ), averaging 3,989 ft 2. Total records surface area (DEED_ACRES) for the corresponding accounts range between 0.01 to 152 acres, averaging 0.22 acres (or, between 150 and 4,277,327 ft 2, averaging 8,922 ft 2 ). Total acreage from an independent source is the sum of the GIS-digitized shape areas per account, ranging between 150 and 6,614,240 ft 2, averaging 9,570 ft 2. Total account assessment values for the 17,361 accounts based on the 2005 countywide assessment range between zero and $130 million, averaging $139,200. Relationships among all paired measures are all positively correlated, as shown in the graphical display of scatterplot matrix panels in Figure 1. Fuzzier, less-linear angled patterns (such as the assessment and year built plots) suggest more noise in the relationship. Supplementing the graphical display, the explicit Spearman rank correlation coefficients, adjusted for the number of paired comparisons evaluated, indicate that all the measures are significantly, positively correlated. Categorical Factors Categorical levels of the SW LU class and spatial location of accounts within the utility network neighborhoods and/or districts represent factors that could affect the representativeness of accounts in the sample selected for redigitizing. Potential effects have been examined using box plots, graphical displays that compare subset of values (as described in Attachment Figure 1), and analysis of variance, which is an explicit comparison of the same variable within different subsets. Figure 2 exhibits the distributions of IA (ft 2 ) across the SW LU class, 52 neighborhoods and 12 districts within the utility network, and the range of year-built from 1700 through Factor effects on IA are summarized as follows: NEIGHBORHOOD DISTRICT YEAR BUILT: The variability across different spatial and temporal classes is wide, with numerous outliers occurring within levels of each of the three variables. However, levels within each of the variables exhibit broad overlap, indicating no obviously distinguishable subsets requiring particular attention in sample selection. CLASS: In contrast to the spatial and temporal factors above, the distribution of IAs within SW LU classes differ substantively as apparent in both box plots and the probability plot (Figure 2) of IAs across the seven SW LU classes. Although surface areas range broadly within class, residential and multi-family units contain comparatively less IA than the group of non-for-profit, institutional, government, and industrial accounts which are comparable overall. The distribution of commercial IAs lies midway between the residential and remaining non-residential classes. 2
289 LANCASTER UTILITY GIS IAQC The above exploratory results support selecting accounts for redigitizing (1) within SW LU class and (2) systematically across the full range of observed account surface areas. The final consideration in defining the sample requires specification of sample sizes per SW LU class. The proposed sample selection represents a compromise between the two approaches and is summarized in the following steps: Assign 10 percent of the accounts, limiting the sample size to at least 15 but no more than 60 accounts within each of the 6 classes, distributed as follows: Class Accounts Sample Size Commercial Government Industrial Institutional Multi-Family Not For Profit Residential 60 Within class, sort by deed_acre, decreasing. Randomly establish a start point in the ranked accounts, then select every n-th record where n is approximated by the total number of accounts divided by the desired sample size. Application of this process results in the 199 samples, which have been plotted in plan view in Figure 4. Figures display the distribution of IA and deed_acre within SW LU classes, highlighting the accounts assigned to the sample for redigitization as blue X s. The displays indicate that the selection process was effective in selecting over the range of surface areas within classes as well as giving reasonable spatial coverage of the entire Lancaster utility network. 3 IA Update GIS Processing The 199 sample parcels and overlaid onto the IA layer created for the Green Infrastructure Plan and 2008 aerials. The IA update process involved two steps: first, classify the types of mistakes into one of seven categories of errors. Results are shown below. Error Class Number of Parcels Percent of Total Number 1 No Issues Missing impervious classification Impervious shape conflict with imagery Cannot determine from image Building impervious not entirely within parcel 6 Impervious does not exist Multiple issues Total Secondly, for parcels showing any error (classes 2 through 7) the IA linework was adjusted to correct the mistake using the 2008 aerials as the source. A new IA was calculated for the sample set. 3
290 LANCASTER UTILITY GIS IAQC 4 Evaluation of Redigitized Sample Impervious Surface Areas Statistical evaluation of redigitized accounts focused on differences between the original old IA and the new IA resulting from the 199 redigitized parcels. Table 3 lists the results from the 199 redigitized accounts, sorted by SW LU class, then by decreasing percent difference, where percent difference has been calculated as the difference between old and new so that positive differences indicate an increase resulting from the 2008 aerial photographs. Table 4 gives summary statistics for both differences in square footage of IA (new minus old square footaget) and percent difference (difference, divided by original IA), across the seven classes. Figure 6 plots old IA against new IA, color-coding by SW LU class, and Figure 7 presents the box plots of percent difference for the 199 parcels redigitized, by classes. These summaries support the following conclusions with respect to the redigitized IA accounts: With the exception of 17 cases where old and new IA are the same; differences are consistently positive. This is most clearly indicated in Figure 6, where all points lie either on or above the diagonal line of zero difference, regardless of SW LU class. Graphical comparisons (within classes) are corroborated with explicit statistical tests, the paired t-test and the non-parametric analogue, the Wilcoxon signed rank. Both tests indicate statistically significant differences between paired old and new IA within accounts, with the difference clearly positive; indicating increases in IA between the original data and the redigitized sample accounts based on 2008 aerial photography. All classes exhibit an overall increase in IA when comparing redigitized accounts with a median value of ~20 percent. However, median values that are most robust to extremes within the class range from a low of 8.9 percent for commercial accounts to a high of 45 percent for residential accounts. Results from the comparison of 199 accounts support the conclusion that a redigitized file including IA for the network accounts is needed to support a final master billing accounting structure. In the interim, for purposes of rate structure analyses, the issue remains as to how to adjust the IA of existing accounts that were not redigitized. Different options for adjusting IA for accounts were evaluated. The first option was to apply regression analyses per class, based upon a best-fit equation, which predicts updated IA based on the account surface area. The sample data within the seven classes were sufficient to support the regression models and exhibited extremely high adjusted r-square values (measure of model fit) with the exception of the more noisy residential accounts. However, the regression is a linear equation that includes an intercept in all cases which, by definition, establishes a minimum account area for which IA is zero. Consequently, application of the regression models was eliminated as a method to adjust un-redigitized accounts. The alternative approach selected was to apply the median (robust) estimate of percent increment (per Table 4) by class to the accounts not redigitized to conservatively adjust the old IA upward to a reasonable expected value of current IA. The process involved simple multiplication of the original IA by 1 plus the median percent difference; so, for example, a commercial account with original IA of 426 ft 2 would be adjusted upward to an expected IA of 464 ft 2 (8.9 percent increase). This adjustment was applied to all 17,162 accounts that were not redigitized. Accounts randomly selected for redigitizing were adjusted by the actual measured new IA. Table 5 compares actual redigitized IA with projected IA using the percent difference method applied to accounts not redigitized. Discrepancies range broadly, further supporting the conclusion that the optimal approach to a final master billing account requires an updated, redigitized IA for all accounts. 5 Summary and Recommendation IAs have changed sufficiently to require a system-wide redigitizing process to support developing the billing master account. Lancaster County has flown 2012 leaf-off, high-resolution aerials for the entire county and indicated the aerials would be available by the December 2012, barring any schedule issues. The County would ultimately use the aerials to update its GIS dataset (components of the impervious surface layer, such as parking lots, buildings, roadways, etc.). However, the County s schedule for that effort is unknown at this time. 4
291 Tables
292
293 TABLE 1 LANCASTER UTILITY GIS DB: CONDOMINIUM RESOLUTION DB REPLACEMENT VALUES: AGGREGATED DEED_ACRES IMPERVIOUS AREA_SF COUNT SUBUNITS CUMULATIVE IMPERVIOUS AREA SF CUMULATIVE SURFACE AREA sft -> acre CONDO SUMMED CONDO ACRES SHAPE AREAacre CUMULATIVE SHAPE AREA sqft ACCOUNT ACCOUNT SUMMED CONDO DB IMP AREA IMPparent- DB Shape_Area PREFIX SUFFIX IMP AREA _SF 1 _SF 2 IMPcum 3 DEED_ACRES SQFT
294 TABLE 2 LANCASTER UTILITY GIS DB 7 CLASS DEFINITIONS: STORM WATER & LAND USE CLASS DESCRIPTIONS COMMERCIAL CLASS: 60 DESCRIPTIONS [1625 ACCOUNTS] GOVERNMENT CLASS: 20 DESCRIPTIONS [56 ACCOUNTS] STORM WATER LAND USE STORM WATER LAND USE 2 AG - VACANT Non-Residential Vacant 1 BUS TRANSPORTATION Non-Residential Transportation 33 AUTO BODY/TIRE SHOP Non-Residential Commercial 5 COUNTY Non-Residential County Govt. 7 AUTO DEALERSHIP Non-Residential Commercial 5 COUNTY PARK Non-Residential County Govt. 7 AUTO PARKING GARAGE Non-Residential Parking 7 ELECTRIC UTILITY Non-Residential Utility 119 AUTO PARKING LOT Non-Residential Parking 1 FEDERAL/STATE Non-Residential Federal / State Govt. 2 AUTO&SELF CAR WASH Non-Residential Commercial 1 FEDERAL/STATE PARK Non-Residential Government 4 BANK COMPLEX/OFFICE Non-Residential Commercial 1 GAS UTILITY Non-Residential Utility 1 BANKS&OFFICES Non-Residential Commercial 8 LOCAL MUNICIPALITY Non-Residential Local Govt. 17 BARS Non-Residential Commercial 1 TRANSPORTATION Non-Residential Transportation 52 COMMERCIAL VACANT LAND Non-Residential Vacant 10 MUNICIPAL PARK Non-Residential Local Govt. 25 COMMUNITY SERVICE-VACANT Non-Residential Vacant 1 OTHER COMMUNICATIONS Non-Residential Utility 2 CULTURAL - VACANT Non-Residential Vacant 7 SERVICES Non-Residential Other Govt. 15 STORE Non-Residential Commercial 1 OTHER PARKS Non-Residential Other Govt. 6 DINERS/LUNCHEONETTES Non-Residential Commercial 4 TRANSPORTATION Non-Residential Transportation 67 DOWNTOWN DETACHED Non-Residential Commercial 5 POLICE&FIRE PROTECTION Non-Residential Police / Fire 237 DOWNTOWN ROW Non-Residential Commercial 2 RAILROAD RIGHT OF WAY Non-Residential Transportation 2 DRIVE IN BRANCH BANK Non-Residential Commercial 2 RAILROAD TERMINAL Non-Residential Transportation 9 FRATERNAL/CIVIC ORGANIZATIONS Non-Residential Commercial 2 SEWAGE DISPOSAL Non-Residential Utility 1 FUEL STORAGE/DISTRIBUTION Non-Residential Commercial 1 TELEPHONE&TELEGRAPH Non-Residential Utility 4 FUNERAL HOMES Non-Residential Commercial 1 WATER UTILITY Non-Residential Utility 1 GAS FACILITIES Non-Residential Commercial INDUSTRIAL CLASS: 4 DESCRIPTIONS [111 ACCOUNTS] 2 HISTORICAL SITES Non-Residential Commercial 31 HEAVY INDUSTRIAL Non-Residential Industrial 3 HOTEL Non-Residential Commercial 78 LIGHT INDUSTRIAL Non-Residential Industrial 15 INDUSTRIAL -VACANT Non-Residential Vacant 1 OTHER INDUSTRIAL Non-Residential Industrial 1 LUMBER YARD/SAWMILL Non-Residential Commercial 1 QUARRY/LANDFILL Non-Residential Industrial 1 MOTEL, INN, LODGE Non-Residential Commercial INSTITUTIONAL CLASS: 11 DESCRIPTIONS [44 ACCOUNTS] 1 MOTOR VEHICLE SERVICES Non-Residential Commercial 5 COLLEGES&UNIVERSITIES Non-Residential Institutional 1 MOVIE THEATERS Non-Residential Commercial 1 HEALTH SERVICES Non-Residential Institutional 14 MULTI/MIXED USE Non-Residential Commercial 4 HOME FOR THE AGED Non-Residential Institutional 5 MUSEUMS&ART GALLERYS Non-Residential Commercial 2 HOSPITALS Non-Residential Institutional 3 NBHD SHPPING CENTER Non-Residential Commercial 1 LIBRARY Non-Residential Institutional 1 NIGHT CLUBS Non-Residential Commercial OTHER EDUCATION SERVICES Non-Residential Institutional OFFICE/PROFFESSIONAL BUILDING Non-Residential Commercial 2 OTHER HEALTH SERVICES Non-Residential Institutional 59 ONE STORY MIXED Non-Residential Commercial 2 OTHER WELFARE SERVICES Non-Residential Institutional 30 OTHER AUTO PARKING Non-Residential Parking 19 9 OTHER BANK&OFFICE Non-Residential Commercial 3 1 SCHOOL- ELEMENTARY/SECONDARY Non-Residential Institutional VOCATIONAL/TRADE SCHOOLS Non-Residential Institutional OTHER DINING ESTABLISHMENTS Non-Residential Commercial 1 WELFARE SERVICES Non-Residential Institutional 6 OTHER LIVING ACCOMODATION Non-Residential Commercial MULTIFAMILY CLASS: 14 DESCRIPTIONS [1976 ACCOUNTS] 119 OTHER MULTI USE Non-Residential Commercial 8 9 OTHER RECREATION/SPORTS FACILITIES Non-Residential Commercial 265 APARTMENTS Non-Residential Multi-Family 68 OTHER RETAIL SERVICE Non-Residential Commercial 16 COMMERCIAL VACANT LAND Non-Residential Vacant 129 OTHER STORAGE/DISTRIBUTION Non-Residential Commercial 1 CONDO - COMMERCIAL Non-Residential Commercial 6 OTHER TOURIST ACTIVITES Non-Residential Commercial 8 EIGHT FAMILY DWELLING Multi-Family Multi-Family 27 OTHER VEHICLE SERVICES Non-Residential Commercial 50 FIVE FAMILY DWELLING Multi-Family Multi-Family 155 PART COMM/RES Non-Residential Commercial 117 FOUR FAMILY DWELLING Multi-Family Multi-Family 1 PRIVATE FOREST LAND Non-Residential Agricultural 7 MOBILE HOME ON LAND Multi-Family Multi-Family 1 RECREATIONAL AND SPORTS ACTIVITIES Non-Residential Commercial 2 OFFICE/PROFFESSIONAL BUILDING Non-Residential Commercial 3 REGIONAL SHOPPING CENTER Non-Residential Commercial 1 RETAIL SERVICES Non-Residential Commercial 31 RESTAURANTS Non-Residential Commercial 7 SEVEN FAMILY DWELLING Multi-Family Multi-Family 13 RETAIL SERVICES Non-Residential Commercial 26 SIX FAMILY DWELLING Multi-Family Multi-Family 22 SERVICE&GAS STATIONS Non-Residential Commercial 369 THREE FAMILY DWELLING Multi-Family Multi-Family 133 SMALL PARKING GARAGE Non-Residential Parking 1101 TWO FAMILY DWELLING Multi-Family Multi-Family 5 SNACK BARS Non-Residential Commercial NOT FOR PROFIT CLASS: 5 DESCRIPTIONS [133 ACCOUNTS] 2 STADIUM/AUDITIORIUM Non-Residential Commercial 22 BENEVOLENT ASSOCIATION Non-Residential Religious 6 STANDARD BANK Non-Residential Commercial 10 CEMETERIES Non-Residential Religious 2 STORAGE/DISTRIBUTION CENTER Non-Residential Commercial 22 CHURCH - COMPLEX Non-Residential Religious 2 SUPERMARKET Non-Residential Commercial 63 CHURCH - STRUCTURE Non-Residential Religious 2 TOURIST/CULTURAL ACTIVITES Non-Residential Commercial 18 OTHER RELIGIOUS SERVICES Non-Residential Religious 11 TOURIST/ROOMING HOUSES Non-Residential Commercial RESIDENTIAL CLASS: 5 DESCRIPTIONS [13416 ACCOUNTS] 36 TRANS/UTILITY VACANT Non-Residential Vacant 2 ESTATES Residential Single Family 18 IMPROV UNDER CONST Residential Single Family 98 OTHER RESIDENTIAL Residential Single Family SINGLE FAMILY DWELLING Residential Single Family 377 VACANT LAND Residential Vacant
295 TABLE 3 LANCASTER GIS: REDIGITIZED ACCOUNTS [N=199] SORT: CLASS PERCENT ORIGINAL IA ACCOUNT IA_ORIGINAL IA_REDIGITIZED IA_TOTAL PERCENT ORIGINAL IA COMMERCIAL GOVERNMENT
296 INDUSTRIAL INSTITUTIONAL MULTIFAMILY NON PROFIT
297 RESIDENTIAL
298 TABLE 4 LANCASTER REDIGITIZATION RESULTS SUMMARY BY ACCOUNT CLASS SUMMARY STATISTICS N MINIMUM MAXIMUM MEDIAN MEAN SD CV 95LCL 95UCL DIFFERENCE: CRITIGEN REDIGITIZED IMPERVIOUS SF POOLED COMMERCIAL GOVERNMENT INDUSTRIAL INSTITUTIONAL MULTIFAMILY NONPROFIT RESIDENTIAL PERCENT DIFFERENCE: DIFFERENCE/ORIGINAL IMPERVIOUS SF POOLED COMMERCIAL GOVERNMENT INDUSTRIAL INSTITUTIONAL MULTIFAMILY NONPROFIT RESIDENTIAL
299 TABLE 5 REDIGITIZED ADJUSTED FINAL IA COMPARISON ORIGINAL PLUS CRITIGEN IA ORIGINAL IA * MEDIAN PERCENT DIFFERENCE/CL ASS ADJUSTED MINUS OBSERVED [CRITIGEN + ORIGINAL] PRCNT DIF/OBSERVED IA OBJCTID ACCOUNT CLASS ORIGINAL IA CRITIGEN IA GOV GOV GOV RES COMM GOV COMM RES COMM MULTIFAM COMM MULTIFAM COMM NONPROFIT RES COMM COMM RES RES RES COMM COMM COMM RES RES NONPROFIT COMM RES INST RES MULTIFAM MULTIFAM INST COMM RES INDUS COMM INDUS RES RES INDUS MULTIFAM RES NONPROFIT INST RES RES RES RES RES NONPROFIT NONPROFIT COMM INST NONPROFIT MULTIFAM COMM COMM MULTIFAM INDUS RES RES
300 INST COMM COMM COMM RES RES COMM COMM RES RES COMM INDUS MULTIFAM GOV INST COMM COMM GOV RES COMM INDUS NONPROFIT COMM INDUS MULTIFAM COMM RES COMM RES INST COMM MULTIFAM RES GOV COMM RES NONPROFIT MULTIFAM INST RES NONPROFIT COMM RES GOV GOV INST GOV COMM COMM COMM INDUS NONPROFIT COMM INST COMM COMM COMM COMM COMM COMM COMM COMM RES COMM INST COMM RES INST GOV INST
301 COMM INST COMM NONPROFIT COMM INST COMM RES COMM COMM COMM COMM COMM COMM COMM COMM COMM COMM COMM GOV INDUS RES GOV GOV INDUS NONPROFIT INDUS INDUS INDUS INDUS RES RES NONPROFIT RES RES MULTIFAM MULTIFAM NONPROFIT RES RES MULTIFAM RES RES NONPROFIT RES MULTIFAM RES RES RES RES MULTIFAM MULTIFAM MULTIFAM RES RES RES RES MULTIFAM MULTIFAM RES RES RES RES MULTIFAM RES RES RES
302 S
303 Figures
304
305 IMP DEEDAC ASSESS YRBLT GIS_SF IMP DEEDAC ASSESS YRBLT GIS_SF IMP CLASS RES DEEDAC ASSESS YRBLT GIS_SF IMP COMM GOV INDUS INST MULTIFAM NONPROFIT SCATTERPLOT MATRIX, or, SPLOM The exhibit includes two panels of SPLOMs the smaller panel in the upper left includes residential properties which account for the majority of accounts [77 percent]. Because non residential and multi family parcels are of greater interest for selecting accounts for re digitizing, the larger panel [lower center] has been limited to accounts in the 6 SW LU classes comprising those two broad categories of accounts: commercial, government, industrial, institutional, multifamily and not for profit. The displays consist of 10 separate plots laid out in a lower triangle of a matrix. The five plots along the diagonal are the 5 are histograms displaying the distributions of the variables indicated on the x axis of the entire matrix of plots; including, moving from left to right: IMP [impervious surface area], DEEDAC [deed acres], ASSESS [total assessment], YRBLT [year constructed] and GIS_SF [GIS total square footage]. The 10 panels below the diagonal of histograms are paired variable plots with the variable on the x axis indicated in the column heading below and the y axis indicated by the variable names to the left of the first column. The 10 panels correspond to all possible paired variable plots. So, for example, the panel plotting paired GIS_square feet on the y axis and deed_acre on the x axis is the second plot from the left on the bottom row of the exhibit. CLASS COMM GOV INDUS INST MULTIFAM NONPROFIT DEEDAC ASSESS YRBLT GIS_SF FIGURE 1 LANCASTER UTILITY GIS: CONTINUOUS VARIABLE RELATIONSHIPS _EXPLORATORY.DOCX
306 CLASS RES NONPROFIT MULTIFAM INST INDUS GOV COMM YEAR BUILT IMPERVIOUS SQFT IMPERVIOUS SQFT NEIGHBORHOOD DISTRICT IMPERVIOUS SQFT IMPERVIOUS SQFT FIGURE 2 LANCASTER UTILITY GIS: IMPERVIOUS AREA BY SW UL CLASS & NETWORK AREA _EXPLORATORY.DOCX
307 Z-SCORE IMPERVIOUS SF CLASS COMM GOV INDUS INST MULTIFAM NONPROFIT RES PROBABILITY PLOT The panels are probability plots of the observed impervious area, color coded by SW LU class, against the theoretical Normal distribution. The smaller panel to the left includes single residential properties which numerically dominate the Lancaster distribution network. The lower panel excludes the residential parcels to be better display the non residential and/or multi family accounts. In the probability plots, if data are normally distributed they fall along a straight line. Lines falling further left indicate data subsets with lower impervious surface area; e.g., the distribution of residential accounts in the upper panel [dark green] as compared to the institutional accounts [aqua] with comparatively larger areas of impervious surface. The relative straightness of lines in the lower panel indicates a single population, excluding the break in the multi family plot which suggests a bimodal distribution of impervious areas. 3 2 Z-SCORE IMPERVIOUS SA [SQFT] CLASS FIGURE 3 LANCASTER UTILITY GIS: IMPERVIOUS SURFACE AREA DISTRIBUTION BY CLASS COMM GOV INDUS INST MULTIFAM NONPROFIT _EXPLORATORY.DOCX

308 Figure 4 ACCOUNTS SELECTED FOR REDIGITIZING: SPATIAL DISTRIBUTION _EXPLORATORY.DOCX
DRAFT. Stormwater Management Program Credit Policy and Appeals Process Manual Policies & Procedures LOWER ALLEN TOWNSHIP STORMWATER AUTHORITY
 DRAFT Stormwater Management Program Credit Policy and Appeals Process Manual Policies & Procedures LOWER ALLEN TOWNSHIP STORMWATER AUTHORITY JANUARY 2019 Table of Contents Introduction 3 Definitions 3
Lake County Stormwater Utility Fee
 County of Lake Stormwater Management Department 550 Blackbrook Road Painesville, OH 44077 Phone: (440) 350-2770 Fax: (440) 352-8133 www.lakecountyohio.org/smd Lake County Stormwater Utility Fee Credit
STORMWATER UTILITY FEE CREDIT MANUAL
 Single-Family Residential Properties STORMWATER UTILITY FEE CREDIT MANUAL Department of Public Works Stormwater Management Program 941 Fir Street Waynesboro, Virginia 22980 (540) 942-6624 waynesboro.va.us/291/stormwateradministration
STORMWATER MANAGEMENT FUND Department of Environmental Services
 Department of Environmental Services Mission: To implement a comprehensive stormwater management program that balances the following goals: 1) to reduce the potential for stormwater threats to public health,
Stormwater Financing Feasibility Study for. Wrightsville Borough, Pennsylvania
 2015 Stormwater Financing Feasibility Study for Wrightsville Borough, Pennsylvania Prepared for Wrightsville Borough, Pennsylvania Prepared by University of Maryland Environmental Finance Center for the
As outlined in Memo #2, a number of alternatives are being considered for the development of the stormwater credit program and are listed below.
 MEMORANDUM City of Kitchener City Hall, 200 King St. West P.O. Box 1118 Kitchener, ON N2G 4G7 Date: September 20, 2011 To: From: cc: Steering Committee Members Nick Gollan and Nancy Corbett Project Team
Stormwater System Development Charges
 Methodology Report Stormwater System Development Charges Prepared For City of Springfield April 20, 2009 GALARDI CONSULTING, LLC PAGE 1 OF 9 SECTION 1 Introduction Oregon legislation establishes guidelines
APWA 2016 PWX 8/18/2016. A How to Guide to Funding Stormwater Projects for Small Cities/Rural Communities PWX Minneapolis August 29, 2016
 A How to Guide to Funding Stormwater Projects for Small Cities/Rural Communities. 2016 PWX Minneapolis August 29, 2016 PART 1 WHAT IS A STORM WATER UTILTY? 1 OVERVIEW Stormwater Utility Definition Authority
Stormwater Utilities 101: Getting Started on Financing your Stormwater Management Plan
 Stormwater Utilities 101: Getting Started on Financing your Stormwater Management Plan Joanne Throwe Environmental Finance Center University of Maryland Martinsburg, WV July 17, 2013 The Environmental
STORMWATER MANAGEMENT FUND DEPARTMENT OF ENVIRONMENTAL SERVICES
 DEPARTMENT OF ENVIRONMENTAL SERVICES Mission: To implement a comprehensive stormwater management program that balances the following goals: 1) to reduce the potential for stormwater threats to public health,
City of Duluth Stormwater Utility
 City of Duluth Stormwater Utility Stormwater Utility User Fee Credit Manual JUNE 13, 2011 TABLE OF CONTENTS SECTION 1 GENERAL INFORMATION... 1 DEFINITIONS... 1 SUMMARY OF STORMWATER USER FEE CREDITS...
City of Galesburg Stormwater Utility Credits and Incentives Policy
 Stormwater Utility Credits and Incentives Policy December, 2014 Table of Contents 1 Background... 2 2 Applicability of Incentives and Credits... 2 3 Incentives... 3 3.1.1 Rain Barrels... 3 3.1.2 Other
City of Brunswick Stormwater Utility
 City of Brunswick Stormwater Utility Stormwater User Fee Credit Manual JUNE 2018 TABLE OF CONTENTS SECTION 1 GENERAL INFORMATION... 1 DEFINITIONS... 1 SUMMARY OF STORMWATER USER FEE CREDITS... 3 STORMWATER
Green Stormwater. Flood Risk Reduction. Infrastructure for. June Presented by: Kari Mackenbach, CFM ms consultants Lynn Mayo, PE, CFM AECOM
 Green Stormwater Infrastructure for Flood Risk Reduction June 2016 Presented by: Kari Mackenbach, CFM ms consultants Lynn Mayo, PE, CFM AECOM Topics 1. Proposed ASFPM Policy Paper 2. Background Why is
Funding Methods and Revenue Generating Capacity
 TOWNSHIP OF FERGUSON Funding Methods and Revenue Generating Capacity Executive Summary The purpose of this paper is to examine the funding mechanisms available to the Township to support a stormwater management
STORM WATER UTILITY CREDIT AND ADJUSTMENT POLICY MANUAL
 STORM WATER UTILITY CREDIT AND ADJUSTMENT POLICY MANUAL Adopted by the Board of Mayor and Aldermen of the City of Spring Hill on December 21, 2009 TABLE OF CONTENTS STORM WATER UTILITY CREDIT AND ADJUSTMENT
City of Kinston. Stormwater Utility Credit Manual
 City of Kinston Stormwater Utility Credit Manual Effective Date: July 1, 2008 Table of Contents 1.0 INTRODUCTION...3 2.0 DEFINITIONS...4 3.0 GENERAL CREDIT POLICIES...4 4.0 STORMWATER BMP CREDIT POLICY.......................
Sugar Hill Stormwater Utility Credit Technical Manual
 CITY OF SUGAR HILL. Sugar Hill Stormwater Utility Credit Technical Manual.......... Amended January 14, 2010 Table of Contents City of Sugar Hill Stormwater Utility Credit Technical Manual DEFINITIONS...
City of Centerville BMP Pages Table of Contents. Minimum Control Measure 1. Public Education and Outreach
 i City of Centerville s Table of Contents Minimum Control Measure 1. Public Education and Outreach Best Management Practice Page 1-1: Outreach Publications...1 1-2: 30-day Public Notice for Annual Storm
Statement of Policy. Milwaukee Metropolitan Sewerage District s Private Property Inflow and Infiltration Reduction Program.
 Milwaukee Metropolitan Sewerage District s 2011-2020 Private Property Inflow and Infiltration Reduction Program Introduction Infiltration is the quantity of water entering a sewer system through such sources
Albemarle County Stormwater Utility Implementation Advisory Panel. June 13, 2017
 Albemarle County Stormwater Utility Implementation Advisory Panel June 13, 2017 Today s Agenda Background Advisory panel role Community engagement planning Update on County water resources program Utility
Exhibit A. City of Roswell Stormwater Utility. Stormwater Utility Credit Manual. December 27, 2010
 Exhibit A City of Roswell Stormwater Utility Stormwater Utility Credit Manual December 27, 2010 Section 1 Introduction and Overview Stormwater utility credits recognize efforts by private and public entities
West Virginia Department of Environmental Protection MS4 Phase II Storm Water Program Storm Water Management Annual Report
 West Virginia Department of Environmental Protection MS4 Phase II Srm Water Program Srm Water Management Annual Report City of Vienna, West Virginia May 23, 2009 1.0 INTRODUCTION The City of Vienna was
Water Resources Engineering Division Public Works City of Colorado Springs
 Water Resources Engineering Division Public Works City of Colorado Springs Richard Mulledy, P.E. Division Manager City of Colorado Springs/Pueblo County IGA City of Colorado Springs/Pueblo County IGA $460
STORMWATER MANAGEMENT FUND Department of Environmental Services
 Department of Environmental Services Mission: To implement a comprehensive stormwater management program that balances the following goals: 1) to reduce the potential for stormwater threats to public health,
Stormwater Management Utility Fee Reduction Credit Application
 Stormwater Management Utility City of Dubuque, IA Winter 2003 Stormwater Management Utility Stormwater Management Utility Introduction The City of Dubuque established a Stormwater Management Utility on
TERMS OF REFERENCE FOR CONSULTING SERVICES FOR A STORMWATER FUNDING STUDY
 TERMS OF REFERENCE FOR CONSULTING SERVICES FOR A STORMWATER FUNDING STUDY PROJECT OVERVIEW The City of Guelph (City) wishes to retain a consulting engineering firm to complete a Stormwater Funding Study.
Phase 3 WIP Development Guide
 Goal Phase 3 WIP Development Guide The development of a final plan that: 1. Is implementable to achieve the Total Maximum Daily Load (TMDL) nutrient and sediment load reduction allocations for Pennsylvania.
1/12/2017. The Road to RAPs. Annette Higby. . Attorney at Law Randolph, VT
 The Road to RAPs Annette Higby. Attorney at Law Randolph, VT. 1 The Road to RAPs 1972 Federal Clean Water Act Point Sources Permits and technological controls Non point sources left to the states. The
Delaware River Basin Commission s Role in Flood Loss Reduction Efforts
 Delaware River Basin Commission s Role in Flood Loss Reduction Efforts There is a strong need to reduce flood vulnerability and damages in the Delaware River Basin. This paper presents the ongoing role
2013 Financing Feasibility Study for Stormwater Management in Salisbury, Maryland
 2013 Financing Feasibility Study for Stormwater Management in Salisbury, Maryland Prepared for the City of Salisbury, Maryland Prepared by the Environmental Finance Center (EFC) for the Maryland Department
REPORT TO Utilities Rate Advisory Commission City of Sacramento
 REPORT TO Utilities Rate Advisory Commission City of Sacramento 1395 35 th Ave. Sacramento, CA 95822 www.cityofsacramento.org/utilities Honorable Chair and Members of Utilities Rate Advisory Commission
Stormwater Management Program
 Derry Township Municipal Authority Stormwater Management Program Stormwater Stakeholder Advisory Committee Meeting #6 July 27, 2016 Agenda 1. Where did we leave off? 2. What progress have we made? 3. What
Water Pollution Control Loan Fund 2017 Program Management Plan
 Water Pollution Control Loan Fund 2017 Program Management Plan Division of Environmental and Financial Assistance (DEFA) December 22, 2016 February 10, 2017 (DRAFT Amended) TABLE OF CONTENTS SECTION PAGE
Peachtree City Public Works Department. Peachtree City Stormwater Utility. Stormwater Utility Credit Technical Manual ...
 . Peachtree City Public Works Department Peachtree City Stormwater Utility Stormwater Utility Credit Technical Manual.......... January 31, 2013 Section 1. Overview This manual outlines the methodology
STORMWATER MANAGEMENT FUND DEPARTMENT OF ENVIRONMENTAL SERVICES
 DEPARTMENT OF ENVIRONMENTAL SERVICES Mission: To implement a comprehensive stormwater management program that balances the following goals: 1) to reduce the potential for stormwater threats to public health,
REGULATORY FEE RECOMMENDATION REPORT TO THE ENVIRONMENTAL QUALITY BOARD
 REGULATORY FEE RECOMMENDATION REPORT TO THE ENVIRONMENTAL QUALITY BOARD NPDES Permit and Annual Fees Chapter 92a. National Pollutant Discharge Elimination System Permitting, Monitoring and Compliance BACKGROUND:
*** DRAFT - NOT YET FILED ***
 3745-39-03 Ohio EPA NPDES requirements for small MS4s. [Comment: For dates of non-regulatory government publications, publications of recognized organizations and associations, federal rules and federal
STORMWATER DISTRICT UTILITY FEASIBILITY STUDY York County, South Carolina
 STORMWATER DISTRICT UTILITY FEASIBILITY STUDY, South Carolina February 18, 2018 Table of Contents 1 Introduction... 2 2 Program Overview... 3 2.1 Current Program... 5 2.1.1 Regulatory Compliance... 5 2.1.2
Water Pollution Control Loan Fund 2018 Final Program Management Plan
 Water Pollution Control Loan Fund 2018 Final Program Management Plan Division of Environmental and Financial Assistance (DEFA) December 15, 2017 TABLE OF CONTENTS Cover photo Tunnel boring machine named
Stormwater Utility Report #2 April 5, 2016
 Stormwater Utility Report #2 April 5, 2016 Introduction In 2015, the Village Council identified Consider Changes to the Stormwater Utility as a Top Priority Action Item. While the fundamental policy question
CITY OF ALHAMBRA UTILITIES DEPARTMENT SEWER SYSTEM MAINTENANCE PROGRAM (SSMP)
") CITY OF ALHAMBRA UTILITIES DEPARTMENT SEWER SYSTEM MAINTENANCE PROGRAM (SSMP) APRIL 2009 Table of Contents INTRODUCTION... 3 SECTION I: GOALS... 3 SECTION II: ORGANIZATION... 4 SECTION III: LEGAL AUTHORITY...
CITY OF ALHAMBRA UTILITIES DEPARTMENT SEWER SYSTEM MAINTENANCE PROGRAM (SSMP) APRIL 2009 Table of Contents INTRODUCTION... 3 SECTION I: GOALS... 3 SECTION II: ORGANIZATION... 4 SECTION III: LEGAL AUTHORITY...
A. All Responses to Request for Statements shall be sent to:
 CITY OF FEDERAL WAY REQUEST FOR STATEMENT OF QUALIFICATIONS ARCHITECTURAL AND ENGINEERING SERVICES Surface Water Management ( SWM ) Comprehensive Plan Capital Improvements Program Update and Rate Study
CITY OF ALBANY CITY COUNCIL AGENDA STAFF REPORT
 CITY OF ALBANY CITY COUNCIL AGENDA STAFF REPORT Agenda date: July 31, 2017 Reviewed by: PC SUBJECT: FROM: Public Hearing on Proposal to increase monthly sewer service charges for purposes of environmental
The City of Owen Sound Asset Management Plan
 The City of Owen Sound Asset Management Plan December 013 Adopted by Council March 4, 014 TABLE OF CONTENTS 1 EXECUTIVE SUMMARY... 1 INTRODUCTION....1 Vision.... What is Asset Management?....3 Link to
THE PEOPLE OF THE STATE OF MICHIGAN ENACT:
 DRAFT A bill to authorize local units of government to create storm water utilities; to permit the establishment and collection of storm water utility fees; to provide for the allocation of the costs of
Sewer Rate Study July 2016
 July 2016 Prepared By The Finance Division TABLE OF CONTENTS SECTION 1: EXECUTIVE SUMMARY... 1 1.1 Background... 1 1.2 Purpose... 1 1.3 Current Sewer Rates... 1 1.4 Five Year Financial Projection... 1
STORMWATER MANAGEMENT FUND Department of Environmental Services
 Department of Environmental Services Mission: To implement a comprehensive stormwater management program that balances the following goals: 1) to reduce the potential for stormwater threats to public health,
STORMWATER ADVISORY GROUP August 26, 2009 Clarkston School District Admin Office 1294 Chestnut Street, Clarkston 5:30-7:30 p.m.
 County of Asotin Regional Stormwater Program P.O. Box 160 135 2 nd Street Asotin, WA 99402 509-243-2071 Fax 509-243-2003 STORMWATER ADVISORY GROUP August 26, 2009 Clarkston School District Admin Office
How To Score, Rank & Prioritize. Improving Regional Water Quality Utah Cultural Celebration Center November 21, 2014
 How To Score, Rank & Prioritize Improving Regional Water Quality Utah Cultural Celebration Center November 21, 2014 Why score & prioritize? You can t implement ALL your ideas! (at least not all at once)
A Quick Guide to Defining and Funding Your Municipal Stormwater Program Merrimack Valley Stormwater Collaborative
 A Quick Guide to Defining and Funding Your Municipal Stormwater Program Merrimack Valley Stormwater Collaborative June 3, 2015 Ellie Baker Horsley Witten Group, Inc. What will we cover today? Introduction
Flood Resilience Study Findings
 Services of the San Francisco Public Utilities Commission Flood Resilience Study Findings Presentation to Citizens Advisory Committee Special Session May 17, 2016 Stefani Harrison, Project Manager 1 Agenda
FUTURE STORMWATER CONTROLS PROGRAM RULES (ARTICLE 5)
") FUTURE STORMWATER CONTROLS PROGRAM RULES (ARTICLE 5) Catskill Watershed Corporation PO Box 569 Margaretville, NY 12455 (845) 586-1400 Approved by the Board of Directors June 23, 1998 Revised April 5, 2016
FUTURE STORMWATER CONTROLS PROGRAM RULES (ARTICLE 5) Catskill Watershed Corporation PO Box 569 Margaretville, NY 12455 (845) 586-1400 Approved by the Board of Directors June 23, 1998 Revised April 5, 2016
MAINTENANCE DEPARTMENT
 MAINTENANCE DEPARTMENT E-78 City of Mercer Island 2007-2008 Budget Department: Maintenance The Maintenance Department consists of the following functions: 1) administration, 2) capital projects engineering,
Proposed FY Storm Drainage Management Fund Budget. Presented to the Dallas City Council August 19, 2009
 Proposed FY2009 10 Storm Drainage Management Fund Budget Presented to the Dallas City Council August 19, 2009 Purpose Storm Drainage Management (SDM) Fund background Current rate structure Proposed rates
IMPLEMENTATION A. INTRODUCTION C H A P T E R
 C H A P T E R 11 IMPLEMENTATION A. INTRODUCTION This chapter addresses implementation of the General Plan. The Plan s seven elements include 206 individual actions. 1 Many are already underway or are on-going.
CITY OF NORTH RIDGEVILLE STORMWATER UTILITY
 CITY OF NORTH RIDGEVILLE STORMWATER UTILITY NON-RESIDENTIAL CREDIT MANUAL January 2019 City of North Ridgeville, 7307 Avon Belden Road, North Ridgeville, Ohio 44039 www.nridgeville.org, 440-353-0819 (office),
Phase II WIP Informational Meetings February 7,
 Phase II WIP Informational Meetings February 7, 2012 1 Acknowledgments The Bay Cabinet expresses its appreciation to the Town Creek Foundation for providing funding to the Harry R. Hughes Center for Agro-
City of Lebanon, Tennessee Stormwater Utility Credit Manual for Stormwater Fees
 City of Lebanon, Tennessee Stormwater Utility Credit Manual for Stormwater Fees Prepared by: Jeff Baines, P.E. Commissioner of Public Services Lebanon, Tennessee May 25, 2018 Instruction Revisions June
Water Quality Improvement Act Purpose and Need For Legislation
 Water Quality Improvement Act Purpose and Need For Legislation Sec. 1 Short Title: Water Quality Improvement Act. Sec. 2. Sewer Overflow Control Grants: The capital costs that cities bear to address combined
PUBLIC WORKS DEPARTMENT
 Departmental Summary FUND/ACTIVITY ACTUAL ADOPTED AMENDED RECOMM. General Fund: Revenue Administration 494,646 501,667 501,035 508,551 Municipal Trash Collection 101,185 60,358 60,358 60,962 Total Revenues
Urban Flooding in Illinois The Changing Face of Floods
 Urban Flooding in Illinois The Changing Face of Floods Chicago Albany Park Neighborhood June 2008 National Academies of Science Chicago, IL September 19, 2017 Welcome to Illinois Floods? Really? Illinois
Deerfield Regional Storm Water District. Meeting Milestones/Logistics
 Deerfield Regional Storm Water District SWAC Meeting No. 3 Storm Water Financing and Level of Service Selection September 22, 2005 Meeting Milestones/Logistics July 27, 2005 1 st Meeting Project Introduction
City of Maryville, Tennessee STORMWATER UTILITY Credit Manual for Stormwater Fees
 City of Maryville, Tennessee STORMWATER UTILITY Credit Manual for Stormwater Fees Prepared By: AMEC Earth and Environmental, Inc. Knoxville, Tennessee June 17, 2005 TABLE OF CONTENTS 1 INTRODUCTION...
Audit of Selected Stormwater Activity
 Audit of Selected Stormwater Activity Report #1302 December 12, 2012 Copies of this audit report #1302 may be obtained from the City Auditor s web site (http://www.talgov.com/auditing/auditreports.cfm),
Overview. Highland Creek Wastewater Treatment Plant. R.C. Harris Water Treatment Plant
 Presentation to Budget Committee October 19, 2009 2010 Operating Budget 2010-20192019 Capital Budget 1 Overview Serves 3.1 million residents and businesses in Toronto, and portions of York and Peel Over
PUBLIC WORKS DEPARTMENT Departmental Summary FUND/ACTIVITY ACTUAL ADOPTED AMENDED ADOPTED General Fund: Revenue Administration
 Departmental Summary FUND/ACTIVITY ACTUAL ADOPTED AMENDED ADOPTED General Fund: Revenue Administration 494,751 453,181 494,253 501,667 Municipal Trash Collection 59,158 59,760 59,760 60,358 Total Revenues
DISTRICT OF COLUMBIA WATER AND SEWER AUTHORITY
 DC Retail Water and Sewer Rates Committee - 1. Call to Order - Alan Roth, Chairman DISTRICT OF COLUMBIA WATER AND SEWER AUTHORITY Board of Directors DC Retail Water and Sewer Rates Committee Tuesday November
WATER, WASTEWATER, STORMWATER, AND MUNICIPAL SOLID WASTE COST OF SERVICE AND RATE DESIGN STUDY
 REPORT January 2017 WATER, WASTEWATER, STORMWATER, AND MUNICIPAL SOLID WASTE COST OF SERVICE AND RATE DESIGN STUDY PREPARED BY: ECONOMICS STRATEGY STAKEHOLDERS SUSTAINABILITY www.newgenstrategies.net 3420
SAUSALITO-MARIN CITY SANITARY DISTRICT 1 EAST ROAD SAUSALITO, CALIFORNIA Telephone: (415) Fax: (415)
 Fax: (415)") 1 EAST ROAD SAUSALITO, CALIFORNIA Telephone: (415) 332-0244 Fax: (415) 332-0453 Budget FY 2017/18 Adopted by Board on June 5, 2017 BUDGET EXECUTIVE SUMMARY FISCAL YEAR 2017/18 DISTRICT OVERVIEW The Sausalito-Marin
1 EAST ROAD SAUSALITO, CALIFORNIA Telephone: (415) 332-0244 Fax: (415) 332-0453 Budget FY 2017/18 Adopted by Board on June 5, 2017 BUDGET EXECUTIVE SUMMARY FISCAL YEAR 2017/18 DISTRICT OVERVIEW The Sausalito-Marin
NPDES Small MS4 General Permit (OHQ000002) Annual Reporting Form
 Annual Reporting Form") NPDES Small MS4 General Permit (OHQ000002) Annual Reporting Form City of Middletown Updated Management Plan - 2011 City of Middletown Updated Management Plan Ohio EPA Facility Permit Number: 1GQ00055*AG
NPDES Small MS4 General Permit (OHQ000002) Annual Reporting Form City of Middletown Updated Management Plan - 2011 City of Middletown Updated Management Plan Ohio EPA Facility Permit Number: 1GQ00055*AG
Actual TOTAL $ 2,793,103 $ 3,115,212 $ 3,206,457 $ 3,296,810
 REVENUE AND EXPENDITURE SUMMARY ITEM Revenues, Other Sources, and Fund Balance Sales/Charges for Services $ 2,773,135 $ 3,077,010 $ 3,191,580 $ 3,288,810 Miscellaneous Income 9,538 8,000 8,416 8,000 Investment
Department of Legislative Services
 Department of Legislative Services Maryland General Assembly 2008 Session HB 369 House Bill 369 Environmental Matters FISCAL AND POLICY NOTE Revised (The Speaker, et al.) (By Request Administration) Education,
Bowie MEMORANDUM. lir. Update on Watershed Implementation Plan II Milestones
 of 1; 7 15901 Excalibur Road eftmar4v Bowie, Maryland 20716 Bowie MEMORANDUM TO: City Council e, `_ ṛ Iv FROM: Alfred D. Lott, City M. -: er lir SUBJECT: Update on 2016-2017 Watershed Implementation Plan
Finance Committee Meeting
 Finance Committee Meeting FY16 Strategic Business and Operating Plan and Preliminary Budget Review April 8, 2015 Finance Committee Meeting FY16 Strategic Business Operating Plan and Preliminary Budget
CITY OF BEVERLY HILLS Public Works Department 345 Foothill Road Beverly Hills, CA 90210
 REQUEST FOR PROPOSAL TO PROVIDE ENGINEERING SERVICES FOR STORMWATER INFILTRATION AND GROUNDWATER RECHARGE FEASIBILITY ASSESSMENT AT LA CIENEGA PARK AND FRANK FENTON FIELD Bid No. 16-32 CITY OF BEVERLY
2664 RIVA ROAD, P.O. BOX 6675
 2664 RIVA ROAD, P.O. BOX 6675 County Executive John R. Leopold ANNAPOLIS, MARYLAND 21401 OFFICE OF PLANNING AND ZONING STORMWATER MANAGEMENT TAX CREDIT On January 7, 2008, the Anne Arundel County Council
WEF Collection Systems Conference 2017
 Enhanced Affordability Analysis of Combined Sewer Overflow Long-Term Control Plans Omaha s CSO! Program Jason Mumm, Stantec, James Theiler, City of Omaha, Andy Baker, Stantec, and Carol Malesky, Stantec
Wastewater Utilities. FY Budget Presentation
 Utilities FY 2018-19 Budget Presentation 1 Volume Forecast Wastewater Customers by Class Fiscal Year Residential Commercial Wholesale Total Growth 2013 26,995 1.1% 3,091 0.8% 4 30,090 1.1% 2014 27,548
Municipal Economics & Planning A division ifruekert/mielke
 A division ifruekert/mielke Economic, Fiscal & Planning Consultants for Local Governments (262) 542-5733 Proposal to Prepare a Sanitary Sewer and Water Utility Consolidation Study Scope of Services This
THE CORPORATION OF THE CITY OF WATERLOO
 PWS2012-070 Appendix A Page 1 of 16 THE CORPORATION OF THE CITY OF WATERLOO BY LAW NO. 2012- I J_ 5 BY-LAW TO IMPOSE A STORMWATER CHARGE AND IMPLEMENT A STORMWATER CREDIT PROGRAM WHEREAS municipalities
Finance Committee Meeting
 Finance Committee Meeting FY18 Strategic Business and Operating Plan and Preliminary Budget Review April 04, 2017 1 Finance Committee Meeting FY18 Strategic Business Operating Plan and Preliminary Budget
DRAFT MULTI-YEAR Water and Wastewater & Treatment Budget December 17, ANNUAL UPDATE INVESTING IN OUR FUTURE. london.
 6 MULTI-YEAR BUDGET FOR THE 2019 ANNUAL UPDATE INVESTING IN OUR FUTURE london.ca/budget DRAFT 2019 Water and Wastewater & Treatment Budget December 17, 2018 Table of Contents Recommendations... 1 WATER
Detailed Resilience Pledge
 Resilience Pledge 10% Resilience Pledge Proposal One objective of the City Leaders Summit is to generate concrete outcomes that City Leaders can take away from their time spent at the Summit. To meet this
Annual Report
 Annual Report - 2017 The following report is was created to satisfy the requirements of The Public Authorities Law ( 2800) and Authority Budget Office PARIS questions. Because this is the first ever report
Subj: REQUIREMENTS FOR PAYMENT OF STORMWATER MANAGEMENT CHARGES
 DEPARTMENT OF THE NAVY COMMANDER, NAVY INSTALLATIONS COMMAND 716 SICARD STREET, SE, SUITE 1000 WASHINGTON NAVY YARD, DC 20374-5140 CNIC INSTRUCTION 5090.5 From: Commander, Navy Installations Command CNICINST
FTE 1 Table Year (proposed) # Budgeted FTE s
 # Budgeted FTE s") P1 ENVIRONMENTAL SERVICES DEPARTMENT PROPOSED SERVICE PLAN 2019-2022 1. Mandate: Environmental Services (ENVS) provides leadership in environmental protection and sustainable service for the citizens of
P1 ENVIRONMENTAL SERVICES DEPARTMENT PROPOSED SERVICE PLAN 2019-2022 1. Mandate: Environmental Services (ENVS) provides leadership in environmental protection and sustainable service for the citizens of
FY 2019 Approved Budget Approved by the Board of Directors on March 1, 2018
 FY 2019 Approved Budget Approved by the Board of Directors on March 1, 2018 DISTRICT OF COLUMBIA WATER AND SEWER AUTHORITY Enhanced Clarification Facility Lucy Tunnel Boring Machine First Street Tunnel
Chicopee River CSO Project Springfield Water & Sewer Commission. APWA Congress September 9, CSO Control Plan. CSO Control
 Chicopee River CSO Project Springfield Water & Sewer Commission APWA Congress September 9, 2007 CSO Control Plan Typical Approach Different Thinking on Controlling Costs Case Example Springfield MA CSO
City of Madison 2018 Capital Improvement Plan Agency Request Summary
 City of Madison 2018 Capital Improvement Plan Agency Request Summary Agency : Agency Request by Project (All Funds) Project 2230 Broadway ## Citywide Flood Mitigation 350,000 875,000 550,000 575,000 675,000
1. What are the approved revisions to the DRBC project review fees and water supply charges?
 Frequently Asked Questions (FAQs) DRBC Project Review Fee and Water Supply Charge Revisions Approved on December 14, 2016 1. What are the approved revisions to the DRBC project review fees and water supply
CHAPTER 11. CAPITAL FACILITIES PLAN ELEMENT
 CHAPTER 11. CAPITAL FACILITIES PLAN ELEMENT 11.1 INTRODUCTION A is one of eight elements required by the Growth Management Act (GMA) to be included in Yakima County s comprehensive plan. The reason for
2015 ANNUAL BUDGET. DRAFT as of 10/31/2014. Leading the nation with clean water solutions
 2015 ANNUAL BUDGET DRAFT as of 10/31/2014 Leading the nation with clean water solutions Budget Narrative 1.0 Introduction to the 2015 Budget The Center for Watershed Protection s 2015 Budget is prepared
SAFE, CLEAN WATER PROGRAM
 SAFE, CLEAN WATER PROGRAM Draft Program Elements Safecleanwaterla.org Table of Contents I. Purpose of the Draft Program Elements Document... 4 II. Introduction to the Safe, Clean Water Program... 4 III.
ORDINANCE ESTABLISHING STANDARDS FOR REDUCTION OF INFLOW AND INFILTRATION. January, Western Lake Superior Sanitary District Duluth, Minnesota
 ORDINANCE ESTABLISHING STANDARDS FOR REDUCTION OF INFLOW AND INFILTRATION January, 2009 Western Lake Superior Sanitary District Duluth, Minnesota WESTERN LAKE SUPERIOR SANITARY DISTRICT ORDINANCE ESTABLISHING
Environmental Improvement Fund
 Informational Paper 64 Environmental Improvement Fund Wisconsin Legislative Fiscal Bureau January, 2009 Environmental Improvement Fund Prepared by Kendra Bonderud Wisconsin Legislative Fiscal Bureau One
Asset Management Investment Plan
 Asset Management Plan Prepared for the City of Kimberley 304-1353 Ellis Street Kelowna, BC, V1Y 1Z9 T: 250.762.2517 F: 250.763.5266 June 2016 File: 1162.0014.01 A s s e t M a n a g e m e n t I n v e s
AUDIT OF Department of Public Utilities STORMWATER DIVISION
 Report Issue Date: June 9, 2015 Report Number: 2015-10 AUDIT OF Department of Public Utilities STORMWATER DIVISION Richmond City Council Office of the City Auditor Richmond City Hall 900 E. Broad Street,
Chapter 21 City Code of Ordinances
 August 6, 2015 Chapter 21 City Code of Ordinances Stormwater Assessment: Two Types 1. Service Assessment: to plan, operate and maintain the City s stormwater system 2. Improvement Assessment: to fund all
2017 UTILITY RATE STUDY WORK SESSION #2: BACKGROUND, EDUCATIONAL/INFORMATIONAL
 2017 UTILITY RATE STUDY WORK SESSION #2: BACKGROUND, EDUCATIONAL/INFORMATIONAL Receive a presentation from Lewis Young Robertson & Burningham regarding the 2017 Utility Rate Study The purpose of the Council