Foreclosure Trends Q Joseph Speer Research Analyst. September 2017 RESEARCH AND PLANNING DIVISION
|
|
|
- Mavis Thomas
- 6 years ago
- Views:
Transcription


1 September 2017 Foreclosure Trends Q Joseph Speer Research Analyst RESEARCH AND PLANNING DIVISION Tennessee Housing Development Agency Andrew Jackson Building 502 Deaderick St., Third Floor Nashville, TN 37243
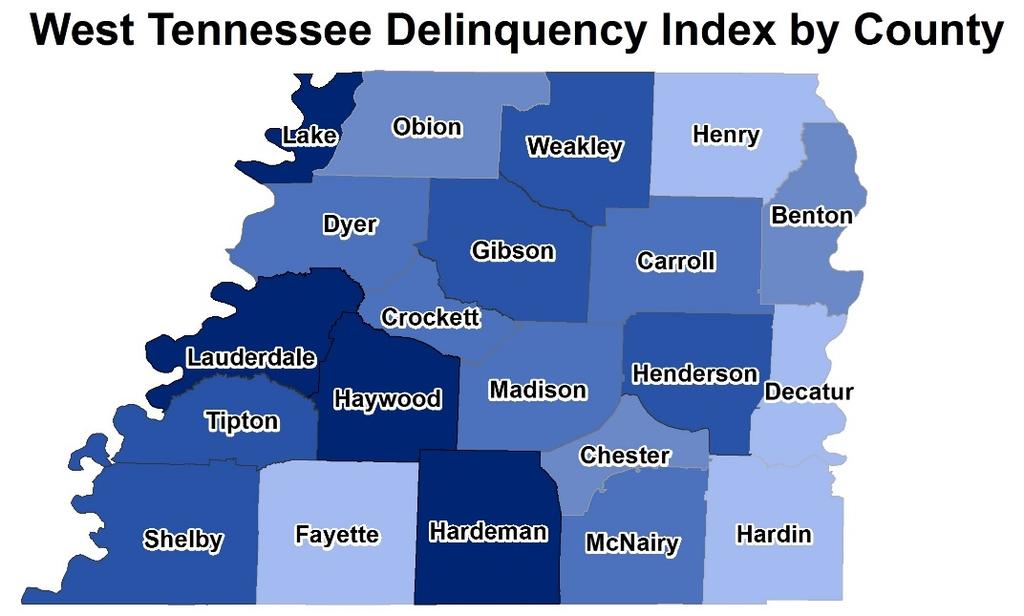
2 Key Findings: Mortgage delinquencies and foreclosures both decreased during the 2 nd quarter of 2017; while this has been the general trend in Tennessee for the last several years, the magnitude of declines during Q2 was stronger than most quarter-over-quarter declines observed recently. Tennessee s REO count rose slightly during Q2, the first quarter-over-quarter increase in REOs since Q1 of While the volume of delinquency and foreclosure decreases was driven by larger, urban counties, plenty of smaller counties experienced reductions in foreclosure totals, and almost every county in Tennessee experienced reductions in delinquency totals. Several Tennessee counties that rank at or near the top of the state in these indices are there because of small totals of active home loans that prove volatile within these indices and the rankings should be viewed with caution. For all county level Values, see Appendix A at the end of this document. INTRODUCTION The past several years of Tennessee s housing market data have fit well into the broader narrative of recovery from the Great Recession. Since their peak levels in 2011 and 2012, Tennessee s delinquency, foreclosure, and REO totals have steadily diminished. While the third and fourth quarter of 2016 represented a departure from this trend, the first six months of 2017 have seen the trend of decreases in delinquency, foreclosure, and REO totals resume. Of the state s four largest counties, Shelby had the highest Values 1, while Hamilton County was near the state average in all three categories, and Davidson and Knox Counties were at below-average levels of distress at all three stages of mortgage delinquency. 2 Tennessee s Four Most Populous Counties, Compared (listed by Population) County Delinquency Foreclosure REO Shelby Davidson Knox Hamilton Within Tennessee, the highest rates of delinquencies, REOs, and foreclosures are generally found within smaller counties, often in West Tennessee. For most of 2015 and 2016, much like Tennessee overall, these high- counties were seeing notable declines in all three categories. In Q2 of 2017, this trend resumed in places like Hardeman, Haywood, and Lauderdale Counties. 1 By indexing county-level delinquency, REO, and foreclosure rates relative to the state average, we can show which areas of the state stand out. Shelby County s Delinquency Value of 172, for example, signifies a delinquency rate 1.72 times the Tennessee overall delinquency rate. A value of 100 indicates a rate consistent with the state s rate. 2 Delinquency totals in CoreLogic s data include mortgages in foreclosure and REO properties. 2
3 While counties such as those listed in the chart below (selected for their high Values across all three stages of delinquency) may appear severely distressed, the Indices indicate rates relative to the state, and a high Value is not always indicative of severe distress. In the case of foreclosures and REOs, which occur with less frequency than delinquencies, quarterly values in small counties are especially volatile. Tennessee Counties with High Values in all Three Categories (Irrespective of Population) County Delinquency REO Foreclosure Lauderdale Hardeman Haywood Lake For each of the foreclosure trend variables, there are five maps: four mapping Values by county (showing East, Middle, West, and the State of Tennessee) and a fifth map showing volume, by ZIP code, irrespective of rates/ Values. Because high Values may not necessarily reflect a noteworthy pattern, particularly in less populated counties, the fifth map is provided to show hot spots by volume, whether it be delinquencies, REOs, or foreclosures. These ZIP code-level volume maps are highly correlated with population, whereas county-level maps are relative to each county s pool of active home loans. 3

4 DELINQUENCY As mentioned above, mortgage delinquencies experienced a substantial decrease during Q2 of Delinquent home loans are now at their lowest point in at least seven years, both as a volume total and as a percentage of active home loans. Figure 1 Table 1 County The 10 Counties with the Highest Delinquency Values Q Delinquency Value Q Value Increase or Decrease in Delinquencies? Grand Division 1 Lauderdale Decrease West 2 Hardeman Decrease West 3 Haywood Decrease West 4 Lake No Change West 5 Hancock Increase East 6 Shelby Decrease West 7 Henderson Decrease West 8 Rhea Increase East 9 Gibson Decrease West 10 Cocke Increase East Note: State delinquency rate=100. Lauderdale County s delinquency rate equals 2.56 times the Tennessee rate. A value of 100 indicates a rate consistent with the state s rate. The column titled Increase or Decrease in Delinquencies? is may not reflect individual month-over-month changes, but instead uses the average of Q2 s three end-of-month delinquency totals. Of the 10 counties at the top of the Delinquency, six saw their delinquency totals decrease in the first quarter. If a countywide decrease in delinquencies was outpaced by the decline across Tennessee, however, then said county s Values were higher than the previous quarter, Lauderdale County being 4
5 an example of this. Q2 of 2017 is the first quarter (since THDA began calculating Delinquency relative to loan count) that Hardeman County did not finish with the state s highest delinquency rate. For the seventh consecutive quarter, Williamson County ranked in the bottom five of the Delinquency, with a delinquency rate roughly one-fifth of Tennessee s overall rate. Figure 2 below allows for a visualization of Tennessee counties and their quarterly changes in delinquency totals relative to their size. The magnitude of declines in delinquency was so pronounced in Shelby County that the scale of Figure 2 minimizes the changes elsewhere in Tennessee. Overall, 77 counties experienced falling delinquency totals, while 12 experienced an increase (six saw no change). The magnitude of these increases was minimal, as illustrated by Figure 2. Figure 2 Maps 1-4 below display county-level delinquency outcomes, while the top ZIP codes are listed and then mapped in Map 5. Map 5 focuses on the delinquency hot spots, showing high totals of delinquencies, rather than the Values in Maps 1-4. As seen in map 5, 12 of the top 15 ZIP codes for delinquency were located in Shelby County. 5

6 6

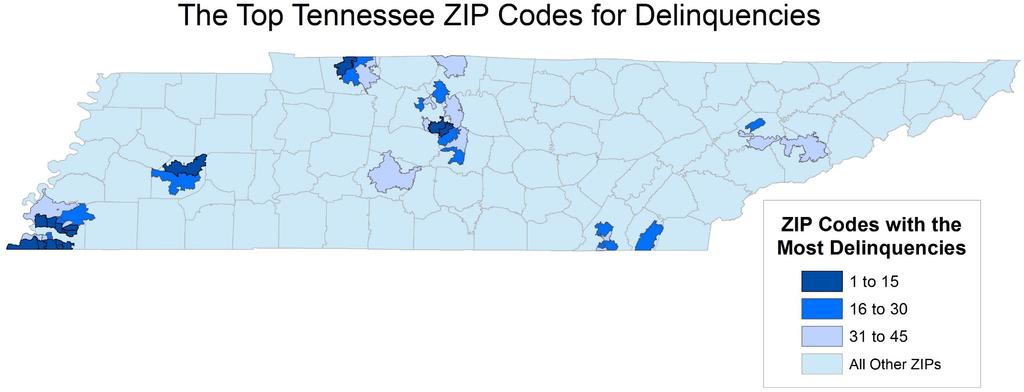
7 Map 4 & 5 7
8 Table 3 Top 5 Tennessee Counties for Delinquency Volume 1 Shelby 2 Davidson 3 Hamilton 4 Knox 5 Rutherford Table 4 Top 5 Tennessee ZIP Codes for Delinquency * ZIP Code County; City Value Shelby; Memphis Shelby; Memphis Hamilton; Chattanooga Shelby; Memphis Shelby; Memphis 368 *Excluding ZIP Codes with fewer than 100 loans* Table 5 Top 5 Tennessee ZIP Codes for Delinquency Volume ZIP Code County; City Shelby; Memphis Montgomery; Clarksville Shelby; Memphis Shelby; Memphis Davidson; Nashville 8

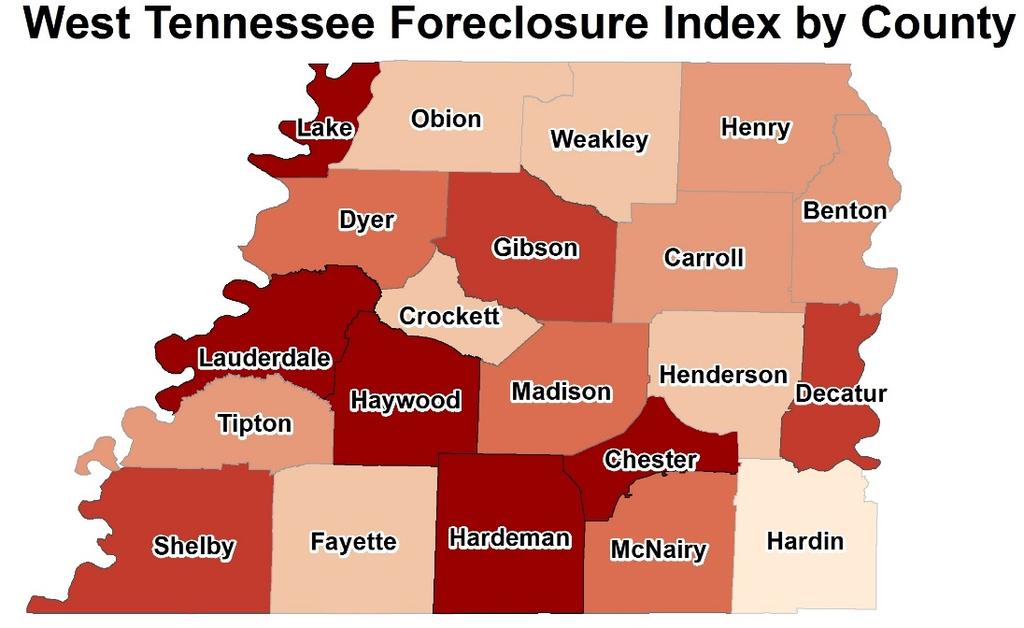
9 FORECLOSURE Figure 3 As was the case for delinquencies, foreclosures in Tennessee experienced a significant drop during Q2 of As Figure 3 above shows, foreclosure totals remained largely unchanged for most of Q data reveals that the reductions in foreclosure have resumed across the state. Table 6 The 10 Counties with the Highest Foreclosure Values County Q Foreclosure Value Q Foreclosure Value Increase or Decrease in Foreclosures? Grand Division 1 Lake Decreased West 2 Meigs Increased East 3 Haywood No Change West 4 Lauderdale Increased West 5 Stewart Increased Middle 6 Wayne No Change Middle 7 Chester Increased West 8 Hardeman Decreased West 9 Decatur Increased West 10 Shelby Decreased West Note: State rate=100; Lake County s value of 294 denotes a foreclosure rate 2.94 times that of the Tennessee overall rate. If a county s foreclosure rate did not change from the previous quarter, but the Tennessee rate decreased, then that individual county s Foreclosure Value increased (i.e. Haywood County). In terms of volume, foreclosures are much lower than delinquencies, 3 resulting in more erratic percentage changes on a quarter-to-quarter basis. 3 For perspective, there are nearly 6.5 delinquent mortgages for every mortgage in foreclosure within Tennessee. It should be noted, however, that this delinquency total includes both loans in foreclosure and REO properties. 9
10 As Figure 4 illustrates, the majority of counties saw their foreclosure totals decrease, much like delinquency totals. The bulk of the statewide reduction in foreclosure, however, came from reductions in the state s eight largest counties. This has generally been the trend for some time, with Q1 of 2017 being a notable exception, where seven out of the largest eight counties experienced increases in foreclosures. Meigs County, despite being one of the state s smallest in terms of loan volume, experienced Tennessee s largest county-level increase in foreclosure volume during Q2. Figure 4 Maps 6 through 9 display the county-level Foreclosure, broken down by Grand Division. To illustrate where the bulk of foreclosure volume occurs, irrespective of rates, Map 10 is included, showing ZIP codelevel foreclosure totals, which are concentrated in Shelby County largely due to its population. 10

11 11
12 Maps 9 & 10 12
13 Table 7 Top 5 Tennessee Counties for Foreclosure Volume 1 Shelby 2 Davidson 3 Hamilton 4 Knox 5 Montgomery Table 8 Top 5 Tennessee ZIP Codes for Foreclosure * ZIP Code County; City Value Stewart; Big Rock Value= Montgomery; Palmyra Value= McNairy; Ramer Value= Decatur/Henderson; Scott s Hill Value= Hamilton; Chattanooga Value=432 *Excluding ZIP Codes with fewer than 100 loans* Table 9 Top 5 Tennessee ZIP Codes for Foreclosure Volume ZIP Code County; City Montgomery; Clarksville Shelby; Memphis Shelby; Memphis Davidson; Nashville Shelby; Memphis 13
14 REAL ESTATE OWNED (REO) PROPERTIES During Q2 of 2017, Real Estate Owned (REO) properties in Tennessee increased over the previous quarter s total, for the first time in nearly three years. As Figure 5 below shows, however, this increase was very minimal in the context of REO volume over the past several years. Figure 5 As shown in Figure 5, the pace of decline in Tennessee s REO inventory has generally slowed down over the last twelve months, and the trajectory of REO inventory has not been as strongly seasonal as delinquency has been (where most declines have happened during the 1 st quarter). With only a few exceptions, most countywide REO totals finished with very little quarterly change, as shown in Figure 6 on the following page. Table 10 County The 10 Counties with Tennessee s Highest REO Values REO Value Q REO Value Increase or Decrease in REOs? Grand Division 1 Wayne Increased Middle 2 Cocke Increased East 3 Campbell Increased East 4 Houston Decreased Middle 5 Lewis Increased Middle 6 Hancock No Change East 7 Jackson No Change Middle 8 Van Buren No Change Middle 9 Lake No Change West 10 Weakley Decreased West Note: State REO rate=100; Wayne County s value of 730 denotes an REO rate 7.30 times that of the Tennessee overall rate. 14
15 Unlike delinquency, the distribution of the REO is far less clustered around the state average of 100; with a maximum value reaching more than seven times the state average. 4 Furthermore, the highest value counties are primarily smaller, rural counties; the top ten counties shown above had an average of around 1,000 active mortgages and six REO properties. The relative infrequency of REOs 5 statewide meant that five REOs in a small county was a high rate of incidence. Shelby County, for example, is ranked 49 th overall in REO rate, which may seem surprisingly low, given that Shelby County has 9 of the top 15 ZIP codes for REO totals. Figure 6 The top REO ZIP codes are far more scattered across the state s smaller counties and Grand Divisions than the top ZIP codes in the Delinquency, which were by and large in Shelby County and the Nashville MSA (listed on page seven). Maps show county-level REO values by grand division, and Map 15 is included to show the 45 Tennessee ZIP codes with the highest REO totals, which were 4 The REO is prone to dispersion and extremes for two reasons: one, the relative infrequency of REOs in Tennessee, and two, the lack of home price appreciation in smaller, rural counties, which can increase REO incidence. In the first quarter of 2017, a delinquent loan was more than 21 times as frequent as an REO in Tennessee. This infrequency inevitably leads to huge swings in REO Values. Because REOs make up less than two tenths of a percent of Tennessee s active loan total, a countywide increase from four to six REOs, for example, very well could vault it into the upper end of the REO. 5 CoreLogic estimates it has less overall coverage of REO properties at a national level than it does for delinquencies and foreclosures. Within the state of Tennessee, however, it is unclear to what extent an underestimation may be present. Existing coverage of REOs in Tennessee, however, show a decided reduction in REO inventory statewide, and an underestimation of the overall total would not change the high frequency of properties exiting REO status. 15

 finished in the top 15 despite ranking 118 th in active loan totals, as did La Follette")
16 generally found in Tennessee s most populous ZIP codes in metro areas. With REOs, however, more lowpopulation ZIP codes had top 15 REO totals, and zero ZIP codes in the entire Nashville MSA finished in the top 45 for ZIP code-level REO volume. Newport (37821) finished in the top 15 despite ranking 118 th in active loan totals, as did La Follette (37766) and Madisonville (37354) despite a similar profile. Maps 11 & 12 16

17 Map 13 17

18 Maps 14 & 15 18
19 Table 11 Top 5 Tennessee Counties for REO Volume 1 Shelby 2 Knox 3 Hamilton 4 Montgomery 5 Sullivan Table 12 Top 5 Tennessee ZIP Codes for REO * ZIP Code County; City Value Gibson; Bradford Value= Hamilton; Chattanooga Value= Weakley; Greenfield Value= Rhea; Evensville Value= Hamilton/Meigs; Birchwood Value=774 *Excluding ZIP Codes with fewer than 100 loans* Table 13 Top 5 Tennessee ZIP Codes for REO Volume ZIP Code County; City Shelby; Memphis Shelby; Memphis Shelby; Memphis Shelby; Memphis Shelby; Memphis 19
20 Appendix A: Tennessee s 95 Counties, Alphabetical 2nd Quarter 2017 Statewide Ranking (1 through Values 95) County Name Delinquency Foreclosure REO Delinquency Foreclosure REO Anderson Bedford Benton Bledsoe Blount Bradley Campbell Cannon Carroll Carter Cheatham Chester Claiborne Clay Cocke Coffee Crockett Cumberland Davidson Decatur DeKalb Dickson Dyer Fayette Fentress Franklin Gibson Giles Grainger Greene Grundy Hamblen Hamilton Hancock Hardeman Hardin Hawkins Haywood
21 Appendix A: Tennessee s 95 Counties, Alphabetical 2nd Quarter 2017 Statewide Ranking (1 through 95) Values County Name Delinquency Foreclosure REO Delinquency Foreclosure REO Henderson Henry Hickman Houston Humphreys Jackson Jefferson Johnson Knox Lake Lauderdale Lawrence Lewis Lincoln Loudon Macon Madison Marion Marshall Maury McMinn McNairy Meigs Monroe Montgomery Moore Morgan Obion Overton Perry Pickett Polk Putnam Rhea Roane Robertson Rutherford Scott
22 Appendix A: Tennessee s 95 Counties, Alphabetical 2nd Quarter 2017 Statewide Ranking (1 through 95) Values County Name Delinquency Foreclosure REO Delinquency Foreclosure REO Sequatchie Sevier Shelby Smith Stewart Sullivan Sumner Tipton Trousdale Unicoi Union Van Buren Warren Washington Wayne Weakley White Williamson Wilson
23 Appendix B: County Level Values by Loan Count Greater than 100,000 Active Loans 1 County Name Delinquency 2 Foreclosure REO Percent Change in Population from 2010 to Median Homeowner Household Income Median Home Sales Price 5 1 Shelby % $65,665 $187,500 Between 50,000 and 100,000 Active Loans County Name Delinquency Foreclosure REO Percent Change in Population from 2010 to 2015 Median Homeowner Household Income 2016 Median Home Sales Price 2 Davidson % $66,621 $248,250 3 Knox % $64,311 $180,101 Between 20,000 and 50,000 Active Loans County Name Delinquency Foreclosure REO Percent Change in Population from 2010 to 2015 Median Homeowner Household Income 2016 Median Home Sales Price 4 Hamilton % $64,498 $190,000 5 Rutherford % $70,096 $199,000 6 Williamson % $107,630 $419,000 7 Montgomery % $62,174 $174,500 8 Sumner % $67,820 $232,400 1 Data on active mortgage totals is provided by CoreLogic, as is the data for Delinquency, Foreclosure, and REO indices. 2 values, as explained in the report, reference a county s delinquency, foreclosure, and REO rate relative to the Tennessee overall rate. Shelby County s Delinquency value of 174, for example, denotes a countywide delinquency rate that is 1.74 times the Tennessee delinquency rate. 3 U.S. Census Bureau ACS 5-year estimates of countywide population from were compared to the year estimates. 4 U.S. Census Bureau. For more, visit home sales prices provided from the Tennessee Comptroller s Office. For more, visit
24 Appendix B: County Level Values by Loan Count Between 10,000 and 20,000 Active Loans County Name Delinquency Foreclosure REO Percent Change in Population from 2010 to 2015 Median Homeowner Household Income 2016 Median Home Sales Price 9 Wilson % $70,829 $254, Maury % $59,994 $189, Blount % $57,629 $179, Sevier % $51,729 $173, Bradley % $55,561 $156, Sullivan % $50,359 $134, Washington % $54,046 $163,200 Between 5,000 and 10,000 Active Loans County Name Delinquency Foreclosure REO Percent Change in Population from 2010 to 2015 Median Homeowner Household Income 2016 Median Home Sales Price 16 Madison % $56,585 $130, Robertson % $61,096 $183, Anderson % $54,180 $139, Putnam % $50,547 $148, Loudon % $60,555 $223, Tipton % $64,336 $150, Hamblen % $47,409 $132, Cumberland % $43,280 $148, Fayette % $64,762 $205, Cheatham % $60,842 $180,000
25 Appendix B: County Level Values by Loan Count Between 2,000 and 5,000 Active Loans County Name Delinquency Foreclosure REO Percent Change in Population from 2010 to 2015 Median Homeowner Household Income 2016 Median Home Sales Price 26 Dickson % $51,494 $159, Greene % $41,925 $117, Roane % $50,953 $145, Coffee % $51,022 $132, Gibson % $46,113 $115, McMinn % $47,073 $125, Jefferson % $50,746 $140, Bedford % $51,775 $131, Monroe % $41,606 $139, Franklin % $50,158 $135, Hawkins % $43,185 $127, Lincoln % $47,495 $112, Dyer % $56,048 $113, Warren % $46,589 $100, Marshall % $51,409 $135, Lawrence % $46,318 $103, Rhea % $47,281 $135, Campbell % $39,123 $125, Carter % $40,463 $119, Henry % $43,928 $98, Giles % $49,683 $112,000
26 Appendix B: County Level Values by Loan Count 47 White % $40,913 $106, Marion % $48,540 $123, Obion % $49,371 $89, Cocke % $40,600 $110, Hardin % $39,439 $120,000 Between 1,000 and 2,000 Active Loans County Name Delinquency Foreclosure REO Percent Change in Population from 2010 to 2015 Median Homeowner Household Income 2016 Median Home Sales Price 52 Henderson % $45,648 $110, Weakley % $46,171 $89, Carroll % $43,046 $68, McNairy % $36,173 $80, Claiborne % $42,183 $123, Hickman % $43,475 $119, Hardeman % $37,950 $94, Grainger % $39,497 $140, Smith % $53,697 $122, Lauderdale % $41,207 $79, Humphreys % $49,298 $110, DeKalb % $46,057 $124, Overton % $41,359 $120, Union % $42,529 $139, Polk % $43,129 $121, Haywood % $44,177 $103, Chester % $50,625 $115,500
27 Appendix B: County Level Values by Loan Count 69 Macon % $41,261 $107, Fentress % $34,535 $107,500 Fewer than 1,000 Active Loans County Name Delinquency Foreclosure REO Percent Change in Population from 2010 to 2015 Median Homeowner Household Income 2016 Median Home Sales Price 71 Meigs % $38,814 $135, Stewart % $47,886 $119, Crockett % $42,500 $83, Benton % $38,590 $90, Unicoi % $39,581 $125, Cannon % $49,031 $140, Sequatchie % $50,711 $140, Johnson % $36,747 $140, Decatur % $43,113 $81, Morgan % $44,018 $97, Scott % $34,439 $84, Lewis % $41,378 $105, Grundy % $32,567 $96, Wayne % $36,840 $74, Jackson % $36,017 $85, Houston % $44,837 $96, Trousdale % $54,205 $143, Bledsoe % $42,306 $96, Pickett % $44,972 $110, Moore % $49,863 $165, Perry % $35,920 $71,621
28 Appendix B: County Level Values by Loan Count 92 Van Buren % $44,280 $114, Clay % $34,918 $82, Lake % $44,042 $51, Hancock % $31,779 $87,500
Foreclosure Trends Q Joseph Speer Research Specialist. July 2016 RESEARCH AND PLANNING DIVISION
 July 2016 Foreclosure Trends Q1 2016 Joseph Speer Research Specialist RESEARCH AND PLANNING DIVISION Tennessee Housing Development Agency Andrew Jackson Building 502 Deaderick St., Third Floor Nashville,
$15.74 PER HOUR STATE HOUSING
 TENNESSEE STATE #37 * RANKING In Tennessee, the Fair Market Rent () for a two-bedroom apartment is $819. In order this level of and utilities without paying more than 30% of income on housing a household
Mortgage Delinquency and Foreclosure Trends Tennessee Fourth Quarter 2011
 Federal Reserve Bank of Atlanta Community and Economic Development 1000 Peachtree Street NE Atlanta, GA 30309 4470 frbatlanta.org/commdev/ Mortgage Delinquency and Foreclosure Trends Tennessee Fourth Quarter
Mortgage Delinquency and Foreclosure Trends Tennessee Fourth Quarter 2010
 Mortgage Delinquency and Foreclosure Trends Tennessee Fourth Quarter 2010 This report for Tennessee is part of the Mortgage Delinquency and Foreclosure Trends series, released quarterly, which provides
Implications of the Financial Crisis for Housing and Community Development
 Implications of the Financial Crisis for Housing and Community Development The Center for Community Studies Vanderbilt University May 14, 2009 Dan Immergluck Associate Professor City & Regional Planning
ESP Ranking Report ESP Position: Clerical staff (Office Secretary) Ranked By: Average Salary Compiled On: 5/6/2015
 Ranked By: Average Salary Compiled On: 5/6/2015") 2014 2015 ESP Ranking Report ESP Position: Clerical staff (Office Secretary) Ranked By: Average Salary Compiled On: 5/6/2015 Districts were asked to provide the average hourly salary for full time employees
2014 2015 ESP Ranking Report ESP Position: Clerical staff (Office Secretary) Ranked By: Average Salary Compiled On: 5/6/2015 Districts were asked to provide the average hourly salary for full time employees
ESP Ranking Report ESP Position: Classroom Aide Ranked By: Average Salary Compiled On: 5/6/2015
 2014 2015 ESP Ranking Report ESP Position: Classroom Aide Ranked By: Average Salary Compiled On: 5/6/2015 Districts were asked to provide the average hourly salary for full time employees designated as
ESP Ranking Report ESP Position: School Nurse Ranked By: Minimum Salary Compiled On: 5/6/2015
 2014 2015 ESP Ranking Report ESP Position: School Nurse Ranked By: Minimum Salary Compiled On: 5/6/2015 Districts were asked to provide the minimum hourly salary for full time employees designated as school
THDA MORTGAGE PROGRAM REPORT
 August 2012 THDA MORTGAGE PROGRAM REPORT Fiscal Year 2012 Hulya Arik, Ph.D., Research Coordinator DIVISION OF RESEARCH&PLANNING Tennessee Housing Development Agency 404 James Robertson Parkway, Suite 1200
Foreclosure Trends Q Joseph Speer Research Specialist. May 2016 RESEARCH AND PLANNING DIVISION
 May 2016 Foreclosure Trends Q4 2015 Joseph Speer Research Specialist RESEARCH AND PLANNING DIVISION Tennessee Housing Development Agency Andrew Jackson Building 502 Deaderick St., Third Floor Nashville,
THDA MORTGAGE PROGRAM REPORT
 August 2013 THDA MORTGAGE PROGRAM REPORT Fiscal Year 2013 Hulya Arik, Ph.D., THDA Economist DIVISION OF RESEARCH&PLANNING Tennessee Housing Development Agency 404 James Robertson Parkway, Suite 1200 Nashville,
ESP Ranking Report ESP Position: Custodian Ranked By: Minimum Salary Compiled On: 5/6/2015
 2014 2015 ESP Ranking Report ESP Position: Custodian Ranked By: Minimum Salary Compiled On: 5/6/2015 Districts were asked to provide the minimum hourly salary for full time employees designated as custodians
THDA MORTGAGE PROGRAM REPORT
 August, 2009 THDA MORTGAGE PROGRAM REPORT Fiscal Year 2009 Hulya Arik, PhD., Research Coordinator DIVISION OF RESEARCH & PLANNING Tennessee Housing Development Agency 404 James Robertson Parkway, Suite
THDA MORTGAGE PROGRAM REPORT
 March 2013 THDA MORTGAGE PROGRAM REPORT Calendar Year 2012 Hulya Arik, Ph.D. DIVISION OF RESEARCH AND PLANNING Tennessee Housing Development Agency 404 James Robertson Parkway, Suite 1200 Nashville, TN
HOW THE POLL WAS CONDUCTED
 HOW THE POLL WAS CONDUCTED This poll was conducted by Mason-Dixon Polling & Research, Inc. of Jacksonville, Florida from January 31 through February 4, 2019. A total of 625 registered Tennessee voters
THDA SINGLE FAMILY LOAN PROGRAM REPORT
 September 2016 THDA SINGLE FAMILY LOAN PROGRAM REPORT Fiscal Year 2015-2016 Hulya Arik, Ph.D. Economist DIVISION OF RESEARCH AND PLANNING Tennessee Housing Development Agency Andrew Jackson Building 502
THDA MORTGAGE PROGRAM REPORT
 March 2014 THDA MORTGAGE PROGRAM REPORT Calendar Year 2013 Hulya Arik, Ph.D. THDA Economist DIVISION OF RESEARCH AND PLANNING Tennessee Housing Development Agency Andrew Jackson Building 502 Deaderick
Foreclosure Trends Q Joe Speer Research Analyst. March 2018 RESEARCH AND PLANNING DIVISION
 March 2018 Foreclosure Trends Q4 2017 Joe Speer Research Analyst RESEARCH AND PLANNING DIVISION Tennessee Housing Development Agency Andrew Jackson Building 502 Deaderick St., Third Floor Nashville, TN
Please consult with your legal representative before implementing any of these policies
 WC 101 The Crichton Group and Shannon Crawford assumes no liability for the content of the information contained in this document. This information is based upon the best sources available at the time
THDA SINGLE FAMILY LOAN PROGRAM REPORT
 September 2015 THDA SINGLE FAMILY LOAN PROGRAM REPORT Fiscal Year 2015 Hulya Arik, Ph.D. THDA Economist RESEARCH AND PLANNING DIVISION Tennessee Housing Development Agency Andrew Jackson Building 502 Deaderick
THDA SINGLE FAMILY HOMEOWNERSHIP PROGRAM REPORT
 September 2014 THDA SINGLE FAMILY HOMEOWNERSHIP PROGRAM REPORT Hulya Arik, Ph.D. THDA Economist RESEARCH AND PLANNING DIVISION Tennessee Housing Development Agency Andrew Jackson Building 502 Deaderick
Tennessee County Government: Services and Taxes
 University of Tennessee, Knoxville Trace: Tennessee Research and Creative Exchange Research Reports AgResearch 4-1986 Tennessee County Government: Services and Taxes University of Tennessee Agricultural
Tax Statistics. Tennessee County FY 2015
 Tennessee County Tax Statistics FY 2015 226 Capitol Boulevard, Suite 400 Nashville, TN 37219 Phone: (615) 532-3555 www.ctas.tennessee.edu Promoting better county government through direct assistance to
Tennessee County TAX STATISTICS FY 2018
 Tennessee County TAX STATISTICS FY 2018 226 Anne Dallas Dudley Boulevard, Suite 400 Nashville, TN 37219 Phone: (615) 532-3555 ctas.tennessee.edu Promoting better county government through direct assistance
Template Version Date: October 2017
 This document describes the Housing Finance Agency (HFA) Hardest-Hit Fund (HHF) data that state HFAs are required to provide to the U.S. Department of the Treasury. It includes quarterly borrower characteristic
The Economic Impact of Travel on Tennessee Counties 2013
 The Economic Impact of Travel on Tennessee Counties 2013 A Study Prepared for the Tennessee Department of Tourist Development by the Research Department of the U.S. Travel Association Washington, D.C.
5/12/2017. He s Fallen and He Can t Get Up! this happens! Imagine, it s early on a Wednesday morning
 He s Fallen and He Can t Get Up! Practical Advice for Handling Workplace Injuries Properly Presenter: Jeff Francis, Assistant Administrator b.jeff.francis@tn.gov Imagine, it s early on a Wednesday morning
Great Choice Mortgage Program
 Great Choice Mortgage Program Great Choice Mortgage Program THDA is changing its down payment assistance (DPA) from a grant to a 0% second mortgage product for a term of 10 years. Currently, THDA increases
Originating Agents Guide
 Originating Agents Guide JANUARY 2014 TABLE OF CONTENTS PART I INTRODUCTION SECTION 1: THDA Page 1.1 The Guide... 1 1.2 Hours of Operation and Holiday Schedule... 1 1.3 Single Family Program Division Staff
Tennessee Housing Development Agency - Board of Directors Meeting Materials July 24, 2018
 Tennessee Housing Development Agency - Board of Directors Meeting Materials July 24, 2018 Tab 1 Agenda Tab 2 Memo from Ralph Perrey Staff Service Awards, and May 22, 2018 Minutes Tab 3 Bond Finance Committee
Take Credit Guide JULY Latest Revision: 5/24/17
 Take Credit Guide JULY 2016 Latest Revision: 5/24/17 TABLE OF CONTENTS PART I. INTRODUCTION SECTION 1: THDA Page 1.1 The Guide... 1 1.2 Hours of Operation, Holiday Schedule, Staff Directory... 1 1.3 Take
SUMMARY OF BENEFITS. Cigna-HealthSpring Preferred Rx (HMO) Williamson County Government. January 1, December 31, 2019
 Williamson County Government. January 1, December 31, 2019") SUMMARY OF BENEFITS January 1, 2019 - December 31, 2019 Cigna-HealthSpring Preferred Rx (HMO) Williamson County Government Our service area includes the following counties in Tennessee: Anderson, Bedford,
SUMMARY OF BENEFITS January 1, 2019 - December 31, 2019 Cigna-HealthSpring Preferred Rx (HMO) Williamson County Government Our service area includes the following counties in Tennessee: Anderson, Bedford,
STATE OF TENNESSEE WORKERS COMPENSATION ADVISORY COUNCIL
 STATE OF TENNESSEE WORKERS COMPENSATION ADVISORY COUNCIL STUDY OF WORKERS COMPENSATION TRIAL JUDGMENTS 1996-1998 STATE OF TENNESSEE WORKERS COMPENSATION ADVISORY COUNCIL STUDY OF WORKERS COMPENSATION TRIAL
Originating Agents Guide
 Originating Agents Guide JANUARY 2014 Latest Revision: 10/09/18 PART I INTRODUCTION TABLE OF CONTENTS SECTION 1: THDA Page 1.1 The Guide... 1 1.2 Hours of Operation and Holiday Schedule... 1 1.3 Single
Originating Agents Guide
 Originating Agents Guide JANUARY 2014 Latest Revision: 04/05/18 PART I INTRODUCTION TABLE OF CONTENTS SECTION 1: THDA Page 1.1 The Guide... 1 1.2 Hours of Operation and Holiday Schedule... 1 1.3 Single
PROGRAM SERVICES. Program Services Division Steve Summerall, Assistant Treasurer
 PROGRAM SERVICES Program Services Division Steve Summerall, Assistant Treasurer Tennessee Consolidated Retirement System Membership Contributions Retirement Benefits Eligibility Death and Disability Benefits
Summary of the County Powers Relief Act
 Summary of the County Powers Relief Act Near the end of the 2006 legislative session, the General Assembly passed SB 3839 (sponsored by Sen. Ramsey)/HB 3469 (sponsored by Rep. Rinks). This legislation
Aetna Advantage Plans for Individuals, Families and the Self-Employed
 The Aetna Advantage Plans for s and families are offered, underwritten or administered by Aetna Life Insurance Company through an out-of-state blanket trust. If you need this material translated into another
Your Medicare Health Benefits and Services and Prescription Drug Coverage as a Member of Cigna-HealthSpring Premier (HMO-POS)
") January 1 December 31, 2016 EVIDENCE OF COVERAGE Your Medicare Health Benefits and Services and Prescription Drug Coverage as a Member of Cigna-HealthSpring Premier (HMO-POS) This booklet gives you the
January 1 December 31, 2016 EVIDENCE OF COVERAGE Your Medicare Health Benefits and Services and Prescription Drug Coverage as a Member of Cigna-HealthSpring Premier (HMO-POS) This booklet gives you the
The Fix We re In For: The State of Tennessee s Bridges
 The Fix We re In For: The State of Tennessee s Bridges TRANSPORTATION FOR AMERICA Creative Commons cover photo by Flickr user wuji9981 http://www.flickr.com/photos/gswj/1120829179/ T4AMERICA.ORG The Fix
SUMMARY OF BENEFITS. Premier (HMO-POS) H
 H") SUMMARY OF BENEFITS January 1, 2017 - December 31, 2017 Cigna-HealthSpring Premier (HMO-POS) H4454-030 Our service area includes the following counties in Tennessee: Bedford, Benton, Bledsoe, Bradley,
SUMMARY OF BENEFITS January 1, 2017 - December 31, 2017 Cigna-HealthSpring Premier (HMO-POS) H4454-030 Our service area includes the following counties in Tennessee: Bedford, Benton, Bledsoe, Bradley,
Evidence of Coverage:
 January 1 December 31, 2015 Evidence of Coverage: Your Medicare Health Benefits and Services and Prescription Drug Coverage as a Member of Cigna-HealthSpring Premier (HMO-POS) This booklet gives you the
Current Status: Active PolicyStat ID: Origination: 07/2003 Last Reviewed: 08/2017 Last Revised: 08/2017 Next Review: 08/2020
 Current Status: Active PolicyStat ID: 3835760 Origination: 07/2003 Last Reviewed: 08/2017 Last Revised: 08/2017 Next Review: 08/2020 Owner: Section/Dept: References: Applicability: Andrew Gwin: Sr Dir
Anderson County Board of Commissioners
 Anderson County Board of Commissioners Anderson County EMS Director Nathan Sweet Presentations & Acknowledgements 6:00 p.m. Consent Agenda Tuesday, February 18, 2014 @ 6:30 p.m. 1. Approval of January
Tennessee EPO. How to Determine Your Medical Plan Premium (Rate) Medical Plan Rating Rules. Medical Rating Area Table
 Medical Plan Rating Rules. Medical Rating Area Table") Tennessee EPO Cigna Medical and Pediatric Dental Plan Rate Sheet Medical and Pediatric Dental rates applicable for insurance policies with effective dates between January 1, 2017 and December 31, 2017.
Tennessee EPO Cigna Medical and Pediatric Dental Plan Rate Sheet Medical and Pediatric Dental rates applicable for insurance policies with effective dates between January 1, 2017 and December 31, 2017.
2015 Tennessee Medicare Advantage Plan Changes
 2015 Tennessee Medicare Advantage Plan Changes Dear Healthcare Provider, Annual benefits changes for Medicare Advantage plan members will be effective January 1, 2015. Each year, we renew our contract
Martin Methodist College
 Thursday, March 29, 2018 Martin Methodist College Spring 2018 Enrollment Statistics Report Students Reported: 780 Full-Time Equivalency (FTE) Enrollment Attendance Status Full-Time 696 90.4 % 10 100.0
SUMMARY OF BENEFITS. January 1, 2018 December 31, 2018
 SUMMARY OF BENEFITS January 1, 2018 December 31, 2018 Cigna-HealthSpring Premier (HMO-POS) H4454-030 Our service area includes the following counties in Tennessee: Bedford, Benton, Bledsoe, Bradley, Cannon,
Martin Methodist College
 Friday, October 27, 2017 Martin Methodist College Fall 2017 Enrollment Statistics Report Students Reported: 988 Full-Time Equivalency (FTE) Enrollment Attendance Status Full-Time 810 82.9 % 10 90.9 % 820
METRO/NON-METRO AREA (County) 1 PERSON 2 PERSON 3 PERSON 4 PERSON 5 PERSON 6 PERSON 7 PERSON 8 PERSON LIMIT LIMIT LIMIT LIMIT LIMIT LIMIT LIMIT LIMIT
 1 PERSON 2 PERSON 3 PERSON 4 PERSON 5 PERSON 6 PERSON 7 PERSON 8 PERSON LIMIT LIMIT LIMIT LIMIT LIMIT LIMIT LIMIT LIMIT") BLOOMINGTON/NORMAL (McLean) 120% $68,640 $78,480 $88,320 $98,040 $105,960 $113,760 $121,680 $129,480 80% $44,750 $51,150 $57,550 $63,900 $69,050 $74,150 $79,250 $84,350 60% $34,320 $39,240 $44,160 $49,020
BLOOMINGTON/NORMAL (McLean) 120% $68,640 $78,480 $88,320 $98,040 $105,960 $113,760 $121,680 $129,480 80% $44,750 $51,150 $57,550 $63,900 $69,050 $74,150 $79,250 $84,350 60% $34,320 $39,240 $44,160 $49,020
SUMMARY OF BENEFITS. January 1, December 31, 2018
 SUMMARY OF BENEFITS January 1, 2018 - December 31, 2018 Cigna-HealthSpring Preferred (HMO) H4454-037-001 Our service area includes the following counties in Tennessee: Bedford, Benton, Bledsoe, Bradley,
County Changes in Per Capita Personal Income
 County Changes in Per Capita Personal Income Morton J. Marcus Director, Indiana Business Research Center, Kelley School of Business, Indiana University BR ecently, the U.S. Bureau of Economic Analysis
Local Income Tax Distribution Amounts Final CY 2017 Certified Distributions Certified November 16, 2016
 ****PLEASE NOTE**** As required by IC 6-3.6-9-5, by October 1 the Budget Agency has certified to the county auditor an updated certification, after the initial estimates were certified on July 31, 2016.
Template Version Date: May 2011
 This document describes the Housing Finance Agency (HFA) Hardest-Hit Fund (HHF) data that state HFAs are required to provide to Bank of New York Mellon. It includes quarterly borrower characteristic data
Illinois HFA Performance Data Reporting- Borrower Characteristics
 This document describes the Housing Finance Agency (HFA) Hardest-Hit Fund (HHF) data that state HFAs are required to provide to Bank of New York Mellon. It includes quarterly borrower characteristic data
Median Family Income: 60 % % $ BEDROOMS
 KENTUCKY HOUSING CORPORATION MTSP - TABLE OF INCOME AND RENT LIMITS (eff. 3/19/09) HERA SEC 3004(f) - NATIONAL AMI: IRS SECTION 42 ONLY PROJECTS (NO TAX-EXEMPT BOND FINANCING) ADAIR * INCOME 1 2 3 4 5
Hardest Hit Fund Homeowner Emergency Loan Program (HHF)
") Hardest Hit Fund Homeowner Emergency Loan Program (HHF) To finance the creation and the preservation of affordable housing throughout the State to increase the supply of decent and safe places for people
Hardest Hit Fund Homeowner Emergency Loan Program (HHF) To finance the creation and the preservation of affordable housing throughout the State to increase the supply of decent and safe places for people
Guide for Health Care Providers. Health Insurance Marketplace. bcbst.com
 Guide for Health Care Providers Health Insurance Marketplace bcbst.com Table of Contents Health Insurance Marketplace At A Glance... 2 --Marketplace Plans Available Statewide Essential Health Benefit
Template Version Date: May 2011
 This document describes the Housing Finance Agency (HFA) Hardest-Hit Fund (HHF) data that state HFAs are required to provide to Bank of New York Mellon. It includes quarterly borrower characteristic data
1st Quarter Weekly Unemployment Claims -11% Total Home Permits* +44% Total Nonfarm Employment* +3% Mortgage Tax Collections +17%
 HOUSING T E N N E S S E E 1st Quarter 2016 Tennessee dashboard 1st quarter 2016 (percent change over the year) Weekly Unemployment Claims -11% Total Home Permits* +44% Total Nonfarm Employment* +3% Mortgage
$ FACTS ABOUT KENTUCKY: WAGE STATE FACTS HOUSING MOST EXPENSIVE AREAS WAGE RANKING
 STATE #48 * RANKING In Kentucky, the Fair Market Rent () for a two-bedroom apartment is $749. In order this level of and utilities without paying more than 30% of income on housing a household must earn
Template Version Date: August 2011
 This document describes the Housing Finance Agency (HFA) Hardest-Hit Fund (HHF) data that state HFAs are required to provide to Bank of New York Mellon. It includes quarterly borrower characteristic data
2014 Economic Impact Study
 2014 Economic Impact Study Locally funded, financially sound. How IMRF helps Illinois IMRF benefit payments have positive economic effects throughout the state. The pension payments that retirees spend
What Can We Afford in Vigo County?
 What Can We Afford in Vigo County? Robert C. Guell Professor of Economics Indiana State University Kevin P. Christ Associate Professor of Economics Rose-Hulman Institute of Technology Near the conclusion
Status Report to the General Assembly
 Status Report to the General Assembly Administrative Fee For Appointed Counsel Calendar Year 2010 Presented by: The Administrative Office of the Courts Information Systems Division ELIZABETH A. SYKES Director
2011 Group Product Reference Guide (for plans effective Sept. 23, 2010 or later)
") A guide to group products from BlueCross BlueShield of Tennessee and its preferred vendors 2011 Group Product Reference Guide (for plans effective Sept. 23, 2010 or later) Plans described in this booklet
A guide to group products from BlueCross BlueShield of Tennessee and its preferred vendors 2011 Group Product Reference Guide (for plans effective Sept. 23, 2010 or later) Plans described in this booklet
Fewer Applications, Falling Denial Rates
 August 2016 Fewer Applications, Falling Denial Rates Identifying Home Loan Trends in Tennessee from Home Mortgage Disclosure Act (HMDA) Data Hulya Arik, Ph.D. Tennessee Housing Development Agency TABLE
Comparative Iowa Land Values
 Comparative Iowa Land Values 2017-2018 By Crop Reporting District: 2017-2018 2018 2017 2018 2017 2017-2018 County Name $/acre $/acre $ change % change District Name $/acre $/acre $ change % change Harrison
Kentucky HFA Performance Data Reporting- Borrower Characteristics
 Unique Borrower Count Number of Unique Borrowers Receiving Assistance 464 4500 Number of Unique Borrowers Denied Assistance 68 1472 Number of Unique Borrowers Withdrawn from Program 63 840 Number of Unique
Indicators Program. Community and Economic Development. Iowa Income Trends: Sandra Charvat Burke
 Community and Economic Development Indicators Program Sandra Charvat Burke Findings Statewide, median household income was $53,183 during the 2011-2015 period. Counties ranged from $38,560 (Decatur) to
KHEAA by county xlsx
 KEES, CAP, KTG, by County 1998-1999 through 2008-2009 School Years County KEES 1998-1999 CAP 1998-1999 KTG 1998-1999 1999 Total 1999 Total KEES 1999-2 Name No. Amt. No. Amt. No. Amt. Award Amount No. Adair
Status Report to the General Assembly
 Status Report to the General Assembly Administrative Fee For Appointed Counsel Calendar Year 2011 Presented by: The Administrative Office of the Courts Information Systems Division ELIZABETH A. SYKES Director
Expanding Medicaid in Ohio
 Expanding in Ohio County-level analysis March 2013 Introduction The Ohio Expansion Study ( Study ) was conducted with financial support from the Health Foundation of Greater Cincinnati, the Mt. Sinai Health
! "## ( ) * +, -+.#/- 01"2" '11'"0/333''
 * +, -+.#/- 012 '11'0/333''") "## $%& ( ) * +, -+.#/- 01"2" 11"0/333 ( ( 3 2-4 5 (6 3-5-- (7& - -, 888888888888888888888888888888888888888888 %& %& 95 9&:99;) "## 3. - 3 ( :2
"## $%& ( ) * +, -+.#/- 01"2" 11"0/333 ( ( 3 2-4 5 (6 3-5-- (7& - -, 888888888888888888888888888888888888888888 %& %& 95 9&:99;) "## 3. - 3 ( :2
Unemployment Insurance (UI) Claimant Pool Analysis
 Claimant Pool Analysis") Unemployment Insurance (UI) Claimant Pool Analysis This report is a profile of UI Claimants receiving benefits for Unemployment Insurance. The numbers presented in this profile do not represent the total
Unemployment Insurance (UI) Claimant Pool Analysis This report is a profile of UI Claimants receiving benefits for Unemployment Insurance. The numbers presented in this profile do not represent the total
Mortgage Delinquency and Foreclosure Trends Alabama Third Quarter 2010
 Mortgage Delinquency and Foreclosure Trends Alabama Third Quarter 2010 This report for Alabama is part of the Mortgage Delinquency and Foreclosure Trends series, released quarterly, which provides information
Housingmarket. Tennessee. 2nd Quarter Business and Economic Research Center David Penn, Ph.D., Associate Professor, Economics
 Tennessee Housingmarket 2nd Quarter 214 Business and Economic Research Center David Penn, Ph.D., Associate Professor, Economics Supported by Tennessee Housing Development Agency Economic Overview ennessee
3rd Quarter Weekly Unemployment Claims Total Home Permits* Total Nonfarm Employment* Mortgage Tax Collections -5.
 HOUSING T E N N E S S E E 3rd Quarter 2018 Tennessee dashboard 3rd quarter 2018 (percent change over the year) Weekly Unemployment Claims -12.81 Total Home Permits* +2.67 Total Nonfarm Employment* +1.62
 4th Quarter 211 TENNESSEE HOUSING MARKET David A. Penn, Director Business and Economic Research Center Jennings A. Jones College of Business Middle Tennessee State University This quarterly series is supported
Revenue Implications of the Streamlined Sales Tax Project in Tennessee
 Revenue Implications of the Streamlined Project in Tennessee February 11, 2005 William F. Fox Center for Business and Economic Research Ransom Gustafson Tennessee Department of Revenue Julie L. Marshall
Mortgage Delinquency and Foreclosure Trends Alabama First Quarter 2010
 Mortgage Delinquency and Foreclosure Trends Alabama First Quarter 2010 This report for Alabama is part of the Mortgage Delinquency and Foreclosure Trends series, released quarterly, which provides information
Unemployment Insurance (UI) Claimant Pool Analysis
 Claimant Pool Analysis") Unemployment Insurance (UI) Claimant Pool Analysis This report is a profile of UI Claimants receiving benefits for Unemployment Insurance. The numbers presented in this profile do not represent the total
Unemployment Insurance (UI) Claimant Pool Analysis This report is a profile of UI Claimants receiving benefits for Unemployment Insurance. The numbers presented in this profile do not represent the total
The Sparks Bureau of Business and Economic Research/Center for Manpower Studies The University of Memphis
 Prepared for: Tennessee Department of Economic and Community Development Prepared by: The Sparks Bureau of Business and Economic Research/Center for Manpower Studies The University of Memphis December
State Issue 3 Grants a monopoly for the commercial production and sale of marijuana County Variance Sorted Alphabetically By County
 County Variance Sorted Alphabetically By County 2015 2015 2015 2015 2015 Vote 2015 Percent County Region Media Mkt. ISSUE 3 YES ISSUE 3 YES% *ISSUE 3 NO *ISSUE 3 NO% Variance (I) Variance (I) 2015 (I)
David A Penn, Director and Associate Professor Business and Economic Research Center Jones College of Business Middle Tennessee State University
 David A Penn, Director and Associate Professor Business and Economic Research Center Jones College of Business Middle Tennessee State University David.Penn@mtsu.edu www.mtsu.edu/berc National Economic
New Health Insurance Tax Credits in Illinois
 EMBargoed until 11 am EDT Thursday, April 4, 2013 New Health Insurance Tax Credits in Illinois Families USA Help Is at Hand: New Health Insurance Tax Credits in Illinois April 2013 by Families USA This
Expanding Medicaid in Ohio
 Expanding in Ohio County-level analysis March 2013 Introduction The Ohio Expansion Study ( Study ) was conducted with financial support from the Health Foundation of Greater Cincinnati, the Mt. Sinai Health
MASON-DIXON MISSOURI POLL
 MASON-DIXON MISSOURI POLL APRIL 2018 PART I: GREITENS JOB PERFORMANCE EMBARGO: Newspaper Publication Wednesday, April 11, 2018 Broadcast & Internet Release - 5 am. CDT, Wednesday, April 11, 2018 Copyright
Expanding Medicaid in Ohio
 April 2013 Expanding Medicaid in Ohio County-level analysis part 2: Local economic impact on and s Introduction The Ohio Medicaid Expansion Study ( Study ) was conducted with financial support from the
Assistance Provided To Date: $7,506, Total Homeowners Assisted To Date: 1,299. Total # of Participating Servicers: 125
 4 th Quarter 2011 Report as of 12/31/2011: Assistance Provided To Date: $7,506,166.07 Total Homeowners Assisted To Date: 1,299 Total # of Participating Servicers: 125 This document describes the Housing
Kentucky Business Investment (KBI) Program
 Program") This fact sheet provides an overview of the. For a full discussion of the program requirements, please see KRS 154.32. As with all state administered tax incentive programs, any inducements offered to
This fact sheet provides an overview of the. For a full discussion of the program requirements, please see KRS 154.32. As with all state administered tax incentive programs, any inducements offered to
Iowa Wealth Transfer and Projected Wealth Transfer
 Iowa Wealth Transfer 2008-2012 and Projected Wealth Transfer 2010-2059 Sandra Charvat Burke and Mark A. Edelman Findings This study highlights the wealth transfer that was recorded in Iowa and its counties
4th Quarter Weekly Unemployment Claims Total Home Permits* Total Nonfarm Employment* Mortgage Tax Collections -4.
 HOUSING T E N N E S S E E 4th Quarter 2017 Tennessee dashboard 4th quarter 2017 (percent change over the year) Weekly Unemployment Claims -12.27 Total Home Permits* -1.00 Total Nonfarm Employment* +1.17
3407 Clarksville Pike
 NATIONAL MULTI HOUSING GROUP 3407 Clarksville Pike Offering Memorandum 3407 Clarksville Pike Nashville, TN 37218 I NVESTMENT ADVI SOR PAT COSGROVE D +1 615-997-2853 C +1 615-973-5373 pat.cosgrove@marcusmillichap.com
A summary of regional economic indicators for the state of Missouri. FEDERAL RESERVE BANK of KANSAS CITY
 THE ECONOMIC DATABOOK A summary of regional economic indicators for the state of JULY 24, 2017 FEDERAL RESERVE BANK of KANSAS CITY SUMMARY OF CURRENT MISSOURI ECONOMIC CONDITIONS In, the unemployment rate
Jackson-Madison County General Hospital Changes in Active Medical Staff
 Jackson-Madison County General Hospital Changes in Active Medical Staff 2016-2017 Change from Number of Active Active June 30, 2016 # Percentage Discharges Medical Staff Medical Staff to Board Board Average
2.3. Short-Term Outlook 2.3.a. State Labor Markets 2.3.b. Income and Sales 2.3.c. Short-Term Forecast Summary
 In this chapter... 2.1. Chapter Overview 2.2. Recent s Trends 2.2.a. From SIC to NAICS 2.2.b. Recent Conditions 2.2.c. State Labor Markets 2.2.d. Income and Sales 2.2.e. Substate Conditions 2.3. Short-Term
Report As of Date 6/30/2014
 This document describes the Housing Finance Agency (HFA) Hardest-Hit Fund (HHF) data that state HFAs are required to provide to Bank of New York Mellon. It includes quarterly borrower characteristic data
Kentucky HFA Performance Data Reporting- Borrower Characteristics
 HFA Performance Data Reporting- Borrower Characteristics QTD Cumulative 1 Unique Borrower Count 2 of Unique Borrowers Receiving Assistance 154 11104 3 of Unique Borrowers Denied Assistance 22 2297 4 of
Report As of Date 9/30/2014
 This document describes the Housing Finance Agency (HFA) Hardest-Hit Fund (HHF) data that state HFAs are required to provide to Bank of New York Mellon. It includes quarterly borrower characteristic data