Stay on the Right Side & Finishing the Year Strong! From the Active Trend Trader
|
|
|
- Tyrone Evans
- 5 years ago
- Views:
Transcription
1 Stay on the Right Side & Finishing the Year Strong! From the Active Trend Trader
2 Disclaimer U.S. GOVERNMENT REQUIRED DISCLAIMER COMMODITY FUTURES TRADING COMMISSION FUTURES AND OPTIONS TRADING HAS LARGE POTENTIAL REW ARDS, BUT ALS O LARGE POTENTIAL RISK. YOU MUST BE AWARE OF THE RISKS AND BE W ILLING TO ACCEPT THEM IN ORDER TO INVEST IN THE FUTURES AND OPTIONS MARKETS. DON T TRADE W ITH MONEY YOU CAN T AFFORD TO LOSE. THIS IS NEITHER A SOLICITATION NOR AN OFFER TO BUY/SELL FUTURES OR OPTIONS. NO REPRESENTATION I S BEING MADE THAT ANY ACCOUNT W ILL OR IS LIKELY TO ACHIEVE PROFITS OR LOSSES SIMILAR TO THOSE DISCUSSED IN THIS TRAINING. THE PAST PERFORMANCE OF ANY TRADING SYSTEM OR METHODOLOGY IS NOT NECESSARILY INDICATIVE OF FUTURE RESULTS. CFTC RULE HYPOTHETICAL OR SIMULATED PERFORMANCE RESULTS H AVE CERTAIN LIMITATIONS. UNLIKE AN ACTUAL PERFORMANCE RECORD, SIMULATED RESU LTS DO NOT REPRESENT ACTUAL TRADING. ALSO, SINCE THE TRADES HAVE NOT BEEN E XECUTED, THE RESULTS MAY HAVE UNDER-OR-OVER COMPENSATED FOR THE IMPACT, IF AN Y, OF CERTAIN MARKET FACTORS, SUCH AS LACK OF LIQUIDITY. SIMULATED TRADING PRO GRAMS IN GENERAL ARE ALSO SUBJECT TO THE FACT THAT THEY ARE DESIGNED W ITH THE BENEFIT OF HINDSIGHT. NO REPRESENTATION IS BEING MADE THAT ANY ACCOUNT W ILL OR IS LIKELY TO ACHIEVE PROFIT OR LOSSES SIMILAR TO THOSE SHOW N. ALL MATERIALS PRESENTED ARE FOR TRAINING PURPOSES ONLY. TRADERS SHOULD PAPER TRADE ANY NEW METHOD PRIOR TO RISK OF PERSONAL CAPITAL.

3 Tools for Staying on the Right Side of the Market Institutions don t care about small traders They just want to take our money!

4 Tools for Staying on the Right Side of the Market

5 Tools for Staying on the Right Side of the Market Even when we think we do everything correctly---

6 Tools for Staying on the Right Side of the Market Emotions are against us!
7 Tools for Staying on the Right Side of the Market We must learn to be strategic We must learn to be disciplined We must learn to be patient We must learn to use tools that will make this possible.. - Ebb & Flow of the Market - Mechanical Approach - Moving Averages - Price Envelopes - Fibonacci s - Trend Lines - Candlesticks - Oscillators
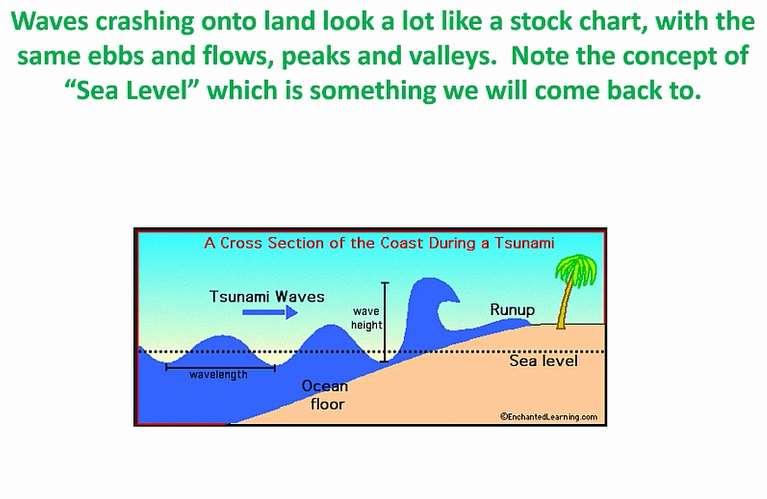
8 Today s Tech Tip: All Markets Ebb & Flow Understanding this concept will improve your trading Patience & Discipline
9
10
11
12
13
14 Ebbs & Flows can be defined as Thrust & Reactions Ebbs & Flows Go Up & Go Down Program yourself to wait!!
15 Ebbs & Flows can be defined as Thrust & Reactions Ebbs & Flows Go Up & Go Down
16
17
18
19
20
21
22
23 Shows Extreme Price Levels Price Envelopes Shows Strength of Trends Provide Clues on when to enter & when to exit trades Often Set up Reversion Trade Opportunities Combining Keltner s and MA Envelopes provide confirming clues Encourages Patience
24 Secondary Active Trend Trading Indicators The Active Trend Trading System has Two levels of indicators to aid in timing both entries and exits Primary Indicators include Price Action This is King! Moving Averages 8 ema, 20 ema, 50 ema, 100 sma & 200 sma (On weekly chart the only the 8 ema (approx the 50 day), 20 and 40 sma Candlestick Reversal Patterns Trend Lines & Price Level Support and Resistance Zones Pattern Breakouts & Breakdowns Secondary Indicators include: True Strength Index (8,8,3 setting on TOS Charts) Momentum (12 setting on TOS Charts) Keltner Channels (20 EMA, 2 ATR settings on TOS Charts) 20 Period Moving Average Envelope set for different time periods
 which captures approximately 80-90% of price movement.")
25 Keltner Channels Originally developed by Chester Keltner in the late 1950 s and early 1960 s Refined by Linda Raschke in the 1980 s A Volatility-based envelope set above and below an exponential moving average (some use SMA) which captures approximately 80-90% of price movement. (Including the 20 period EMA envelope increases to about 95%) A Trend Following indicator used to identify reversals with channel breakouts and channel direction Works on all timeframes (intraday, daily, weekly, monthly)
26 Keltner Channels vs. Bollinger Bands Keltner Channels are smoother than Bollinger Bands because the width of the B Bands are based on standard deviations while K Channels are based on Average True Range (ATR). Many believe the K Channels are more sensitive because they use the exponential moving average, however some traders do use a simple moving average with the K Channels The smooth appearance makes K Channels well suited for trend following and trend identification

27 Keltner Channels vs. Bollinger Bands
28 Keltner Channels: How to use them There is an excellent tutorial at: This tutorial provides the basics on how to use K Channels for trade timing. However remember K Channels are still a secondary indicator. As always, Price is King!

29 Keltner Channels: How to use them Uptrend

30 Keltner Channels: How to use them Downtrend

31 Keltner Channels: How to use them Sideways Trend
32 20 Period Moving Average Envelope Daily: 20 EMA (OHLC) +/- 10% Weekly: 20 EMA (OHLC) +/- 25% 1 Hour Intraday: 20 EMA (OHLC) +/- 5% Basically the same interpretation as the Keltners Typically shows greater extremes and trigger reversion to mean price action

33 Combined Clues Up Trend Begins Down Trend Begins What about now? Early Clues

34 Combined Clues What about now? Up Trend Begins Down Trend Begins What about now? Early Clues Early Clues

35 Combined Clues Weekly What about now? Down Trend Begins Early Clues What about here? Early Clues

36 Combined Clues 1-Hour Intraday What about now? Up Trend Begins What about here? On Intraday Charts Extremes on either TSI or Momentum Provide Solid Clues when combined with price location Early Clues 6/27/16 Early Clues
37 Summary When Used together the value of price action clues are increased Great for planning trades Strategy Entries & Exits
38 Exploring Bottoms & Tops Getting Ready for End of Year! From the Active Trend Trader S&P 1929
39 Today s Tech Tip: How to Buy at the Bottom Don t Anticipate Participate Good: Don t Buy a New Lower Low Unless: 1. Price is at past support & Rebounding and/or 2. Candlestick Reversal Pattern and/or 3. Positive Diverging Indicators and/or Better: Wait for Price Action to Prove Itself 1. Constructive Price Action 2. Retest and Go! Practice Patience & Discipline
40 Today s Tech Tip: How to Sell at the Top Don t Anticipate Participate Good: Don t Sell a New Higher High Unless: 1. Price is at past Resistance & Dropping and/or 2. Candlestick Reversal Pattern 3. Negative Diverging Indicators Better: Wait for Price Action to Prove Itself 1. Constructive Price Action 2. Retest and Go! Practice Patience & Discipline
41 S&P Top of 1929 S&P 1929: Warning Signs Were Everywhere! 8/20 Cross Relief Rally Test

42 S&P Bottom 1932 S&P 1932: Double Bottom Retest 8/20 Cross

43 S&P Top & Bottom S&P : Warning Signs Were Everywhere! Relief Rally Test 8/20 Cross Retest 8/20 Cross

44 S&P Top October /20 Cross S&P 1987 Relief Rally Test Which went on to be a solid uptrend

45 S&P Dot.com Pop 2000 S&P /20 Cross Relief Rally Test

46 S&P Bottom S&P Triple Bottom 8/20 Cross Retest

47 S&P Top S&P /20 Cross Relief Rally Test Copyright Active Trend Trading

48 S&P Bottom 2009 S&P 2009 Retest 8/20 Cross

49 S&P Top 2016? S&P 2016 & Beyond? 8/20 Cross Relief Rally Test Copyright Active Trend Trading
50 Today s Tech Tip: How to Buy at the Bottom Don t Anticipate Participate Good: Don t Buy a New Lower Low Unless: 1. Price is at past support & Rebounding and/or 2. Candlestick Reversal Pattern and/or 3. Positive Diverging Indicators and/or Better: Wait for Price Action to Prove Itself 1. Constructive Price Action 2. Retest and Go! Practice Patience & Discipline
51 Today s Tech Tip: How to Sell at the Top Don t Anticipate Participate Good: Don t Sell a New Higher High Unless: 1. Price is at past Resistance & Dropping and/or 2. Candlestick Reversal Pattern 3. Negative Diverging Indicators Better: Wait for Price Action to Prove Itself 1. Constructive Price Action 2. Retest and Go! Practice Patience & Discipline
52 Clarify, Simplify & Multiply This has been the Motto of Active Trend Trading from the beginning! We continuously work to Clarify & Simplify through refinements to the system to make it objective and easy to both learn and use. The purpose of all presentations is to provide our fellow Active Trend Trader Members a jump start to accelerate progress up the Learning Curve. We welcome suggestions on how to improve the learning process! Trade Wisely & Profitably, Dennis W. Wilborn Founder & Lead Technical Analyst
53 Stocks Worth Watching
4 Keys to Trend Trading Tech Analysis. There is no Holy Grail of Trading Only Tools & Rules
 4 Keys to Trend Trading Tech Analysis There is no Holy Grail of Trading Only Tools & Rules Disclaimer U.S. GOVERNMENT REQUIRED DISCLAIMER COMMODITY FUTURES TRADING COMMISSION FUTURES AND OPTIONS TRADING
Pin Point Entries or Intraday Charts for Non-Intraday Traders
 Pin Point Entries or Intraday Charts for Non-Intraday Traders Simplicity is the secret of seeing things Clearly. ~~ Oswald Chambers WWW.ACTIVETRENDTRADING.COM DENNIS W. WILBORN, SR. DWW@ACTIVETRENDTRADING.COM
Fibonacci s: Hidden Support & Resistance DENNIS W. WILBORN, SR.
 Fibonacci s: Hidden Support & Resistance WWW.ACTIVETRENDTRADING.COM DENNIS W. WILBORN, SR. DWW@ACTIVETRENDTRADING.COM Disclaimer U.S. GOVERNMENT REQUIRED DISCLAIMER COMMODITY FUTURES TRADING COMMISSION
Strategies for Growing an Account DENNIS W. WILBORN, SR.
 Strategies for Growing an Account WWW.ACTIVETRENDTRADING.COM DENNIS W. WILBORN, SR. DWW@ACTIVETRENDTRADING.COM Clarify, Simplify & Multiply This has been the Motto of Active Trend Trading from the beginning!
Understanding Oscillators & Indicators March 4, Clarify, Simplify & Multiply
 Understanding Oscillators & Indicators March 4, 2015 Clarify, Simplify & Multiply Disclaimer U.S. Government Required Disclaimer Commodity Futures Trading Commission Futures and Options trading has large
How to Fix the Top 10 Fatal Errors of Trading One Flaw at a Time. #2 Trading Strategies before Knowing Systems. From the Active Trend Trader
 How to Fix the Top 10 Fatal Errors of Trading One Flaw at a Time #2 Trading Strategies before Knowing Systems From the Active Trend Trader Disclaimer U.S. GOVERNMENT REQUIRED DISCLAIMER COMMODITY FUTURES
Using Oscillators & Indicators Properly May 7, Clarify, Simplify & Multiply
 Using Oscillators & Indicators Properly May 7, 2016 Clarify, Simplify & Multiply Disclaimer U.S. Government Required Disclaimer Commodity Futures Trading Commission Futures and Options trading has large
Leveraged Index ETF s Only?
 Leveraged Index ETF s Only? The plans of the diligent leads to profit as surely as haste leads to poverty! ~~ Proverbs 21:5 WWW.ACTIVETRENDTRADING.COM DENNIS W. WILBORN, SR. DWW@ACTIVETRENDTRADING.COM
How to Fix the Top 10 Fatal Errors of Trading One Flaw at a Time. #8 Spread too Thin #10 Trading too Much or too Little. From the Active Trend Trader
 How to Fix the Top 10 Fatal Errors of Trading One Flaw at a Time #8 Spread too Thin #10 Trading too Much or too Little From the Active Trend Trader Disclaimer U.S. GOVERNMENT REQUIRED DISCLAIMER COMMODITY
Go No Go Indicators: Part 2
 Go No Go Indicators: Part 2 March 22, 2017 Dennis W. Wilborn Active Trend Trading Disclaimer U.S. Government Required Disclaimer Commodity Futures Trading Commission Futures and Options trading has large
Options: How About Wealth & Income?
 Options: How About Wealth & Income? Disclaimer U.S. GOVERNMENT REQUIRED DISCLAIMER COMMODITY FUTURES TRADING COMMISSION FUTURES AND OPTIONS TRADING HAS LARGE POTENTIAL REW ARDS, BUT ALS O LARGE POTENTIAL
Active Trend Trading Rules Review
 Active Trend Trading Rules Review Active Trend Trader: Dennis W. Wilborn A Trend Should Be Assumed to Continue in Effect Until Such Time as Its Reversal Has Been Definitely Signaled Edwards & Magee Disclaimer
How to Fix the Top 10 Fatal Errors of Trading One Flaw at a Time. #1 Trying to Run Before Learning to Walk. From the Active Trend Trader
 How to Fix the Top 10 Fatal Errors of Trading One Flaw at a Time #1 Trying to Run Before Learning to Walk From the Active Trend Trader Disclaimer U.S. GOVERNMENT REQUIRED DISCLAIMER COMMODITY FUTURES TRADING
The Art & Science of Active Trend Trading
 CONNECTING THE DOTS Candlesticks & Convergence of Clues The Art & Science of Active Trend Trading Copywrite ATTS 2007-2015 1 Dennis W. Wilborn, P.E. Founder, President Active Trend Trading dww@activetrendtrading.com
Intraday Charts Hidden Clues!
 Intraday Charts Hidden Clues! Where to Buy & Sell Mid-Week Market Sanity Check Disclaimer U.S. Government Required Disclaimer Commodity Futures Trading Commission Futures and Options trading has large
The Art & Science of Active Trend Trading
 CONNECTING THE DOTS Candlesticks & Convergence of Clues The Art & Science of Active Trend Trading Copyright ATTS 2007-2015 1 Dennis W. Wilborn, P.E. Founder, President Active Trend Trading dww@activetrendtrading.com
The Art & Science of Active Trend Trading
 Candlesticks Looking for U-Turns The Art & Science of Active Trend Trading Copywrite ATTS 2007-2015 1 Disclaimer U.S. Government Required Disclaimer Commodity Futures Trading Commission Futures and Options
5 Pillars of Active Trend Trading Timing is More Important than Price. ~~ W.D. Gann
 5 Pillars of Active Trend Trading Timing is More Important than Price. ~~ W.D. Gann Dennis W. Wilborn Disclaimer U.S. Government Required Disclaimer Commodity Futures Trading Commission Futures and Options
ATTS Weekly Options Weekly Income June 2, 2018
 ATTS Weekly Options Weekly Income June 2, 2018 PRESENTED BY: DENNIS W. WILBORN Disclaimer U.S. GOVERNMENT REQUIRED DISCLAIMER COMMODITY FUTURES TRADING COMMISSION FUTURES AND OPTIONS TRADING HAS LARGE
How to Fix the Top 10 Fatal Errors of Trading One Flaw at a Time. April 14: #4 Unrealistic Expectations. From the Active Trend Trader
 How to Fix the Top 10 Fatal Errors of Trading One Flaw at a Time April 14: #4 Unrealistic Expectations From the Active Trend Trader Disclaimer U.S. GOVERNMENT REQUIRED DISCLAIMER COMMODITY FUTURES TRADING
Today s Tech Tip: Special Report
 Today s Tech Tip: Special Report Dennis W. Wilborn, Sr. ActiveTrendTrading.com dww@activetrendtrading.com Breakouts or Bounces both Good, but which is Best? Disclaimer U.S. Government Required Disclaimer
With Leveraged ETFs. With Leveraged ETFs STOCKS? We Don t Need No Stinking Stocks! Observe things how they are; See things how they can be!
 With Leveraged ETFs Active Trend Trading: Dennis W. Wilborn With Leveraged ETFs STOCKS? We Don t Need No Stinking Stocks! Observe things how they are; See things how they can be! Disclaimer U.S. Government
Double Digit Gains Yearly! Active Trend Trading: Dennis W. Wilborn
 Double Digit Gains Yearly! Active Trend Trading: Dennis W. Wilborn Observe things how they are; See things how they can be! Disclaimer U.S. Government Required Disclaimer Commodity Futures Trading Commission
Strategy when the first trigger is Missed
 Second Chance Entries Active Trend Trading: Dennis W. Wilborn Strategy when the first trigger is Missed Observe things how they are; See things how they can be! Disclaimer U.S. Government Required Disclaimer
Want Big Fish? Fish Where the Big Fish Swim Updated 2015
 Want Big Fish? Fish Where the Big Fish Swim Updated 2015 The art of Technical Analysis, for it is an art, is to identify a trend reversal at a relatively early stage and then ride that trend until the
Chart Pattern Secrets
 Chart Pattern Secrets June 14, 2018 Next Alert: 06/19/18 The Trading System: Application of Trading Chart Patterns with Futures and Option Contracts Copyright 1997 All rights reserved. 1 2 3 4 5 5/15/18:
Strategy I: Buiding Wealth Part 1. For Active Trend Trading Dennis W. Wilborn
 Strategy I: Buiding Wealth Part 1 For Active Trend Trading Dennis W. Wilborn Disclaimer U.S. Government Required Disclaimer Commodity Futures Trading Commission Futures and Options trading has large potential
Where Wealth Begins. Learn to Build a Portfolio PRESENTED BY: DENNIS W. WILBORN
 Learn to Build a Portfolio PRESENTED BY: DENNIS W. WILBORN Disclaimer U.S. GOVERNMENT REQUIRED DISCLAIMER COMMODITY FUTURES TRADING COMMISSION FUTURES AND OPTIONS TRADING HAS LARGE POTENTIAL REWARDS, BUT
How to Avoid the Top 10 Fatal Errors of Trading or
 How to Avoid the Top 10 Fatal Errors of Trading or Eliminating Self-Limiting Beliefs From Your Trading From the Active Trend Trader Copyright: https://www.123rf.com/profile_robeo'>robeo / 123RF Stock Photo
Strategy I: Buiding Wealth Part 1. For Active Trend Trading Dennis W. Wilborn
 Strategy I: Buiding Wealth Part 1 For Active Trend Trading Dennis W. Wilborn Disclaimer U.S. Government Required Disclaimer Commodity Futures Trading Commission Futures and Options trading has large potential
Want Big Fish? Fish Where the Big Fish Swim Updated 2016
 Want Big Fish? Fish Where the Big Fish Swim Updated 2016 The art of Technical Analysis, for it is an art, is to identify a trend reversal at a relatively early stage and then ride that trend until the
The Master Trader Counter-Trend Trade Set-Ups
 The Master Trader Counter-Trend Trade Set-Ups Trading Concepts, Inc. The Master Trader Counter-Trend Trade Set-Ups By Todd Mitchell Copyright 2014 by Trading Concepts, Inc. All Rights Reserved This training
The Launchpad Strategy
 presented by Thomas Wood MicroQuant SM Divergence Trading Workshop Day One The Launchpad Strategy Risk Disclaimer Trading or investing carries a high level of risk, and is not suitable for all persons.
THE CYCLE TRADING PATTERN MANUAL
 TIMING IS EVERYTHING And the use of time cycles can greatly improve the accuracy and success of your trading and/or system. THE CYCLE TRADING PATTERN MANUAL By Walter Bressert There is no magic oscillator
OSCILLATORS. TradeSmart Education Center
 OSCILLATORS TradeSmart Education Center TABLE OF CONTENTS Oscillators Bollinger Bands... Commodity Channel Index.. Fast Stochastic... KST (Short term, Intermediate term, Long term) MACD... Momentum Relative
What We Learned from 2017 & Bad Habits to Eliminate before 2018 December 9, Active Trend Trading Dennis W. Wilborn
 What We Learned from 2017 & Bad Habits to Eliminate before 2018 December 9, 2017 Active Trend Trading Dennis W. Wilborn Disclaimer U.S. Government Required Disclaimer Commodity Futures Trading Commission
CONNECING THE DOTS Candlesticks & Convergence of Clues. The Art & Science of Active Trend Trading
 CONNECING THE DOTS Candlesticks & Convergence of Clues The Art & Science of Active Trend Trading Disclaimer U.S. Government Required Disclaimer Commodity Futures Trading Commission Futures and Options
C y c l e C a n d l e s T r a d i n g W o r k s h o p
 C y c l e C a n d l e s Trading Workshop Risk Disclaimer Trading or investing carries a high level of risk, and is not suitable for all persons. Before deciding to trade or invest you should carefully
Lighting the Way: Using Candlestick Patterns. The Art & Science of Active Trend Trading
 Lighting the Way: Using Candlestick Patterns The Art & Science of Active Trend Trading Disclaimer U.S. Government Required Disclaimer Commodity Futures Trading Commission Futures and Options trading has
Sell in May and Go Away Is it a Good Idea? Active Trend Trading: Dennis W. Wilborn
 Sell in May and Go Away Is it a Good Idea? Active Trend Trading: Dennis W. Wilborn Observe things how they are; See things how they can be! Disclaimer U.S. Government Required Disclaimer Commodity Futures
Candlesticks Discoveries Probability of Success Aug 6, 2016
 Candlesticks Discoveries Probability of Success Aug 6, 2016 The Art & Science of Active Trend Trading Disclaimer U.S. Government Required Disclaimer Commodity Futures Trading Commission Futures and Options
Table of Contents. Risk Disclosure. Things we will be going over. 2 Most Common Chart Layouts Anatomy of a candlestick.
 Table of Contents Risk Disclosure Things we will be going over 2 Most Common Chart Layouts Anatomy of a candlestick Candlestick chart Anatomy of a BAR PLOT Indicators Trend-Lines Volume MACD RSI The Stochastic
presented by Thomas Wood MicroQuant SM Divergence Trading Workshop Day One Naked Trading Part 2
 presented by Thomas Wood MicroQuant SM Divergence Trading Workshop Day One Naked Trading Part 2 Risk Disclaimer Trading or investing carries a high level of risk, and is not suitable for all persons. Before
Technical Indicators versiunea
 Technical Indicators versiunea 2.0 03.10.2008 Contents 1 Price... 1 2 Charts... 1 2.1 Line, Step, Scatter, Histogram/Mountain charts 1 2.2 Open/High/Low/Close charts (Bar Charts)... 2 2.3 Candle charts...
Charting Glossary. September 2008 Version 1
 Charting Glossary September 2008 Version 1 i Contents 1 Price... 1 2 Charts... 1 2.1 Line, Step, Scatter, Histogram/Mountain charts...1 2.2 Open/High/Low/Close charts (Bar Charts)...1 2.3 Candle charts...2
FOREX PROFITABILITY CODE
 FOREX PROFITABILITY CODE Forex Secret Protocol Published by Old Tree Publishing CC Suite 509, Private Bag X503 Northway, 4065, KZN, ZA www.oldtreepublishing.com Copyright 2013 by Old Tree Publishing CC,
Introduction 3. Charts: line, bar and candle 4. Critical price levels 6
 Contents page Introduction 3 Charts: line, bar and candle 4 Critical price levels 6 Resistance, support and pivot points 6 Definitions 6 Reasoning 7 Pivot points 8 Fibonacci retracements 9 Relative Strength
E-Mini Volume Breakout System
 E-Mini Volume Breakout System By Todd Mitchell & Craig Hill For additional bonus information and videos, please go to http://www.eminisuccessformula.com/blog Copyright 2010 by Trading Concepts, Inc. All
Learning Objectives CMT Level I
 Learning Objectives CMT Level I - 2018 An Introduction to Technical Analysis Section I: Chart Development and Analysis Chapter 1 The Basic Principle of Technical Analysis - The Trend Define what is meant
Technical Analysis. A Language of the Market
 Technical Analysis A Language of the Market Acknowledgement: Most of the slides were originally from CFA Institute and I adapted them for QF206 https://www.cfainstitute.org/learning/products/publications/inv/documents/forms/allitems.aspx
Chart Pattern Secrets
 Chart Pattern Secrets October 04, 2018 Next Alert: 10/09/18 The Trading System: Application of Trading Chart Patterns with Futures and Option Contracts Copyright 1997 All rights reserved. 1 2 3 9/20/18:
Level I Learning Objectives by chapter (2017)
") Level I Learning Objectives by chapter (2017) 1. The Basic Principle of Technical Analysis: The Trend Define what is meant by a trend in Technical Analysis Explain why determining the trend is important
Level I Learning Objectives by chapter (2017) 1. The Basic Principle of Technical Analysis: The Trend Define what is meant by a trend in Technical Analysis Explain why determining the trend is important
TECHNICAL INDICATORS
 TECHNICAL INDICATORS WHY USE INDICATORS? Technical analysis is concerned only with price Technical analysis is grounded in the use and analysis of graphs/charts Based on several key assumptions: Price
BY JIM PRINCE
 No part of this publication may be reproduced, stored in a retrieval system, or transmitted in any form or by any means electronic, mechanical, photocopying, recording, or otherwise without the prior permission
Technical Analysis. Dealing Room Peter Leonidou. Peter Leonidou
 Technical Analysis Dealing Room Questions Traders Should Ask What is the trend? What is the pivot point? What is the support levels? What is the resistance levels? Strong or weaker USD? What 1. Trade
GUIDE TO STOCK trading tools
 P age 1 GUIDE TO STOCK trading tools VI. TECHNICAL INDICATORS AND OSCILLATORS I. Introduction to Indicators and Oscillators Technical indicators, to start, are data points derived from a specific formula.
Presents FOREX ALPHA CODE
 Presents FOREX ALPHA CODE Forex Alpha Code Published by Alaziac Trading CC Suite 509, Private Bag X503 Northway, 4065, KZN, ZA www.tradeology.com Copyright 2014 by Alaziac Trading CC, KZN, ZA Reproduction
Introductory Fundamental and Technical Analysis
 Introductory Fundamental and Technical Analysis Tan Junda junda@uobkayhian.com (65) 6590 6616 Jeffrey Tan jeffreytan@uobkayhian.com (65) 6590 6629 Our Focus Today What kind of investor are you? Technical
INTERMEDIATE EDUCATION GUIDE
 INTERMEDIATE EDUCATION GUIDE CONTENTS Key Chart Patterns That Every Trader Needs To Know Continution Patterns Reversal Patterns Statistical Indicators Support And Resistance Fibonacci Retracement Moving
- My 4 Favorite Trades - Essential Trades of a Professional Trader
 presented by Thomas Wood MicroQuant SM Divergence Trading Workshop Day One - My 4 Favorite Trades - Essential Trades of a Professional Trader Risk Disclaimer Trading or investing carries a high level of
The Strategies Working Best in Today s E-Mini Market
 The Strategies Working Best in Today s E-Mini Market Todd Mitchell Craig Hill Legal Disclaimer No claim is made by Trading Concepts, Inc. that the trading strategies shown here will result in profits and
Divergence and Momentum Trading
 presented by Thomas Wood MicroQuant SM Divergence Trading Workshop Day One Divergence and Momentum Trading Risk Disclaimer Trading or investing carries a high level of risk, and is not suitable for all
presented by Thomas Wood MicroQuant SM Divergence Trading Workshop Day One Black Gold
 presented by Thomas Wood MicroQuant SM Divergence Trading Workshop Day One Black Gold Risk Disclaimer Trading or investing carries a high level of risk, and is not suitable for all persons. Before deciding
Forex Sentiment Report Q2 FORECAST WEAK AS LONG AS BELOW April
 Forex Sentiment Report 08 April 2015 www.ads-securities.com Q2 FORECAST WEAK AS LONG AS BELOW 1.1200 Targets on a break of 1.1534/35: 1.1740/50 1.1870/75 1.2230/35 Targets on a break of 1.0580/70: 1.0160
Candlesticks What They Really Mean! March 3, 2018
 Candlesticks What They Really Mean! March 3, 2018 Active Trend Trading Dennis W. Wilborn Disclaimer U.S. Government Required Disclaimer Commodity Futures Trading Commission Futures and Options trading
2.0. Learning to Profit from Futures Trading with an Unfair Advantage! Income Generating Strategies Essential Trading Tips & Market Insights
 2.0 Learning to Profit from Futures Trading with an Unfair Advantage! Income Generating Strategies Essential Trading Tips & Market Insights Income Generating Strategies Essential Trading Tips & Market
CMT LEVEL I CURRICULUM Self-Evaluation
 CMT LEVEL I CURRICULUM Self-Evaluation DEAR CFA CHARTERHOLDER, As a CFA charterholder, the requirement that you sit for the CMT Level I exam is waived. However, the content in the CMT Level I Curriculum
11-Hour Options 2.0 The Next Evolution of Success
 presented by Thomas Wood MicroQuant SM Identifying Key Support and Resistance Levels 11-Hour Options 2.0 The Next Evolution of Success Risk Disclaimer Trading or investing carries a high level of risk,
QUESTION: What is the ONE thing every trader and investor is looking for? ANSWER: Financial Gains
 QUESTION: What is the ONE thing every trader and investor is looking for? ANSWER: Financial Gains Introduction With over 22 years of Trading, Investing and Trading Education experience (as of writing this)
Becoming a Consistent Trader
 presented by Thomas Wood MicroQuant SM Divergence Trading Workshop Day One Becoming a Consistent Trader Risk Disclaimer Trading or investing carries a high level of risk, and is not suitable for all persons.
No-BS Trading System
 No-BS Trading System Techniques The Professionals Don t Want To Be Revealed DISCLAIMER U.S. Government Required Disclaimer - Commodity Futures Trading Commission Futures and Options trading has large potential
Technical Analysis for Options Trading. Fidelity Brokerage Services LLC, Member NYSE, SIPC, 900 Salem Street, Smithfield, RI
 Technical Analysis for Options Trading Fidelity Brokerage Services LLC, Member NYSE, SIPC, 900 Salem Street, Smithfield, RI 02917 747561.2.0 Disclosures Options trading entails significant risk and is
Icoachtrader Consulting Service WELCOME TO. Trading Boot Camp. Day 5
 Icoachtrader Consulting Service www.icoachtrader.weebly.com WELCOME TO Trading Boot Camp Day 5 David Ha Ngo Trading Coach Phone: 1.650.899.1088 Email: icoachtrader@gmail.com The information presented is
Scalp Trading Strategies
 Scalp Trading Strategies Services Disclaimer (for full disclosure, see Disclaimers section of website) Information Contained within our website and affiliates is not a substitute for professional advice
Three Techniques for Spotting Market Twists and Turns. Riding the Roller
 Three Techniques for Spotting Market Twists and Turns Riding the Roller Coaster Learn to Spot the Twists and Turns Whether you re new to forex or you ve been trading a while, you know how the unexpected
10-Year Treasury Notes ($UST Price)
") 1 Weekly Inter-market Technical Report 10-Year Treasury Notes ($UST Price) Monthly The 10-Year Note has developed a clear rising parallel trend channel that reaches now to the $128 level with confluence
1 Weekly Inter-market Technical Report 10-Year Treasury Notes ($UST Price) Monthly The 10-Year Note has developed a clear rising parallel trend channel that reaches now to the $128 level with confluence
IronFX. technical indicators
 IronFX technical indicators Average Directional Index (ADX) The Average Directional Index (ADX) helps traders see if a trend is developing in the charts and whether the trend is strengthening or weakening.
Intra-Day Trading Techniques
 Pristine.com Presents Intra-Day Trading Techniques With Greg Capra Co-Founder of Pristine.com, and Co-Author of the best selling book, Tools and Tactics for the Master Day Trader Copyright 2001, Pristine
Class 7: Moving Averages & Indicators. Quick Review
 Today s Class Moving Averages Class 7: Moving Averages & Indicators 3 Key Ways to use Moving Averages Intro To Indicators 2 Indicators Strength of Lines Quick Review Great for establishing point of Support
presented by Thomas Wood MicroQuant SM Divergence Trading Workshop Day One Bond Trading Success
 presented by Thomas Wood MicroQuant SM Divergence Trading Workshop Day One Bond Trading Success Risk Disclaimer Trading or investing carries a high level of risk, and is not suitable for all persons. Before
An informative reference for John Carter's commonly used trading indicators.
 An informative reference for John Carter's commonly used trading indicators. At Simpler Options Stocks you will see a handful of proprietary indicators on John Carter s charts. This purpose of this guide
Chapter 2.3. Technical Analysis: Technical Indicators
 Chapter 2.3 Technical Analysis: Technical Indicators 0 TECHNICAL ANALYSIS: TECHNICAL INDICATORS Charts always have a story to tell. However, from time to time those charts may be speaking a language you
The Avalanche (Reverse for a Phoenix )
") The Avalanche (Reverse for a Phoenix ) The 6 Building Blocks of Price Development (Ideal Scenario): Momentum: Above average pace on the reversal from highs, followed by slower than average upside as support
The Avalanche (Reverse for a Phoenix ) The 6 Building Blocks of Price Development (Ideal Scenario): Momentum: Above average pace on the reversal from highs, followed by slower than average upside as support
Your FREE Strategy...
 Your FREE Strategy... 1 Disclaimer This report is designed to provide helpful advice regarding the subject matter(s) covered. The author and distributors do not engage in the practice of providing legal
Strong 1 Strategy. Remember - for examples of current trades using this strategy see Jim s Chart Book as well as our Premium Alert Service Videos.
 Strong 1 Strategy GOAL To find the closest-to-the-money option we can afford on the first day that a particular market s Trend Seeker Trend on US Charts Online s Trend Seeker feature changes to either
 1 www.candlecharts.com 2 BONUS www. candlecharts.com/special/swing-trading-2/ 3 www. candlecharts.com/special/swing-trading-2/ 4 www. candlecharts.com/special/swing-trading-2/ 5 www. candlecharts.com/special/swing-trading-2/
Chapter 3. Price Action
 Chapter 3 Price Action The movement of price in any market is called Price Action. This movement is caused by the beliefs and trading systems of hundreds of thousands of worldwide traders that the market
6 TRADE SETUPS YOU CAN START USING RIGHT NOW. includes: Ryan's top charting patterns
 6 TRADE SETUPS YOU CAN START USING RIGHT NOW includes: Ryan's top charting patterns SharePlanner's Top Setups for TRADING LONG & SHORT Far too often we clutter our trading strategy with hundreds of different
Technical Analysis and Charting Part II Having an education is one thing, being educated is another.
 Chapter 7 Technical Analysis and Charting Part II Having an education is one thing, being educated is another. Technical analysis is a very broad topic in trading. There are many methods, indicators, and
Sunny s Dynamic Moving Average
 20120510 Sunny s Dynamic Moving Average SunnyBands Today We Will Compare and Contrast Simple Moving Averages Exponential Moving Averages Bollinger Bands Keltner Channels SunnyBands Introduction After 30
Stacking Indicators Getting a GREAT entry! TWEEZERS Tweezer top/bottom at the band The stock is trending up Gap down (against the trend) Any moving
 Any moving") Dean Storholt I am not a registered broker-dealer or investment adviser. I will mention that I consider certain securities or positions to be good candidates for the types of strategies we are discussing
Dean Storholt I am not a registered broker-dealer or investment adviser. I will mention that I consider certain securities or positions to be good candidates for the types of strategies we are discussing
Coaching Session FIVE
 Coaching Session FIVE Coaching Session FIVE Counter-Trend Trade Set-Ups Program Summary Trading Plan Execution The Master Trader Powerful Price Pattern Trades Trade Management Initial Trend Entry Trading
RISK DISCLOSURE STATEMENT / DISCLAIMER AGREEMENT
 RISK DISCLOSURE STATEMENT / DISCLAIMER AGREEMENT Trading any financial market involves risk. This report and all and any of its contents are neither a solicitation nor an offer to Buy/Sell any financial
Trading Essentials Framework Market Foundation & Building Blocks
 Trading Essentials Framework Market Foundation & Building Blocks Trading Concepts, Inc. Trading Essentials Framework Market Foundation & Building Blocks By Todd Mitchell Copyright 2014 by Trading Concepts,
 This material is protected under the Digital Millennium Copyright Act of 1998 and various international treaties. This material may not be replicated and redistributed. You may make one or more copies
How I Trade Profitably Every Single Month without Fail
 How I Trade Profitably Every Single Month without Fail First of all, let me take some time to introduce myself to you. I am Koon Hwee (KH Lee) and I am a full time currency trader. I have a passion for
A moving average line is just that. It smoothes price over time, reducing erratic, shorter-term swings to
 Volume-adjusted moving averages by Richard W. Arms Jr. A moving average line is just that. It smoothes price over time, reducing erratic, shorter-term swings to a smoother, more comprehensible line. Any
Of Option Trading PRESENTED BY: DENNIS W. WILBORN
 Of Option Trading PRESENTED BY: DENNIS W. WILBORN Disclaimer U.S. GOVERNMENT REQUIRED DISCLAIMER COMMODITY FUTURES TRADING COMMISSION FUTURES AND OPTIONS TRADING HAS LARGE POTENTIAL REWARDS, BUT ALSO LARGE
How To Read Charts Like A Pro Your guide to reading stock charts!
 How To Read Charts Like A Pro Your guide to reading stock charts! Courtesy of Swing-Trade-Stocks.com You may distribute this book FREELY or use it as part of a commercial package as long as this page and
Intelligent Investing, LLC Major Indices Daily Update 02/28/ 19
 Elliot Wave Updates Today the S&P500 was stuck in a less than 6p range. So there s really not much we can learn. All parameters remain the same a step 2: A move below SPX2764.55 (last Thursday s low) will