Sunny s Dynamic Moving Average
|
|
|
- Amber Chapman
- 5 years ago
- Views:
Transcription


1

2 Sunny s Dynamic Moving Average
3 SunnyBands
4 Today We Will Compare and Contrast Simple Moving Averages Exponential Moving Averages Bollinger Bands Keltner Channels SunnyBands
5 Introduction After 30 years of trading and research, Sunny Harris has developed many strategies both for herself and for clients. More important than developing the strategies, Sunny has developed testing methodologies that have stood the test of time, and have become the defacto standard in the trading community. In this webinar Sunny will share some of her more profitable trading concepts, and some of her proprietary trading indicators.
6 My Credentials Sunny J. Harris BA, MS, PhD Mathematics Trading since 1981 (30 years) #1 Rated trader by Stark Research 1993 & 1994 (365% & 178%) Research: Programming & Testing since 1981 Teaching others to trade since 1986

7 Books I Have Written: Trading 101 How to Trade Like a Pro Trading 102 Getting Down to Business Electronic Day Trading 101 Getting Started in Trading TradeStation Made Easy! Working on Grading the Gurus and more after that
8 More about Me For a list of appearances, past and present and a list of published articles, click here to go to then click on Seminars and then Editorial
9 Now for the Good Stuff How to make money trading The Steps The Indicators The Strategy
10 Setting Your Goals Not everyone can trade the same system. What s good for the goose, is not necessarily good for the gander. I might like 1-minute bars, and you might like Daily bars. You might like 15-minute bars, and I might like Weekly bars. Your system MUST be configured for YOUR personality.
11 How do you find your Time Frame? Before finding the right time frame, you must first find the right instrument Bonds have a rhythm of 45-minute swings, while the emini has a rhythm of 15-minute swings. Currencies swing on a daily chart. Mutual funds swing on a weekly chart. You must find the right rhythm

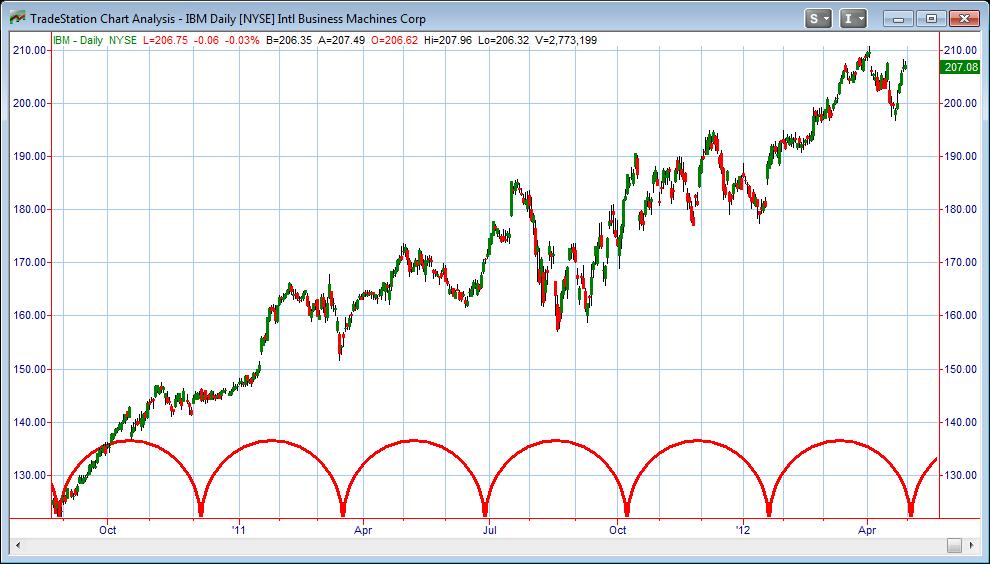
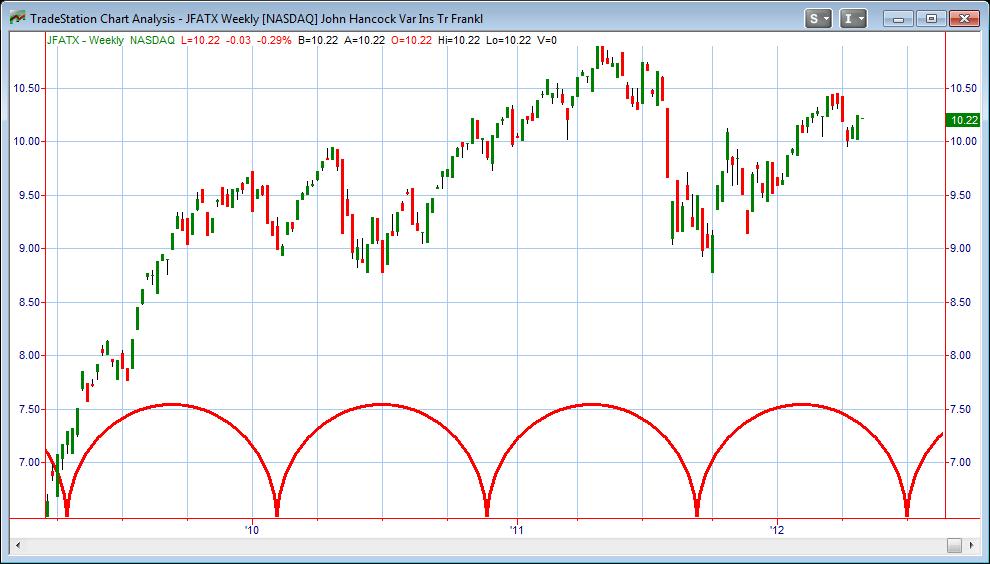
12 Different Rhythms
13 Finding the Right Symbol Don t tell the market what you want to trade. Let the market tell you where the money is. Start with screening the larger markets Dow 30 Nasdaq 100 S&P 500 Russell 2000
14 Doing both in Conjunction At the same time you query the universe of symbols, you must still keep in mind the Time Frame. At the same time you consider Time Frame, you must still consider your own personality. For instance, I have clients who: want only to trade in the first 2 hours only want to trade near the close want to place a trade and walk away want to do Mutual Fund switching
15 Everything at Once You must consider Time Frame Time Constraints Universe of Symbols You must ask yourself: Where is the money? Where is the action?

16 Start With Scanning the Universe of Symbols on a Daily Basis RadarScreen setup:

17 Another PHW Scan S&P 500 Sorted w Highest PHW on top PHW Tells You What?
18 What Does PHW Tell You? PHW stands for Potential Hourly Wage It is for you to evaluate whether you could make more money trading or working at McDonalds. It only makes sense to trade if you can make money doing it Some people trade for the challenge Some people trade for the excitement These people lose money
19 A Stock with a Low PHW S: Sprint Nextel Corp

20 A Stock with a High PHW GOOG: Google
21 Then pick a stock you can afford Filter by Price and by Volume (RS) ~ ~ IF Close >= j_pricebottom THEN BEGIN AND Close <= j_pricetop AND V >= j_volmin Plot1( Close, "Price", white) ; SetPlotBGColor(1,OKColor); Plot2( Volume, "Volume", white) ; SetPlotBGColor(2,OKColor); END; If Close < j_pricebottom OR Close > j_pricetop AND V < j_volmin THEN BEGIN Plot1( Close, "Price", white) ; SetPlotBGColor(1,BadColor); Plot2( Volume, "Volume", white) ; SetPlotBGColor(2,BadColor); END;

22 Filter by Price & Volume Blue areas meet our criteria:
23 Setting up the Filter Put in the Symbol Lists Insert the PHW Indicator Sort PHW from Highest to Lowest Select symbols within your price filter that have the highest PHWs
")
24 Filter PLUS PHW Qualifying stock must meet both filters (High PHW and blue)
25 How Much Is Enough? How Do You Know Whether Your Test Generates Enough Profit? What is Possible? Should your chart generate $500, $5,000, $50,000 or $100,000 or $500,000? You better know this before you begin Don t just trade something because you feel like it
26 How Much Is Enough? That problem always perplexed me Until I invented an indicator to tell me On any chart, any time frame, any symbol Here s how it looks on a chart:

27 PHW Indicator at 0.01
28 How Much Is Enough? This is one of the most important indicators in all of my work For 2 reasons 1. How Much Is Enough? 2. Does My System Match the Dots?
29 PHW Indicator at 0.02
30 To see how much is enough: Give the chart space to the right Read the data on the right hand edge
31 Now that you ve found your Symbol How shall you Analyze It? Simple Moving Average Exponential Moving Average Bollinger Bands Keltner Channels SunnyBands

32 Simple Moving Average
33 Exponential Moving Average

34 Bollinger Bands

35 Keltner Channel
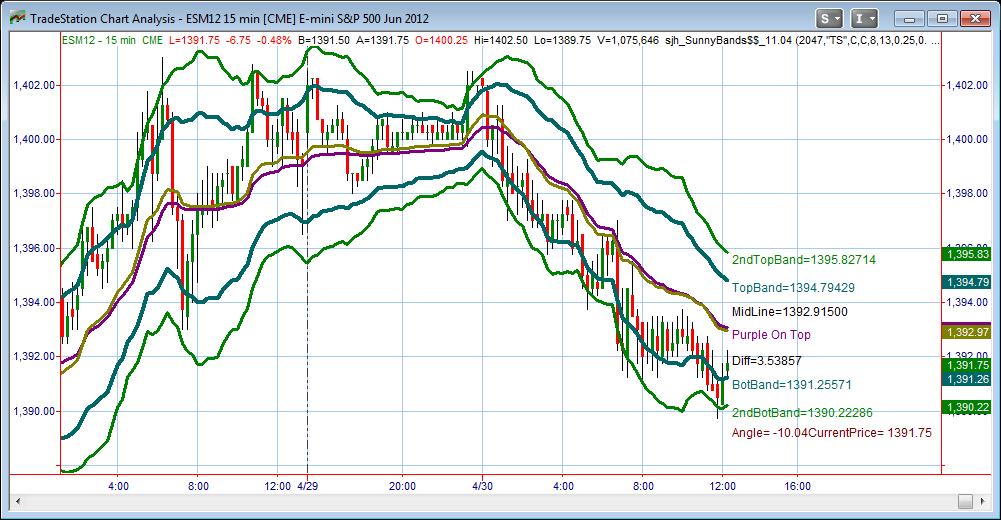
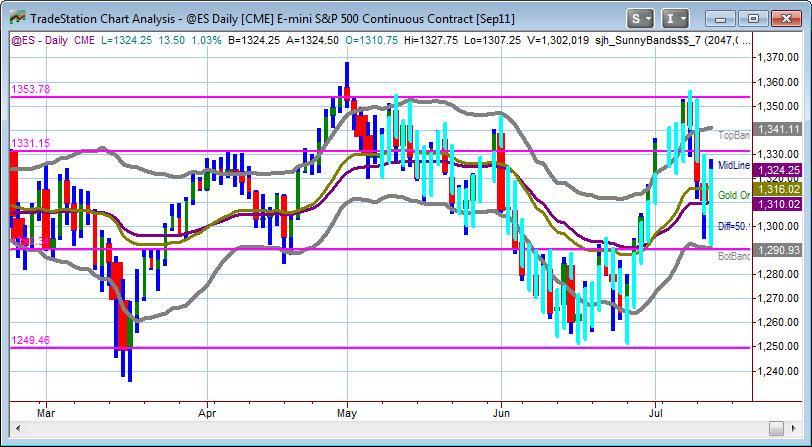
36 SunnyBands
37 Now that you ve found your Symbol Put SunnyBands on the chart Tailor the settings

38 Tailor the Settings Password Value OHLC OHLC FastDMA Length SlowDMA Length Fast Smoothing Factor Slow Smoothing Factor Color of Fast Line Color of Slow Line ATR Distance to Top Band ATR Distance to Bottom Band Thickness of Top Band Thickness of Bottom Band Thickness of Fast DMA Thickness of Slow DMA Password Text Precision of Calculations Return Value: do not change
39 Different Band ATRs: 2.0

40 Different Band ATRs: 1.5
41 Different Band ATRs: 1.2

42 Different Band ATRs: 1.0

43 Different Band ATRs: 1.2 w 2.0
44 ABA: Always Be Asking What Is True? What Is Happening? How Far is the Current Market Moving? What Happens When the Band is Touched? What Happens if the DMA is Moving Sideways? What Happens If the 15-min is Signaling Short While the 1-min Signals Long?

45 If There s Only a Dollar TAKE IT! Don t try to tell the Market where to go. What s the Diff?

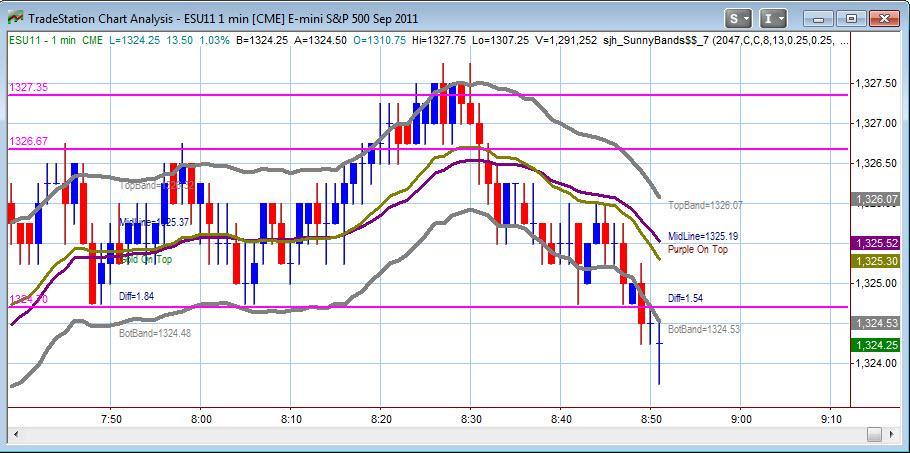
46 Read the SunnyBands Values From the Right Hand Edge
47 SunnyBands on Any TimeFrame 1 Minute

48 SunnyBands on Any TimeFrame 5 Minute

49 SunnyBands on Any TimeFrame 15 Minute

50 SunnyBands on Any TimeFrame 30 Minute

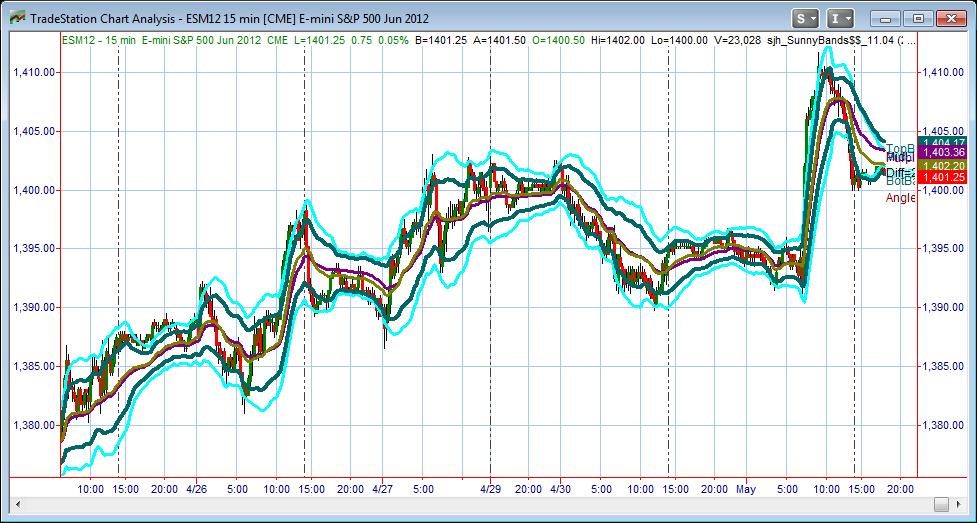
51 SunnyBands Combined w DMA


52 Take Signal from Longer, Entry from Shorter time frame SunnyBands

53 Bands Over Bands
54 What Are My Rules? 1. Take 1 st Clue from VP-Prediction 2. Take Setup from 15-min and 30-min Charts 3. Take Entries from 1-min and 5-min Charts 4. Enter Long when LT chart is red/magenta & below lower SunnyBand, and ST chart is also red and below lower SunnyBand 5. Take Profit when Attractor is reached, or Upper SunnyBand on LT chart is penetrated upward and then back downward on red bar

55 VP Prediction on MoneyMentor.com
56 More of My Rules 6. When the DMA is long the bias is to the up-side. Therefore, don t expect a short trade to drop further than the midline. 7. If the DMA is flat, stay w the first entry of the flat period until the DMA finds a direction 8. If I got a short signal (blue/green going up turns to red below Band) and blue/green continues on up, reverse and go long. This will likely be strong.
57 More of My Rules 9. Opposite is true for Shorts 10.Wait for it. 11.Wait for Proof (ie move in the expected direction) 12.There is always another trade 13.Take Your Losses FAST

58 Wait for Correspondence 1 min & 5 min Charts

59 Actual Trading Day 1 minute emini S&P (ESU11)

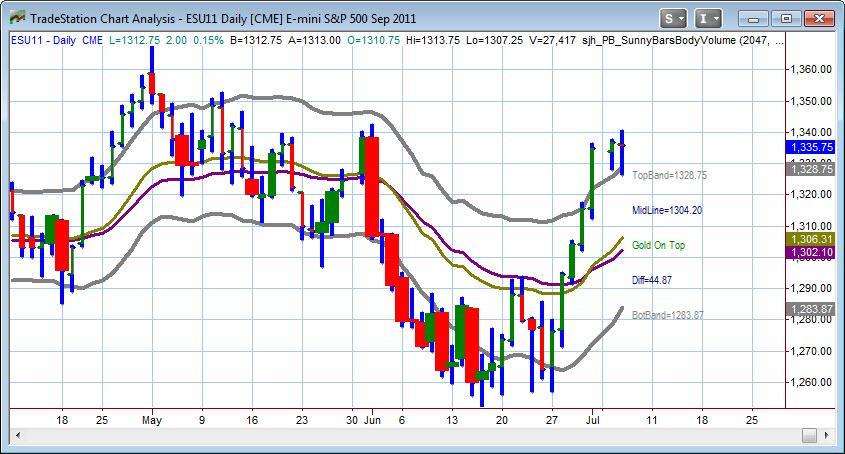
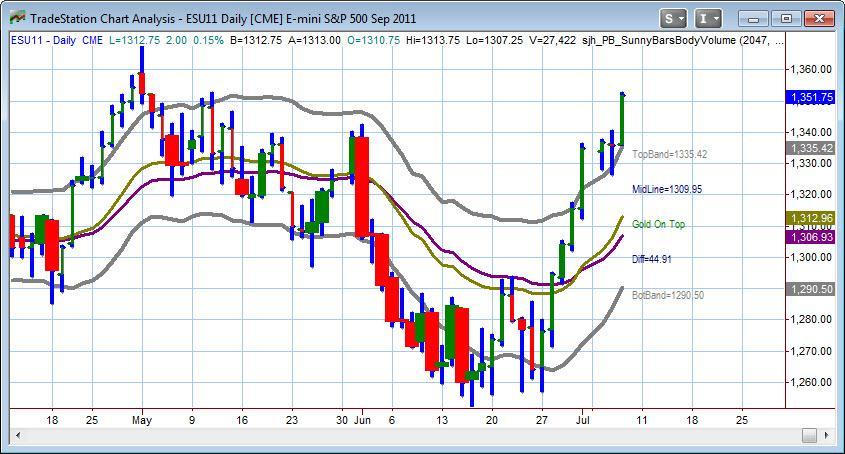
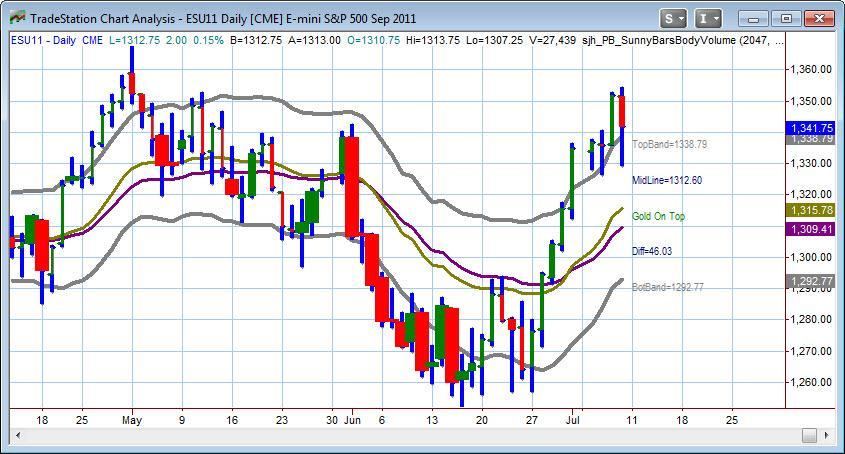
60 Actual Trading Day It takes TIME for profits to build. Larry Williams

61 Example of Strong Up Move

62 Time Sequence: July 4
63 July 5
64 July 6
65 July 7
66 July 10

67 July 11-12

68 What Are SunnyBars? Wider Bars Show Increased Volume:

69 SunnyBars: 5 min (Any Timeframe)

70 What Are SessionBars? Can be set to any Open & Close times
71 What Are Attractors? Support Resistance Pennants Moving Averages Congestion Areas Draw them & set Alerts
72 Attractors (1 min):
73 Attractors (Daily)

74 Pennants as Attractors

75 Where s the Market Going? Daily Dow

76 Where s the Market Going? Monthly Dow 14,000

77 and Don t Forget
78 That s IT, in a NutShell For more information, or For consulting or tutoring Call me at (760) , or Skype (760) Fax (760) me at: sunnyharris@moneymentor.com And visit QUESTIONS?
79 Special for Attendees of Webinar For all those who attended the 6/8/12 TradeStation Booth presentation I offer the following: All of my products (except the book) at 50% OFF the prices listed on my website ( until 6/31/12. Thanks to all who attended. Remember that I m happy to accept phone calls: (760) PST. Call me & we will set up a tailored mentoring/coaching program.
BUY SELL PRO. Improve Profitability & Reduce Risk with BUY SELL Pro. Ultimate BUY SELL Indicator for All Time Frames
 BUY SELL PRO Improve Profitability & Reduce Risk with BUY SELL Pro Ultimate BUY SELL Indicator for All Time Frames Risk Disclosure DISCLAIMER: Crypto, futures, stocks and options trading involves substantial
SIMPLE SCAN FOR STOCKS: FINDING BUY AND SELL SIGNALS
 : The Simple Scan is The Wizard s easiest tool for investing in stocks. If you re new to investing or only have a little experience, the Simple Scan is ideal for you. This tutorial will cover how to find
FOREX INDICATORS. THEIR PRIORITY and USE
 FOREX INDICATORS THEIR PRIORITY and USE by G. C. Smith U.S. Government Required Disclaimer Trading foreign exchange markets on margin carries a high level of risk, and may not be suitable for all investors.
Bollinger Bands Forex Trading Strategy With 20 Period Moving Average
 Bollinger Bands Forex Trading Strategy With 20 Period Moving Average The bollinger bands forex trading strategy with 20 period moving average is a very simple forex strategy that works very well for all
OSCILLATORS. TradeSmart Education Center
 OSCILLATORS TradeSmart Education Center TABLE OF CONTENTS Oscillators Bollinger Bands... Commodity Channel Index.. Fast Stochastic... KST (Short term, Intermediate term, Long term) MACD... Momentum Relative
Find Elusive MACD Divergences Easily
 Find Elusive MACD Divergences Easily By using a Custom TradeStation Workspace After following these instructions, you will have Charts displaying MACD lines and histogram which highlight price/indicator
MULTI-TIMEFRAME TREND TRADING
 1. SYNOPSIS The system described is a trend-following system on a slow timeframe that uses optimized (that is, contrarian) entries and exits on a fast timeframe at the tops and bottoms of retraces against
Expert Trend Locator. The Need for XTL. The Theory Behind XTL
 Chapter 20 C H A P T E R 20 The Need for XTL esignal does an excellent job in identifying Elliott Wave counts. When combined with studies such as the Profit Taking Index, Wave Four Channels, Trend Channels
Stay on the Right Side & Finishing the Year Strong! From the Active Trend Trader
 Stay on the Right Side & Finishing the Year Strong! From the Active Trend Trader Disclaimer U.S. GOVERNMENT REQUIRED DISCLAIMER COMMODITY FUTURES TRADING COMMISSION FUTURES AND OPTIONS TRADING HAS LARGE
I Always Come Back To This One Method
 I Always Come Back To This One Method I can attribute my largest and most consistent gains to this very method of trading, It always work and never fails although I ve been known to still screw it up once
ORIGINALLY APPEARED IN ACTIVE TRADER M AGAZINE
 ORIGINALLY APPEARED IN ACTIVE TRADER M AGAZINE FINDING TRADING STRA TEGIES FOR TOUGH MAR KETS (AKA TRADING DIFFICULT MARKETS) BY SUNNY J. HARRIS In order to address the subject of difficult markets, we
Tommy s Revenge 2.0 Module 2 Part 2
 1 Mark Deaton here with your follow-up to Module 2. Going to cover a few things in this video and try to keep it short and sweet. We re going to look at Stock Fetcher and how we can use Stock Fetcher to
Scalping Strategy Public Version
 < < < < < tradeguider SHARP SHOOTER Wyckoff / Volume Spread Analysis Scalping Strategy Public Version Written By Gavin Holmes Head Trader Wyckoff / Williams Investment Portfolio Author Trading in the Shadow
BY JIM PRINCE
 No part of this publication may be reproduced, stored in a retrieval system, or transmitted in any form or by any means electronic, mechanical, photocopying, recording, or otherwise without the prior permission
Forexsignal30 Extreme ver. 2 Tutorials
 Forexsignal30 Extreme ver. 2 Tutorials Forexsignal30.com is a manual trading system that is composed of several indicators that mutually cooperate with each other. Very difficult to find indicators that
Thanks for Checking out The Parabolic SAR Trading Strategy Report that we have developed for you to learn and apply to your trading system..
 Thanks for Checking out The Parabolic SAR Trading Strategy Report that we have developed for you to learn and apply to your trading system.. This Trading Strategy will teach you how to catch new trends
ValueCharts for Sierra Chart
 ValueCharts for Sierra Chart Contents: What are ValueCharts? What are ValueAlerts SM? What are ValueBars SM? What are ValueLevels SM? What are ValueFlags SM? What are SignalBars SM? What is MQ Cycle Finder?
FOREX PROFITABILITY CODE
 FOREX PROFITABILITY CODE Forex Secret Protocol Published by Old Tree Publishing CC Suite 509, Private Bag X503 Northway, 4065, KZN, ZA www.oldtreepublishing.com Copyright 2013 by Old Tree Publishing CC,
An informative reference for John Carter's commonly used trading indicators.
 An informative reference for John Carter's commonly used trading indicators. At Simpler Options Stocks you will see a handful of proprietary indicators on John Carter s charts. This purpose of this guide
Advanced Trading Systems Collection MACD DIVERGENCE FOREX TRADING SYSTEM
 MACD DIVERGENCE FOREX TRADING SYSTEM 1 This system will cover the MACD divergence. With this forex trading system you can trade any currency pair (I suggest EUR/USD and GBD/USD when you start), and you
Ken Alison -BinaryTriumph 2016, All Rights Reserved.
 Introduction Hello Trader, I would like to say a very big thank you for downloading this Ebook, am glad you made it here even If you got it free or you bought it for $199, because the information contained
StockFinder Workbook. Fast and flexible sorting and rule-based scanning. Charting with the largest selection of indicators available
 StockFinder Workbook revised Apr 23, 2009 Charting with the largest selection of indicators available Fast and flexible sorting and rule-based scanning Everything you need to make your own decisions StockFinder
4 Keys to Trend Trading Tech Analysis. There is no Holy Grail of Trading Only Tools & Rules
 4 Keys to Trend Trading Tech Analysis There is no Holy Grail of Trading Only Tools & Rules Disclaimer U.S. GOVERNMENT REQUIRED DISCLAIMER COMMODITY FUTURES TRADING COMMISSION FUTURES AND OPTIONS TRADING
Harness the Super Powers for Super Profits!
 Attention ALL VisualTrader Owners: VisualTrader 7 Harness the Super Powers for Super Profits! The Game Changing Features you ve been waiting for! See page 2 Featuring: Multiple Timeframe Confi rmation!
Understanding Oscillators & Indicators March 4, Clarify, Simplify & Multiply
 Understanding Oscillators & Indicators March 4, 2015 Clarify, Simplify & Multiply Disclaimer U.S. Government Required Disclaimer Commodity Futures Trading Commission Futures and Options trading has large
NetPicks Keltner Bells
 Page 1 NetPicks Keltner Bells NetPicks, LLC HYPOTHETICAL PERFORMANCE RESULTS HAVE MANY INHERENT LIMITATIONS, SOME OF WHICH ARE DESCRIBED BELOW. NO REPRESENTATION IS BEING MADE THAT ANY TRADING ACCOUNT
Is This Type of Stock Market For You? - Mike Swanson
 Stock Market Barometer Quote of the month: Investors should recognize that Euroland s problems are global and secular in nature; it will be years before Euroland and developed nations in total can constructively
Chapter 3. Price Action
 Chapter 3 Price Action The movement of price in any market is called Price Action. This movement is caused by the beliefs and trading systems of hundreds of thousands of worldwide traders that the market
Subject: Daily report explanatory notes, page 2 Version: 0.9 Date: Dec 29, 2013 Author: Ken Long
 Subject: Daily report explanatory notes, page 2 Version: 0.9 Date: Dec 29, 2013 Author: Ken Long Description Example from Dec 23, 2013 1. Market Classification: o Shows market condition in one of 9 conditions,
Covert Code. (previously known as Currency Messenger System 1)
") Covert Code (previously known as Currency Messenger System 1) COVERT CODE INDICATORS Covert Code uses 5 different indicators Mes Signal 1 Indicator which gives you buy and sell arrow signal on the screen.
Covert Code (previously known as Currency Messenger System 1) COVERT CODE INDICATORS Covert Code uses 5 different indicators Mes Signal 1 Indicator which gives you buy and sell arrow signal on the screen.
The Master Trader Counter-Trend Trade Set-Ups
 The Master Trader Counter-Trend Trade Set-Ups Trading Concepts, Inc. The Master Trader Counter-Trend Trade Set-Ups By Todd Mitchell Copyright 2014 by Trading Concepts, Inc. All Rights Reserved This training
Poseidon FX System (previously known as Currency Messenger System 2) Poseidon system indicators:
 Poseidon system indicators:") Poseidon FX System (previously known as Currency Messenger System 2) Poseidon system indicators: It uses 5 different indicators Mes Signal 2 Indicator which gives you buy and sell arrow signal on the screen.
Poseidon FX System (previously known as Currency Messenger System 2) Poseidon system indicators: It uses 5 different indicators Mes Signal 2 Indicator which gives you buy and sell arrow signal on the screen.
Walter Bressert, Inc.
 Walter Bressert, Inc. http://www.walterbressert.com mailto:info@walterbressert.com Copyright Walter Bressert, Inc. All rights reserved. 1 PROFITTRADER for METASTOCK END-OF-DAY AND INTRA VERSIONS The EOD
Presents FOREX ALPHA CODE
 Presents FOREX ALPHA CODE Forex Alpha Code Published by Alaziac Trading CC Suite 509, Private Bag X503 Northway, 4065, KZN, ZA www.tradeology.com Copyright 2014 by Alaziac Trading CC, KZN, ZA Reproduction
With that, let s dive into the steps. Step 1 Identify range bound markets on Daily or 4 Hour Charts
 If you have been trading for any length of time, you have probably noticed that the markets are moving sideways A LOT. Consolidation is a huge part of the market s balance and so it makes sense to learn
This is the complete: Fibonacci Golden Zone Strategy Guide
 This is the complete: Fibonacci Golden Zone Strategy Guide In this strategy report, we are going to share with you a simple Fibonacci Trading Strategy that uses the golden ratio which is a special mathematical
USER GUIDE. How To Get The Most Out Of Your Daily Cryptocurrency Trading Signals
 USER GUIDE How To Get The Most Out Of Your Daily Cryptocurrency Trading Signals Getting Started Thank you for subscribing to Signal Profits daily crypto trading signals. If you haven t already, make sure
Figure 3.6 Swing High
 Swing Highs and Lows A swing high is simply any turning point where rising price changes to falling price. I define a swing high (SH) as a price bar high, preceded by two lower highs (LH) and followed
Volume And Divergence
 The Trader s Bread And Butter Volume And Divergence Here s how you can use a divergence between price and volume for trading forex futures or exchange traded funds. T by Gail Mercer he first time I looked
Forex Lines Tutorial of Forex Lines 2014 indicators.
 Forex Lines 2014 Tutorial of Forex Lines 2014 indicators www.forex4live.com Forex Lines 2014 Tutorial We expected that many traders would be using extremely complicated systems, algorithms and indicators.
Presents. SPY the MARKET. With. Bill Corcoran
 Presents SPY the MARKET With Bill Corcoran I am not a registered broker-dealer or investment adviser. I will mention that I consider certain securities or positions to be good candidates for the types
Prime Trade Select 3-Step Process
 July 2 nd 2013 Note: This newsletter includes some trading ideas following Chuck Hughes trading strategies along with educational information. For a complete listing of Chuck s exact trades, including
Intraday Multi-View Suite (IMV) For Stocks and Futures
 For Stocks and Futures") Intraday Multi-View Suite (IMV) For Stocks and Futures Release Notes Thank you for purchasing the PowerZone Trading IMV custom indicator suite for TradeStation. The following notes are intended to act
Intraday Multi-View Suite (IMV) For Stocks and Futures Release Notes Thank you for purchasing the PowerZone Trading IMV custom indicator suite for TradeStation. The following notes are intended to act
Relative Rotation Graphs (RRG Charts)
") Relative Rotation Graphs (RRG Charts) Introduction Relative Rotation Graphs or RRGs, as they are commonly called, are a unique visualization tool for relative strength analysis. Chartists can use RRGs
Relative Rotation Graphs (RRG Charts) Introduction Relative Rotation Graphs or RRGs, as they are commonly called, are a unique visualization tool for relative strength analysis. Chartists can use RRGs
charts to also be in the overbought area before taking the trade. If I took the trade right away, you can see on the M1 chart stochastics that the
 When you get the signal, you first want to pull up the chart for that pair and time frame of the signal in the Web Analyzer. First, I check to see if the candles are near the outer edge of the Bollinger
How to Build your Trading Watchlist Table of Contents
 Table of Contents Risk Warning... 1 We ve All Been There... 2 Why Do you Need a watchlist?... 2 Starting Where you Have an Edge!... 2 Find the Dominant Psychology in a Pair... 3 Understanding Directional
The Launchpad Strategy
 presented by Thomas Wood MicroQuant SM Divergence Trading Workshop Day One The Launchpad Strategy Risk Disclaimer Trading or investing carries a high level of risk, and is not suitable for all persons.
Compiled by Timon Rossolimos
 Compiled by Timon Rossolimos - 2 - The Seven Best Forex Indicators -All yours! Dear new Forex trader, Everything we do in life, we do for a reason. Why have you taken time out of your day to read this
MagicBreakout Forex Trading Strategy
 Tim Trush & Julie Lavrin introduce MagicBreakout Forex Trading Strategy Your guide to financial freedom. Tim Trush, Julie Lavrin, T&J Profit Club, 2007, All rights reserved www.magicbreakout.com Table
- My 4 Favorite Trades - Essential Trades of a Professional Trader
 presented by Thomas Wood MicroQuant SM Divergence Trading Workshop Day One - My 4 Favorite Trades - Essential Trades of a Professional Trader Risk Disclaimer Trading or investing carries a high level of
Pull up the chart utilizing as much window real estate as possible.
 Darin s Trend Channel method as I understand it. I have Darin s ok as to sharing his method. So Darin if I have any of this wrong or you wish to add to it or make comments. Please feel free to make changes
Technical Analysis and Charting Part II Having an education is one thing, being educated is another.
 Chapter 7 Technical Analysis and Charting Part II Having an education is one thing, being educated is another. Technical analysis is a very broad topic in trading. There are many methods, indicators, and
2.0. Learning to Profit from Futures Trading with an Unfair Advantage! Income Generating Strategies Essential Trading Tips & Market Insights
 2.0 Learning to Profit from Futures Trading with an Unfair Advantage! Income Generating Strategies Essential Trading Tips & Market Insights Income Generating Strategies Essential Trading Tips & Market
Table of Contents. Risk Disclosure. Things we will be going over. 2 Most Common Chart Layouts Anatomy of a candlestick.
 Table of Contents Risk Disclosure Things we will be going over 2 Most Common Chart Layouts Anatomy of a candlestick Candlestick chart Anatomy of a BAR PLOT Indicators Trend-Lines Volume MACD RSI The Stochastic
Free signal generator for traders
 Free signal generator for traders Trader s Bulletin Pivot Point Trading Strategy 1. Just download the FREE tool 2. Key in a few numbers 3. And follow the simple techniques by Mark Rose To make money from
McDowell s Special Market Report Using the TradersCoach.com Software Tools
 McDowell s Special Market Report Using the TradersCoach.com Software Tools JULY 2018: Welcome to this month s Market Report! This written report is going to forecast the Dow Jones Industrial Average (hereafter
Exit Strategies for Stocks and Futures
 Exit Strategies for Stocks and Futures Presented by Charles LeBeau E-mail clebeau2@cox.net or visit the LeBeau web site at www.traderclub.com Disclaimer Each speaker at the TradeStationWorld Conference
The Cowboy Gap Fade. SFO Webinar May 18, Scott Andrews
 The Cowboy Gap Fade SFO Webinar May 18, 2010 Scott Andrews Disclaimer This material is intended for educational purposes only and is believed to be accurate, but its accuracy is not guaranteed. Trading
Trading Guidelines. Why guidelines and not rules? Because there are no rules.
 Trading Guidelines Why guidelines and not rules? Because there are no rules. 1. Everything that you see is in a gray fog. Nothing is perfectly clear. Close is close enough. If something looks like a reliable
Intraday Support and Resistance Using Volume-Weighted Average Price (VWAP)
") Issue 11 Intraday Support and Resistance Using Volume-Weighted Average Price (VWAP) Updated by Michael Burke VP, Client Education Nov. 2018 Subscription Link: https://tradestation.tradingappstore.com/products/intradayvwapwithradarscreen
Issue 11 Intraday Support and Resistance Using Volume-Weighted Average Price (VWAP) Updated by Michael Burke VP, Client Education Nov. 2018 Subscription Link: https://tradestation.tradingappstore.com/products/intradayvwapwithradarscreen
Quantitative Trading System For The E-mini S&P
 AURORA PRO Aurora Pro Automated Trading System Aurora Pro v1.11 For TradeStation 9.1 August 2015 Quantitative Trading System For The E-mini S&P By Capital Evolution LLC Aurora Pro is a quantitative trading
The Schaff Trend Cycle
 The Schaff Trend Cycle by Brian Twomey This indicator can be used with great reliability to catch moves in the currency markets. Doug Schaff, president and founder of FX Strategy, created the Schaff trend
Market Observations as of Mar 2, 2018
 Market Observations as of Mar 2, 2018 By Carl Jorgensen - For Objective Traders - For educational purposes only. Not Financial Advice. The markets were mixed this week as volatility raised its head back
MTF Volatility Squeeze Version 6.0
 MTF Volatility Squeeze Version 6.0 Description: The Multiple Time Frame Volatility Squeeze (MTFVS) indicator shows when there is a reduction in volatility that usually means that consolidation is occurring.
CHARTS. Bar Line Candlestick Charts are the basis of technical analysis They are a graphic display of price action. Notes:
 TECHNICAL ANALYSIS CHARTS Bar Line Candlestick Charts are the basis of technical analysis They are a graphic display of price action Candlestick charts have become the industry standard for technical traders.
Chapter 2.3. Technical Analysis: Technical Indicators
 Chapter 2.3 Technical Analysis: Technical Indicators 0 TECHNICAL ANALYSIS: TECHNICAL INDICATORS Charts always have a story to tell. However, from time to time those charts may be speaking a language you
From No System to a Proven System in Three Well-Defined Steps
 From No System to a Proven System in Three Well-Defined Steps The author of Trading 101 - How to Trade Like a Pro boils trading system design and analysis down to its basic components. By Sunny J. Harris
Trading Success Principles Floor Trader Pivots
 Trading Success Principles Floor Trader Pivots Trading Concepts, Inc. Trading Success Principles Floor Trader Pivots By Todd Mitchell Copyright 2014 by Trading Concepts, Inc. All Rights Reserved This training
Using Investor s Business Daily To Find Winning Stocks.
 WWW. Using Investor s Business Daily To Find Winning Stocks. This Quick-Start Guide is designed to show you how to get the most out of Investor s Business Daily s innovative features and help you become
Risk Disclosure and Liability Disclaimer:
 Risk Disclosure and Liability Disclaimer: The author and the publisher of the information contained herein are not responsible for any actions that you undertake and will not be held accountable for any
How I Trade Profitably Every Single Month without Fail
 How I Trade Profitably Every Single Month without Fail First of all, let me take some time to introduce myself to you. I am Koon Hwee (KH Lee) and I am a full time currency trader. I have a passion for
Attributes that will make me a better trader.
 Attributes that will make me a better trader. To always be prepared and be patient and thoughtful in review. Ability to operate in all conditions according to a plan. Acknowledge my emotions and not let
Using Investor s Business Daily To Find Winning Stocks.
 W W W. I N V E S T O R S. C O M YOUR QUICK-START GUIDE Using Investor s Business Daily To Find Winning Stocks. This Quick-Start Guide is designed to show you how to get the most out of Investor s Business
An Overview of the Super Stochastics MTF Indicator Page 2. The Advantages and Features of MTF Indicators Page 3
 An Overview of the Super Stochastics MTF Indicator Page 2 The Advantages and Features of MTF Indicators Page 3 The Various Methods of MTF Analysis: Unlocking New Possibilities Page 5 - Different Time Frames
THE CYCLE TRADING PATTERN MANUAL
 TIMING IS EVERYTHING And the use of time cycles can greatly improve the accuracy and success of your trading and/or system. THE CYCLE TRADING PATTERN MANUAL By Walter Bressert There is no magic oscillator
Swing Traders Edge The Systematic Swing Trading System. TradeStation Guide
 Swing Traders Edge The Systematic Swing Trading System TradeStation Guide Important Non-Disclosure: You are purchasing a single user licence which may not be transferred or resold. The information including
Buy rules: Sell rules: Strategy #2. Martingale hedging with exponential lot increase... 6
 Contents Introduction... 2 Data... 2 Short instructions on how to use Forex Tester.... 2 Sum up... 3 STRATEGIES... 3 Martingale strategies... 3 Strategy #1. Martingale Grid & Hedging... 4 Buy rules:...
Using Oscillators & Indicators Properly May 7, Clarify, Simplify & Multiply
 Using Oscillators & Indicators Properly May 7, 2016 Clarify, Simplify & Multiply Disclaimer U.S. Government Required Disclaimer Commodity Futures Trading Commission Futures and Options trading has large
MTF Volatility Squeeze Version 4.0
 MTF Volatility Squeeze Version 4.0 Description: The Multiple Time Frame Volatility Squeeze (MTFVS) indicator shows when there is a reduction in volatility that usually means that consolidation is occurring.
Qualify Your Instruments & Find High Probability Setups
 +1.888.537.0070 x 750 support@marketprofilescan.com www.marketprofilescan.com TAS knows the value of accurate and timely market generated information. Providing high probability trading setups is our business.
Convergence and Divergence
 Convergence and Divergence Momentum: The Verge of Success Momentum plays a key role in trend analysis. Trends are composed of a series of price swings. It is a trader s edge to know when a trend is slowing
VOLATILY SCALP EXPERT ADVISOR
 VOLATILY SCALP EXPERT ADVISOR EA Name =Volatily Scalp Typical =Sideway, counter trend system Creator =Chiqho Distribution=Donation Expired=Never both indicator and EA Source Code=Not Included Version =VS_EURCHF
PRICE ACTION CONTEXT
 TRADING WITH PRICE ACTION CONTEXT CHRIS CAPRE 2ndSkiesForex.com If you think this ebook is going to be about learning a price action setup, you re wrong. It ll be about something much more powerful. For
An Overview of the ZMA : The Superior Moving Average Page 2. ZMA Indicator: Infinite Flexibility and Maximum Adaptability Page 4
 An Overview of the ZMA : The Superior Moving Average Page 2 ZMA Indicator: Infinite Flexibility and Maximum Adaptability Page 4 ZMA PaintBar: Moving Average Color-Coding Page 5 Responsiveness and Inertia:
Part 2: ASX charts - more charting tools. OHLC / Bar chart
 Part 2: ASX charts - more charting tools OHLC / Bar chart A bar chart simply takes the information from the day's trading and plots that information on a single vertical 'bar'. A tab on the left side of
Chapter 2.3. Technical Indicators
 1 Chapter 2.3 Technical Indicators 0 TECHNICAL ANALYSIS: TECHNICAL INDICATORS Charts always have a story to tell. However, sometimes those charts may be speaking a language you do not understand and you
DAILY DAY TRADING PLAN
 DAILY DAY TRADING PLAN Gatherplace will be used to place all of your trades. You will be using the 5 minute chart for the trade setup and the 1 minute chart for your entry, stop and trailing stop.you will
INTRODUCTION 2 INSTALLATION AND CHART SETUP 3 BUY AND SELL ZONES 4 BBOX TICKSPEED INDICATOR 6 TRADING RULES AND CONDITIONS 7
 BLACK-BφX.COM INTRODUCTION 2 INSTALLATION AND CHART SETUP 3 BUY AND SELL ZONES 4 BBOX TICKSPEED INDICATOR 6 TRADING RULES AND CONDITIONS 7 BUY CONDITIONS 7 SELL CONDITIONS 9 IMPORTANT NOTES: 11 TAKE PROFIT
RISK DISCLOSURE STATEMENT / DISCLAIMER AGREEMENT
 RISK DISCLOSURE STATEMENT / DISCLAIMER AGREEMENT Trading any financial market involves risk. This report and all and any of its contents are neither a solicitation nor an offer to Buy/Sell any financial
PAIRS TRADING (just an introduction)
") PAIRS TRADING (just an introduction) By Rob Booker Trading involves substantial risk of loss. Past performance is not necessarily indicative of future results. You can share this ebook with anyone you
PAIRS TRADING (just an introduction) By Rob Booker Trading involves substantial risk of loss. Past performance is not necessarily indicative of future results. You can share this ebook with anyone you
The Strategies Working Best in Today s E-Mini Market
 The Strategies Working Best in Today s E-Mini Market Todd Mitchell Craig Hill Legal Disclaimer No claim is made by Trading Concepts, Inc. that the trading strategies shown here will result in profits and
Copyright 2010 Nigel, Hawkes, Hawkeye Traders Produced by Deb Donohoe, Hawkeye Traders ChartTools Sales
 Copyright 2010 Hawkeye Traders Hawkeye Traders Hawkeye Traders FATMAN! Why Do You Trade? For financial security? One thing s for sure: you don t trade to lose. Let s see if we can get you an EDGE! Each
 1 www.candlecharts.com 2 BONUS www. candlecharts.com/special/swing-trading-2/ 3 www. candlecharts.com/special/swing-trading-2/ 4 www. candlecharts.com/special/swing-trading-2/ 5 www. candlecharts.com/special/swing-trading-2/
Trading Patterns For Stocks And Commodities
 Trading Patterns For Stocks And Commodities It doesn t matter if you are a long-term investor, short swing trader or day trader, you are always looking for an advantageous spot to enter your position.
Sonic R System. This is a trend following trading system. It is based on some indicators and there is a template ready for you to download.
 Sonic R System This is a trend following trading system. It is based on some indicators and there is a template ready for you to download. Indicators Stealth LCD V10 default setting QQE MTF CCI indicator
Icoachtrader Consulting Service WELCOME TO. Trading Boot Camp. Day 5
 Icoachtrader Consulting Service www.icoachtrader.weebly.com WELCOME TO Trading Boot Camp Day 5 David Ha Ngo Trading Coach Phone: 1.650.899.1088 Email: icoachtrader@gmail.com The information presented is
I prefer to use the CCI indicator to trade divergences and it has worked well for me over the past 10 years.
 Make 100 pips Trading Divergences. There are several ways to trade divergences and several indicators that can help you identify the divergence between price and the indicator itself. I prefer to use the
Schwab Investing Insights Trading Edition Text Close Window Size: November 15, 2007
 Schwab Investing Insights Trading Edition Text Close Window Size: from TheStreet.com November 15, 2007 ON TECHNIQUES Two Indicators Are Better Than One The Relative Strength Index works well but it s better
GUIDE TO FOREX PROFITS REPORT
 GUIDE TO FOREX PROFITS REPORT CONTENTS Introduction... 3 First things first, get a demo!... 4 The Setup... 5 Indicators Explained... 8 IMACD... 8 Average Directional Movement Index... 8 The Strategy...
Chapter 24 DIVERGENCE DECISIONS
 Chapter 24 DIVERGENCE DECISIONS The subject of divergence is one that we will approach with the utmost caution. We hope we have made ourselves clear in the other volumes of this course that we have little