Infrastructure Financing Plan. Infrastructure Financing District No. 1 (Rincon Hill Area) DRAFT
|
|
|
- Estella Conley
- 5 years ago
- Views:
Transcription
1 DRAFT Infrastructure Financing Plan Infrastructure Financing District No. 1 (Rincon Hill Area) Prepared for: City and County of San Francisco Office of Economic Development Prepared by: December 2010
2 TABLE OF CONTENTS Page I. Introduction 1 II. Description of Rincon Hill Area IFD 3 III. Description of Public Facilities Required to Serve Area 5 IV. Financing Section 8 Supporting Tables 1-10 Appendix A Original Map and Legal Description of IFD Boundaries Appendix B Amended Map and Amended Legal Description of IFD Boundaries Appendix C Draft Fiscal Impact Analysis
3 DRAFT I. INTRODUCTION This Report has been prepared to serve as the Infrastructure Financing Plan for the adoption of the City and County of San Francisco Infrastructure Financing District No. 1 (Rincon Hill Area) (the IFD ). The IFD will be funded solely from a portion of the property tax increment that is distributed to the General Fund of the City and County of San Francisco. No other taxing agency will be affected. As required by Government Code Section et seq. (the IFD Law ), this Infrastructure Financing Plan contains the following information: A. A map and legal description of the proposed IFD. Pursuant to the Resolution of Intention, the Board of Supervisors approved a map of the proposed boundaries of the District; the map is attached as Appendix A. The City proposes an additional property to the District 201 Folsom and the map of the proposed amended boundaries of the District is attached as Appendix B. B. A description of the public facilities required to serve the development proposed in the area of the IFD including those to be provided by the private sector, those to be provided by governmental entities without assistance under the IFD Law, those public improvements and facilities to be financed with assistance from the proposed IFD (the public facilities required to serve the developed proposed in the area of the IFD are referred to as the Facilities ), and those to be provided jointly. The description shall include the proposed location, timing, and costs of the public improvements and facilities. C. A finding that the facilities are of communitywide significance and provide significant benefits to an area larger than the area of the IFD. D. A financing section, which shall contain all of the following information: 1. A specification of the maximum portion of the incremental tax revenue of the City and of each affected taxing entity proposed to be committed to the IFD for each year during which the IFD will receive incremental tax revenue. 2. A projection of the amount of tax revenues expected to be received by the IFD in each year during which the IFD will receive tax revenues, including an estimate of the amount of tax revenues attributable to each affected taxing entity for each year. 3. A plan for financing the Facilities, including a detailed description of any intention to incur debt. 4. A limit on the total number of dollars of taxes that may be allocated to the IFD pursuant to the plan. Page 1 \\Sf-fs1\wp\19\19061\003\ doc; 12/9/2010; jj
4 DRAFT 5. A date on which the IFD will cease to exist, by which time all tax allocation to the IFD will end. The date shall not be more than 30 years from the date on which the ordinance forming the IFD is adopted. 6. An analysis of the costs to the City of providing facilities and services to the area of the IFD while the area is being developed and after the area is developed. The plan shall also include an analysis of the tax, fee, charge, and other revenues expected to be received by the City as a result of expected development in the area of the IFD. 7. An analysis of the projected fiscal impact of the IFD and the associated development upon each affected taxing entity. Page 2 \\Sf-fs1\wp\19\19061\003\ doc; 12/9/2010; jj
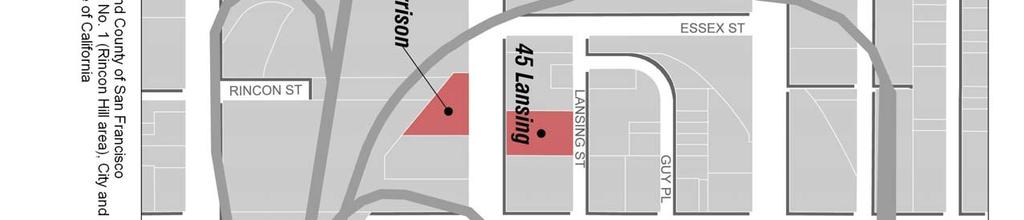
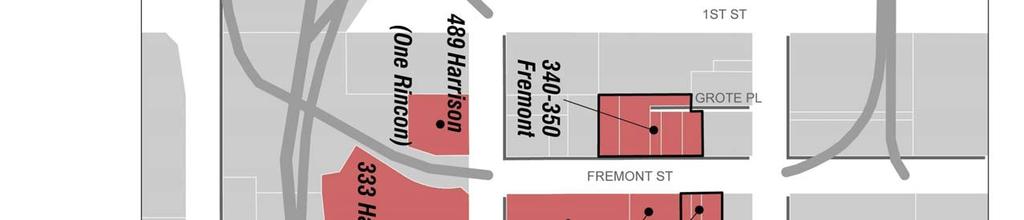
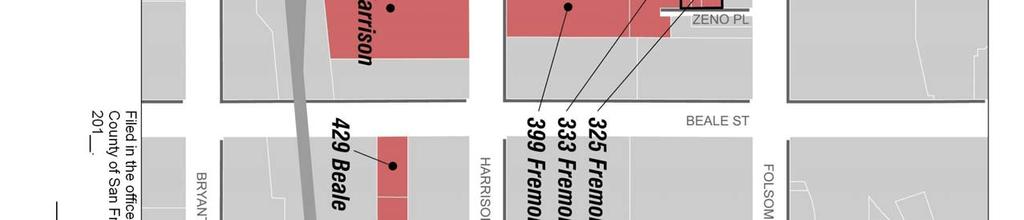
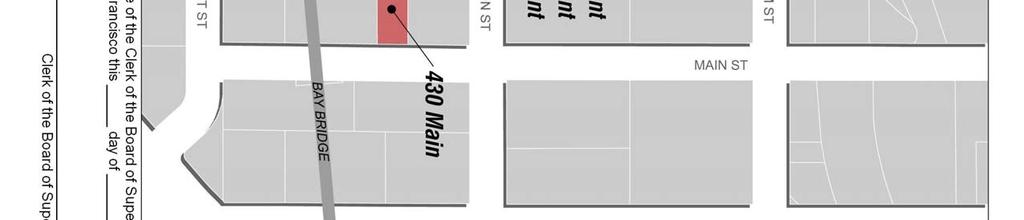
5 DRAFT II. DESCRIPTION OF RINCON HILL AREA IFD The Rincon Hill Area IFD will be comprised of ten future residential development sites. As detailed on Table 1, it is anticipated that the District will include a total of approximately 2,540 market rate residential units. The location of the sites is provided on the attached maps (Exhibits 1 and 2). The projects are in various stages of planning, with the program for 333 Harrison being the most refined at this point in time. This project is anticipated to consist of 326 residential apartment units. Construction is scheduled to start in 2011 and be complete in The scopes and timing of development of the balance of the project are more conceptual at this time. Based on information from the property owners, this analysis assumes that the other projects are for-sale condominiums, with an average per unit size of 1,000 square feet. The new developments are anticipated to be complete and fully absorbed by It is anticipated that there will be a oneyear lag between the date that each development reaches full absorption and the date that the assessed value is reflected on the tax roll. Exhibit 2 Rincon Hill IFD Private Development Development Market Rate Dwelling Units Anticipated Full Absorption Date Total Square Feet 333 Harrison St , Lansing St ,000 One Rincon, Phase II , Folsom Street , Harrison St. 1 NA NA NA 340/350 Fremont St , Fremont St , Beale/430 Main St , Fremont St , Fremont St ,000 Total 2, ,536,905 Pursuant to the Resolution of Intention, the Board of Supervisors approved a map of the proposed boundaries of the District; the map is attached as Appendix A. The City proposes an additional property to the District 201 Folsom and the map of the proposed amended boundaries of the District is attached as Appendix B. 1 This project has not yet secured the necessary entitlements for development. Given the uncertainty regarding the project s number of units and schedule, the project s potential value is not reflected in this financing plan. However, the property is part of the IFD and when the project is developed, its increment will be available to fund the IFD s public facilities. Page 3 \\Sf-fs1\wp\19\19061\003\ doc; 12/9/2010; jj
6
7 DRAFT III. DESCRIPTION OF THE FACILITIES REQUIRED TO SERVE IFD Based on the information available to the City as of the date of this Infrastructure Financing Plan and subject to change, the following is a description of the Facilities required to serve the development proposed in the Rincon Hill Area IFD. A. The Facilities to be provided by the private sector As part of the City s normal process for approving construction of each of the nine private development projects included within the boundaries of the proposed IFD, each project sponsor must submit a variety of permit applications to the City prior to commencement of construction their respective projects, including but not limited to building permit applications and street improvement permits. Under current law, the San Francisco Planning Code, the Public Works Code and the Subdivision Code would require all nine projects to provide a minimum level of streetscape improvements on any public right of way immediately adjacent to any of the nine development sites. To the extent that these mandatory, project-specific streetscape improvements can be timed to coincide with the more extensive (and expensive) streetscape improvements proposed to be funded by the IFD, the City will request each private developer to contribute their commercially reasonable share of any minimum code-required improvements toward the construction budget of any larger streetscape project immediately adjacent to a private development site. B. The Facilities to be provided by governmental entities without assistance under the IFD Law To the extent that the San Francisco Planning Department, the San Francisco Recreation and Parks Department or the San Francisco Department of Public Works obtain additional monies from State or Federal grant programs in the future, a portion of such funds could be allocated toward the early construction of any of the proposed Facilities without using any IFD monies. The San Francisco Recreation and Parks Department might also access funds from an existing or future local bond measure and dedicate such funds toward the capital budgets of any of the individual park projects proposed as part of the Facilities. C. The Facilities to be financed with assistance from the proposed IFD The Facilities required to serve development in the area of the IFD are summarized on Table 2. As shown, the total cost of the Facilities in current dollars is estimated at $31.9 million. Approximately $16.5 million of the costs will be funded through development impact fees, resulting in a financing gap of approximately $15.4 million to be funded by the IFD. The schedule for completing the improvements will be dictated by the availability of funds. Based on Page 5 \\Sf-fs1\wp\19\19061\003\ doc; 12/9/2010; jj
8 DRAFT the anticipated schedule of new development and the projection of available IFD increment (described in Section IV of this Infrastructure Financing Plan), it is estimated that the IFD s $15.4 million of improvements will be completed as follows: Exhibit 3 Projected Schedule of IFD Facility Funding Fiscal Year Current 2010/11 Dollars 2014/15 $5.4 million 2015/16 $0.3 million 2016/17 $9.7 million It is important to note that the actual schedule for the completion of the improvements may be longer than anticipated if the rate of development is slower than expected. The nominal costs may also be higher, reflecting annual inflation. The relative order for constructing each improvement has not yet been determined, but it is anticipated that the IFD s funds will first be used to fund a portion of the Rincon Hill Park. The Park has an estimated total development cost budget of $8 million (in current dollars). D. The Facilities to be provided jointly by the private sector and governmental entities As noted in Section III-C above, the Planning Department has projected that approximately $16.5 million of the estimated costs of the Facilities will be funded through development impact fees collected from those private development projects that lie within the Rincon Hill Area Plan boundaries and are subject to such impact fees. Of course, these impact fees will only become available if and when each of the eight projects identified within the boundaries of the Rincon Hill Plan Area commence substantial construction. To the extent that the San Francisco Planning Department or any other City agency identifies additional funds from another source beyond impact fees, they may choose to direct these monies toward augmenting the budget or completing a portion of any of the proposed Facilities listed in Table 2 in order to speed the timing of the delivery of any of the Facilities. E. Communitywide Benefits of IFD-Funded Public Facilities The IFD-funded public facilities will substantially benefit not just the immediate Rincon Hill neighborhood, but the broader South of Market area and the City as a whole. The Rincon Hill area is unique in that it contains a concentration of streets of citywide and regional importance because of its proximity to the Bay Bridge and the bridge's on- and off-ramps in the neighborhood, in addition to its immediate adjacency to the downtown, the City's major job center. Therefore, circulation and safety improvements in Rincon Hill will benefit residents and businesses of the City at large because a large percentage of city residents, workers, and Page 6 \\Sf-fs1\wp\19\19061\003\ doc; 12/9/2010; jj
9 DRAFT visitors pass through the neighborhood regularly. Further, several of the major streets in the Rincon Hill area extend further north and west through the downtown and South of Market, and the re-design of these streets is necessary to link up with planned improvements outside of the plan area that will improve citywide mobility and safety. Funding the public facilities in the Rincon Hill area will support and catalyze planned growth in this area, which has been targeted as a key part of the City to absorb future growth per the Housing Element and Downtown Plan of the General Plan due the Rincon Hill area's proximity to major transit service and job centers. Should these facilities not be funded and constructed, housing development in the Rincon Hill area will be less robust and will be a less desirable area for growth, pushing development pressures into outlying areas of the City and the region, contrary to existing local and regional policies, which would exacerbate local and regional congestion, greenhouse gas emissions, and job-housing imbalance locally and regionally. By supporting growth in Rincon Hill with necessary public infrastructure and improvements, future residents will be able to walk to work and regional transit, reducing the number people driving in the City. This overall reduction in driving, in addition to local safety improvements, will also have the effect of reducing future incidents of pedestrian injuries from car collisions and generally improve public health, thereby reducing pressures on the City's citywide public health burden. Similarly, because the Rincon Hill area is devoid of existing public open space, if the open spaces to be funded through the IFD are not created, there will be substantial new pressures on existing open spaces in neighborhoods outside of Rincon Hill by the new residents. This would cause overcrowding at existing open spaces, in addition to inducing new additional vehicle trips outside the neighborhood to travel to open spaces, which would increase congestion and exacerbate conflicts with pedestrians, cyclists, and public transit outside of Rincon Hill. Page 7 \\Sf-fs1\wp\19\19061\003\ doc; 12/9/2010; jj
10 DRAFT IV. FINANCING SECTION The financing plan delineated in this Infrastructure Financing Plan is based on the best information available regarding the scope, timing, and value of future development. However, given the time horizon for the entire IFD development and the conceptual nature of some of the planned developments, actual values may be different than the projections contained herein. Tables 3 and 4 summarize the financing plan. Table 3 presents the projection of annual IFD revenues and expenditures. Table 4 presents the projection of the IFD s bonding capacity and Table 5 presents the projection of bond debt service. Table 6 summarizes the fiscal impacts on the General Fund of the City and County of San Francisco (affected taxing entity) to be generated by the IFD properties, after the diversion of property tax increment to the IFD. The derivation of assessed value and property tax increment is presented in Tables 7 through 10. The assumptions that underpin the projection of future assessed property value are detailed in the assessment of fiscal impacts, which is provided as Appendix C. A. Maximum portion of the incremental tax revenue of each affected taxing entity proposed to be committed to the IFD for each year during which the IFD will receive incremental tax revenue The taxing agencies that provide services to the IFD properties and the distribution of property tax increment among the agencies are as follows: Exhibit 4 Distribution of 1% Property Tax Rate Among Taxing Agencies Distribution of 1% Property Tax Rate City and County General Fund 56.59% Education Revenue Augmentation Fund 25.33% San Francisco Unified School District 7.70% City and County Children s Fund 3.00% City and County Library Protection Fund 2.50% City and County Open Space Fund 2.50% San Francisco Community College Fund 1.44% Bay Area Rapid Transit District 0.63% Bay Area Air Quality Management District 0.21% County Office of Education 0.10% Total % The IFD will be funded solely from a diversion of a portion of property tax increment distributed to the General Fund. Therefore, the General Fund is the only taxing agency affected by the IFD. As shown above, the General Fund receives 56.59% of property tax increment generated by the IFD. Property tax increment is calculated by applying the 1% base Page 8 \\Sf-fs1\wp\19\19061\003\ doc; 12/9/2010; jj
11 DRAFT tax levy to incremental assessed property value. 2 Incremental assessed property value is the difference between future assessed value during any year of the IFD and the aggregate assessed value of the IFD properties as shown upon the assessment roll used in connection with the taxation of the property by the City, last equalized prior to the effective date of the ordinance adopted pursuant to Section of the IFD Law (the Ordinance ) to create the IFD ( base year ). It is anticipated that the base year will be FY 2010/11. As detailed on Table 9, the base year aggregated assessed value of the IFD properties is $142.4 million. The new development anticipated within the IFD is anticipated to be valued at $2.2 billion upon build-out (in current dollars), resulting in an estimated $2.0 billion of incremental assessed value upon buildout. The anticipated incremental assessed value, property tax increment, tax increment to the General Fund, and tax increment to the IFD are summarized below in current, uninflated dollars. Exhibit 5 Projected IFD Assessed Value and Allocation of Tax Increment to IFD Fiscal Year Incremental Assessed Value (AV) ($millions) Property Tax Increment (TI) ($ millions) General Fund Tax Increment (GF TI) before Diversion to IFD Expected Allocation of Tax Increment to IFD (IFD TI) Expected IFD TI as % of GF TI 2010/11 $0 $0 $0 $0 NA Base Year Value = $142.4 million 2011/12 $0 $0 $0 $0 NA 2012/13 $0 $0 $0 $0 NA 2013/14 $0 $0 $0 $0 NA 2014/15 $100.0 $1.0 $0.6 $ % 2015/16 $149.8 $1.5 $0.8 $ % 2016/17 $403.6 $4.0 $2.3 $1.6 71% 2017/18 $694.7 $6.9 $3.9 $1.6 41% 2018/19 $975.2 $9.8 $5.5 $1.6 29% 2019/20 $1,205.6 $12.1 $6.8 $1.6 24% 2020/21 $1,543.6 $15.4 $8.7 $1.6 18% 2021/22 $1,797.5 $18.0 $10.2 $1.6 16% 2022/23 $2,017.8 $20.2 $11.4 $1.6 14% 2023/ /41 $ $20.2 $11.5 $1.6 14% As shown, upon buildout of the IFD properties, it is anticipated that the IFD will require a relatively small portion (14%) of the General Fund s tax increment. During the early years, however, a larger diversion is needed given that only a fraction of the full buildout value and increment will be available and the desire to complete the Facilities as soon as possible. 2 While the total property tax rate is 1.164%, voter-approved overrides comprise.64%. Therefore, the taxes that are potentially available for distribution are calculated from the 1% County-wide rate. Page 9 \\Sf-fs1\wp\19\19061\003\ doc; 12/9/2010; jj
12 DRAFT Given the uncertainty of the development schedule and the desire to be able to fund the facilities even if only a portion of the projects are developed, the maximum incremental portion of the General Fund s tax increment allocation to be committed to the IFD shall be 100% for each and every year throughout the 30-year term of the IFD. But in no circumstance will the cumulative amount deposited into the IFD exceed the nominal dollar cap, which shall be set at $60.2 million. And, based on the projections, it is anticipated that only 16% of the aggregate General Fund tax increment will be deposited into the IFD over the 30 year term. B. Projection of the amount of tax revenues expected to be received by the IFD in each year during which the IFD will receive tax revenues, including an estimate of the amount of tax revenues attributable to each affected taxing entity for each year. As presented on Table 3, the anticipated tax increment to be received by the General Fund, allocated from the General Fund to the IFD and the amounts to be retained by the General Fund after the diversion to the IFD are as follows: Exhibit 7 Projection of IFD Tax Increment and Increment to be Retained by General Fund Fiscal Year General Fund Tax Increment (GF TI) before Diversion to IFD ($ millions) IFD Tax Increment (IFD TI) ($millions) Tax Increment Retained by the General Fund After Diversion to IFD ($millions) 2010/11 $0 $0 $0.0 Base Year 2011/12 $0.0 $0.0 $ /13 $0.0 $0.0 $ /14 $0.0 $0.0 $ /15 $0.6 $0.6 $ /16 $0.8 $0.8 $ /17 $2.3 $1.6 $ /18 $3.9 $1.6 $ /19 $5.5 $1.6 $ /20 $6.8 $1.6 $ /21 $8.7 $1.6 $ /22 $10.2 $1.6 $ /23 $11.4 $1.6 $ / /41 $11.5 $1.6 $9.9 Page 10 \\Sf-fs1\wp\19\19061\003\ doc; 12/9/2010; jj
13 DRAFT C. Plan for financing the Facilities, including a detailed description of any intention to incur debt The Facilities will be financed through a combination of annual tax increment revenue to the IFD (in the manner permitted by the IFD Law, including, without limitation, Section ) as well as indebtedness secured by the property tax increment to be committed to the IFD over the 30- year IFD period (a period ending no later than the 30-year anniversary of the adoption of the Ordinance). The analysis of the bonding capacity of the IFD revenue stream is presented on Table 4. As shown, it is anticipated that the IFD revenues will be sufficient to support the issuance of approximately $5.4 million of net bond proceeds in FY 2014/15, and an additional $9.7 million in 2016/17, totaling $15.1 million of net bond proceeds. Including annual tax increment deposits into the IFD that are not required to service debt, it is estimated that the IFD will fund the targeted $15.4 million of improvements by the end of FY 2016/17. Maximum annual debt service on aggregate bonded indebtedness is anticipated to total approximately $1.6 million. D. Limit on the total number of dollars of taxes that may be allocated to the IFD pursuant the plan As shown on Table 3, it is estimated that a total of $41.7 million (2010/11 dollars) of property tax increment will be allocated to the IFD over the 30-year term of the plan. This represents 16% of the total tax increment allocated to the General Fund from the IFD properties over the 30 year term. This amount is necessary to fund debt service on the bonds used to fund the $15.4 million of improvements. After providing an allowance for future inflation and a 25% contingency factor for the cost of the Facilities, it has been determined that the total nominal number of dollars of taxes to be allocated to the IFD over the 30 year plan shall not exceed $60.2 million. The IFD cash flow projection assuming these factors is presented on Table 11. E. IFD termination date The Rincon Hill Area IFD will terminate on the thirtieth anniversary of adoption of the Ordinance. F. Analysis of City service costs and revenues to be generated by the IFD properties An assessment of the annual revenue and cost impacts of the IFD properties on the City and County of San Francisco is presented in Appendix C. The findings of the analysis are summarized on Table 6. As shown on Table 6, the properties are expected to generate a significant surplus to the General Fund (net of revenues to the IFD) during each year through Page 11 \\Sf-fs1\wp\19\19061\003\ doc; 12/9/2010; jj
14 DRAFT buildout and upon buildout. Therefore, the diversion of revenues to the IFD is not anticipated to impact the City s ability to provide services to the area. Upon buildout, the IFD properties are anticipated to annually generate a net surplus of $9.4 million to the City s General Fund after the diversion to the IFD. G. Analysis of fiscal impact of IFD on each affected taxing entity The only taxing entity that is affected by the IFD is the General Fund of the City and County of San Francisco. The impacts on the General Fund are detailed in the fiscal impact analysis provided as Appendix C. As noted above, while the IFD will require a diversion of a portion of the General Fund s revenues, the diversion will not impair the General Fund s ability to provide city services to the area. As shown on Table 6, the IFD properties are anticipated to generate a significant annual surplus to the General Fund throughout the 30-year term of the IFD. Page 12 \\Sf-fs1\wp\19\19061\003\ doc; 12/9/2010; jj
15 TABLE 1 Estimated Development Program Rincon Hill Infrastructure Finance District Development Assumptions 1 Dwelling Units Start of Construction First Year of Sales 2 Average Unit Sales Per Year Full Absorption Total Sq. Ft. per Project 333 Harrison St /01/2011 n/a , Lansing St /01/ ,000 One Rincon /07/ , Folsom St /01/ , /350 Fremont St /01/ , Fremont St /01/ , Beale/430 Main St /01/ , Fremont St /01/ , Fremont St /01/ , Harrison St. 3 N/A N/A N/A N/A N/A N/A Total 2, ,536,905 1 Based on Assumptions in the Goodwin Consulting Group's Memorandum Regarding Rincon Hill Infrastructure Finance District - Tax Increment Analysis prepared for the Mayor's Office of Economic and Workforce Development. Assumptions have been confirmed by Rincon Hill property owners Harrison St. is assumed to be a rental project. Units are shown in the development timeline as all being completed and occupied the year immediately after construction is completed in This property is included in the IFD but the property is not currently entitled for residential development.
16 TABLE 2 IFD Public Facilities Construction Costs Rincon Hill Infrastructure Finance District Construction Costs 1 Estimated Impact Fee Revenues 2 Estimated Gap to Be Funded by IFD Living Streets Spear (Folsom to Harrison) $1,585,250 $819,384 $765,866 Main and Beale (Folsom to Harrison) $4,034,844 $2,085,530 $1,949,314 Main, Beale, and Spar (Harrison to Bryant) $5,924,406 $3,062,206 $2,862,200 $11,544,500 $5,967,120 $5,577,380 Other Streets First (Folsom to Harrison) $135,953 $70,271 $65,682 First (Harrison to end) $845,663 $437,106 $408,557 Fremont (Folsom to Harrison) $1,623,750 $839,284 $784,466 Harrison (Essex to First) $585,931 $302,856 $283,075 Harrison (First to Fremont) $672,938 $347,828 $325,110 Harrison (Fremont to Spear) $1,523,813 $787,628 $736,185 $5,388,048 $2,784,974 $2,603,074 Alleys Guy and Lansing $1,381,000 $713,811 $667,189 Zeno and Grote $330,563 $170,861 $159,702 $1,711,563 $884,672 $826,891 Parks Rincon Hill Park $8,494,650 $4,390,714 $4,103,936 Essex Hillside $472,050 $243,993 $228,057 Guy Place Pocket Park $4,311,500 $2,228,528 $2,082,972 $13,278,200 $6,863,234 $6,414,966 Total $31,922,311 $16,500,000 $15,422,311 1 Estimates prepared by the San Francisco Planning Department in 2005 and updated in 2009; They were peerreviewed by Webcor Construction at the request of the Mayor's Office of Economic and Workforce Development. 2 According to the Planning Department's Rincon Hill Public Improvements Gap Analysis, total expected impact fee revenue upon build out of the Plan area is approximately $16.5 million. This figure is broken down by infrastructure improvement category by assuming that 52% of each category is covered by impact fee revenue. The actual portion of costs to be funded by impact fees and the portion to be funded by the IFD for each public facility may vary from these estimates based on the availability of funds at the time of construction.
17 Table 3 IFD Cash Flow Projection Rincon Hill Infrastructure Finance District Plan Year: Calendar Year: Fiscal Year: Total Total General Fund Property Tax Increment 1 $256,594,863 $565,900 $847,490 $2,284,027 $3,931,543 $5,518,579 $6,822,212 $8,735,122 IFD Revenues % of General Fund TI Deposited into IFD 100% 100% 71% 41% 29% 24% 18% IFD Property Tax Increment $41,698,517 $565,900 $847,490 $1,611,405 $1,611,405 $1,611,405 $1,611,405 $1,611,405 IFD Net Bond Proceeds 2 $15,140,721 $5,400,619 $9,740,101 Total IFD Revenues $56,839,238 $5,966,519 $847,490 $11,351,506 $1,611,405 $1,611,405 $1,611,405 $1,611,405 IFD Expenses Public Facilities 3 ($15,422,311) ($5,400,619) ($281,590) ($9,740,101) Bond Debt Service 4 ($37,651,752) ($514,455) ($514,455) ($1,464,914) ($1,464,914) ($1,464,914) ($1,464,914) ($1,464,914) Total IFD Expenses ($53,074,063) ($5,915,074) ($796,044) ($11,205,015) ($1,464,914) ($1,464,914) ($1,464,914) ($1,464,914) Net IFD Cash Flow $3,765,175 $51,445 $51,445 $146,491 $146,491 $146,491 $146,491 $146,491 1 See Table See Table 4. 3 Public Facilities Expenditures are assumed to be incurred in proportion to the net bonding capacity and cashflow. See Table 4. 4 See Table 5.
18 Table 3 IFD Cash Flow Projection Rincon Hill Infrastructure Finance District Plan Year: Calendar Year: Fiscal Year: Total General Fund Property Tax Increment $10,171,923 $11,418,941 $11,461,063 $11,461,063 $11,461,063 $11,461,063 $11,461,063 $11,461,063 $11,461,063 $11,461,063 IFD Revenues % of General Fund TI Deposited into IFD IFD Property Tax Increment IFD Net Bond Proceeds 2 Total IFD Revenues 16% 14% 14% 14% 14% 14% 14% 14% 14% 14% $1,611,405 $1,611,405 $1,611,405 $1,611,405 $1,611,405 $1,611,405 $1,611,405 $1,611,405 $1,611,405 $1,611,405 $1,611,405 $1,611,405 $1,611,405 $1,611,405 $1,611,405 $1,611,405 $1,611,405 $1,611,405 $1,611,405 $1,611,405 IFD Expenses Public Facilities 3 Bond Debt Service 4 Total IFD Expenses ($1,464,914) ($1,464,914) ($1,464,914) ($1,464,914) ($1,464,914) ($1,464,914) ($1,464,914) ($1,464,914) ($1,464,914) ($1,464,914) ($1,464,914) ($1,464,914) ($1,464,914) ($1,464,914) ($1,464,914) ($1,464,914) ($1,464,914) ($1,464,914) ($1,464,914) ($1,464,914) Net IFD Cash Flow $146,491 $146,491 $146,491 $146,491 $146,491 $146,491 $146,491 $146,491 $146,491 $146,491 Buildout Yr. See Table 10. See Table 4. Public Facilities Expenditures are assumed to be incurred in proportion to the net bonding capacity and cashflow. See Table 4. See Table 5.
19 Table 3 IFD Cash Flow Projection Rincon Hill Infrastructure Finance District Plan Year: Calendar Year: Fiscal Year: Total General Fund Property Tax Increment $11,461,063 $11,461,063 $11,461,063 $11,461,063 $11,461,063 $11,461,063 $11,461,063 $11,461,063 $11,461,063 $11,461,063 IFD Revenues % of General Fund TI Deposited into IFD IFD Property Tax Increment IFD Net Bond Proceeds 2 Total IFD Revenues 14% 14% 14% 14% 14% 14% 14% 14% 14% 14% $1,611,405 $1,611,405 $1,611,405 $1,611,405 $1,611,405 $1,611,405 $1,611,405 $1,611,405 $1,611,405 $1,611,405 $1,611,405 $1,611,405 $1,611,405 $1,611,405 $1,611,405 $1,611,405 $1,611,405 $1,611,405 $1,611,405 $1,611,405 IFD Expenses Public Facilities 3 Bond Debt Service 4 Total IFD Expenses ($1,464,914) ($1,464,914) ($1,464,914) ($1,464,914) ($1,464,914) ($1,464,914) ($1,464,914) ($1,464,914) ($1,464,914) ($1,464,914) ($1,464,914) ($1,464,914) ($1,464,914) ($1,464,914) ($1,464,914) ($1,464,914) ($1,464,914) ($1,464,914) ($1,464,914) ($1,464,914) Net IFD Cash Flow $146,491 $146,491 $146,491 $146,491 $146,491 $146,491 $146,491 $146,491 $146,491 $146, See Table 10. See Table 4. Public Facilities Expenditures are assumed to be incurred in proportion to the net bonding capacity and cashflow. See Table 4. See Table 5.
20 Table 4 IFD Bonding Capacity Rincon Hill Infrastructure Finance District Plan Year: Calendar Year: Fiscal Year: IFD Tax Increment Total General Fund Tax Increment $565,900 $847,490 $2,284,027 $3,931,543 $5,518,579 $6,822,212 $8,735,122 Percent of General Fund TI Deposited into IFD 100% 100% 71% 41% 29% 24% 18% IFD Property Tax Increment $565,900 $847,490 $1,611,405 $1,611,405 $1,611,405 $1,611,405 $1,611,405 IFD Bonding Capacity IFD Property Tax Increment $565,900 $847,490 $1,611,405 $1,611,405 $1,611,405 $1,611,405 $1,611,405 Growth in IFD Tax Increment 1 $565,900 $281,590 $1,045,505 $0 $0 $0 $0 Net Available Bonding Capacity 2 $5,400,619 $2,656,565 $9,740,101 $0 $0 $0 $0 Projected Bonding 3 $5,400,619 $9,740,101 Cumulative Bonding $5,400,619 $5,400,619 $15,140,721 $15,140,721 $15,140,721 $15,140,721 $15,140,721 1 Growth is measured compared to the previous year in which bonds were issued. 2 Assumes 8% interest, 110% debt service coverage ratio, 4% cost of issuance, and term based on remaining term of plan. Draft underwriting terms provided by Stone and Youngberg. 3 For purposes of this projection, it has been assumed that bonds will be issued if revenues are sufficient to support a minimum of $4 million of new bond proceeds. During years with insufficient bonding capacity, annual available cash flow is assumed to be applied toward funding infrastructure costs. the allocation of facilities' costs to be funded by bonds and annual cash flow may vary from this projection. Given that it is anticipated that any IFD bonds will be privately placed, this projection provides for bonds to be issued concurrently with the realization of sufficient tax increment to service new debt. The actual timing for issuance may vary from this projection. ; ev
21 Table 4 IFD Bonding Capacity Rincon Hill Infrastructure Finance District Plan Year: Calendar Year: Fiscal Year: IFD Tax Increment Total General Fund Tax Increment Percent of General Fund TI Deposited into IFD IFD Property Tax Increment $10,171,923 $11,418,941 $11,461,063 $11,461,063 $11,461,063 $11,461,063 $11,461,063 $11,461,063 $11,461,063 $11,461,063 16% 14% 14% 14% 14% 14% 14% 14% 14% 14% $1,611,405 $1,611,405 $1,611,405 $1,611,405 $1,611,405 $1,611,405 $1,611,405 $1,611,405 $1,611,405 $1,611,405 IFD Bonding Capacity IFD Property Tax Increment Growth in IFD Tax Increment 1 Net Available Bonding Capacity 2 Projected Bonding 3 Cumulative Bonding $1,611,405 $1,611,405 $1,611,405 $1,611,405 $1,611,405 $1,611,405 $1,611,405 $1,611,405 $1,611,405 $1,611,405 $0 $0 $0 $0 $0 $0 $0 $0 $0 $0 $0 $0 $0 $0 $0 $0 $0 $0 $0 $0 $15,140,721 $15,140,721 $15,140,721 $15,140,721 $15,140,721 $15,140,721 $15,140,721 $15,140,721 $15,140,721 $15,140,721 Build Out 1 2 Growth is measured compared to the previous year in which bonds were issued. Assumes 8% interest, 110% debt service coverage ratio, 4% cost of issuance, and term based on remaining term of plan. Draft underwriting terms provided by Stone and Youngberg. For purposes of this projection, it has been assumed that bonds will be issued if revenues are sufficient to support a minimum of $4 million of new bond proceeds. During years with insufficient bonding capacity, annual available cash flow is assumed to be applied toward funding infrastructure costs. the allocation of facilities' costs to be funded by bonds and annual cash flow may vary from this projection. Given that it is anticipated that any IFD bonds will be privately placed, this projection provides for bonds to be issued concurrently with the realization of sufficient tax increment to service new debt. The actual timing for issuance may vary from this projection. 3 ; ev
22 Table 4 IFD Bonding Capacity Rincon Hill Infrastructure Finance District Plan Year: Calendar Year: Fiscal Year: IFD Tax Increment Total General Fund Tax Increment Percent of General Fund TI Deposited into IFD IFD Property Tax Increment $11,461,063 $11,461,063 $11,461,063 $11,461,063 $11,461,063 $11,461,063 $11,461,063 $11,461,063 $11,461,063 $11,461,063 14% 14% 14% 14% 14% 14% 14% 14% 14% 14% $1,611,405 $1,611,405 $1,611,405 $1,611,405 $1,611,405 $1,611,405 $1,611,405 $1,611,405 $1,611,405 $1,611,405 IFD Bonding Capacity IFD Property Tax Increment Growth in IFD Tax Increment 1 Net Available Bonding Capacity 2 Projected Bonding 3 Cumulative Bonding $1,611,405 $1,611,405 $1,611,405 $1,611,405 $1,611,405 $1,611,405 $1,611,405 $1,611,405 $1,611,405 $1,611,405 $0 $0 $0 $0 $0 $0 $0 $0 $0 $0 $0 $0 $0 $0 $0 $0 $0 $0 $0 $0 $15,140,721 $15,140,721 $15,140,721 $15,140,721 $15,140,721 $15,140,721 $15,140,721 $15,140,721 $15,140,721 $15,140, Growth is measured compared to the previous year in which bonds were issued. Assumes 8% interest, 110% debt service coverage ratio, 4% cost of issuance, and term based on remaining term of plan. Draft underwriting terms provided by Stone and Youngberg. For purposes of this projection, it has been assumed that bonds will be issued if revenues are sufficient to support a minimum of $4 million of new bond proceeds. During years with insufficient bonding capacity, annual available cash flow is assumed to be applied toward funding infrastructure costs. the allocation of facilities' costs to be funded by bonds and annual cash flow may vary from this projection. Given that it is anticipated that any IFD bonds will be privately placed, this projection provides for bonds to be issued concurrently with the realization of sufficient tax increment to service new debt. The actual timing for issuance may vary from this projection. 3 ; ev
23 Table 5 Bond Debt Service Rincon Hill Infrastructure Finance District Calendar Year: Fiscal Year: Bond Issue #1 Net Bond Proceeds 1 $5,400,619 Gross Bond Amount 2 $5,625,645 Annual Debt Service 3 ($514,455) ($514,455) ($514,455) ($514,455) ($514,455) ($514,455) ($514,455) Bond Issue #2 Net Bond Proceeds 1 $9,740,101 Gross Bond Amount 2 $10,145,939 Annual Debt Service 3 ($950,459) ($950,459) ($950,459) ($950,459) ($950,459) Aggregate Debt Service ($514,455) ($514,455) ($1,464,914) ($1,464,914) ($1,464,914) ($1,464,914) ($1,464,914) 1 See Table 3. Net of of 4% issuance costs. 2 Includes issuance costs. 3 Assumes 8% interest, 4% issuance fees. Amortized through 2040.
24 Table 5 Bond Debt Service Rincon Hill Infrastructure Finance Distr Calendar Year: Fiscal Year: Bond Issue #1 Net Bond Proceeds 1 Gross Bond Amount 2 Annual Debt Service ($514,455) ($514,455) ($514,455) ($514,455) ($514,455) ($514,455) ($514,455) ($514,455) ($514,455) ($514,455) Bond Issue #2 Net Bond Proceeds 1 Gross Bond Amount 2 Annual Debt Service 3 ($950,459) ($950,459) ($950,459) ($950,459) ($950,459) ($950,459) ($950,459) ($950,459) ($950,459) ($950,459) Aggregate Debt Service ($1,464,914) ($1,464,914) ($1,464,914) ($1,464,914) ($1,464,914) ($1,464,914) ($1,464,914) ($1,464,914) ($1,464,914) ($1,464,914) Buildout Yr. See Table 3. Net of of 4% issuance costs. Includes issuance costs. Assumes 8% interest, 4% issuance fees. Amortized through 2040.
25 Table 5 Bond Debt Service Rincon Hill Infrastructure Finance Distr Calendar Year: Fiscal Year: Bond Issue #1 Net Bond Proceeds 1 Gross Bond Amount 2 Annual Debt Service ($514,455) ($514,455) ($514,455) ($514,455) ($514,455) ($514,455) ($514,455) ($514,455) ($514,455) ($514,455) Bond Issue #2 Net Bond Proceeds 1 Gross Bond Amount 2 Annual Debt Service 3 ($950,459) ($950,459) ($950,459) ($950,459) ($950,459) ($950,459) ($950,459) ($950,459) ($950,459) ($950,459) Aggregate Debt Service ($1,464,914) ($1,464,914) ($1,464,914) ($1,464,914) ($1,464,914) ($1,464,914) ($1,464,914) ($1,464,914) ($1,464,914) ($1,464,914) See Table 3. Net of of 4% issuance costs. Includes issuance costs. Assumes 8% interest, 4% issuance fees. Amortized through 2040.
26 Table 6 General Fund Fiscal Impacts Projection Rincon Hill Infrastructure Finance District Calendar Year: Fiscal Year: Measure 1 Occupied Housing Units 2 5% vacancy ,255 1,532 1,897 2,162 2,405 Residents/Service Population per household ,076 1,616 2,097 2,585 3,227 3,694 4,122 Baseline AV ('000s) $142,425 $142,425 $142,425 $142,425 $142,425 $142,425 $142,425 $142,425 $142,425 $142,425 $142,425 Incremental AV ('000s) $100,000 $149,760 $403,610 $694,742 $975,186 $1,205,551 $1,543,581 $1,797,477 General Fund Revenues ('000s) Property Tax Revenue Existing 57% of 1% of Base AV $806 $806 $806 $806 $806 $806 $806 $806 $806 $806 $806 Property Tax Increment $566 $847 $2,284 $3,932 $5,519 $6,822 $8,735 $10,172 <Less> Allocation to IFD 4 ($566) ($847) ($1,611) ($1,611) ($1,611) ($1,611) ($1,611) ($1,611) Percent Allocated to IFD 100% 100% 71% 41% 29% 24% 18% 16% Property Tax in Lieu of VLF $1.07 per $1,000 AV $107 $160 $430 $741 $1,040 $1,285 $1,645 $1,916 Property Transfer Tax Revenue 5 $90 $554 $2,059 $2,552 $2,654 $2,928 $3,657 $3,398 $3,462 Sales Tax Revenue from Residents $19, per household $62 $80 $134 $195 $249 $304 $376 $429 $477 Telephone Users and Access Line Tax $80.56 per service population $35 $48 $87 $130 $169 $208 $260 $298 $332 Licenses, Permits and Franchise Fees $28.69 per resident $12 $17 $31 $46 $60 $74 $93 $106 $118 Fines, Forfeitures, and Penalties $4.68 per resident $2 $3 $5 $8 $10 $12 $15 $17 $19 VLF and Sales Tax Realignment to H&W $ per capita $77 $105 $190 $286 $371 $458 $571 $654 $730 Total General Fund Revenue $896 $806 $994 $1,719 $3,472 $5,125 $7,380 $9,737 $12,274 $14,477 $16,421 General Fund Expenses ('000s) Police Protection $ per service pop. $225 $308 $558 $839 $1,089 $1,342 $1,676 $1,918 $2,140 Fire Protection $ per service population $115 $158 $286 $430 $558 $687 $858 $982 $1, Service $20.62 per resident $9 $12 $22 $33 $43 $53 $67 $76 $85 Public Works Citywide $23.83 per service population $10 $14 $26 $39 $50 $62 $77 $88 $98 New Infrastructure - Rincon Hill 6 $381 $401 $1,087 $1,087 $1,087 $1,087 $1,087 $1,087 Human Welfare and Neighborhood Development $ per capita $45 $62 $112 $168 $219 $270 $337 $385 $430 Recreation and Parks $ per resident $68 $93 $169 $254 $329 $406 $507 $580 $648 Libraries $60.44 per resident $26 $36 $65 $98 $127 $156 $195 $223 $249 General Administration and Finance $25.99 per service population $11 $15 $28 $42 $55 $67 $84 $96 $107 Contingency 20% of GF Expenses $102 $216 $333 $598 $711 $826 $977 $1,087 $1,188 Total General Fund Expenses $613 $1,296 $2,000 $3,587 $4,268 $4,957 $5,865 $6,524 $7,128 Net General Fund Surplus (Gap) $896 $806 $381 $422 $1,471 $1,538 $3,112 $4,780 $6,410 $7,954 $9,293 Revenues as % of Expenses 162% 133% 174% 143% 173% 196% 209% 222% 230% 1 Unless otherwise noted see Fiscal Impact Table A - 6 for revenue assumptions and Fiscal Impact Table A - 11 for expense assumptions. 2 See Fiscal Impact Table A - 1 for development program and Fiscal Impact Table A - 3 for vacancy rate. 3 See Fiscal Impact Table 3. Since project does not include commercial space, resident population and service population are the same. 4 See Table 3 for details. 5 See Fiscal Impact Table A See Table A -14 in the Fiscal Impact Analysis for a detailed breakdown of maintenance costs.
27 Table 6 General Fund Fiscal Impacts Projection Rincon Hill Infrastructure Finance District Occupied Housing Units 2 Residents/Service Population 3 Baseline AV ('000s) Incremental AV ('000s) Calendar Year: Fiscal Year: Measure 1 5% vacancy 1.71 per household ,414 2,414 2,414 2,414 2,414 2,414 2,414 2,414 2,414 2,414 2,414 4,137 4,137 4,137 4,137 4,137 4,137 4,137 4,137 4,137 4,137 4,137 $142,425 $142,425 $142,425 $142,425 $142,425 $142,425 $142,425 $142,425 $142,425 $142,425 $142,425 $2,017,837 $2,025,281 $2,025,281 $2,025,281 $2,025,281 $2,025,281 $2,025,281 $2,025,281 $2,025,281 $2,025,281 $2,025,281 General Fund Revenues ('000s) Property Tax Revenue Existing Property Tax Increment <Less> Allocation to IFD 4 Percent Allocated to IFD Property Tax in Lieu of VLF Property Transfer Tax Revenue 5 Sales Tax Revenue from Residents Telephone Users and Access Line Tax Licenses, Permits and Franchise Fees Fines, Forfeitures, and Penalties VLF and Sales Tax Realignment to H&W Total General Fund Revenue 57% of 1% of Base AV $1.07 per $1,000 AV $19, per household $80.56 per service population $28.69 per resident $4.68 per resident $ per capita $806 $806 $806 $806 $806 $806 $806 $806 $806 $806 $806 $11,419 $11,461 $11,461 $11,461 $11,461 $11,461 $11,461 $11,461 $11,461 $11,461 $11,461 ($1,611) ($1,611) ($1,611) ($1,611) ($1,611) ($1,611) ($1,611) ($1,611) ($1,611) ($1,611) ($1,611) 14% 14% 14% 14% 14% 14% 14% 14% 14% 14% 14% $2,151 $2,159 $2,159 $2,159 $2,159 $2,159 $2,159 $2,159 $2,159 $2,159 $2,159 $2,125 $2,080 $2,080 $2,080 $2,080 $2,080 $2,080 $2,080 $2,080 $2,080 $2,080 $479 $479 $479 $479 $479 $479 $479 $479 $479 $479 $479 $333 $333 $333 $333 $333 $333 $333 $333 $333 $333 $333 $119 $119 $119 $119 $119 $119 $119 $119 $119 $119 $119 $19 $19 $19 $19 $19 $19 $19 $19 $19 $19 $19 $732 $732 $732 $732 $732 $732 $732 $732 $732 $732 $732 $16,572 $16,577 $16,577 $16,577 $16,577 $16,577 $16,577 $16,577 $16,577 $16,577 $16,577 General Fund Expenses ('000s) Police Protection $ per service pop. Fire Protection $ per service population 911 Service $20.62 per resident Public Works Citywide $23.83 per service population New Infrastructure - Rincon Hill 6 Human Welfare and Neighborhood Development $ per capita Recreation and Parks $ per resident Libraries $60.44 per resident General Administration and Finance $25.99 per service population Contingency 20% of GF Expenses Total General Fund Expenses Net General Fund Surplus (Gap) $2,148 $2,148 $2,148 $2,148 $2,148 $2,148 $2,148 $2,148 $2,148 $2,148 $2,148 $1,100 $1,100 $1,100 $1,100 $1,100 $1,100 $1,100 $1,100 $1,100 $1,100 $1,100 $85 $85 $85 $85 $85 $85 $85 $85 $85 $85 $85 $99 $99 $99 $99 $99 $99 $99 $99 $99 $99 $99 $1,087 $1,087 $1,087 $1,087 $1,087 $1,087 $1,087 $1,087 $1,087 $1,087 $1,087 $431 $431 $431 $431 $431 $431 $431 $431 $431 $431 $431 $650 $650 $650 $650 $650 $650 $650 $650 $650 $650 $650 $250 $250 $250 $250 $250 $250 $250 $250 $250 $250 $250 $108 $108 $108 $108 $108 $108 $108 $108 $108 $108 $108 $1,192 $1,192 $1,192 $1,192 $1,192 $1,192 $1,192 $1,192 $1,192 $1,192 $1,192 $7,149 $7,149 $7,149 $7,149 $7,149 $7,149 $7,149 $7,149 $7,149 $7,149 $7,149 $9,422 $9,428 $9,428 $9,428 $9,428 $9,428 $9,428 $9,428 $9,428 $9,428 $9,428 Revenues as % of Expenses 232% 232% 232% 232% 232% 232% 232% 232% 232% 232% 232% Buildout Yr. 1 2 Unless otherwise noted see Fiscal Impact Table A - 6 for revenue assumptions and Fiscal Impact Table A - 11 for expense assumptions. 3 See Fiscal Impact Table A - 1 for development program and Fiscal Impact Table A - 3 for vacancy rate. 4 See Fiscal Impact Table 3. Since project does not include commercial space, resident population and service population are the same. 5 See Table 3 for details. 6 See Fiscal Impact Table A - 10.
28 Table 6 General Fund Fiscal Impacts Projection Rincon Hill Infrastructure Finance District Occupied Housing Units 2 Residents/Service Population 3 Baseline AV ('000s) Incremental AV ('000s) Calendar Year: Fiscal Year: Measure 1 5% vacancy 1.71 per household ,414 2,414 2,414 2,414 2,414 2,414 2,414 2,414 4,137 4,137 4,137 4,137 4,137 4,137 4,137 4,137 $142,425 $142,425 $142,425 $142,425 $142,425 $142,425 $142,425 $142,425 $2,025,281 $2,025,281 $2,025,281 $2,025,281 $2,025,281 $2,025,281 $2,025,281 $2,025,281 General Fund Revenues ('000s) Property Tax Revenue Existing Property Tax Increment <Less> Allocation to IFD 4 Percent Allocated to IFD Property Tax in Lieu of VLF Property Transfer Tax Revenue 5 Sales Tax Revenue from Residents Telephone Users and Access Line Tax Licenses, Permits and Franchise Fees Fines, Forfeitures, and Penalties VLF and Sales Tax Realignment to H&W Total General Fund Revenue 57% of 1% of Base AV $1.07 per $1,000 AV $19, per household $80.56 per service population $28.69 per resident $4.68 per resident $ per capita $806 $806 $806 $806 $806 $806 $806 $806 $11,461 $11,461 $11,461 $11,461 $11,461 $11,461 $11,461 $11,461 ($1,611) ($1,611) ($1,611) ($1,611) ($1,611) ($1,611) ($1,611) ($1,611) 14% 14% 14% 14% 14% 14% 14% 14% $2,159 $2,159 $2,159 $2,159 $2,159 $2,159 $2,159 $2,159 $3,580 $2,080 $2,080 $2,080 $2,080 $2,080 $2,080 $2,080 $479 $479 $479 $479 $479 $479 $479 $479 $333 $333 $333 $333 $333 $333 $333 $333 $119 $119 $119 $119 $119 $119 $119 $119 $19 $19 $19 $19 $19 $19 $19 $19 $732 $732 $732 $732 $732 $732 $732 $732 $18,077 $16,577 $16,577 $16,577 $16,577 $16,577 $16,577 $16,577 General Fund Expenses ('000s) Police Protection $ per service pop. Fire Protection $ per service population 911 Service $20.62 per resident Public Works Citywide $23.83 per service population New Infrastructure - Rincon Hill 6 Human Welfare and Neighborhood Development $ per capita Recreation and Parks $ per resident Libraries $60.44 per resident General Administration and Finance $25.99 per service population Contingency 20% of GF Expenses Total General Fund Expenses Net General Fund Surplus (Gap) $2,148 $2,148 $2,148 $2,148 $2,148 $2,148 $2,148 $2,148 $1,100 $1,100 $1,100 $1,100 $1,100 $1,100 $1,100 $1,100 $85 $85 $85 $85 $85 $85 $85 $85 $99 $99 $99 $99 $99 $99 $99 $99 $1,087 $1,087 $1,087 $1,087 $1,087 $1,087 $1,087 $1,087 $431 $431 $431 $431 $431 $431 $431 $431 $650 $650 $650 $650 $650 $650 $650 $650 $250 $250 $250 $250 $250 $250 $250 $250 $108 $108 $108 $108 $108 $108 $108 $108 $1,192 $1,192 $1,192 $1,192 $1,192 $1,192 $1,192 $1,192 $7,149 $7,149 $7,149 $7,149 $7,149 $7,149 $7,149 $7,149 $10,928 $9,428 $9,428 $9,428 $9,428 $9,428 $9,428 $9,428 Revenues as % of Expenses 253% 232% 232% 232% 232% 232% 232% 232% 1 Unless otherwise noted see Fiscal Impact Table A - 6 for revenue assumptions and Fiscal Impact Table A - 11 for expense assumptio 2 See Fiscal Impact Table A - 1 for development program and Fiscal Impact Table A - 3 for vacancy rate. 3 See Fiscal Impact Table 3. Since project does not include commercial space, resident population and service population are the same 4 See Table 3 for details. 5 See Fiscal Impact Table A See Table A -14 in the Fiscal Impact Analysis for a detailed breakdown of maintenance costs.
29 TABLE 7 Assessed Value Assumptions Rincon Hill Infrastructure Finance District Assessed Value Assumptions 1 Dwelling Units Avg. Sq. Ft. per Unit Construction Months First Year of Sales Estimated Sales Value per Sq. Ft. ($2011) 2 Estimated Sales Value per Unit ($2011) Base Year FY Assessed Value (AV) 3 Annual Escalation Rates Sales Legislated 333 Harrison St n/a $523 $306,748 $0 0% 0% Lansing St , $848 $848,090 $31,656,995 0% 0% 7 1 One Rincon 292 1, $878 $877,653 $25,408,630 0% 0% Folsom St , $986 $1,183,200 $0 0% 0% /350 Fremont St , $860 $860,444 $18,995,560 0% 0% Fremont St , $827 $827,032 $48,731,013 0% 0% Beale/430 Main St , $707 $706,742 $5,402,447 0% 0% Fremont St. 70 1, $707 $706,742 $572,232 0% 0% Fremont St. 83 1, $707 $706,742 $8,800,913 0% 0% Harrison St. 5 N/A N/A N/A N/A N/A N/A $2,857,687 N/A N/A N/A N/A Total 2, $851,967 $142,425,477 Years to Resale 4 Years Between Unit Sale and AV on Roll 1 Unless otherwise noted, assumptions based on Goodwin consulting Group's Memorandum Regarding Rincon Hill Infrastructure Finance District - Tax Increment Analysis. 2 3 Estimate for 333 Harrison Street is based on construction cost estimates provided by the developer of the project. Data for 201 Folsom St. was provided by the Mayor's Office of Economic and Workforce Dev. Office of the Assessor-Recorder as reported by Real Quest, except for assessed value for One Rincon and 340/350 Fremont Street, which are based on data from the Goodwing Consulting Group. 4 5 Data from the California Association of Realtors for 2009 indicates that the average turnover in California is 5 years. However that figure is impacted by the current high rate of foreclosures. A more conservative turnover rate of 7 years is assumed for for-sale projects and 20 for rental projects (rental projects tend to have significantly lower turnover rate). This property is included in the IFD but the property is not currently entitled for residential development.
30 TABLE 8 Estimated Absorption Rincon Hill Infrastructure Finance District Development Timeline (Cumulative Units Completed and Sold) 1 Calendar Year: Fiscal Year: Harrison St Lansing St One Rincon Folsom St /350 Fremont St Fremont St Beale/430 Main St Fremont St Fremont St. Total ,033 1,321 1,613 1,997 2, Harrison St. is assumed to be a rental project. Units are shown in the development timeline as all being completed and occupied the year immediately after construction is completed.
31 TABLE 8 Estimated Absorption Rincon Hill Infrastructure Finance Distric Development Timeline (Cumulative Units Completed and Sold) 333 Harrison St. 45 Lansing St. One Rincon 201 Folsom St. 340/350 Fremont St Fremont St. 429 Beale/430 Main St. 325 Fremont St. 333 Fremont St. Total Calendar Year: Fiscal Year: ,532 2,541 2,541 2,541 2,541 2,541 2,541 2,541 2,541 2,541 Buildout Yr. 333 Harrison St. is assumed to be a rental project. Units are shown in the development timeline as all being completed and occupied the year immediately after construction is completed.
32 TABLE 8 Estimated Absorption Rincon Hill Infrastructure Finance Distric Development Timeline (Cumulative Units Completed and Sold) 333 Harrison St. 45 Lansing St. One Rincon 201 Folsom St. 340/350 Fremont St Fremont St. 429 Beale/430 Main St. 325 Fremont St. 333 Fremont St. Total Calendar Year: Fiscal Year: ,541 2,541 2,541 2,541 2,541 2,541 2,541 2,541 2,541 2, Harrison St. is assumed to be a rental project. Units are shown in the development timeline as all being completed and occupied the year immediately after construction is completed. 1
33 TABLE 9 Estimated Assessed Value Fiscal Impact Analysis Calendar Year: Fiscal Year: Total Assessed Value ('000s) Harrison St. $100,000 $100,000 $100,000 $100,000 $100,000 $100,000 $100,000 $100, Lansing St. $31,657 $31,657 $31,657 $31,657 $81,417 $162,833 $192,516 $192,516 $192,516 $192,516 $192,516 One Rincon $25,409 $25,409 $25,409 $25,409 $25,409 $84,255 $168,509 $252,764 $256,275 $256,275 $256, Folsom St. $113,587 $227,174 $340,762 $454,349 $567,936 $681, /350 Fremont St. $18,996 $18,996 $18,996 $18,996 $18,996 $18,996 $82,603 $165,205 $247,808 $330,411 $330, Fremont St. $48,731 $48,731 $48,731 $48,731 $48,731 $48,731 $48,731 $48,731 $79,395 $158,790 $238, Beale/430 Main St. $5,402 $5,402 $5,402 $5,402 $5,402 $5,402 $5,402 $5,402 $5,402 $67,847 $79, Fremont St. $572 $572 $572 $572 $572 $572 $572 $572 $572 $572 $49, Fremont St. $8,801 $8,801 $8,801 $8,801 $8,801 $8,801 $8,801 $8,801 $8,801 $8,801 $8, Harrison St. $2,858 $2,858 $2,858 $2,858 $2,858 $2,858 $2,858 $2,858 $2,858 $2,858 $2,858 Total $142,425 $142,425 $142,425 $242,425 $292,185 $546,035 $837,167 $1,117,612 $1,347,976 $1,686,006 $1,939,903 Base Year Assessed Value ('000s) Harrison St. 45 Lansing St. $31,657 $31,657 $31,657 $31,657 $31,657 $31,657 $31,657 $31,657 $31,657 $31,657 $31,657 One Rincon $25,409 $25,409 $25,409 $25,409 $25,409 $25,409 $25,409 $25,409 $25,409 $25,409 $25, Folsom St. 340/350 Fremont St. $18,996 $18,996 $18,996 $18,996 $18,996 $18,996 $18,996 $18,996 $18,996 $18,996 $18, Fremont St. $48,731 $48,731 $48,731 $48,731 $48,731 $48,731 $48,731 $48,731 $48,731 $48,731 $48, Beale/430 Main St. $5,402 $5,402 $5,402 $5,402 $5,402 $5,402 $5,402 $5,402 $5,402 $5,402 $5, Fremont St. $572 $572 $572 $572 $572 $572 $572 $572 $572 $572 $ Fremont St. $8,801 $8,801 $8,801 $8,801 $8,801 $8,801 $8,801 $8,801 $8,801 $8,801 $8, Harrison St. $2,858 $2,858 $2,858 $2,858 $2,858 $2,858 $2,858 $2,858 $2,858 $2,858 $2,858 Total $142,425 $142,425 $142,425 $142,425 $142,425 $142,425 $142,425 $142,425 $142,425 $142,425 $142,425 Incremental Assessed Value ('000s) Harrison St. $100,000 $100,000 $100,000 $100,000 $100,000 $100,000 $100,000 $100, Lansing St. $49,760 $131,176 $160,859 $160,859 $160,859 $160,859 $160,859 One Rincon $58,846 $143,101 $227,355 $230,866 $230,866 $230, Folsom St. $113,587 $227,174 $340,762 $454,349 $567,936 $681, /350 Fremont St. $63,607 $146,210 $228,812 $311,415 $311, Fremont St. $30,664 $110,059 $189, Beale/430 Main St. $62,445 $74, Fremont St. $48, Fremont St. 525 Harrison St. Total $100,000 $149,760 $403,610 $694,742 $975,186 $1,205,551 $1,543,581 $1,797,477 1 Total Assessed Value Consists of assessed value in tax roll in 2010/11. It remains at that level, until residential units are completed and sold (taking into account a 1 year delay to register into tax roll.) 2 Base Year Assessed Value is calculated on Assessed Value in the 2010/11 tax roll. 3 Incremental Assessed Value is calculated as the residual between the total assessed value and base year assessed value.
34 TABLE 9 Estimated Assessed Value Fiscal Impact Analysis Calendar Year: Fiscal Year: Total Assessed Value ('000s) Harrison St. 45 Lansing St. One Rincon 201 Folsom St. 340/350 Fremont St Fremont St. 429 Beale/430 Main St. 325 Fremont St. 333 Fremont St. 525 Harrison St. Total $100,000 $100,000 $100,000 $100,000 $100,000 $100,000 $100,000 $100,000 $100,000 $100,000 $100,000 $192,516 $192,516 $192,516 $192,516 $192,516 $192,516 $192,516 $192,516 $192,516 $192,516 $192,516 $256,275 $256,275 $256,275 $256,275 $256,275 $256,275 $256,275 $256,275 $256,275 $256,275 $256,275 $772,630 $772,630 $772,630 $772,630 $772,630 $772,630 $772,630 $772,630 $772,630 $772,630 $772,630 $330,411 $330,411 $330,411 $330,411 $330,411 $330,411 $330,411 $330,411 $330,411 $330,411 $330,411 $317,580 $325,024 $325,024 $325,024 $325,024 $325,024 $325,024 $325,024 $325,024 $325,024 $325,024 $79,862 $79,862 $79,862 $79,862 $79,862 $79,862 $79,862 $79,862 $79,862 $79,862 $79,862 $49,472 $49,472 $49,472 $49,472 $49,472 $49,472 $49,472 $49,472 $49,472 $49,472 $49,472 $58,660 $58,660 $58,660 $58,660 $58,660 $58,660 $58,660 $58,660 $58,660 $58,660 $58,660 $2,858 $2,858 $2,858 $2,858 $2,858 $2,858 $2,858 $2,858 $2,858 $2,858 $2,858 $2,160,263 $2,167,706 $2,167,706 $2,167,706 $2,167,706 $2,167,706 $2,167,706 $2,167,706 $2,167,706 $2,167,706 $2,167,706 Base Year Assessed Value ('000s) Harrison St. 45 Lansing St. One Rincon 201 Folsom St. 340/350 Fremont St Fremont St. 429 Beale/430 Main St. 325 Fremont St. 333 Fremont St. 525 Harrison St. Total $31,657 $31,657 $31,657 $31,657 $31,657 $31,657 $31,657 $31,657 $31,657 $31,657 $31,657 $25,409 $25,409 $25,409 $25,409 $25,409 $25,409 $25,409 $25,409 $25,409 $25,409 $25,409 $18,996 $18,996 $18,996 $18,996 $18,996 $18,996 $18,996 $18,996 $18,996 $18,996 $18,996 $48,731 $48,731 $48,731 $48,731 $48,731 $48,731 $48,731 $48,731 $48,731 $48,731 $48,731 $5,402 $5,402 $5,402 $5,402 $5,402 $5,402 $5,402 $5,402 $5,402 $5,402 $5,402 $572 $572 $572 $572 $572 $572 $572 $572 $572 $572 $572 $8,801 $8,801 $8,801 $8,801 $8,801 $8,801 $8,801 $8,801 $8,801 $8,801 $8,801 $2,858 $2,858 $2,858 $2,858 $2,858 $2,858 $2,858 $2,858 $2,858 $2,858 $2,858 $142,425 $142,425 $142,425 $142,425 $142,425 $142,425 $142,425 $142,425 $142,425 $142,425 $142,425 Incremental Assessed Value ('000s) Harrison St. 45 Lansing St. One Rincon 201 Folsom St. 340/350 Fremont St Fremont St. 429 Beale/430 Main St. 325 Fremont St. 333 Fremont St. 525 Harrison St. Total $100,000 $100,000 $100,000 $100,000 $100,000 $100,000 $100,000 $100,000 $100,000 $100,000 $100,000 $160,859 $160,859 $160,859 $160,859 $160,859 $160,859 $160,859 $160,859 $160,859 $160,859 $160,859 $230,866 $230,866 $230,866 $230,866 $230,866 $230,866 $230,866 $230,866 $230,866 $230,866 $230,866 $772,630 $772,630 $772,630 $772,630 $772,630 $772,630 $772,630 $772,630 $772,630 $772,630 $772,630 $311,415 $311,415 $311,415 $311,415 $311,415 $311,415 $311,415 $311,415 $311,415 $311,415 $311,415 $268,849 $276,293 $276,293 $276,293 $276,293 $276,293 $276,293 $276,293 $276,293 $276,293 $276,293 $74,459 $74,459 $74,459 $74,459 $74,459 $74,459 $74,459 $74,459 $74,459 $74,459 $74,459 $48,900 $48,900 $48,900 $48,900 $48,900 $48,900 $48,900 $48,900 $48,900 $48,900 $48,900 $49,859 $49,859 $49,859 $49,859 $49,859 $49,859 $49,859 $49,859 $49,859 $49,859 $49,859 $2,017,837 $2,025,281 $2,025,281 $2,025,281 $2,025,281 $2,025,281 $2,025,281 $2,025,281 $2,025,281 $2,025,281 $2,025,281 Buildout Year 1 Total Assessed Value Consists of assessed value in tax roll in 2010/11. It remains at that level, until residential units are completed and sold (taking into account a 1 year delay to register into tax roll.) 2 Base Year Assessed Value is calculated on Assessed Value in the 2010/11 tax roll. 3 Incremental Assessed Value is calculated as the residual between the total assessed value and base year assessed value.
35 TABLE 9 Estimated Assessed Value Fiscal Impact Analysis Calendar Year: Fiscal Year: Total Assessed Value ('000s) Harrison St. 45 Lansing St. One Rincon 201 Folsom St. 340/350 Fremont St Fremont St. 429 Beale/430 Main St. 325 Fremont St. 333 Fremont St. 525 Harrison St. Total $100,000 $100,000 $100,000 $100,000 $100,000 $100,000 $100,000 $100,000 $192,516 $192,516 $192,516 $192,516 $192,516 $192,516 $192,516 $192,516 $256,275 $256,275 $256,275 $256,275 $256,275 $256,275 $256,275 $256,275 $772,630 $772,630 $772,630 $772,630 $772,630 $772,630 $772,630 $772,630 $330,411 $330,411 $330,411 $330,411 $330,411 $330,411 $330,411 $330,411 $325,024 $325,024 $325,024 $325,024 $325,024 $325,024 $325,024 $325,024 $79,862 $79,862 $79,862 $79,862 $79,862 $79,862 $79,862 $79,862 $49,472 $49,472 $49,472 $49,472 $49,472 $49,472 $49,472 $49,472 $58,660 $58,660 $58,660 $58,660 $58,660 $58,660 $58,660 $58,660 $2,858 $2,858 $2,858 $2,858 $2,858 $2,858 $2,858 $2,858 $2,167,706 $2,167,706 $2,167,706 $2,167,706 $2,167,706 $2,167,706 $2,167,706 $2,167,706 Base Year Assessed Value ('000s) Harrison St. 45 Lansing St. One Rincon 201 Folsom St. 340/350 Fremont St Fremont St. 429 Beale/430 Main St. 325 Fremont St. 333 Fremont St. 525 Harrison St. Total $31,657 $31,657 $31,657 $31,657 $31,657 $31,657 $31,657 $31,657 $25,409 $25,409 $25,409 $25,409 $25,409 $25,409 $25,409 $25,409 $18,996 $18,996 $18,996 $18,996 $18,996 $18,996 $18,996 $18,996 $48,731 $48,731 $48,731 $48,731 $48,731 $48,731 $48,731 $48,731 $5,402 $5,402 $5,402 $5,402 $5,402 $5,402 $5,402 $5,402 $572 $572 $572 $572 $572 $572 $572 $572 $8,801 $8,801 $8,801 $8,801 $8,801 $8,801 $8,801 $8,801 $2,858 $2,858 $2,858 $2,858 $2,858 $2,858 $2,858 $2,858 $142,425 $142,425 $142,425 $142,425 $142,425 $142,425 $142,425 $142,425 Incremental Assessed Value ('000s) Harrison St. 45 Lansing St. One Rincon 201 Folsom St. 340/350 Fremont St Fremont St. 429 Beale/430 Main St. 325 Fremont St. 333 Fremont St. 525 Harrison St. Total $100,000 $100,000 $100,000 $100,000 $100,000 $100,000 $100,000 $100,000 $160,859 $160,859 $160,859 $160,859 $160,859 $160,859 $160,859 $160,859 $230,866 $230,866 $230,866 $230,866 $230,866 $230,866 $230,866 $230,866 $772,630 $772,630 $772,630 $772,630 $772,630 $772,630 $772,630 $772,630 $311,415 $311,415 $311,415 $311,415 $311,415 $311,415 $311,415 $311,415 $276,293 $276,293 $276,293 $276,293 $276,293 $276,293 $276,293 $276,293 $74,459 $74,459 $74,459 $74,459 $74,459 $74,459 $74,459 $74,459 $48,900 $48,900 $48,900 $48,900 $48,900 $48,900 $48,900 $48,900 $49,859 $49,859 $49,859 $49,859 $49,859 $49,859 $49,859 $49,859 $2,025,281 $2,025,281 $2,025,281 $2,025,281 $2,025,281 $2,025,281 $2,025,281 $2,025,281 1 Total Assessed Value Consists of assessed value in tax roll in 2010/11. It remains at that level, until residential units are completed and sold (taking into account a 1 year delay to register into tax roll.) 2 Base Year Assessed Value is calculated on Assessed Value in the 2010/11 tax roll. 3 Incremental Assessed Value is calculated as the residual between the total assessed value and base year assessed value.
36 TABLE 10 Estimated General Fund Property Tax Revenues Rincon Hill Infrastructure Finance District GF share of Property Tax Revenue from Base Year Assessed Value Calendar Year: Fiscal Year: Harrison St. 45 Lansing St. $179,147 $179,147 $179,147 $179,147 $179,147 $179,147 $179,147 $179,147 $179,147 One Rincon $143,787 $143,787 $143,787 $143,787 $143,787 $143,787 $143,787 $143,787 $143, Folsom St. 340/350 Fremont St. $107,496 $107,496 $107,496 $107,496 $107,496 $107,496 $107,496 $107,496 $107, Fremont St. $275,769 $275,769 $275,769 $275,769 $275,769 $275,769 $275,769 $275,769 $275, Beale/430 Main St. $30,572 $30,572 $30,572 $30,572 $30,572 $30,572 $30,572 $30,572 $30, Fremont St. $3,238 $3,238 $3,238 $3,238 $3,238 $3,238 $3,238 $3,238 $3, Fremont St. $49,804 $49,804 $49,804 $49,804 $49,804 $49,804 $49,804 $49,804 $49, Harrison St. $16,172 $16,172 $16,172 $16,172 $16,172 $16,172 $16,172 $16,172 $16,172 Total $805,986 $805,986 $805,986 $805,986 $805,986 $805,986 $805,986 $805,986 $805,986 GF share of Property Tax from Incremental Assessed Value 1 (Before Contribution to IFD) 333 Harrison St. $565,900 $565,900 $565,900 $565,900 $565,900 $565, Lansing St. $281,590 $742,327 $910,304 $910,304 $910,304 One Rincon $333,010 $809,807 $1,286,605 $1,306, Folsom St. $642,790 $1,285,580 $1,928,370 $2,571, /350 Fremont St. $359,953 $827,401 $1,294, Fremont St. $173, Beale/430 Main St. 325 Fremont St. 333 Fremont St. 525 Harrison St. Total $565,900 $847,490 $2,284,027 $3,931,543 $5,518,579 $6,822,212 Total General Fund Property Tax Revenue 333 Harrison St. $565,900 $565,900 $565,900 $565,900 $565,900 $565, Lansing St. $179,147 $179,147 $179,147 $179,147 $460,737 $921,474 $1,089,451 $1,089,451 $1,089,451 One Rincon $143,787 $143,787 $143,787 $143,787 $143,787 $476,797 $953,595 $1,430,392 $1,450, Folsom St. $642,790 $1,285,580 $1,928,370 $2,571, /350 Fremont St. $107,496 $107,496 $107,496 $107,496 $107,496 $107,496 $467,448 $934,897 $1,402, Fremont St. $275,769 $275,769 $275,769 $275,769 $275,769 $275,769 $275,769 $275,769 $449, Beale/430 Main St. $30,572 $30,572 $30,572 $30,572 $30,572 $30,572 $30,572 $30,572 $30, Fremont St. $3,238 $3,238 $3,238 $3,238 $3,238 $3,238 $3,238 $3,238 $3, Fremont St. $49,804 $49,804 $49,804 $49,804 $49,804 $49,804 $49,804 $49,804 $49, Harrison St. $16,172 $16,172 $16,172 $16,172 $16,172 $16,172 $16,172 $16,172 $16,172 $805,986 $805,986 $805,986 $1,371,886 $1,653,476 $3,090,012 $4,737,529 $6,324,565 $7,628,198 1 City and County receives 56.59% of 1% of the incremental assessed value. Please see Table 3 for assumed distribution between GF and IFD. See Fiscal Impact Tables for Tax Rate Assumptions.
37 TABLE 10 Estimated General Fund Property Tax Revenues Rincon Hill Infrastructure Finance District 333 Harrison St. 45 Lansing St. One Rincon 201 Folsom St. 340/350 Fremont St Fremont St. 429 Beale/430 Main St. 325 Fremont St. 333 Fremont St. 525 Harrison St. Total Calendar Year: Fiscal Year: GF share of Property Tax Revenue from Base Year Assessed Value $179,147 $179,147 $179,147 $179,147 $179,147 $179,147 $179,147 $179,147 $179,147 $179,147 $179,147 $143,787 $143,787 $143,787 $143,787 $143,787 $143,787 $143,787 $143,787 $143,787 $143,787 $143,787 $107,496 $107,496 $107,496 $107,496 $107,496 $107,496 $107,496 $107,496 $107,496 $107,496 $107,496 $275,769 $275,769 $275,769 $275,769 $275,769 $275,769 $275,769 $275,769 $275,769 $275,769 $275,769 $30,572 $30,572 $30,572 $30,572 $30,572 $30,572 $30,572 $30,572 $30,572 $30,572 $30,572 $3,238 $3,238 $3,238 $3,238 $3,238 $3,238 $3,238 $3,238 $3,238 $3,238 $3,238 $49,804 $49,804 $49,804 $49,804 $49,804 $49,804 $49,804 $49,804 $49,804 $49,804 $49,804 $16,172 $16,172 $16,172 $16,172 $16,172 $16,172 $16,172 $16,172 $16,172 $16,172 $16,172 $805,986 $805,986 $805,986 $805,986 $805,986 $805,986 $805,986 $805,986 $805,986 $805,986 $805,986 GF share of Property Tax from Incremental Assessed Value 1 (Before Contribution to IFD) 333 Harrison St. 45 Lansing St. One Rincon 201 Folsom St. 340/350 Fremont St Fremont St. 429 Beale/430 Main St. 325 Fremont St. 333 Fremont St. 525 Harrison St. Total $565,900 $565,900 $565,900 $565,900 $565,900 $565,900 $565,900 $565,900 $565,900 $565,900 $565,900 $910,304 $910,304 $910,304 $910,304 $910,304 $910,304 $910,304 $910,304 $910,304 $910,304 $910,304 $1,306,471 $1,306,471 $1,306,471 $1,306,471 $1,306,471 $1,306,471 $1,306,471 $1,306,471 $1,306,471 $1,306,471 $1,306,471 $3,213,950 $3,856,740 $4,372,311 $4,372,311 $4,372,311 $4,372,311 $4,372,311 $4,372,311 $4,372,311 $4,372,311 $4,372,311 $1,762,298 $1,762,298 $1,762,298 $1,762,298 $1,762,298 $1,762,298 $1,762,298 $1,762,298 $1,762,298 $1,762,298 $1,762,298 $622,825 $1,072,122 $1,521,418 $1,563,540 $1,563,540 $1,563,540 $1,563,540 $1,563,540 $1,563,540 $1,563,540 $1,563,540 $353,375 $421,366 $421,366 $421,366 $421,366 $421,366 $421,366 $421,366 $421,366 $421,366 $421,366 $276,723 $276,723 $276,723 $276,723 $276,723 $276,723 $276,723 $276,723 $276,723 $276,723 $282,150 $282,150 $282,150 $282,150 $282,150 $282,150 $282,150 $282,150 $282,150 $8,735,122 $10,171,923 $11,418,941 $11,461,063 $11,461,063 $11,461,063 $11,461,063 $11,461,063 $11,461,063 $11,461,063 $11,461,063 Total General Fund Property Tax Revenue 333 Harrison St. 45 Lansing St. One Rincon 201 Folsom St. 340/350 Fremont St Fremont St. 429 Beale/430 Main St. 325 Fremont St. 333 Fremont St. 525 Harrison St. $565,900 $565,900 $565,900 $565,900 $565,900 $565,900 $565,900 $565,900 $565,900 $565,900 $565,900 $1,089,451 $1,089,451 $1,089,451 $1,089,451 $1,089,451 $1,089,451 $1,089,451 $1,089,451 $1,089,451 $1,089,451 $1,089,451 $1,450,259 $1,450,259 $1,450,259 $1,450,259 $1,450,259 $1,450,259 $1,450,259 $1,450,259 $1,450,259 $1,450,259 $1,450,259 $3,213,950 $3,856,740 $4,372,311 $4,372,311 $4,372,311 $4,372,311 $4,372,311 $4,372,311 $4,372,311 $4,372,311 $4,372,311 $1,869,794 $1,869,794 $1,869,794 $1,869,794 $1,869,794 $1,869,794 $1,869,794 $1,869,794 $1,869,794 $1,869,794 $1,869,794 $898,594 $1,347,890 $1,797,187 $1,839,309 $1,839,309 $1,839,309 $1,839,309 $1,839,309 $1,839,309 $1,839,309 $1,839,309 $383,947 $451,938 $451,938 $451,938 $451,938 $451,938 $451,938 $451,938 $451,938 $451,938 $451,938 $3,238 $279,962 $279,962 $279,962 $279,962 $279,962 $279,962 $279,962 $279,962 $279,962 $279,962 $49,804 $49,804 $331,954 $331,954 $331,954 $331,954 $331,954 $331,954 $331,954 $331,954 $331,954 $16,172 $16,172 $16,172 $16,172 $16,172 $16,172 $16,172 $16,172 $16,172 $16,172 $16,172 $9,541,108 $10,977,909 $12,224,927 $12,267,048 $12,267,048 $12,267,048 $12,267,048 $12,267,048 $12,267,048 $12,267,048 $12,267,048 Buildout Yr. 1 City and County receives 56.59% of 1% of the incremental assessed value. Please see Table 3 for assumed distribution between GF and IFD. See Fiscal Impact tables for Tax Rate Assumptions
38 TABLE 10 Estimated General Fund Property Tax Revenues Rincon Hill Infrastructure Finance District 333 Harrison St. 45 Lansing St. One Rincon 201 Folsom St. 340/350 Fremont St Fremont St. 429 Beale/430 Main St. 325 Fremont St. 333 Fremont St. 525 Harrison St. Total Calendar Year: Fiscal Year: GF share of Property Tax Revenue from Base Year Assessed Value $179,147 $179,147 $179,147 $179,147 $179,147 $179,147 $179,147 $179,147 $179,147 $179,147 $143,787 $143,787 $143,787 $143,787 $143,787 $143,787 $143,787 $143,787 $143,787 $143,787 $107,496 $107,496 $107,496 $107,496 $107,496 $107,496 $107,496 $107,496 $107,496 $107,496 $275,769 $275,769 $275,769 $275,769 $275,769 $275,769 $275,769 $275,769 $275,769 $275,769 $30,572 $30,572 $30,572 $30,572 $30,572 $30,572 $30,572 $30,572 $30,572 $30,572 $3,238 $3,238 $3,238 $3,238 $3,238 $3,238 $3,238 $3,238 $3,238 $3,238 $49,804 $49,804 $49,804 $49,804 $49,804 $49,804 $49,804 $49,804 $49,804 $49,804 $16,172 $16,172 $16,172 $16,172 $16,172 $16,172 $16,172 $16,172 $16,172 $16,172 $805,986 $805,986 $805,986 $805,986 $805,986 $805,986 $805,986 $805,986 $805,986 $805,986 GF share of Property Tax from Incremental Assessed Value 1 (Before Contribution to IFD) 333 Harrison St. 45 Lansing St. One Rincon 201 Folsom St. 340/350 Fremont St Fremont St. 429 Beale/430 Main St. 325 Fremont St. 333 Fremont St. 525 Harrison St. Total $565,900 $565,900 $565,900 $565,900 $565,900 $565,900 $565,900 $565,900 $565,900 $565,900 $910,304 $910,304 $910,304 $910,304 $910,304 $910,304 $910,304 $910,304 $910,304 $910,304 $1,306,471 $1,306,471 $1,306,471 $1,306,471 $1,306,471 $1,306,471 $1,306,471 $1,306,471 $1,306,471 $1,306,471 $4,372,311 $4,372,311 $4,372,311 $4,372,311 $4,372,311 $4,372,311 $4,372,311 $4,372,311 $4,372,311 $4,372,311 $1,762,298 $1,762,298 $1,762,298 $1,762,298 $1,762,298 $1,762,298 $1,762,298 $1,762,298 $1,762,298 $1,762,298 $1,563,540 $1,563,540 $1,563,540 $1,563,540 $1,563,540 $1,563,540 $1,563,540 $1,563,540 $1,563,540 $1,563,540 $421,366 $421,366 $421,366 $421,366 $421,366 $421,366 $421,366 $421,366 $421,366 $421,366 $276,723 $276,723 $276,723 $276,723 $276,723 $276,723 $276,723 $276,723 $276,723 $276,723 $282,150 $282,150 $282,150 $282,150 $282,150 $282,150 $282,150 $282,150 $282,150 $282,150 $11,461,063 $11,461,063 $11,461,063 $11,461,063 $11,461,063 $11,461,063 $11,461,063 $11,461,063 $11,461,063 $11,461,063 Total General Fund Property Tax Revenue 333 Harrison St. 45 Lansing St. One Rincon 201 Folsom St. 340/350 Fremont St Fremont St. 429 Beale/430 Main St. 325 Fremont St. 333 Fremont St. 525 Harrison St. $565,900 $565,900 $565,900 $565,900 $565,900 $565,900 $565,900 $565,900 $565,900 $565,900 $1,089,451 $1,089,451 $1,089,451 $1,089,451 $1,089,451 $1,089,451 $1,089,451 $1,089,451 $1,089,451 $1,089,451 $1,450,259 $1,450,259 $1,450,259 $1,450,259 $1,450,259 $1,450,259 $1,450,259 $1,450,259 $1,450,259 $1,450,259 $4,372,311 $4,372,311 $4,372,311 $4,372,311 $4,372,311 $4,372,311 $4,372,311 $4,372,311 $4,372,311 $4,372,311 $1,869,794 $1,869,794 $1,869,794 $1,869,794 $1,869,794 $1,869,794 $1,869,794 $1,869,794 $1,869,794 $1,869,794 $1,839,309 $1,839,309 $1,839,309 $1,839,309 $1,839,309 $1,839,309 $1,839,309 $1,839,309 $1,839,309 $1,839,309 $451,938 $451,938 $451,938 $451,938 $451,938 $451,938 $451,938 $451,938 $451,938 $451,938 $279,962 $279,962 $279,962 $279,962 $279,962 $279,962 $279,962 $279,962 $279,962 $279,962 $331,954 $331,954 $331,954 $331,954 $331,954 $331,954 $331,954 $331,954 $331,954 $331,954 $16,172 $16,172 $16,172 $16,172 $16,172 $16,172 $16,172 $16,172 $16,172 $16,172 $12,267,048 $12,267,048 $12,267,048 $12,267,048 $12,267,048 $12,267,048 $12,267,048 $12,267,048 $12,267,048 $12,267,048 1 City and County receives 56.59% of 1% of the incremental assessed value. Please see Table 3 for assumed distribution between GF and IFD. See Fiscal Impact tables for Tax Rate Assumptions
39 Table 11 IFD Cash Flow Projection, with Inflation 1 Rincon Hill Infrastructure Finance District Plan Year: Calendar Year: Fiscal Year: Total Total General Fund Property Tax Increment $402,820,147 $600,363 $936,683 $2,594,615 $4,583,301 $6,584,767 $8,400,791 IFD Revenues % of General Fund TI Deposited into IFD 100% 100% 90% 51% 36% 28% IFD Property Tax Increment $60,206,544 $600,363 $936,683 $2,346,780 $2,346,780 $2,346,780 $2,346,780 Rounded $60,000,000 IFD Net Bond Proceeds $21,999,428 $5,729,517 $16,269,911 Total IFD Revenues $82,205,971 $6,329,880 $936,683 $18,616,691 $2,346,780 $2,346,780 $2,346,780 IFD Expenses Public Facilities ($22,335,748) ($5,729,517) ($336,320) ($16,269,911) Bond Debt Service ($54,427,476) ($545,785) ($545,785) ($2,133,436) ($2,133,436) ($2,133,436) ($2,133,436) Total IFD Expenses ($76,763,224) ($6,275,302) ($882,105) ($18,403,347) ($2,133,436) ($2,133,436) ($2,133,436) Net IFD Cash Flow $5,442,748 $54,578 $54,578 $213,344 $213,344 $213,344 $213,344 1 Projection has been prepared to reflect inflation and a 25% contingency factor for the cost of the IFD improvements. \\Sf-fs1\wp\19\19061\003\IFD and Fiscal Impact Model with City modifications with inflation.xls; 12/10/2010
40 Table 11 IFD Cash Flow Projection, with Inflation 1 Plan Year: Total General Fund Property Tax Increment $11,026,379 $13,153,193 $15,142,897 $15,541,598 $15,890,499 $16,246,854 $16,610,825 $16,982,572 $17,362,263 $17,750,068 $18,146,159 IFD Revenues % of General Fund TI Deposited into IFD 21% 18% 15% 15% 15% 14% 14% 14% 14% 13% 13% IFD Property Tax Increment $2,346,780 $2,346,780 $2,346,780 $2,346,780 $2,346,780 $2,346,780 $2,346,780 $2,346,780 $2,346,780 $2,346,780 $2,346,780 Rounded IFD Net Bond Proceeds Total IFD Revenues $2,346,780 $2,346,780 $2,346,780 $2,346,780 $2,346,780 $2,346,780 $2,346,780 $2,346,780 $2,346,780 $2,346,780 $2,346,780 IFD Expenses Public Facilities Bond Debt Service ($2,133,436) ($2,133,436) ($2,133,436) ($2,133,436) ($2,133,436) ($2,133,436) ($2,133,436) ($2,133,436) ($2,133,436) ($2,133,436) ($2,133,436) Total IFD Expenses ($2,133,436) ($2,133,436) ($2,133,436) ($2,133,436) ($2,133,436) ($2,133,436) ($2,133,436) ($2,133,436) ($2,133,436) ($2,133,436) ($2,133,436) Net IFD Cash Flow $213,344 $213,344 $213,344 $213,344 $213,344 $213,344 $213,344 $213,344 $213,344 $213,344 $213,344 Buildout Yr. Projection has been prepared to reflect inflation and a 25% contingency factor for the cost of the IFD improvements. \\Sf-fs1\wp\19\19061\003\IFD and Fiscal Impact Model with City modifications with inflation.xls; 12/10/2010
41 Table 11 IFD Cash Flow Projection, with Inflation 1 Plan Year: Total General Fund Property Tax Increment $18,550,713 $18,963,913 $19,385,941 $19,825,735 $20,266,167 $20,716,011 $21,175,467 $21,644,741 $22,124,043 $22,613,587 IFD Revenues % of General Fund TI Deposited into IFD 13% 12% 12% 12% 12% 11% 11% 11% 11% 10% IFD Property Tax Increment $2,346,780 $2,346,780 $2,346,780 $2,346,780 $2,346,780 $2,346,780 $2,346,780 $2,346,780 $2,346,780 $2,346,780 Rounded IFD Net Bond Proceeds Total IFD Revenues $2,346,780 $2,346,780 $2,346,780 $2,346,780 $2,346,780 $2,346,780 $2,346,780 $2,346,780 $2,346,780 $2,346,780 IFD Expenses Public Facilities Bond Debt Service ($2,133,436) ($2,133,436) ($2,133,436) ($2,133,436) ($2,133,436) ($2,133,436) ($2,133,436) ($2,133,436) ($2,133,436) ($2,133,436) Total IFD Expenses ($2,133,436) ($2,133,436) ($2,133,436) ($2,133,436) ($2,133,436) ($2,133,436) ($2,133,436) ($2,133,436) ($2,133,436) ($2,133,436) Net IFD Cash Flow $213,344 $213,344 $213,344 $213,344 $213,344 $213,344 $213,344 $213,344 $213,344 $213,344 1 Projection has been prepared to reflect inflation and a 25% contingency factor for the cost of the IFD improvements. \\Sf-fs1\wp\19\19061\003\IFD and Fiscal Impact Model with City modifications with inflation.xls; 12/10/2010
42 APPENDIX A: Original Map and Legal Description of IFD Boundaries

43 Page 1 of 2
Fiscal Impact Analysis
 May 12, 2017 Fiscal Impact Analysis Westport Cupertino Development Prepared for: KT Urban, LLC Prepared by: Applied Development Economics, Inc. 1756 Lacassie Avenue, #100, Walnut Creek, CA 94596 925.934.8712
Fiscal Analysis of the City of Palo Alto 2030 Comprehensive Plan
 Draft Report Fiscal Analysis of the City of Palo Alto 2030 Comprehensive Plan Prepared for: City of Palo Alto Prepared by: Economic & Planning Systems, Inc. February 17, 2017 EPS #151010 Table of Contents
D R A F T M E M O R A N D U M
 D R A F T M E M O R A N D U M To: From: Joe Speaks, CH2M Darin Smith and Matt Loftis Subject: 4th and King RAB Financing Opportunities; EPS #141018 Date: August 18, 2017 Economic & Planning Systems Inc.
CITY AND COUNTY OF SAN FRANCISCO STATISTICAL SECTION
 Statistical Section STATISTICAL SECTION This section of the City s comprehensive annual financial report presents detailed information as a context for understanding what the information in the financial
City of La Verne. Enhanced Infrastructure Financing District #1. Infrastructure Financing Plan
 City of La Verne Enhanced Infrastructure Financing District #1 Introduction Infrastructure Financing Plan Senate Bill No. 628 was first introduced in February 2013 by Senators Beall and Wolk. This bill,
City of Antioch Development Impact Fee Study
 Report City of Antioch Development Impact Fee Study Prepared for: City of Antioch Prepared by: Economic & Planning Systems, Inc. February 2014 EPS #20001 Table of Contents 1. INTRODUCTION AND RESULTS...
Fiscal and Economic Impact Analysis of Proposed IKEA in Dublin, California
 Final Report Fiscal and Economic Impact Analysis of Proposed IKEA in Dublin, California Prepared for: IKEA Property, Inc. Prepared by: Economic & Planning Systems, Inc. August 22, 2017 EPS #161062 1. INTRODUCTION
DISCOVERY VILLAGE SOUTH SAN MARCOS, CALIFORNIA
 DAVID TAUSSIG & Associates, Inc. FISCAL IMPACT STUDY DISCOVERY VILLAGE SOUTH SAN MARCOS, CALIFORNIA JANUARY 11, 2018 Public Finance Public Private Partnerships Urban Economics Clean Energy Bonds Newport
DRAFT. Prepared for: CBRE CONSULTING CITY OF SAN FRANCISCO MAYOR S OFFICE OF ECONOMIC DEVELOPMENT JANUARY 2011
 DRAFT PARKMERCED FISCAL AND ECONOMIC IMPACT ANALYSIS OVERVIEW Prepared for: CITY OF SAN FRANCISCO MAYOR S OFFICE OF ECONOMIC DEVELOPMENT JANUARY 2011 CBRE CONSULTING 101 California Street, 44 th Floor
Draft-Fiscal Impact Analysis of Union Square and Boynton Yards
 Draft-Fiscal Impact Analysis of Union Square and Boynton Yards Prepared for: City of Somerville, Massachusetts November 16, 2015 Prepared by: 4701 Sangamore Road Suite S240 Bethesda, Maryland 20816 800.424.4318
San Francisco Multi-Purpose Venue Project. Fiscal Impact Analysis: Revenues. Draft Report. Prepared for: The City and County of San Francisco
 Draft Report San Francisco Multi-Purpose Venue Project Fiscal Impact Analysis: Revenues Prepared for: The City and County of San Francisco Prepared by: Economic & Planning Systems, Inc. April 27, 2015
bae urban economics Memorandum Fee Analysis for General Plan Update Cost Recovery and for General Plan Implementation
 bae urban economics Memorandum To: Vacaville City Council From: Matt Kowta, Principal, MCP Date: July 10, 2016 Re: Fee Analysis for General Plan Update Cost Recovery and for General Plan Implementation
River Edge Fiscal Impact Analysis
 Final Report Prepared for: Carbondale Investments Prepared by: Economic & Planning Systems, Inc. EPS #20813 App. N-2 Table of Contents 1. INTRODUCTION AND SUMMARY OF FINDINGS... 1 Summary of Findings...
1.0 FISCAL BENEFITS OF PROPOSED GENERAL PLAN
 11661 San Vicente Boulevard, Suite 306 Los Angeles, CA 90049 (310) 820-2680, (310) 820-8341 fax www.stanleyrhoffman.com Memorandum DATE: TO: Laura Stetson, EDAW FROM: Stan Hoffman, SUBJECT: Claremont General
CITY OF STONE MOUNTAIN 875 Main Street Stone Mountain, Georgia ANNEXATION STUDY 2016
 CITY OF STONE MOUNTAIN 875 Main Street Stone Mountain, Georgia 30083 ANNEXATION STUDY 2016 Presented by the Annexation Study Committee Mayor Patricia Wheeler Alex Brennan Thom DeLoach Mayor Pro Tem Chakira
Memorandum. Background memorandum for Independence/Constitution Project fiscal impact analysis
 Memorandum To: From: Re: Thomas H. Rogers, City of Menlo Park Ron Golem, Steve Murphy, BAE Background memorandum for Independence/Constitution Project fiscal impact analysis Date: June 16, 2008 Purpose
MEMORANDUM. Date: July 28, 2011; amended August 31, 2011
 MEMORANDUM Date: July 28, 2011; amended August 31, 2011 To: From: Project: Subject: Thomas Rogers, City of Menlo Park Mark Hoffheimer, Perkins & Will Prakash Pinto, Perkins & Will Strategic Economics Menlo
Parking Strategic Plan
 DOWNTOWN BOISE Parking Strategic Plan APPENDIX H1 Parking 101 - City of Boulder Parking 101 City of Boulder Downtown and University Hill Management Division & Parking Services Mission Statement: We serve
Economic Evaluation and Fiscal Impact Analysis of Gateway Oyster Point
 Report Economic Evaluation and Fiscal Impact Analysis of Gateway Oyster Point Prepared for: BioMed Realty Prepared by: Economic & Planning Systems, Inc. April 9, 2013 EPS #131017 Table of Contents 1. INTRODUCTION
Executive Summary. Fiscal Year ($ millions) Total Department Uses by Major Service Area 2, ,
 Total Department Uses by Major Service Area 2, ,") Executive Summary SAN FR ANCISCO S BUDGET The budget for the City and County of San Francisco (the City) for (FY) and FY is $7.3 billion and $7.6 billion, respectively. Roughly 52.3 percent of the budget
Executive Summary SAN FR ANCISCO S BUDGET The budget for the City and County of San Francisco (the City) for (FY) and FY is $7.3 billion and $7.6 billion, respectively. Roughly 52.3 percent of the budget
COMMUNITY FACILITIES DISTRICT NO.
 DAVID TAUSSIG & ASSOCIATES, INC. CITY OF ANAHEIM COMMUNITY FACILITIES DISTRICT NO. 1989-3 ADMINISTRATION REPORT FISCAL YEAR 2015-16 AUGUST 10, 2015 Public Finance Urban Economics Newport Beach Riverside
COMMUNITY FACILITIES DISTRICT NO.
 DAVID TAUSSIG & ASSOCIATES, INC. CITY OF ANAHEIM COMMUNITY FACILITIES DISTRICT NO. 1989-1 ADMINISTRATION REPORT FISCAL YEAR 2015-16 AUGUST 10, 2015 Public Finance Urban Economics Newport Beach Riverside
GRASS VALLEY TRANSPORTATION IMPACT FEE PROGRAM NEXUS STUDY
 HEARING REPORT GRASS VALLEY TRANSPORTATION IMPACT FEE PROGRAM NEXUS STUDY Prepared for: City of Grass Valley Prepared by: Economic & Planning Systems, Inc. March 2008 EPS #17525 S A C R A M E N T O 2150
TAUSSIG. & Associates, Inc. LAGUNA BEACH UNIFIED SCHOOL DISTRICT COMMUNITY FACILITIES DISTRICT No DAVID
 DAVID TAUSSIG & Associates, Inc. LAGUNA BEACH UNIFIED SCHOOL DISTRICT COMMUNITY FACILITIES DISTRICT No. 98-1 June 21, 2016 Public Finance Public Private Partnerships Urban Economics Newport Beach Riverside
Table of Contents. Capital - 2
 CAPITAL OVERVIEW Table of Contents 2018-2020 Budget Summary CAP-3 2018 Funding Breakdown CAP-4 2018-2020 Development Charge Reserve Projections CAP-5 Asset Management CAP-6 2018 Cash Flow Projection CAP-8
Urban Analytics FISCAL ANALYSIS FOR THE SUCCESSOR AGENCY TO THE REDEVELOPMENT AGENCY OF THE CITY OF SAN JOSE
 FISCAL ANALYSIS FOR THE SUCCESSOR AGENCY TO THE REDEVELOPMENT AGENCY OF THE CITY OF SAN JOSE MERGED AREA REDEVELOPMENT PROJECT FY 2015-1 6 DECEMBER 17, 2015 Urban Analytics INTRODUCTION The Successor Agency
TAUSSIG. & Associates, Inc. FISCAL IMPACT ANALYSIS DELTA COVE (ATLAS TRACT) DAVID. Public Finance Facilities Planning Urban Economics
 DAVID. Public Finance Facilities Planning Urban Economics") DAVID TAUSSIG & Associates, Inc. FISCAL IMPACT ANALYSIS DELTA COVE (ATLAS TRACT) August 31, 2010 Prepared By: Public Finance Facilities Planning Urban Economics David Taussig & Associates, Inc 5000 Birch
DAVID TAUSSIG & Associates, Inc. FISCAL IMPACT ANALYSIS DELTA COVE (ATLAS TRACT) August 31, 2010 Prepared By: Public Finance Facilities Planning Urban Economics David Taussig & Associates, Inc 5000 Birch
ORDINANCE NO
 FULL TEXT OF MEASURE ORDINANCE NO. 2016-03 AN ORDINANCE OF THE CITY OF ALBANY ENACTING A SPECIAL PARCEL TAX TO FUND REPAIRING AND UPGRADING PUBLIC SIDEWALKS AND REMOVING OBSTRUCTIONS TO IMPROVE SAFETY
MEMORANDUM Finance Department
 MEMORANDUM Finance Department DATE: TO: FROM: SUBJECT: City Council Dave Warren Director of Finance RECOMMENDATION: GANN APPROPRIATION LIMIT Adopt a Resolution establishing the Appropriation Limit (GANN)
CAPITAL IMPROVEMENTS ELEMENT:
 CAPITAL IMPROVEMENTS ELEMENT: Goals, Objectives and Policies Goal 1. The provision of needed public facilities in a timely manner, which protects investments in existing facilities, maximizes the use of
COMMUNITY FACILITIES DISTRICT NO.
 DAVID TAUSSIG & ASSOCIATES, INC. CITY OF ANAHEIM COMMUNITY FACILITIES DISTRICT NO. 1989-2 ADMINISTRATION REPORT FISCAL YEAR 2015-16 AUGUST 10, 2015 Public Finance Urban Economics Newport Beach Riverside
Chapter 5. REMAINING REVIEW FACTORS
 Chapter 5. REMAINING REVIEW FACTORS Section 5.1 Finance Constraints and Opportunities Chapter 5 REMAINING REVIEW FACTORS Introduction The remaining review factors required by the Cortese Knox Hertzberg
CRANE CROSSING SPECIFIC PLAN OAKDALE, CALIFORNIA
 CRANE CROSSING SPECIFIC PLAN OAKDALE, CALIFORNIA PUBLIC FACILITIES FINANCING PLAN AND FISCAL IMPACT ANALYSIS Final Draft MAY 28, 2013 Crane Crossing Specific Plan Oakdale, California Public Facilities
COMMUNITY FACILITIES DISTRICT NO.
 DAVID TAUSSIG & Associates, Inc. CITY OF ANAHEIM COMMUNITY FACILITIES DISTRICT NO. 06-2 ADMINISTRATION REPORT FISCAL YEAR 2015-2016 AUGUST 3, 2015 Public Finance Facilities Planning Urban Economics Newport
San Francisco Services & Infrastructure
 FY 2012-20212021 Capital Plan Citizens General Obligation Bond Oversight Committee April 28, 2011 San Francisco Services & Infrastructure 2 San Francisco is responsible for a broad array of city, county,
Budget Introduction Proposed Budget
 Budget Introduction Proposed Budget INTRO - 1 INTRO - 2 Summary of the Budget and Accounting Structure The City of Beverly Hills uses the same basis for budgeting as for accounting. Governmental fund financial
Report to the City Council
 The City of San Diego Report to the City Council DATE ISSUED: June 7, 2017 REPORT NO: ATTENTION: Honorable Members of the City Council SUBJECT: Consideration of a Proposed Ballot Measure to Authorize an
CITY AND COUNTY OF SAN FRANCISCO. NOTES TO BASIC FINANCIAL STATEMENTS (Continued)
") (8) Bonds, Loans, Capital Leases and Other Payables The following is a summary of long-term obligations of the City as of June 30, 2001 (in thousands): GOVERNMENTAL ACTIVITIES Final Remaining Maturity
(8) Bonds, Loans, Capital Leases and Other Payables The following is a summary of long-term obligations of the City as of June 30, 2001 (in thousands): GOVERNMENTAL ACTIVITIES Final Remaining Maturity
GENERAL FUND REVENUES BY SOURCE
 BUDGET DETAIL BUDGET DETAIL The Budget Detail gives more information on the budget, than is shown in the Executive Summary. Detail information is provided on the General Fund, Special Revenue Funds, Enterprise
FY 09/10 ADOPTED GENERAL FUND REVENUES $218,840,522
 GENERAL FUND REVENUES FY 09/10 ADOPTED GENERAL FUND REVENUES $218,840,522 State Revenue 11% Transfers Federal Revenue1% 2% Fund Balance 0.1% Other Local Revenue 2% Other Local Taxes 21% Gen. Property Taxes
March 1, Honorable Eric Garcetti, Mayor SUBJECT: FINANCIAL FORECAST REPORT MARCH 1, 2016
 March 1, 2016 Honorable Eric Garcetti, Mayor SUBJECT: FINANCIAL FORECAST REPORT MARCH 1, 2016 In accordance with City Charter Section 311(c), I am submitting my revenue forecasts for fiscal years 2015-16
SAN JOSH CAPITAL OP SILICON VALLEY F/ZZ/IL. Memorandum. FROM: Kim Walesh Julia H. Cooper TO: HONORABLE MAYOR AND CITY COUNCIL
 COUNCIL AGENDA: 08/02/16 ITEM: ^3 CITY OF SAN JOSH CAPITAL OP SILICON VALLEY TO: HONORABLE MAYOR AND CITY COUNCIL SUBJECT: POTENTIAL BUSINESS TAX MODERNIZATION MEASURE A pproved ^ Memorandum FROM: Kim
Finance Department. DATE: August 26, City Council. Director of Finance GANN APPROPRIATION LIMIT RECOMMENDATION:
 M E M O R A N D U M Finance Department DATE: TO: FROM: SUBJECT: City Council Dave Warren Director of Finance RECOMMENDATION: GANN APPROPRIATION LIMIT Adopt a Resolution establishing the Gann Appropriation
PUBLIC SERVICES AND PUBLIC FACILITIES FINANCING PLAN SALINAS FUTURE GROWTH AREA. November 12, 2007
 PUBLIC SERVICES AND PUBLIC FACILITIES FINANCING PLAN SALINAS FUTURE GROWTH AREA November 12, 2007 Prepared for the City of Salinas Prepared by Applied Development Economics 100 Pringle Avenue, Suite 560
City of San Juan Capistrano Agenda Report. 1. Adopt the resolution amending the Operating and Capital Improvement Budgets for Fiscal Year ;
 6/20/2017 City of San Juan Capistrano Agenda Report F1a TO: Honorable Mayor and Members of the City Council FROM: ~n Siegel, City Manager SUBMITTED BY: Ken Al-lmam, Chief Financial Officer P' PREPARED
Fiscal Analysis of Danville Annexation Areas
 Revised Draft Fiscal Analysis of Danville Annexation Areas Prepared for: Town of Danville Prepared by: Economic & Planning Systems, Inc. December 3, 2010 EPS #20072 Table of Contents 1. INTRODUCTION...
City of San Mateo Economic and Revenue Forecast
 Final Report City of San Mateo Economic and Revenue Forecast Prepared for: City of San Mateo Prepared by: Economic & Planning Systems, Inc. January 30, 2014 EPS #131138 Table of Contents 1. BACKGROUND
Fairfax County. Department of Management and Budget Government Center Parkway, Suite 561. Fairfax, VA
 Fairfax County Department of Management and Budget 12000 Government Center Parkway, Suite 561 Fairfax, VA 22035 703-324-2391 Budget Information: www.fairfaxcounty.gov/budget Provide feedback on the FY
City of Los Altos, CA
 City of Los Altos, CA 10-Year General Fund Forecast Presented by: Susan Stark Prepared by: Russ Branson PFM, Director 50 California Street, Suite 2300 San Francisco, CA 94111 Total Fund Balances Millions
City and County of San Francisco
 City and County of San Francisco Controller, Mayor, Board of Supervisors Budget Analyst Five Year Financial Plan Update for General Fund Supported Operations FY 2016-17 through FY 2019-20 Joint Report
TAUSSIG. & Associates, Inc. DAVID. Public Finance Facilities Planning Urban Economics. Newport Beach Fresno Riverside San Francisco Chicago Dallas
 DAVID TAUSSIG & Associates, Inc. CITY OF ANAHEIM COMMUNITY FACILITIES DISTRICT NO. 06-2 ADMINISTRATION REPORT FISCAL YEAR 2016-2017 AUGUST 1, 2016 Public Finance Facilities Planning Urban Economics Newport
POWAY UNIFIED SCHOOL DISTRICT
 POWAY UNIFIED SCHOOL DISTRICT ADMINISTRATION REPORT FISCAL YEAR 2017/2018 IMPROVEMENT AREA C OF COMMUNITY FACILITIES DISTRICT NO. 6 June 29, 2017 PREPARED FOR: Poway Unified School District Planning Department
ORDINANCE NO WHEREAS, on September 14, 2004, the Board of Supervisors (the Board of
 ORDINANCE NO. 834 AN ORDINANCE OF THE BOARD OF SUPERVISORS OF RIVERSIDE COUNTY, CALIFORNIA AUTHORIZING THE LEVY OF SPECIAL TAXES IN COMMUNITY FACILITIES DISTRICT NO. 04-2 (LAKE HILLS CREST) OF THE COUNTY
Sec Transportation management special use permits Purpose and intent.
 Sec. 11-700 Transportation management special use permits. 11-701 Purpose and intent. There are certain uses of land which, by their location, nature, size and/or density, or by the accessory uses permitted
City College of San Francisco. Proposition A Special Parcel Tax. 2015/16 Annual Report
 City College of San Francisco Proposition A Special Parcel Tax 2015/16 Annual Report Main Office 32605 Temecula Parkway, Suite 100 Temecula, CA 92592 Toll free: 800.676.7516 Fax: 951.296.1998 Regional
POWAY UNIFIED SCHOOL DISTRICT
 POWAY UNIFIED SCHOOL DISTRICT ADMINISTRATION REPORT FISCAL YEAR 2017/2018 ZONE 2 OF COMMUNITY FACILITIES DISTRICT NO.11 June 29, 2017 PREPARED FOR: Poway Unified School District Planning Department 13626
Citizens Guide to the Budget
 How to Read the Budget 23 The Allocation Process 24 Budget Process Timeline 26 City Funds 27 Basis of Budgeting 28-21 - How to Read the Budget The Fiscal Year 1999 Final Budget is contained within five
Measure A Performance Standards Program Performance Report, FY
 Program Performance Report, FY 2009-10 1 I. MAINTENANCE OF EFFORT A. Local Transportation Funding Each year, the County and each City must commit discretionary local funds (excluding Measure A) for street/road
Presented By: Kevin O Rourke Interim City Manager. June 3, 2013
 Presented By: Kevin O Rourke Interim City Manager June 3, 2013 1 10 Council and Public Workshops 2 3 4 1. Adopt a 2-year budget 2. Provided labor strategy authority 3. Supported restructuring of departments
MEMORANDUM. Mr. George Roberts, Red Table Ventures, LLC Mr. Tambi Katieb, Land Planning Collaborative, Inc.
 Stan Bernstein and Associates, Inc. Financial Planners and Consultants For Local Governments, Municipal Bond Underwriters, and Real Estate Developers PO Box 5342 Vail, Colorado 81658 970-390-9162 amy.bernstein.greer@gmail.com
TABLE OF CONTENTS LIST OF TABLES
 TABLE OF CONTENTS A. GOALS, OBJECTIVES, AND POLICIES... 3 B. SUMMARY... 17 LIST OF TABLES Table IX 1: City of Winter Springs Five-Year Schedule of Capital Improvements (SCI) FY 2013/14-2017/18... 11 Table
TAUSSIG DEVELOPMENT IMPACT FEE JUSTIFICATION STUDY CITY OF ESCALON. Public Finance Public Private Partnerships Urban Economics Clean Energy Bonds
 DAVID TAUSSIG & ASSOCIATES, INC. DEVELOPMENT IMPACT FEE JUSTIFICATION STUDY CITY OF ESCALON B. C. SEPTEMBER 12, 2016 Public Finance Public Private Partnerships Urban Economics Clean Energy Bonds Prepared
MORENO VALLEY PUBLIC FINANCING AUTHORITY $11,695,000 LEASE REVENUE REFUNDING BONDS, SERIES 2013
 MORENO VALLEY PUBLIC FINANCING AUTHORITY $11,695,000 LEASE REVENUE REFUNDING BONDS, SERIES 2013 Riverside County, California Dated: December 30, 2013 Base CUSIP : 61685P 2017 ANNUAL CONTINUING DISCLOSURE
Town of Prescott Valley 2014 Development Impact Fee Report. Raftelis Financial Consultants, Inc.
 Town of Prescott Valley 2014 Development Impact Fee Report Raftelis Financial Consultants, Inc. February 13, 2014 Table of Contents Purpose of this Report... 1 Existing Development Impact Fees... 1 Summary
RESOLUTION NUMBER 3305
 RESOLUTION NUMBER 3305 RESOLUTION OF INTENTION OF THE CITY COUNCIL OF THE CITY OF PERRIS TO ESTABLISH COMMUNITY FACILITIES DISTRICT NO. 2004-5 (AMBER OAKS II) OF THE CITY OF PERRIS AND TO AUTHORIZE THE
TAUSSIG. & Associates, Inc. SANTA MARGARITA WATER DISTRICT COMMUNITY FACILITIES DISTRICT NO DAVID
 DAVID TAUSSIG & Associates, Inc. SANTA MARGARITA WATER DISTRICT COMMUNITY FACILITIES DISTRICT NO. 2013-1 August 10, 2016 Public Finance Public Private Partnerships Urban Economics Newport Beach Fresno
TEX Rail Fort Worth, Texas Project Development (Rating Assigned November 2012)
") TEX Rail Fort Worth, Texas Project Development (Rating Assigned November 2012) Summary Description Proposed Project: Commuter Rail 37.6 Miles, 14 Stations (12 new, two existing) Total Capital Cost ($YOE):
TEX Rail Fort Worth, Texas Project Development (Rating Assigned November 2012) Summary Description Proposed Project: Commuter Rail 37.6 Miles, 14 Stations (12 new, two existing) Total Capital Cost ($YOE):
San Francisco Budget Overview
 San Francisco Budget Overview Presentation to SPUR April 5, 2012 Overview San Francisco s Budget Current Year Status Projections for FY 12-13 and FY 13-14 4/5/12 San Francisco s Budget The only combined
FROM: CITY MANAGER DEPARTMENT: PUBLIC WORKS DATE: SEPTEMBER 19, 2001 CMR:354:01
 TO: HONORABLE CITY COUNCIL FROM: CITY MANAGER DEPARTMENT: PUBLIC WORKS DATE: SEPTEMBER 19, 2001 CMR:354:01 SUBJECT: REQUEST APPROVAL OF A BUDGET AMENDMENT ORDINANCE FOR FISCAL YEAR 2001-02 IN THE AMOUNT
CITY OF ST. PETERSBURG FISCAL YEAR 2013 ADOPTED OPERATING BUDGET & CAPITAL IMPROVEMENT PROGRAM
 CITY OF ST. PETERSBURG FISCAL YEAR 2013 ADOPTED OPERATING BUDGET & CAPITAL IMPROVEMENT PROGRAM City of St. Petersburg Budget I. FUND SUMMARIES General Fund (0001) 1 Preservation Fund (0002) 4 Industrial
TAUSSIG. & Associates, Inc. DAVID. Public Finance Facilities Planning Urban Economics. Newport Beach Fresno Riverside San Francisco Chicago Dallas
 DAVID TAUSSIG & Associates, Inc. CITY OF ANAHEIM COMMUNITY FACILITIES DISTRICT NO. 06-2 ADMINISTRATION REPORT FISCAL YEAR 2018-2019 JULY 27, 2018 Public Finance Facilities Planning Urban Economics Newport
Transit Effectiveness Project
 Transit Effectiveness Project March 14, 2014 SFMTA Board of Directors TEP Project Update Final EIR published March 12 TEP identified as high priority investment by Mayor s Transportation Task Force Capital
[Planning Code Establishing a New Citywide Transportation Sustainability Fee.]
![[Planning Code Establishing a New Citywide Transportation Sustainability Fee.]](/thumbs/86/93306799.jpg "[Planning Code Establishing a New Citywide Transportation Sustainability Fee.]") FILE NO. ORDINANCE NO. 1 [Planning Code Establishing a New Citywide Transportation Sustainability Fee.] Ordinance amending the San Francisco Planning Code by: 1) adding new Sections A through A. to establish
FILE NO. ORDINANCE NO. 1 [Planning Code Establishing a New Citywide Transportation Sustainability Fee.] Ordinance amending the San Francisco Planning Code by: 1) adding new Sections A through A. to establish
sources for FY , only a portion of the statedistributed revenue would be available for new capital projects.
 6 REVENUE PROJECTIONS, SARASOTA/MANATEE 2040 LRTP The purpose of this analysis is to begin to document the financial resources and revenues available for consideration in developing the Financially Feasible
ORDINANCE NUMBER 1107
 ORDINANCE NUMBER 1107 AN ORDINANCE OF THE CITY COUNCIL OF THE CITY OF PERRIS ACTING IN ITS CAPACITY AS THE LEGISLATIVE BODY OF COMMUNITY FACILITIES DISTRICT NO. 2002-1 (WILLOWBROOK) OF THE CITY OF PERRIS
Budget Year A Guide to San Francisco's Budget Process
 Budget Year 2010-11 A Guide to San Francisco's Budget Process Prepared by City and County of San Francisco Controller's Office April 15, 2010 A Guide to San Francisco's Budget Process City & County of
LEVEL OF SERVICE / COST & REVENUE ASSUMPTIONS
 LEVEL OF SERVICE / COST & REVENUE ASSUMPTIONS APPENDIX TO THE FISCAL IMPACT ANALYSIS OF PHASE I OF CAROLINA NORTH University of North Carolina-Chapel Hill Town of Chapel Hill, North Carolina Town of Carrboro,
ARLINGTON COUNTY, VIRGINIA. County Board Agenda Item Meeting of April 22, 2017
 ARLINGTON COUNTY, VIRGINIA County Board Agenda Item Meeting of April 22, 2017 DATE: April 21, 2017 SUBJECT: Fiscal Year 2018 County Budget Resolution and Appropriations Resolution C. M. RECOMMENDATIONS:
Planning Board Worksession No.6: Transportation and Staging
 Planning Board Worksession No.6: Transportation and Staging Prior Worksessions January 27: Focused on transportation analysis and staging recommendations in the Draft Plan. February 9: Reviewed the Executive
Fiscal Analysis November 14, Fiscal Analysis Fiscal Conditions Project Background
 3.11 Fiscal Analysis Fiscal Analysis 3.11.1 Fiscal Conditions 3.11.1.1 Project Background The proposed action is a 149 unit residential development, including a private road and appurtenances, on a 29.3
THE TAX INCREMENT FINANCE AUTHORITY ACT Act 450 of The People of the State of Michigan enact:
 THE TAX INCREMENT FINANCE AUTHORITY ACT Act 450 of 1980 AN ACT to prevent urban deterioration and encourage economic development and activity and to encourage neighborhood revitalization and historic preservation;
Georgia Studies. Unit 8 Local Governments. Lesson 5 Local Governments. Study Presentation
 Georgia Studies Unit 8 Local Governments Lesson 5 Local Governments Study Presentation Lesson 5 - Local Governments ESSENTIAL QUESTION Why do local governments collect and use taxes? Why are there different
Introduction P O L I C Y D O C U M E N T P A R T 1
 P O L I C Y D O C U M E N T P A R T 1 Introduction The 2035 General Plan for San Joaquin County presents a vision for the County's future and a strategy to make that vision a reality. The Plan is the result
EASTERN NEIGHBORHOODS CITIZENS ADVISORY COMMITTEE October 21, 2013 Meeting Material
 EASTERN NEIGHBORHOODS CITIZENS ADVISORY COMMITTEE October 21, 2013 Meeting Material EASTERN NEIGHBORHOODS CITIZENS ADVISORY COMMITTEE October 21, 2013 Meeting Material Agenda Item No. 4 Park Rehabilitation
TAX EXCHANGE AGREEMENT BETWEEN THE COUNTY OF SACRAMENTO AND THE CITY OF SACRAMENTO, RELATING TO THE PANHANDLE ANNEXATION
 TAX EXCHANGE AGREEMENT BETWEEN THE COUNTY OF SACRAMENTO AND THE CITY OF SACRAMENTO, RELATING TO THE PANHANDLE ANNEXATION This TAX EXCHANGE AGREEMENT ( Agreement ) is made and executed in duplicate this
CITY OF DES MOINES, IOWA NET ASSETS BY COMPONENT LAST TEN FISCAL YEARS (Accrual basis of accounting) (Unaudited)
 (Unaudited)") CITY OF DES MOINES, IOWA NET ASSETS BY COMPONENT LAST TEN FISCAL YEARS (Accrual basis of accounting) (Unaudited) 2012 2011 2010 2009 Governmental activities: Invested in capital assets, net of related
CITY OF DES MOINES, IOWA NET ASSETS BY COMPONENT LAST TEN FISCAL YEARS (Accrual basis of accounting) (Unaudited) 2012 2011 2010 2009 Governmental activities: Invested in capital assets, net of related
Budget Summary Budget Highlights. All Funds. General Fund
 2017 Budget Highlights Budget Summary All Funds The total 2017 operating budget for all appropriated funds is $1.93 billion, an increase of 4.85 percent from 2016. The City s main operating fund, the General
Westwood Country Club Redevelopment
 Westwood Country Club Redevelopment Economic and Fiscal Impact March, 2014 Prepared for: Mensch Capital Partners Prepared By: Kent Gardner, Ph.D. Project Director 1 South Washington Street Suite 400 Rochester,
FY Six-Month Budget Status Report
 FY 2017-18 Six-Month Budget Status Report The Controller s Office provides periodic budget status updates to the City s policy makers during each fiscal year, as directed by Charter Section 3.105. This
CITY OF BREVARD
 ANNUAL BUDGET ESTIMATE - REVENUE Amended - 2018-2019 CITY OF BREVARD FY 2017-2018 2016-2017 2017-2018 4/30/2018 2017-2018 2018-2019 Account Actual ($) Budget ($) Actual ($) Estimate %Remaining Requested
HACKBERRY HIDDEN COVE PUBLIC IMPROVEMENT DISTRICT NO. 2 SERVICE AND ASSESSMENT PLAN (UTILITY IMPROVEMENTS)
") HACKBERRY HIDDEN COVE PUBLIC IMPROVEMENT DISTRICT NO. 2 SERVICE AND ASSESSMENT PLAN (UTILITY IMPROVEMENTS) SEPTEMBER 15, 2009 HACKBERRY HIDDEN COVE PUBLIC IMPROVEMENT DISTRICT NO. 2 SERVICE AND ASSESSMENT
HACKBERRY HIDDEN COVE PUBLIC IMPROVEMENT DISTRICT NO. 2 SERVICE AND ASSESSMENT PLAN (UTILITY IMPROVEMENTS) SEPTEMBER 15, 2009 HACKBERRY HIDDEN COVE PUBLIC IMPROVEMENT DISTRICT NO. 2 SERVICE AND ASSESSMENT
THE TAX INCREMENT FINANCE AUTHORITY ACT Act 450 of The People of the State of Michigan enact:
 THE TAX INCREMENT FINANCE AUTHORITY ACT Act 450 of 1980 AN ACT to prevent urban deterioration and encourage economic development and activity and to encourage neighborhood revitalization and historic preservation;
CAPITAL IMPROVEMENTS ELEMENT
 Goals, Objectives and Policies CAPITAL IMPROVEMENTS ELEMENT GOAL 9.1.: USE SOUND FISCAL POLICIES TO PROVIDE ADEQUATE PUBLIC FACILITIES TO ALL RESIDENTS WITHIN THE CITY. FISCAL POLICIES MUST PROTECT INVESTMENTS
Fiscal Impact Analysis
 Fiscal Impact Analysis Waterfront West Newburyport, MA March 22, 2017 Prepared By Fougere Planning & Development, Inc. Prepared For Newburyport Manager, LLC FOUGERE PLANNING & DEVELOPMENT, Inc. Mark J.
University Link LRT Extension
 (November 2007) The Central Puget Sound Regional Transit Authority, commonly known as Sound Transit, is proposing to implement an extension of the Central Link light rail transit (LRT) Initial Segment
FY 08/09 ADOPTED GENERAL FUND REVENUES $224,391,325
 GENERAL FUND REVENUES FY 08/09 ADOPTED GENERAL FUND REVENUES $224,391,325 State Revenue 10% Transfers 1% Federal Revenue 2% Fund Balance 0.2% Other Local Revenue 3% Other Local Taxes 22% Gen. Property
City and County of San Francisco
 City and County of San Francisco Office of the Controller DRAFT FY 2015-16 Nine-Month Budget Status Report May 9, 2016 City and County of San Francisco Office of the Controller FY 2015-16 Nine-Month Budget
Town of Ramapo, New York
 Town of Ramapo, New York BASIC FINANCIAL STATEMENTS AND SUPPLEMENTARY INFORMATION FOR THE YEAR ENDED DECEMBER 31, 2015 TOWN OF RAMAPO, NEW YORK Table of Contents TABLE OF CONTENTS 2 INDEPENDENT AUDITOR
SKECHERS HERMOSA BEACH DESIGN CENTER & EXECUTIVE OFFICES
 SKECHERS HERMOSA BEACH DESIGN CENTER & EXECUTIVE OFFICES NET FISCAL IMPACT & ECONOMIC BENEFIT ANALYSIS HERMOSA BEACH, CA Prepared For: SKECHERS U.S.A., INC. Prepared By: KOSMONT COMPANIES 1601 N. Sepulveda
Self-Supported Municipal Improvement districts
 Self-Supported Municipal Improvement districts Combined Annual Report Downtown Highland Park Ingersoll Sherman Hill June 30, 2012 FAQ s What is a self-supported municipal improvement district or SSMID?