CRANE CROSSING SPECIFIC PLAN OAKDALE, CALIFORNIA
|
|
|
- Neil Hopkins
- 5 years ago
- Views:
Transcription
1 CRANE CROSSING SPECIFIC PLAN OAKDALE, CALIFORNIA PUBLIC FACILITIES FINANCING PLAN AND FISCAL IMPACT ANALYSIS Final Draft MAY 28, 2013
2
3 Crane Crossing Specific Plan Oakdale, California Public Facilities Financing Plan and Fiscal Impact Analysis Table of Contents 1. INTRODUCTION... 1 Objective...1 Project Description...2 Project Scenarios PUBLIC FACILITIES FINANCING PLAN... 6 Facility Needs and Cost Estimates...6 Financing Mechanisms...7 Project Feasibility FISCAL IMPACT ANALYSIS Methodology...13 Major Assumptions...15 Fiscal Revenues...16 Fiscal Expenses...20 Net Fiscal Impacts CONCLUSIONS Public Facilities Financing...23 Fiscal Impacts...25 REPORT TABLES & FIGURES REPORT TABLES Table 2-1: Infrastructure Cost Estimates by Development Area... 6 Table 2-2: Infrastructure Cost Estimates by Funding Category... 7 Table 3-1: Summary of Net Fiscal Impacts REPORT MAPS Local Vicinity Map... 3 Land Use Map... 4
4 APPENDICES APPENDIX 1 DETAILED FACILITIES COST ESTIMATES (FROM G&K)... A-1 APPENDIX 2 FISCAL IMPACT ANALYSIS TABLES Table 1: Summary Results of Fiscal Impact Analysis... A-8 Table 2: City Population and Employment, A-9 Table 3: Market Assumptions by Land Use... A-10 Table 4: New Service Population and Real Estate Development Detail... A-11 Table 5: City of Oakdale Gross Expenditures FY A-12 Table 6: City of Oakdale Expenditures per Person Served FY A-13 Table 7: Fiscal Impacts of New Development... A-14 Table A1: City of Oakdale Gross Revenues FY A-15 Table A2: City of Oakdale Gross Revenues per Capita FY A-16 Table A3: Property Tax Allocation, Estimated... A-18 Table A4: CFD No (Public Safety Services) Revenue... A-19 Table A5: Sales and Use Tax Assumptions... A-20 Table A6: Sales Tax Analysis... A-21 Table A7: Property Transfer Tax Revenue... A-22 Table A8: Property Tax In-Lieu of Vehicle License Fee Revenues... A-23 APPENDIX 3 INFRASTRUCTURE COST ESTIMATES FOR EXISTING DEV T... A-24 APPENDIX 4 ANDERSON HOMES REIMBURSEMENT AGREEMENT MAPS... A-27 APPENDIX 5 WEST F STREET LBD MAP... A-30
5 Chapter 1 INTRODUCTION OBJECTIVE This report analyzes the public facilities burden that must be carried by the land uses proposed in the Crane Crossing Specific Plan (Specific Plan, CCSP, or Project) and the potential recurring fiscal impacts to the City of Oakdale (City) from the development proposal. The CCSP is a public policy document that sets guidelines for the long-term use of land within the Project area. Similarly, the Public Facilities Financing Plan (PFFP or Finance Plan) and Fiscal Impact Analysis (FIA) provide a long-term look at the burdens associated with providing infrastructure to the CCSP area and the annual fiscal impacts that will be generated by the Project once it is built out. The Finance Plan identifies infrastructure required to serve the Project, its corresponding costs, and implementation measures to ensure those costs are funded. It represents the culmination of a cooperative process that involved public and private participants with interests in the CCSP. The Finance Plan will serve as a blueprint to guide individual development applications and ensure that future development conforms to the strategy outlined in this Finance Plan. The Finance Plan also includes a brief summary of overall project feasibility. As development progresses, the timing and mix of costs and funding sources may change. Furthermore, the costs and infrastructure obligations are estimates at this time, and demonstrate one approach to fund required infrastructure needs; actual results may be different. However, regardless of the extent to which proposed financing mechanisms are used or other financing mechanisms are introduced later in the Project, the feasibility of the overall burden has been evaluated. The PFFP is a planning document that includes a proposed financing strategy for the Project; it does not commit the City or landowners to a specific financing obligation. Furthermore, the PFFP does not establish any impact fees. Adoption of any development impact fee program to fund CCSP infrastructure needs can only occur after a comprehensive update of the City s Capital Facilities Fee (CFF) Program has been completed. The Fiscal Impact Analysis establishes the fiscal feasibility for the City by analyzing the potential recurring fiscal impacts to the City produced by new development. The analysis compares the annual costs of providing public services to the annual revenues that will be generated by new development to determine the net fiscal impact. Districts and funds supported by development fees and user charges (e.g., enterprise funds), state funding (e.g., school districts), or a specific allocation of property taxes (e.g., school districts, irrigation districts, mosquito abatement districts) are not included in the analysis. This report focuses solely on the fiscal impacts to the City s General Fund, Development Services Fund, and Engineering & Public Works Fund. CCSP Financing Plan & Fiscal Impact Analysis 1 May 28, 2013
6 In summary, this report does the following: Describes the proposed land uses as well as developed value and demographic assumptions Summarizes public facilities required to serve future development in the CCSP area Presents the costs of required public facilities and assigns the costs to one of three funding categories (i.e., CFF Program, CCSP Fee Program, and Developer funded intract costs) Summarizes the financial feasibility of the Project Projects the annual fiscal revenues to the City s General Fund, Development Services Fund, and Engineering & Public Works Fund generated from the Project Projects the annual fiscal expenses incurred by the City s General Fund, Development Services Fund, and Engineering & Public Works Fund to provide services to the Project PROJECT DESCRIPTION The City lies in the northeastern portion of Stanislaus County, approximately 11 miles northeast of Modesto in California s agricultural Central Valley. Regionally, Sacramento is located approximately 60 miles to the north and San Francisco is approximately 125 miles to the west. The Project consists of approximately 262 total acres located on the western edge of the City. The CCSP includes approximately 252 acres of new development, which are incorporated into the PFFP and FIA. The remaining ten acres comprise 28 existing homes and are not included in this study. The CCSP area is located approximately two miles west of Downtown Oakdale along Highway 108/West F Street and consists of two separate geographic areas, linked by Crane Road. Planning Area 1, the North Development Area, is approximately 171 gross acres (161 gross acres of new development and ten gross acres of existing development) and is located north of Pontiac Street, east of its intersection with Crane Road. Planning Area 3, the South Development Area, is approximately 92 gross acres and is located along the north side of Highway 108/West F Street, at its intersection with Crane Road. For purposes of this analysis, the estimated gross acreage does not include the acreage associated with major roads, parks, and open space. Unless otherwise indicated, the terms gross acres and acres are used interchangeably throughout the remainder of this report. A local vicinity map showing the boundaries of the North Development Area and South Development Area as well as the entire CCSP area is included on the following page. CCSP Financing Plan & Fiscal Impact Analysis 2 May 28, 2013
, low density residential (LDR), and")
7 Land Uses At buildout, the Project is expected to include 1,011 new residential units and approximately 710,500 square feet of non-residential development. A total of 658 new residential units on approximately 130 acres is proposed for the North Development Area, which will include very low density residential (VLDR), low density residential (LDR), and medium density residential/flex use (MDR). There are currently 28 existing VLDR units in the North Development Area, but the existing units are excluded from the analyses because these units are served by existing infrastructure. The South Development Area is expected to include 353 LDR, MDR, and high density residential (HDR) units on approximately 36 acres. In addition, the CCSP Financing Plan & Fiscal Impact Analysis 3 May 28, 2013

8 South Development Area is anticipated to included approximately 710,500 square feet of general commercial and flex use/general commercial land uses that are anticipated to develop on approximately 54 gross acres. It is assumed that the general commercial land uses will be comprised of an evenly distributed mix of retail and other commercial uses based on a cursory market analysis that was prepared as part of the City s current General Plan Update. A map of the various land uses within the Project is included below. Table 4 of Appendix 2 (i.e., FIA tables) summarizes the proposed development for the north and south areas as well as the entire CCSP area. Estimated Market Values Estimated market values for each residential and non-residential land use category reflect values used in the City s General Plan Update Fiscal Impact Analysis (General Plan FIA), dated April 15, Average values of $350,000 per very low density residential unit, $300,000 per CCSP Financing Plan & Fiscal Impact Analysis 4 May 28, 2013
9 low density residential unit, $240,000 per medium density residential unit, $150,000 per high density residential unit, and $200 per building square foot of general commercial and flex use/general commercial uses are incorporated into the PFFP and FIA. These values are shown in Table 3 of Appendix 2. Demographic Assumptions It is anticipated that development will result in approximately 2,741 new residents and 2,205 employees at Project buildout. The North Development Area is anticipated to generate approximately 1,829 new residents at buildout, while the South Development Area is anticipated to generate approximately 912 new residents and 2,205 employees at buildout. Population and employment estimates for each development area are presented in Table 4 of Appendix 2. Population per household and square feet per job assumptions for each development area are provided in Table 3 of Appendix 2. PROJECT SCENARIOS Two development scenarios are incorporated into the PFFP and FIA. The first scenario evaluates the financial viability and potential recurring fiscal impacts associated with new growth in the North Development Area only. The second scenario analyzes feasibility and fiscal impacts associated with new growth in the South Development Area only. The tables in Appendix 1 and Appendix 2 are explained in detail in this report. In many instances, information for both scenarios, and in some instances the sum of the two scenarios, is presented on one table in order to easily compare the results across development scenarios. In addition to the land use assumptions of each development scenario being different, Giuliani & Kull, Inc., the Project engineer, identified certain infrastructure costs that benefit both the North and South Development Areas. Specifically in regards to the PFFP, certain storm drainage and sewer improvements are required to be constructed regardless which scenario is being analyzed. Therefore, these improvement costs are applicable to both the North and South Development Areas irrespective of the development scenario. In order to avoid any potential overlaps in infrastructure costs between the North Development Area and the South Development Area, a cost sharing agreement should be developed in the future for improvement costs that apply to both the North and South Development Areas. CCSP Financing Plan & Fiscal Impact Analysis 5 May 28, 2013
10 Chapter 2 PUBLIC FACILITIES FINANCING PLAN FACILITY NEEDS AND COST ESTIMATES The Crane Crossing Specific Plan describes in detail the water, storm drainage, sewer, irrigation, street, and park improvements proposed to meet the needs of the community. The Specific Plan also includes a series of maps and exhibits for all Project-specific infrastructure needed to serve future development within the Project area. Giuliani & Kull, Inc., provided preliminary cost estimates for the entire CCSP area as well as separately for the North and South Development Areas. A mark-up of 35% is applied to all facility costs to account for soft-costs such as design and engineering, construction management, facility inspection, and cost contingencies. The total cost of backbone infrastructure required for the entire CCSP area is estimated to be approximately $17.8 million. Giuliani & Kull also organized each infrastructure item into one of three funding categories: CFF; CCSP; or in-tract. These categories are described more fully below, but they essentially relate to infrastructure that would be included in the City s capital facilities fee program (CFF), that would be part of a newly-created fee program unique to the specific plan area, or that would be constructed as homebuilders and commercial/industrial developers install subdivision or in-tract improvements. A summary of the required infrastructure costs, including a 35% mark-up for contingency and soft costs, to serve the Project by development area and by funding category are presented in Table 2-1 and Table 2-2 below. Detailed cost estimates from Giuliani & Kull, Inc., are presented in Appendix 1. TABLE 2-1 INFRASTRUCTURE COST ESTIMATES BY DEVELOPMENT AREA ($ IN MILLIONS) North Development Area South Development Area Improvement Water $2.2 $0.5 $2.7 Storm Drainage 1 $2.0 $1.4 $3.3 Sewer 1 $0.5 $0.3 $0.7 Irrigation $1.4 $0.0 $1.4 Street 2 $3.3 $1.9 $5.1 Park $4.1 $0.5 $4.6 Total 3 $13.5 $4.6 $17.8 Total Cost 1 Includes costs required to serve both the North Development Area and South Development Area; however, they are only accounted for once in the total cost. 2 Includes costs related to entries, trails, and open space as well as dry utilities. 3 Totals may not sum due to rounding. CCSP Financing Plan & Fiscal Impact Analysis 6 May 28, 2013
11 TABLE 2-2 INFRASTRUCTURE COST ESTIMATES BY FUNDING CATEGORY ($ IN MILLIONS) Improvement CFF Costs CCSP Costs In-Tract Costs Total Costs 2 Water $2.6 $0.0 $0.1 $2.7 Storm Drainage $3.0 $0.2 $0.1 $3.3 Sewer $0.1 $0.0 $0.5 $0.7 Irrigation $0.0 $0.0 $1.4 $1.4 Street 1 $2.1 $0.8 $2.2 $5.1 Park $4.6 $0.0 $0.0 $4.6 Total 2 $12.4 $1.0 $4.3 $ Includes costs related to entries, trails, and open space as well as dry utilities. 2 Totals may not sum due to rounding. In addition to the Project-specific infrastructure costs identified in the tables above, certain infrastructure will be required to serve existing development within the Project area. While these infrastructure costs are not included in the feasibility analysis, they have been identified by Giuliani & Kull, Inc., and are presented in Appendix 3. FINANCING MECHANISMS Several different funding mechanisms will likely be used to pay for public facilities required to serve new development within the Project area. Impact fees, land-secured bonds, and other funding alternatives must be analyzed in detail prior to development. However, for purposes of this Finance Plan, all required infrastructure is categorized into one of three funding categories (i.e., CFF Program, CCSP Program, developer equity/private financing for in-tracts). The primary features of each funding category and its potential application to the CCSP area are discussed below. Development Impact Fees Assembly Bill 1600 (AB 1600), which was enacted by the State of California in 1987, created Section et seq. of the Government Code. In order to establish, increase, or impose a fee as a condition of approval of a development project, AB 1600 (also known as the Mitigation Fee Act) requires a public agency to specifically identify the public facilities funded by the impact fees, and determine how there is a reasonable relationship, or nexus, between the type of development project and the need for the facilities, the cost of the facilities, and the need to impose a fee. In addition, the City adopted Ordinance No on September 4, 2012, to amend Title 31 of the Oakdale Municipal Code. The Ordinance allows the City to establish a local benefit district to reimburse developers who are required to construct sewer, water or storm drain mains, street and traffic control improvements, or other appurtenant features that benefit property outside of a proposed development project. CCSP Financing Plan & Fiscal Impact Analysis 7 May 28, 2013
12 Development impact fees are monetary exactions (other than taxes or special assessments) that are charged by local agencies in conjunction with approval of a development project. The fees are paid by builders or developers, typically at the time a building permit is issued. Impact fees are levied for the purpose of defraying all or a portion of the costs of a public facility, improvement, or amenity that benefits the Project. The collection of impact fees does not require formation of a special district; an impact fee program is implemented by a public agency s adoption of a resolution or ordinance. Further, the City impact fees will be an important component of this Finance Plan. Once the CCSP area is annexed into the City, a fee ordinance may need to be adopted (or a development agreement would need to be executed) by the City and the City s existing capital facilities fee program should be updated prior to development of the Project; fee programs may also be updated and revised as part of future development phases. Because fees are collected as development occurs and many of the facilities identified in this report are expected to be in place prior to development, fee revenues collected in future years may be used to reimburse developers that have paid to cover more than their fair share of Project costs prior to the availability of fee revenues. 1. CFF Program Development in the CCSP area is expected to participate in the City s Capital Facilities Fee (CFF) Program. The City of Oakdale CFF Program includes components to fund various types of infrastructure, public facilities, and equipment that will serve future development in the City and will provide a City-wide benefit. As shown in Table 2-2 and Appendix 1, approximately $12.4 million of infrastructure costs required to serve the Project is anticipated to be funded through the CFF Program. However, the City will need to conduct a comprehensive update of the CFF Program to ensure that the Project s required infrastructure needs are incorporated. Potential overlaps between infrastructure included in the CFF Program and that included in the proposed CCSP Fee Program should be resolved as part of the CFF update. The CFF Program update will also need to address how land costs associated with regional road right-of-way acquisition, water well and tank facilities, storm drainage infrastructure, and various other public improvements will be treated, as well as how the need for a second pipeline crossing will be handled. Any CCSP infrastructure included in the CFF Program will be treated in the same manner as existing CFF improvements. For example, if the CFF Program currently funds the cost of wells elsewhere in the City, then wells needed to serve development in the CCSP would also be funded by the CFF Program. In addition, a separate storm drainage zone may be created in the CFF Program to fund storm drainage facilities within the CCSP to be consistent with the treatment of other storm drainage systems within the existing CFF Program. However, certain CCSP improvements may be needed prior to when sufficient CFF revenue is available to fully fund the needed improvements. In the event that CFF revenues are not sufficient, the Project developer will be required to construct the required improvements and be reimbursed through the CFF Program as development within the Project and around the City occurs. CCSP Financing Plan & Fiscal Impact Analysis 8 May 28, 2013
13 2. Proposed CCSP Fee Program Certain types of infrastructure provide a general benefit to the entire CCSP, but they do not provide a general benefit to the entire City. Consequently, these types of Projectspecific infrastructure cannot be included in the CFF Program. One potential source of funding for Project-specific improvements will be a Project-specific fee program. The proposed CCSP Fee Program is anticipated to fund approximately $1.0 million in storm drainage and street improvements, as shown in Table 2-2 and Appendix 1. The proposed CCSP Fee Program will need to be adopted by the City prior to development to ensure full participation from the entire CCSP area and that everyone within the Project pays their fair share of required facilities costs. New development in the CCSP will be subject to costs associated with preparation and adoption of the Specific Plan and related documents, estimated at a total amount of $750,000. This cost would be spread to all land uses within the CCSP. CCSP development will also be subject to costs associated with agricultural land mitigation. It is estimated that approximately 131 acres of farmland in the CCSP area will be converted to residential land uses, and that total agricultural land mitigation costs will amount to approximately $1.0 million. This cost would be allocated to all residential land uses within the CCSP. Specific Plan preparation costs and agricultural land mitigation costs are likely to be included in the CCSP Fee Program. 3. Other Fee Programs Lastly, development in the CCSP area is expected to participate in development impact fee programs administered by other public agencies, including the County Public Facilities Fee (PFF) Program, Oakdale Joint Unified School District fee program, as well as fees specified in reimbursement agreements for improvements that benefit all, or a portion, of the Project area. Specifically, a majority of the North and South Development Areas is subject to additional fees based on an existing reimbursement agreement between the City and Anderson Homes. Furthermore, a majority of the South Development Area is subject to additional fees through a local benefit district established by the City for West F Street infrastructure costs incurred by FCB Homes. Maps of specific properties subject to the Anderson Homes reimbursement agreement and the West F Street Local Benefit District (LBD) are included in Appendix 4 and Appendix 5, respectively. The Finance Plan assumes the Project will pay the applicable fees imposed during the construction and permitting process. Developer Equity/Private Financing In addition to improvements anticipated to be funded by the City s CFF Program and proposed CCSP Fee Program, this analysis includes improvements that are classified as in-tract improvements. In-tract improvements are commonly referred to as subdivision or discretionary permit infrastructure, and include local water, storm drainage, sewer, irrigation, and street CCSP Financing Plan & Fiscal Impact Analysis 9 May 28, 2013
14 improvements within a single subdivision project. These improvements serve a given subdivision or development and are commonly provided as a condition of development. In-tract improvements are typically incurred and funded privately by developers, together with the costs related to vertical construction of homes and commercial buildings. Developers build these costs into their private pro forma cash flow analyses as individual lot costs, and do not receive fee credits or reimbursements for these costs. Approximately $4.3 million in in-tract improvement costs is assumed to be installed by developers and dedicated to the City. Mello-Roos Community Facilities District The Mello-Roos Community Facilities Act (Act) [Section et seq. of the Government Code] was enacted by the California State Legislature in 1982 to provide an alternate means of financing public infrastructure and services subsequent to the passage of Proposition 13 in Complying with Proposition 13, and with Proposition 218 passed in 1996, the Act permits cities, counties, and special districts to create defined areas within their jurisdiction and, by a two-thirds vote within the defined area, impose special taxes to pay for the public improvements and services needed to serve that area. The Act defines the area subject to a special tax as a Community Facilities District (CFD). A CFD may provide for the purchase, construction, expansion, or rehabilitation of any real or other tangible property with an estimated useful life of at least five years. A CFD may also finance the costs of planning, design, engineering, and consultants involved in the construction of improvements or formation of the CFD. The facilities financed by the CFD do not have to be physically located within the CFD. The facilities that can be financed by a CFD include, but are not limited to, the following: Roads, water and sewer lines, flood control channels Local park, recreation parkway, and open-space facilities School sites, structures, furnishings, and equipment Libraries Child care facilities Dry utility improvements (limited to five percent of bond proceeds if improvements are to be taken over by a non-publicly owned utility agency) Any other governmental facilities which the legislative body creating the CFD is authorized by law to contribute revenue to, construct, own, or operate A CFD may also pay for public services, including the following: Road maintenance Police protection Fire protection Recreation program services Library services CCSP Financing Plan & Fiscal Impact Analysis 10 May 28, 2013
15 Park and open space maintenance Flood and storm protection services Removal or cleanup of hazardous substances Sandstorm protection Seismic retrofitting School facilities maintenance A CFD may only finance the services mentioned above to the extent that they are in addition to those provided in the area before the CFD was created and may not supplant services already available within that area. There are two limitations on the amount of financing available from a CFD, the first being the value-to-lien-ratio. Value is considered to be the appraised value of the property, including entitlements and improvements in place on the date the CFD bonds are to be sold. The value of improvements to be constructed with bond proceeds is included in the value calculation. Lien refers to the proposed bond issue, as well as any other debt secured by the property. Senate Bill 1464, which became effective January 1993, requires a minimum value-to-lien ratio of 3:1. The second restriction on the amount of financing available from a CFD is the total effective tax rate (ETR) paid by a homeowner or property owner in the CFD. The ETR consists of the basic one percent ad valorem property tax levy mandated by Proposition 13, plus overrides from voter-approved bonded indebtedness and non-ad valorem taxes, assessments, and parcel charges (expressed as a percentage of market value). Market value can be determined based on input from local developers, a market consultant, local realtors, or an appraiser. There is no legal limit, but a maximum ETR of 2.00% of market value has developed as a standard for residential development in many areas throughout the State, although it tends to be closer to 1.80% in northern California and even lower in some areas of the Central Valley. It is thought that ETRs higher than these amounts may lead to market resistance by prospective homebuyers, or potential taxpayer revolts by overburdened homeowners. The maximum supportable ETR for a given project should also consider the maximum tax rates paid by homes in competing projects in the area and, based on the strength of the real estate market, the demand for homes in general. Formation of a CFD authorizes a public agency to levy a special tax on all taxable property within the CFD in the manner prescribed in the formation documents. Property owned or irrevocably offered to a public agency may be exempted from the special tax. Mello-Roos special taxes are collected at the same time and in the same manner as property taxes, unless otherwise specified by the agency. Special tax revenues may be used to pay debt service on bonds sold or may also be used to pay directly for facilities and public services. CFD bonds can be short- or long-term obligations. Typically, long-term bonds have either a twenty-five or thirty year maturity. Short-term notes or bonds can be issued to provide interim funding; these obligations are then retired when another source of revenue becomes available. CCSP Financing Plan & Fiscal Impact Analysis 11 May 28, 2013
16 Due to the flexibility associated with the Act and the wide range of facilities that can be funded by it, it is likely that CFD bonds will be used to fund facilities within the CCSP area and help fill funding gaps. Developers will want to ensure that special tax levels are competitive with other areas of the City and with surrounding jurisdictions. The City will want to ensure that special taxes are collected and bonds repaid in a timely manner as promised to bond investors. Note that, depending on land values, development status, infrastructure phasing requirements, and other factors, multiple series of bonds may need to be issued over time rather than one bond issue occurring when the Project starts. Any initial bond issue may be constrained by the appraised value of the land in the CFD and market interest rates at the time bonds are sold. PROJECT FEASIBILITY Most of the facilities identified in Appendix 1 are generally required to be in place prior to any development. However, the actual facilities needed will depend on the development scenario that occurs. This Finance Plan does not include a detailed feasibility analysis based on the specific infrastructure costs identified in Appendix 1; however, a detailed feasibility analysis was prepared for the Project based on similar infrastructure needs and costs. That detailed feasibility analysis indicated that the North and South Development Areas separately, as well as the overall CCSP area, appear to be financially feasible. The Project changes reflected in this version of the report do not appear to adversely affect the overarching feasibility findings from that original analysis; in fact, it is likely that the Project is even more feasible now than it was estimated to be when that original analysis was conducted. Financial feasibility of proposed development is based on a common test used to gauge Project feasibility: the burden-to-value ratio. While there are no results from this test that guarantee Project feasibility, a burden-to-value ratio that is no more than 15% to 20% in this area of the Central Valley is typically considered feasible. The ratios for each land use designation within each development area fell either below or within this range. CCSP Financing Plan & Fiscal Impact Analysis 12 May 28, 2013
17 Chapter 3 FISCAL IMPACT ANALYSIS Fiscal impacts arising from land development can be categorized broadly as either one-time impacts or recurring impacts, both of which involve a revenue and expense component. For example, a development project may create the need for a police substation, and the one-time construction cost of the station may be offset by a development impact fee; these costs and revenues would be included in a public facilities financing plan. The annual expenses associated with staffing and maintaining the police substation may be offset by annual property taxes and other revenues generated by new development to the City; these costs and revenues are part of a fiscal impact analysis. The fiscal impacts evaluated in this report are the annual, or recurring, revenues and expenses that affect the City as a result of new development associated with the proposed Project. METHODOLOGY The fiscal analysis compares the annual costs of providing public services against the annual revenues that will be generated by new development to determine the net fiscal impact. This FIA focuses solely on the fiscal impacts to the City s General Fund, Development Services Fund, and Engineering & Public Works Administration Fund. Two methodologies are employed in estimating recurring fiscal impacts. First, the case study method is used to estimate recurring revenues and expenses by applying defined service standards, existing tax and fee rates, and suggested operating and maintenance costs to the land uses and services proposed in the Project. The second methodology used is the multiplier method, which assumes that fiscal impacts will result from proposed development at forecasted rates per person served based on historical averages for the City. The City s budgets from fiscal years through are used to estimate average revenues and expenses. The case study and multiplier methods are generally used under the following conditions: Case Study Method 1. Marginal cost is a better approximation of the actual costs to provide similar services. 2. The land use distribution of the project being analyzed does not resemble the land use distribution within the public agency s area. 3. Service standards and estimated future costs for new projects are anticipated to be different than they are now. Multiplier Method 1. Average cost is a reasonable approximation of the actual costs to provide similar services to specific developments in future years. CCSP Financing Plan & Fiscal Impact Analysis 13 May 28, 2013
18 2. Specific revenues and expenses are generated based on population (e.g., gas taxes, social services). 3. Service standards and other information are not available or accurate. The multiplier method relies on a persons served factor, which is most often the sum of all residents plus a certain percentage of employees. The exact relationship of service demands and revenue potential between residents and employees is difficult to measure, but a service population comprised of all residents and 31% of employees is utilized in this analysis. The 31% ratio suggests that a resident generally has approximately three times the impact of an employee. For example, employees are assumed to be in the City for 2,080 hours per year (based on 52 weeks per year for five days a week for eight hours a day) while residents are assumed to be in the City for 6,656 hours per year (based on 52 weeks per year for seven days a week for 16 hours a day, plus 52 weekends in a year for 2 days a week for eight hours a day). The ratio of employee hours to resident hours is approximately 31%. Table 2 in Appendix 2 presents historical demographic and employment statistics in the City, ranging from 2004 through 2011, and includes the number of persons served. Case study and multiplier approaches are used to estimate different recurring fiscal impacts for new development as listed in the following table: CITY OF OAKDALE Case Study Method Multiplier Method Property Tax CFD No (Public Safety Services) Sales & Use Tax Public Safety Sales Tax Real Property Transfer Tax Property Tax In-Lieu of Vehicle License Fees Recurring Revenues Gas Tax Hotel Motel Tax Business License Fees Franchise Fees & Other Taxes Licenses & Permits Fines, Forfeitures & Penalties Other Intergovernmental Charges for Services Other Revenues Transfers In Development Services Fund Revenues Engineering & Public Works Administration Fund Revenues Recurring Expenses General Government Fire Police Parks & Community Services Public Works Development Services Fund Expenses Engineering & Public Works Administration Fund Expenses CCSP Financing Plan & Fiscal Impact Analysis 14 May 28, 2013
19 MAJOR ASSUMPTIONS Many assumptions are factored into the analysis of fiscal impacts. Pursuant to the scope of work for this Project, the FIA incorporates general assumptions, methodologies, and formats reflected in the City s General Plan Update Fiscal Impact Analysis (General Plan FIA) dated April 15 th, A brief summary of the most critical assumptions, in terms of their effect on revenues and expenses, are delineated below: 1. The projected annual fiscal impacts are presented in current year 2012 dollars. Future impacts could be escalated by an inflation factor that is tied to an appropriate inflation index such as the Engineering News Record (ENR) index or one of the regional consumer price indexes (CPI). 2. A summary of the land use, value, and related assumptions that are incorporated into the fiscal analysis for each development scenario is presented in Tables 3 and 4 of Appendix 2. An important assumption that affects property tax and property tax in lieu of vehicle license fees is the estimated value of dwelling units and non-residential development in the Project. Average values of $350,000 per very low density residential unit, $300,000 per low density residential unit, $240,000 per medium density residential unit, $150,000 per high density residential unit, and $200 per building square foot of general commercial and flex use/general commercial uses are incorporated into the FIA. 3. Legal actions taken at the state level in the 1990s diverted a percentage of the 1.0% property tax into the Educational Revenue Augmentation Fund (ERAF). For purposes of the fiscal analysis, it is assumed that this situation will continue in future years. 4. The Project is currently located in unincorporated Stanislaus County within Tax Rate Area ; however, it is expected to annex into the City limits before development begins. Pursuant to the Property Tax Sharing Agreement between the City of Oakdale and the County of Stanislaus, the City will receive 30% of the County General Fund allocation of the 1% property tax associated with future incremental property tax revenue while the County will retain the remaining 70% upon annexation of the development area. In addition, the City will receive 100% of property tax allocations to the Oakdale Fire District. The resulting allocation of the 1% property tax redistributed to the City General Fund (post ERAF) is projected to be 8.47% of the 1% property tax, as shown in Table A3 of Appendix Fiscal revenue and expense standards reflect historical averages of revenues and expenses based on eight City budgets, ranging from fiscal year through fiscal year By using historical averages for revenues and expenses that capture periods of economic expansion and contraction, this analysis also accounts for potential economic and real estate cycles that may occur during development of the Project. CCSP Financing Plan & Fiscal Impact Analysis 15 May 28, 2013
20 Not all assumptions and methodologies incorporated into the General Plan FIA apply to the CCSP FIA or reflect current laws and regulations. Important changes reflected in the CCSP FIA include the following: 1. Revised employment statistics from the California Employment Development Department. 2. Resident and employment generation rates for medium density residential units and non-residential uses. 3. Incorporating fiscal impacts to the City s Development Services Fund as well as Engineering & Public Works Fund. 4. Revised methodologies to estimate Business License (i.e., based on employees) and Gas Tax (i.e., based on residents) revenues. 5. Measuring taxable sales based on the supply of retail square footage planned within the Project as opposed to measuring it based on the demand for retail generated by the Project. 6. Eliminating revenue associated with the remaining vehicle license fee pursuant to Senate Bill 89. FISCAL REVENUES The City will provide the vast majority of public services to the Project. The City s General Fund, Development Services Fund, and Engineering & Public Works Fund are the primary discretionary funds that will be impacted by new development proposed by the Project and, as a result, are the only funds estimated in this study. As shown in Table 7 of Appendix 2, the annual fiscal revenues generated by the Project at buildout are estimated to be approximately $2.3 million, which includes approximately $0.9 million for the North Development Area and approximately $1.4 million for the South Development Area. Secured Property Tax Property taxes, which are based on assessed valuation, are distributed to public agencies and special districts based on the allocation factors of the applicable Tax Rate Area (TRA). At the time this fiscal impact analysis was prepared, the Project was located within TRA Table A3 in Appendix 2 identifies the allocation factors of the 1% property tax to the various districts, funds, and agencies in the TRA. The tax allocations for the County General Fund and Oakdale Fire District Fund are adjusted to reflect the allocation to the City of Oakdale upon property annexation, pursuant to the Property Tax Sharing Agreement between the City of Oakdale and the County of Stanislaus. Furthermore, the total tax allocation is adjusted to reflect the actual allocation distributed to the City General Fund after revenues have been shifted to the Educational Revenue Augmentation Fund (ERAF). For purposes of the fiscal analysis, it is assumed that this shift will continue into the future. CCSP Financing Plan & Fiscal Impact Analysis 16 May 28, 2013
21 The resulting allocation of the 1% property tax redistributed to the City General Fund (post ERAF) is 8.47% of the 1% property tax. The property tax allocation of the 1% basic property tax is applied to the estimated assessed value created by the Project. Total annual secured property tax revenues for the North Development Area, South Development Area, and entire CCSP area are shown in Table 7 of Appendix 2. CFD No (Public Safety Services) The City established the City of Oakdale Community Facilities District No (Public Safety Services) (CFD No ) through adoption of Resolution No on May 7, CFD No provides funding for public safety services, including fire services, law enforcement, code enforcement, and animal control. It is assumed that the Project will annex into CFD No prior to development and pay the annual special tax, which is currently $452 per single family unit and $301 per high density unit; there is no CFD No special tax for non-residential property, as shown in Table A4 in Appendix 2. Sales and Use Tax Several methodologies can be used to estimate taxable sales. One method measures taxable sales based on the supply of retail square footage. Under this approach, a taxable sales per square foot estimate is multiplied by the total retail square footage planned for a project. Another approach looks at the demand side of the equation. Under that approach, household income, percentage of household income spent on taxable goods and services, and a taxable sales capture rate for the City are estimated to determine taxable sales. The supply side approach, which simply counts taxable sales where point-of-sale transactions occur, is the more conservative of the two approaches and is the one used in this analysis. Of course, a significant portion of the taxable sales captured by the retail square footage developed in the Project will be generated by new residential development that also occurs in the Project. The industry standard for development projects in nearby areas is approximately $250 of taxable sales per square foot of retail use, which is multiplied by approximately 195,000 building square feet of retail uses in the South Development Area to produce approximately $48.8 million in taxable sales. Other general commercial and flex/general commercial land uses are assumed to produce only minimal taxable sales (from a few point-of-sale businesses operating out of office space) estimated to be $5 per square foot, which is multiplied by approximately 515,000 building square feet of these uses in the South Development Area to produce approximately $2.6 million in taxable sales. These assumptions are presented in Tables A5 and A6 of Appendix 2. Based on the supply side approach, no taxable sales are anticipated to be generated in the North Development Area. In addition to the 1.0% local sales tax, the City also receives a portion of the County s and State s pooled revenues. When a sale cannot be identified with a permanent place of business in this state, the local sales tax is allocated to the local jurisdictions through countywide or statewide pools. Accordingly, certain sellers are authorized to report their local sales tax either on a countywide or statewide basis. These may include auctioneers, construction contractors CCSP Financing Plan & Fiscal Impact Analysis 17 May 28, 2013
22 making sales of fixtures, catering trucks, itinerant vendors, vending machine operators, and other permit holders who operate in more than one local jurisdiction, but are unable to readily allocate taxable transactions to particular jurisdictions. Use tax is also allocated through a countywide pool. Examples of taxpayers who report use tax allocated through the countywide pool include out-of-state sellers who ship goods directly to consumers in the state from a stock of goods located outside the state, and California sellers who ship goods directly to consumers in the state from a stock of goods located outside of the state. The countywide pools are prorated, first among the cities and the unincorporated area of each county using the proportion that the identified tax for each city and unincorporated area of a county bears to the total identified for the county as a whole. Next, the combined total of the direct sales tax allocation and the prorated countywide pool amount is used to allocate the statewide pool amount to each city and county. Furthermore, cities often make agreements to pay for services provided by the county in which the city is located, by providing a percentage of the city s local tax directly to the county in-lieu of writing a check. The city must enact an ordinance reducing the local sales and use tax rate by the amount that will be defaulted to the county. Based on data from the State Board of Equalization, the City of Oakdale s share of revenues from the pooled funds is approximately 11.2% of its local sales tax revenue. In addition, Oakdale currently receives 95% of the 1% local tax imposed in the City and the County of Stanislaus receives the other 5%. These factors are presented in Table A5 of Appendix 2. It is assumed that these percentages will continue to be received in the future; therefore, these revenues are incorporated into the analysis, as shown in Table A6 of Appendix 2. Public Safety Sales Tax Proposition 172 created a one-half cent sales tax for local public safety. Each county allocates Proposition 172 revenues to each city in that county based on their proportionate share of net property tax loss due to ERAF. A figure of 0.40% is used to calculate the percentage of public safety sales tax revenue accruing to the City of Oakdale, as shown in Table A5 of Appendix 2. Real Property Transfer Tax When a residential dwelling unit or non-residential structure is sold within a city, a tax representing a small percentage of the value is generally transferred to a fund to be split between the city and the county in which it resides. As shown in Table A7 of Appendix 2, the current rate in Oakdale is $0.55 per $500 of value, and the City receives 50% of the amount generated from real property transfers. Property Tax In-Lieu of Vehicle License Fees The City s net assessed value for the tax roll and property tax in lieu of VLF for were obtained from the County Auditor-Controller s office and are shown in Table A8 of Appendix 2. The property tax in lieu of VLF allocated to the City as a result of growth in the North Development Area, South Development Area, and entire CCSP area can be calculated by increasing the City s allocated property tax in lieu of VLF amount in proportion to the CCSP Financing Plan & Fiscal Impact Analysis 18 May 28, 2013
23 increase in the assessed value from each development scenario. The property tax in lieu of VLF estimate for each development area is summarized in Table A8 of Appendix 2. Fiscal Revenues Estimated Using the Multiplier Method Of the various revenue sources itemized in Table 7 of Appendix 2, twelve are calculated using the multiplier method. Gross revenues from fiscal years through as well as the 8-year average are shown in Table A1 of Appendix 2, while the resulting multipliers are shown in Table A2 of Appendix 2. These multipliers are applied to the appropriate residents, employees, or persons served estimate for each calculation, and are summarized in Table 7 of Appendix 2. Gas tax revenues are based on the number of residents within the City. Hotel and motel tax revenues relate to residential and non-residential land uses; therefore, an average charge per person served is used to determine additional revenue in this category. Business license fee revenues are based strictly on an employee multiplier. Franchise fees and other taxes relate to residential and non-residential land uses; therefore, an average charge per person served is used to determine additional revenue in this category. Licenses and permits relate to residential and non-residential land uses; therefore, an average charge per person served is used to determine additional revenue in this category. Both residents and businesses generate various fine revenues; therefore, the multiplier for fines, forfeitures, and penalties is calculated on a persons served basis. Revenue from other agencies (intergovernmental) is calculated on a persons served basis. Service charges relate to both residents and employees; therefore, an average charge per person served is used to determine additional revenue in this category. The multiplier for other revenues is calculated on a persons served basis. The multiplier for transfers in to the General Fund from other City departments is calculated on a persons served basis. Development Services Fund charges relate to both residents and employees; therefore, an average amount per person served is used to determine additional revenue in this category. Engineering & Public Works Administration Fund services charges relate to both residents and employees; therefore, an average amount per person served is used to determine additional revenue in this category. CCSP Financing Plan & Fiscal Impact Analysis 19 May 28, 2013
24 FISCAL EXPENSES Each development scenario will increase operation and maintenance costs for the City as the City provides for the demands of the increased population. As shown in Table 7 of Appendix 2, the annual fiscal expenses generated by the Project at buildout are estimated to be approximately $1.8 million, which includes approximately $1.0 million for the North Development Area and approximately $0.8 million for the South Development Area. Fiscal Expenses Estimated Using the Multiplier Method All of the expense categories are calculated using the multiplier method. Gross expenditures from fiscal years through as well as the resulting 8-year average are shown in Table 5 of Appendix 2, while the resulting multipliers are shown in Table 6 of Appendix 2. These multipliers are applied to the appropriate residents, employees, or persons served estimate for each category anticipated for each development scenario, and are presented in Table 7 of Appendix 2. General government services are estimated using a persons served multiplier. This category includes the city council, city manager, human resources department, city clerk, finance division, city treasurer, and city attorney as well as non-departmental functions. Fire protection costs are estimated using a persons served multiplier. Police protection costs are estimated using a persons served multiplier. Parks and community services costs are estimated using a persons served multiplier. Public works expenditures are estimated on a persons served basis. Development Services Fund expenditures include costs associated with planning, building, and development services, and are estimated on a persons served basis. Engineering and Public Works Administration expenditures are estimated on a persons served basis. NET FISCAL IMPACTS North Development Area The North Development Area is expected to generate approximately $1.0 million in annual fiscal revenues to the City at buildout. Fiscal expenses are also estimated to be approximately $1.0 million annually when the Project is fully developed, resulting in neutral impacts to the City. CCSP Financing Plan & Fiscal Impact Analysis 20 May 28, 2013
25 South Development Area The South Development Area is expected to generate approximately $1.4 million in annual fiscal revenues to the City at buildout. Fiscal expenses are estimated to be approximately $0.8 million annually when the Project is fully developed, producing a net fiscal surplus of approximately $0.6 million. Entire CCSP Area As discussed above, the FIA examines the fiscal impacts generated at buildout of the North Development Area, South Development Area, and entire CCSP area. Although fiscal impacts at various phases of development are not included in the FIA, it should be noted that phasing is critical. Depending on which land uses develop first, the City could experience either a period of recurring fiscal deficits or recurring fiscal surpluses as the Project builds out. A summary of the net fiscal impacts anticipated at buildout of each development scenario is included in Table 3-1 below and detailed in Table 7 of Appendix 2. TABLE 3-1 SUMMARY OF NET FISCAL IMPACTS ($ IN MILLIONS)* North Development Area South Development Area Entire CCSP Area Annual Revenues $1.0 $1.4 $2.3 Annual Costs $1.0 $0.8 $1.8 Net Fiscal Impact $0.0 $0.6 $0.5 * Totals may not sum due to rounding. While the South Development Area is anticipated to be fiscally positive, the North Development Area is anticipated to be fiscally neutral. The primary difference in the net fiscal impacts between the two development areas is the result of the South Development Area containing all of the Project s non-residential land uses. The non-residential land uses in the South Development Area are estimated to generate approximately $0.5 million per year in sales and use tax revenue at buildout, which comprises nearly all of the approximately $0.6 million annual surplus anticipated at buildout of the South Development Area. As discussed previously, the estimated annual recurring fiscal impact associated with each development area assumes the Project annexes into CFD No and, therefore, will be subject to the corresponding special tax to pay for public safety services. However, if the Project does not annex into CFD No , growth in the North Development Area will likely generate a $0.3 million annual deficit to the City at buildout, while the surpluses anticipated at buildout of the South Development Area would be reduced to $0.4 million. CCSP Financing Plan & Fiscal Impact Analysis 21 May 28, 2013
26 Although no fiscal deficits are anticipated at buildout of each development scenario, the City may require mechanisms to fund deficits in the interim years. Furthermore, the City may require funding mechanisms (e.g., CFDs or Landscaping and Lighting Districts) to cover Project-specific streetlight, park, and roadway and storm drain landscape maintenance costs. CCSP Financing Plan & Fiscal Impact Analysis 22 May 28, 2013
27 Chapter 4 CONCLUSIONS PUBLIC FACILITIES FINANCING As noted in prior areas of this report, many of the facilities identified in this report are generally required to be in place prior to any development. However, the actual facilities needed will depend on the development scenario that actually occurs. Fee revenue will not be available upfront to fund the construction of these facilities, so the City and the Project proponent will need to consider private financing or municipal debt financing alternatives. Since the developer may be required to advance-fund the improvements constructed initially, the developer would also be entitled to a fee credit or reimbursement from future development within the Project or Citywide depending on the type of improvement (i.e., CFF Program, CCSP Program, or In-tract). Developers will receive a fee credit or reimbursement for construction of facilities included in the CFF Program or CCSP Fee Program, but they will not receive a fee credit or reimbursement for in-tract facilities. CFDs have been used throughout the City to fund various infrastructure and public services, and a CFD could finance the vast majority of public improvements that the developer may need to install to support CCSP development. The developer may want to use CFD financing to accelerate reimbursement for some of the upfront infrastructure. Although this Finance Plan does not include a detailed feasibility analysis based on the specific infrastructure costs identified in Appendix 1, a detailed feasibility analysis was prepared for the Project based on similar infrastructure needs and costs. That prior feasibility analysis indicated that the North and South Development Areas separately, as well as the overall CCSP area, appear to be financially feasible. If an updated feasibility analysis were to be conducted, it would probably reveal that the Project is even more feasible now than when the original analysis was prepared. Implementation The CCSP identifies a program for both residential and non-residential growth within a specific area of the City of Oakdale and will be subject to updates and revisions in future years as development applications are submitted and processed. The CCSP and the PFFP are based on assumptions of land use, facility demands, facility standards and design, and cost estimates. Each of these assumptions may be subject to change in future years; therefore, the PFFP may also be revised to reflect these changes. The ongoing implementation of the PFFP will be parallel to the continued monitoring of the CCSP, and will require the same degree of time and effort to keep it current and useful. In this manner, the PFFP will guide the overall funding of community infrastructure required to serve the CCSP area. CCSP Financing Plan & Fiscal Impact Analysis 23 May 28, 2013
28 1. Updates and Revisions The PFFP should be updated each time there is a change in facility plans, land use plans, or cost estimates. When these items are revised, there will be a corresponding change in the fair share burden to each land use in the Project. Land use and facility changes will result in revisions to the benefit analysis and corresponding fee allocation to each land use. To the extent some properties in the CCSP area have been developed and paid their fair share prior to a program update, revisions will apply only to future new development. If facility costs are determined to be higher than estimated in the PFFP, the City will need to increase fees in future years and/or call on developers to fund the extra expenses based on the provisions of an acquisition agreement. As the City adopts new ordinances or updates existing ordinances in future years, fees will be adjusted based on actual costs realized after construction bids have been received for public facilities. If actual costs are higher than expected, the City will have to increase fees and/or rely on the terms of an acquisition agreement to avoid a financing deficit in future years. 2. Action Items Prior to commencement of development in the CCSP area, the City may need to adopt a fee ordinance or resolution implementing a CCSP fee for each type of capital facility or shared cost to be included in the CCSP Fee Program. The initial ordinance will reflect fees based on information available at that time. Fees will be adjusted annually or on a more frequent basis to reflect actual costs and current cost estimates. Alternatively, the City could execute a development agreement, in accordance with Section of the Oakdale Zoning Code and as envisioned in the Specific Plan, with Project landowners that, among other provisions, describes and quantifies the required fees. Furthermore, before any CCSP fees are established, the City will need to update its Capital Facilities Fee (CFF) program to, among other things, include applicable Projectspecific infrastructure costs and to resolve any potential overlaps between the proposed CCSP Fee Program and the CFF. This will be especially important with respect to how storm drainage and park facilities are treated in the CFF as opposed to the Specific Plan, and how credits against the CFF for these facilities may be applied. In addition, land costs associated with each infrastructure type should be addressed as part of the CFF Program update and the creation of the proposed CCSP Fee Program. Pursuant to Section of the Government Code, the City could establish a separate CCSP capital facility account and a unique fund for each type of public facility for which fees are collected. Establishment of this account will prevent commingling of the CCSP fees with other City revenues and funds. Interest income earned by fee revenues in this account will be deposited in the account and applied to facility construction costs. Within one hundred eighty (180) days of the close of each fiscal year, the City will make information pertaining to the account [as required by Section (b)(1)] available to the public and will review this information at a regularly scheduled public hearing. CCSP Financing Plan & Fiscal Impact Analysis 24 May 28, 2013
29 In addition, if the developer requests formation of a Mello-Roos CFD as discussed herein and the City concurs with that request, the City must form a financing team made up of experts in the various fields associated with implementation of such districts, including bond counsel, bond underwriter, and special tax consultant. The City and financing team will be responsible for forming the district, issuing bonds to pay for required facilities, and levying special taxes to ensure timely repayment of bonds. FISCAL IMPACTS The FIA examines the fiscal impacts generated at buildout of the North Development Area and the South Development Area. The North Development Area is anticipated to be fiscally neutral, while the South Development Area is anticipated to be fiscally positive. The primary difference in the net fiscal impacts between the two development areas is that the South Development Area contains all of the Project s non-residential, sales tax-producing land uses. Implementation Although fiscal impacts at various phases of development are not included in the FIA, it should be noted that phasing is critical. Depending on which land uses develop first, the City could experience either a period of recurring fiscal deficits or recurring fiscal surpluses as the Project builds out. As the City enters into development agreements, as discussed above, this risk may need to be shifted to Project landowners. In addition, the Project will need to annex into CFD No , or implement an equivalent financing mechanism, prior to commencing development. The City will also require the Project to participate in additional funding mechanisms (e.g., Landscaping and Lighting Districts) to cover Project-specific storm drain and landscape maintenance costs, since it is City standard practice to require all new subdivisions to participate in an LLD (Landscaping and Lighting District). Formation of, or annexation into, an LLD for these purposes must also consider a sinking fund or other mechanism to fund potential landscape restoration costs in instances where Oakdale Irrigation District pipelines running under new landscaped areas within the Project need to be repaired or replaced. CCSP Financing Plan & Fiscal Impact Analysis 25 May 28, 2013
30 APPENDIX 1 DETAILED FACILITIES COST ESTIMATES (from Giuliani & Kull, Inc.) Page A-1
31 Preliminary Opinion of Probable Cost of Backbone Infrastructure Crane Crossing Specific Plan March 21, 2013 Oakdale, CA Description Quantity Unit Cost/Unit Total Fee Category WATER NORTH 12" C900 PVC PIPE 6,652 LF $60 $399,120 CFF 10" C900 PVC PIPE 520 LF $45 $23,400 CFF 8" LATERAL 420 LF $32 $13,440 IN-TRACT 6" VALVES 20 EA $1,250 $25,000 CFF 8" VALVES 14 EA $1,500 $21,000 IN-TRACT 10" VALVES 3 EA $1,750 $5,250 CFF 12" VALVES 30 EA $2,000 $60,000 CFF FIRE HYDRANTS 20 EA $3,500 $70,000 CFF WELL 1 EA $1,000,000 $1,000,000 CFF SOUTH SUB-TOTAL $348,680 TOTAL WATER $1,965,890 Note: Ancillary items such as laterals, valves, fire hydrants, etc. indicated within this estimate for backbone infrastructure facilities only. Page A-2 NORTH SUB-TOTAL $1,617,210 SOUTH 12" C900 PVC PIPE 4,389 LF $60 $263,340 CFF 10" C900 PVC PIPE 676 LF $45 $30,420 SP 8" LATERAL 60 LF $32 $1,920 IN-TRACT 8" VALVES 2 EA $1,750 $3,500 IN-TRACT 12" VALVES 2 EA $2,000 $4,000 CFF FIRE HYDRANTS 13 EA $3,500 $45,500 CFF Crane Crossing Specific Plan Page 1 of 5
32 Description Quantity Unit Cost/Unit Total Fee Category STORM NORTH 24" SDR 26 PVC PIPE 1,240 LF $60 $74,400 CFF 36" SDR 26 PVC PIPE 3,984 LF $80 $318,720 CFF 48" SDR 26 PVC PIPE 150 LF $107 $16,050 CFF 24" LATERAL 540 LF $65 $35,100 IN-TRACT STORM DRAIN MANHOLE 15 EA $3,000 $45,000 CFF CATCH BASIN 30 EA $2,500 $75,000 CFF PARK-1 BASIN 1 19,585 CY $4 $78,340 CFF PARK-1 FRENCH DRAIN 1 3,900 LF $150 $585,000 CFF PARK-2 BASIN 5,377 CY $4 $21,508 CFF PARK-2 FRENCH DRAIN 1,200 LF $150 $180,000 CFF SOUTH SUB-TOTAL $984,844 TOTAL STORM $2,413, % of costs should be allocated to South Area for SD collection of HDR-1 & MDR-2 NORTH SUB-TOTAL $1,429,118 Page A-3 SOUTH 24" SDR 26 PVC PIPE 2,453 LF $60 $147,180 SP 27" SDR 26 PVC PIPE 7,229 LF $70 $506,030 CFF 24" LATERAL 240 LF $65 $15,600 IN-TRACT STORM DRAIN MANHOLE 23 EA $3,000 $69,000 CFF CATCH BASIN 46 EA $2,500 $115,000 CFF PARK-3 BASIN 1,696 CY $7 $11,872 CFF PARK-3 FRENCH DRAIN 300 LF $151 $45,300 CFF PARK-4 BASIN 2,066 CY $7 $14,462 CFF PARK-4 FRENCH DRAIN 400 LF $151 $60,400 CFF Crane Crossing Specific Plan Page 2 of 5
33 Description Quantity Unit Cost/Unit Total Fee Category SEWER NORTH 8" SDR 26 PIPE 4,352 LF $35 $152,320 IN-TRACT 10" SDR 26 PIPE 1,500 LF $44 $66,000 IN-TRACT SEWER LATERAL 240 LF $40 $9,600 IN-TRACT SEWER MANHOLE 18 EA $3,000 $54,000 IN-TRACT PONTIAC STREET LIFT STATION 1 LS $100,000 $100,000 CFF NORTH SUB-TOTAL $381,920 SOUTH 8" SDR 26 PIPE 2,867 LF $35 $100,345 IN-TRACT 8" LATERAL 60 LF $40 $2,400 IN-TRACT SEWER MANHOLE 7 EA $3,000 $21,000 IN-TRACT SOUTH SUB-TOTAL $123,745 NORTH SUB-TOTAL $1,072,300 TOTAL IRRIGATION $1,072,300 Page A-4 IRRIGATION NORTH TOWN "E" PIPELINE REALIGNMENT TOTAL SEWER $505,665 DEMO EXISTING 36" CONCRETE IRRIGATION PIPELINE/APPURTENANCES 3,870 LF $20.00 $77,400 IN-TRACT INSTALL NEW 36" IRRIGATION PIPELINE 4,020 LF $ $582,900 IN-TRACT AIR VENTS AND MISC. STRUCTURES 12 EA $5, $60,000 IN-TRACT CONTROL STRUCTURE 1 EA $20, $20,000 IN-TRACT BIRNBAUM PIPELINE REALIGNMENT DEMO EXISTING 36" CONCRETE IRRIGATION PIPELINE/APPURTENANCES 1,880 LF $20.00 $37,600 IN-TRACT INSTALL NEW 36" IRRIGATION PIPELINE 1,720 LF $ $249,400 IN-TRACT AIR VENTS AND MISC. STRUCTURES 9 EA $5, $45,000 IN-TRACT Crane Crossing Specific Plan Page 3 of 5
34 Description Quantity Unit Cost/Unit Total Fee Category STREETS ENTRIES, TRAILS, & OPEN SPACE City Gateways 1 EA $50,000 $50,000 SP Trails (Paved)1 4,000 LF $23 $92,000 SP OS Landscaping2 4 AC $40,000 $160,000 SP ENTRIES/TRAILS/OS SUB-TOTAL $302,000 NORTH STREETS ARTERIAL - NORTH CRANE ROAD 1,500 LF DRY UTILITIES 1,500 LF $100 $150,000 CFF CURB & GUTTER (2 EACH) 3,000 LF $13 $39,000 CFF ASPHALT PAVING SECTION (5.5") 2372 TN $75.2 $178,374 CFF CLASS II AGGREGATE BASE SECTION (10.5") 2236 CY $56 $125,216 CFF MEDIAN CURB 0 LF $10 $0 CFF MEDIAN LANDSCAPE 0 SF $2.50 $0 CFF STREET LIGHTING 5 EA $5,000 $25,000 CFF ARTERIAL - HWY 108/WEST F STREET 2,840 LF MEDIAN CURB 5,680 LF $13 $73,840 CFF MEDIAN LANDSCAPE 42,600 SF $4.00 $170,400 CFF Page A-5 SIGNATURE STREET 5,300 LF DRY UTILITIES 5,300 LF $100 $530,000 IN-TRACT CURB & GUTTER (2 EACH) 10,600 LF $13 $137,800 IN-TRACT ASPHALT PAVING SECTION (5.5") 6923 TN $75.20 $520,610 IN-TRACT CLASS II AGGREGATE BASE SECTION (10.5") 6527 CY $56 $365,512 IN-TRACT STREET LIGHTING 18 EA $5,000 $90,000 IN-TRACT NORTH SUB-TOTAL $2,161,512 SOUTH STREETS ARTERIAL - SOUTH CRANE ROAD (ENTRY = 800 LF, REMAINDER = 1,400 LF) 2,200 LF DRY UTILITIES 2,200 LF $100 $220,000 CFF CURB & GUTTER (2 EACH) 4,400 LF $13 $57,200 CFF ASPHALT PAVING SECTION (5.5") 3644 TN $75.20 $274,029 CFF CLASS II AGGREGATE BASE SECTION (10.5") 3435 CY $56 $192,360 CFF MEDIAN CURB 2,800 LF $10 $28,000 CFF MEDIAN LANDSCAPE 9,600 SF $2.50 $24,000 CFF STREET LIGHTING 7 EA $5,000 $35,000 CFF Crane Crossing Specific Plan Page 4 of 5
35 Description Quantity Unit Cost/Unit Total Fee Category STREETS CONT'D COLLECTOR - REED ROAD 800 LF DRY UTILITIES 800 LF $100 $80,000 SP CURB & GUTTER (2 EACH) 1,600 LF $13 $20,800 SP ASPHALT PAVING SECTION (5.5") 1100 TN $75.20 $82,720 SP CLASS II AGGREGATE BASE SECTION (10.5") 1037 CY $56.00 $58,072 SP STREET LIGHTING 3 EA $5,000 $15,000 SP SOUTH SUB-TOTAL $1,331,421 NORTH SUB-TOTAL $3,046,725 SOUTH CONSTRUCTION COSTS 1.5 AC $118,500 $177,750 CFF LAND COSTS 1.5 AC $129,000 $193,500 CFF PARKS TOTAL STREETS $3,794,933 NORTH CONSTRUCTION COSTS AC $118,500 $1,458,735 CFF LAND COSTS AC $129,000 $1,587,990 CFF Page A-6 SOUTH SUB-TOTAL $371,250 TOTAL PARKS $3,417,975 NORTH SUB-TOTAL $9,708,785 SOUTH SUB-TOTAL $3,159,940 ENTRIES, TRAILS, & OPEN SPACE $302,000 COMBINED SUB-TOTAL $13,170,725 CONTINGENCY 10.0% $1,317,073 SOFT COST: ENGINEERING, CONSTRUCTION MANAGEMENT/INSPECTION 25.0% $3,292,681 GRAND TOTAL $17,780,479 SUMMARY BY CATEGORY SUB-TOTAL CONTINGENCY SOFT COSTS TOTAL CFF $9,222,086 $922,209 $2,305,522 $12,449,817 IN-TRACT $3,212,447 $321,245 $803,112 $4,336,804 SPECIFIC PLAN $736,192 $73,619 $184,048 $993,859 $13,170,725 $1,317,073 $3,292,682 $17,780,479 Notes: 1. This estimate is based on a conceptual design, only. Changes or increases may occur due to governing agency requirements, or due to other items that may be discovered during the final design phase of the project. Crane Crossing Specific Plan Page 5 of 5
36 APPENDIX 2 FISCAL IMPACT ANALYSIS TABLES Page A-7
37 Table 1: Summary Results of Fiscal Impact Analysis Crane Crossing Specific Plan Annual Impacts on City North Development Area South Development Area Entire Specific Plan Area Includes CFD No (Public Safety Services) Revenue Revenues $ 950,538 $ 1,387,130 $ 2,337,668 Costs 957, ,066 1,792,313 Net Revenue $ (6,709) $ 552,064 $ 545,355 Percent of Revenues (1%) 40% 23% Sources: City of Oakdale; Goodwin Consulting Group, Inc. Page A-8
38 Table 2: City Population and Employment, Item Residents 17,179 17,393 17,759 18,488 19,192 19,558 19,854 20,839 Jobs 6,313 6,171 5,986 5,800 5,548 4,548 4,243 4,968 Service Population 1 19,136 19,306 19,615 20,286 20,912 20,968 21,169 22,379 1 Service population equals the sum of residents and 0.31 times the number of jobs. Sources: California Department of Finance; Employment Development Department; Willdan Financial Services; Goodwin Consulting Group, Inc. Page A-9
39 Table 3: Market Assumptions by Land Use Use Density (units/acre or FAR) Resident or Worker Density Sales Price (residents per unit or workers per 1000 sqft) ($/unit or $/sqft) Residential Uses Very Low Density Residential $ 350,000 Low Density Residential ,000 Medium Density Residential/Flex Use ,000 High Density Residential ,000 Non-Residential Uses General Commercial - Retail $ 200 General Commercial - Other Flex Use/Gen. Commercial Assumes 50% of proposed General Commercial uses will be retail uses and the remaining 50% will be office related uses. Sources: Crane Crossing Specific Plan; Willdan Financial Services; Goodwin Consulting Group, Inc. Page A-10
40 Table 4: New Service Population and Real Estate Development Detail CRANE CROSSING SPECIFIC PLAN North Development Area South Development Area Entire Specific Plan Area Use Units or Sqft Residents or Workers Assessed Value ($000s) Units or Sqft Residents or Workers Assessed Value ($000s) Units or Sqft Residents or Workers Assessed Value ($000s) Residential Uses Very Low Density Residential $ 36, $ $ 36,050 Low Density Residential 436 1, , , , ,800 Medium Density Residential/Flex Use , , ,440 High Density Residential , ,900 Subtotal, Residential 658 1,829 $ 195, $ 78,780 1,011 2,741 $ 274,190 Non-Residential Uses General Commercial - Retail 0 - $ - 195, $ 39, , $ 39,060 General Commercial - Other , , , ,060 Flex Use/Gen. Commercial ,904 1,066 63, ,904 1,066 63,981 Subtotal, Non-Residential 0 - $ - 710,506 2,205 $ 142, ,506 2,205 $ 142,101 TOTAL $ 195,410 $ 220,881 $ 416,291 1 Excludes 28 existing units. Sources: Crane Crossing Specific Plan; Goodwin Consulting Group, Inc. Page A-11
41 Table 5: City of Oakdale Gross Expenditures FY Function FY FY FY FY FY FY FY FY Year Average General Fund City Council $ 27,849 $ 33,436 $ 27,275 $ 37,575 $ 31,570 $ 31,229 $ 22,204 $ 21,684 $ 29,103 City Manager 77, , , , , , , , ,330 Human Resources , ,273 61,784 58,457 41,240 City Clerk 24,835 31,192 14,333 24, , ,159 93, ,329 66,268 Finance Division 80, , , , , , , , ,263 City Treasurer 934 1,117 1,004 1,043 1,043 1,044 1,060 1,060 1,038 City Attorney 34,516 29,098 25,764 39,538 90,044 87,868 88,784 88,908 60,565 Non-Departmental 365, , , , , , , , ,764 Fire Department 2 1,786,316 1,918,367 2,664,145 3,292,893 3,429,436 3,517,898 3,082,503 2,719,958 2,801,440 Police Department 3,183,959 3,585,207 3,959,914 4,371,233 4,635,013 4,682,066 4,054,296 3,814,990 4,035,835 Parks and Community Services 3 815,160 1,404, , ,261 1,008,872 1,040, , , ,051 Public Works Department 684, , , , , , , , ,606 TOTAL GENERAL FUND $ 7,081,914 $ 8,377,273 $ 8,937,848 $ 10,426,901 $ 11,197,866 $ 11,232,076 $ 9,593,569 $ 8,388,568 $ 9,404,502 Development Services Fund 4 Planning $ 389,164 $ 416,178 $ 514,817 $ 470,867 $ 501,305 $ 398,258 $ 362,852 $ 307, ,166 Building Inspection 388, , , , , , , , ,794 TOTAL DEV. SERVICES FUND $ 777,653 $ 897,735 $ 1,148,876 $ 1,074,232 $ 914,829 $ 806,523 $ 727,098 $ 532,738 $ 859,961 Engineering & Public Works Fund 4 Public Works Admin/Engineering 340, , , , , , , , ,708 TOTAL ENG. & PW FUND $ 340,725 $ 399,710 $ 367,001 $ 429,499 $ 447,062 $ 427,287 $ 617,158 $ 577,225 $ 450,708 Notes: 1 Expenditures cover pre-recession and post-recession fiscal years, or FY2004-FY2011. Figures for FY2004-FY2009 are budget actuals; figures for FY are projected, and FY are adopted budget values. 2 Includes Fire Services CFD transfers to the General Fund. In addition, the City has asked that $100,000 be added to each of the eight annual expenditures. 3 Includes General Fund transfers out to the swimming pool, community center, and senior center. 4 City funds all planning, building, and engineering development activity from separate enterprise funds to clearly account for the use of funds paid for development-related services and to show if and when General Fund support is needed for this activity. Prior to FY , these two funds were combined as the Development Services Fund. Sources: City of Oakdale FY Adopted Budgets Page A-12
42 Table 6: City of Oakdale Expenditures Per Person Served FY Weighting Factors FY FY FY FY FY FY FY FY Year Average Function ResidentEmployee Resident Employee Resident Employee Resident Employee Resident Employee Resident Employee Resident Employee Resident Employee Resident Employee Resident Employee General Fund City Council $ 1.46 $ 0.45 $ 1.73 $ 0.54 $ 1.39 $ 0.43 $ 1.85 $ 0.57 $ 1.51 $ 0.47 $ 1.49 $ 0.46 $ 1.05 $ 0.33 $ 0.97 $ 0.30 $ 1.43 $ 0.44 City Manager Human Resources City Clerk Finance Division City Treasurer City Attorney Non-Departmental Fire Department Police Department Parks and Community Services Public Works Department TOTAL EXPENDITURES $ $ $ $ $ $ $ $ $ $ $ $ $ $ $ $ $ $ Development Services Fund 4 Planning Building Inspection TOTAL DEV. SERVICES FUND $ $ $ $ $ $ $ $ $ $ $ $ $ $ $ $ 7.38 $ $ Engineering & Public Works Fund 4 Public Works Admin/Engineering TOTAL ENG. & PW FUND $ $ 5.52 $ $ 6.42 $ $ 5.80 $ $ 6.56 $ $ 6.63 $ $ 6.32 $ $ 9.04 $ $ 8.00 $ $ 6.78 Notes: 1 Expenditures cover pre-recession and post-recession fiscal years, or FY2004-FY2011. Costs per capita represent the average costs of service per capita for FY2004-FY2011. Figures for FY2004-FY2009 are budget actuals; figures for FY are projected, and FY are adopted budget 2 Includes Fire Services CFD transfers to the General Fund. 3 Includes General Fund transfers out to the swimming pool, community center, and senior center. 4 City funds all planning, building, and engineering development activity from separate enterprise funds to clearly account for the use of funds paid for development-related services and to show if and when General Fund support is needed for this activity. Prior to FY , these two funds were combined as the Development Services Fund. Sources: City of Oakdale FY Adopted Budgets Page A-13
43 Table 7: Fiscal Impacts of New Development Crane Crossing Specific Plan Annual Impacts on City North Development Area South Development Area Entire Specific Plan Area Revenues Property Taxes $ 165,600 $ 187,185 $ 352,785 Property Tax in Lieu of VLF 148, , ,382 CFD No (Public Safety Services) 297, , ,698 Sales and Use Tax - 543, ,067 Public Safety Sales Tax - 1,022 1,022 Gas Taxes 31,599 15,756 47,356 Hotel Motel Tax 19,446 16,964 36,410 Property Transfer Tax 10,700 8,200 18,900 Business License Fee - 61,527 61,527 Franchise Fees and Other Taxes 61,324 53, ,822 Licenses & Permits 1,571 1,370 2,941 Fines, Forfeitures & Penalties 18,415 16,065 34,480 Other Intergovernmental 27,876 24,318 52,194 Charges for Services 23,812 20,773 44,584 Other Revenue 6,814 5,944 12,759 Transfers In 19,541 17,047 36,588 Dev. Services Fund: Revenues 73,932 64, ,428 Eng. & PW Fund: Revenues 44,183 38,543 82,726 Total Revenues $ 950,538 $ 1,387,130 $ 2,337,668 Costs City Council $ 2,617 $ 2,283 $ 4,900 City Manager 10,226 8,921 19,147 Human Resources 3,554 3,100 6,654 City Clerk 5,773 5,036 10,809 Finance Division 15,516 13,536 29,052 City Treasurer City Attorney 5,312 4,634 9,947 Non-Departmental 35,917 31,333 67,250 Fire Department 249, , ,503 Police Department 360, , ,802 Parks and Community Services Department 85,044 74, ,234 Public Works Department 66,099 57, ,762 Dev. Services Fund: Planning 37,773 32,951 70,724 Dev. Services Fund: Building Inspection 39,738 34,666 74,404 Eng. & PW Fund: PW Admin/Engineering 40,031 34,922 74,953 Total Costs $ 957,247 $ 835,066 $ 1,792,313 Net Revenue $ (6,709) $ 552,064 $ 545,355 Percent of Revenues (1%) 40% 23% Without CFD No (Public Safety Services) Revenues CFD No (Public Safety Services) (297,212) (143,486) (440,698) Net Revenue $ (303,921) $ 408, ,657 Percent of Revenues (32%) 29% 4% Sources: City of Oakdale; Goodwin Consulting Group, Inc. Page A-14
44 Table A1: City of Oakdale Gross Revenues FY Revenue by Type FY FY FY FY FY FY FY FY Year Average GENERAL FUND Taxes Property Taxes $ 931,882 $ 1,046,390 $ 1,457,812 $ 1,731,596 $ 1,802,277 $ 1,606,724 $ 1,430,300 $ 1,390,500 $ 1,424,685 Property Tax in Lieu of VLF - - 1,184,850 1,391,582 1,545,249 1,341,629 1,284,300 1,245, ,164 Sales & Use Taxes 3,054,381 3,193,359 3,184,441 3,299,160 3,061,197 2,880,873 2,355,479 2,319,000 2,918,486 Hotel Motel Tax 188, , , , , , , , ,166 Property Transfer Tax 94, , , , ,129 82,000 52,000 52, ,207 Business License Fee 113, , , , , , , , ,070 Franchise Fees and Other Taxes 593, , , , , , , , ,777 Subtotal, Taxes $ 4,976,189 $ 5,368,227 $ 7,082,439 $ 7,638,894 $ 7,688,185 $ 7,072,226 $ 6,233,079 $ 6,137,200 $ 6,524,555 Licenses & Permits $ 12,530 $ 10,419 $ 10,580 $ 9,057 $ 12,109 $ 11,000 $ 40,000 $ 38,000 $ 17,962 Fines, Forfeitures & Penalties $ 134,259 $ 150,756 $ 176,357 $ 228,855 $ 219,690 $ 234,500 $ 258,500 $ 258,500 $ 207,677 Intergovernmental Revenues Motor Vehicle In-Lieu $ 743,877 $ 1,097,204 $ 103,665 $ 112,060 $ 94,615 $ 112,000 $ 50,000 $ 50,000 $ 295,428 Other Intergovernmental 204, , , , , , , , ,273 Subtotal, Intergovernmental $ 947,931 $ 1,555,209 $ 361,686 $ 387,990 $ 425,865 $ 501,350 $ 342,078 $ 331,495 $ 606,701 Charges for Services $ 182,549 $ 173,813 $ 219,360 $ 309,370 $ 255,153 $ 313,524 $ 347,443 $ 349,320 $ 268,817 Other Revenue $ 116,431 $ 94,430 $ 67,879 $ 76,551 $ 108,839 $ 87,200 $ 27,000 $ 21,400 $ 74,966 Transfers In 2 $ 595,652 $ 77,000 $ 103,540 $ 44,000 $ 139,000 $ 231,000 $ 349,988 $ 195,000 $ 216,898 TOTAL GEN FUND REVENUES $ 6,965,541 $ 7,429,854 $ 8,021,841 $ 8,694,717 $ 8,848,841 $ 8,450,800 $ 7,598,088 $ 7,330,915 $ 7,917,575 PUBLIC SAFETY TAX FUND Public Safety Sales Tax $ 111,754 $ 151,995 $ 150,217 $ 168,920 $ 162,260 $ 115,535 $ 113,000 $ 113,000 $ 135,835 Investment Earnings ,019 2,579 1, ,000 2,000 1,377 Subtotal, Public Safety Fund $ 111,767 $ 152,506 $ 152,236 $ 171,499 $ 163,948 $ 115,739 $ 115,000 $ 115,000 $ 137,212 GAS TAX FUND Gas Taxes $ 350,929 $ 324,893 $ 325,126 $ 463,906 $ 340,006 $ 165,947 $ 300,000 $ 300,000 $ 321,351 Other Revenues 1,663 1,871 83,378 6,747 4, ,805 1,000 1,000 51,990 Subtotal, Gas Tax Fund $ 352,592 $ 326,764 $ 408,504 $ 470,653 $ 344,458 $ 481,752 $ 301,000 $ 301,000 $ 373,340 DEVELOPMENT SERVICES FUND Revenues $ 964,064 $ 1,515,961 $ 1,372, , , , , , ,641 Subtotal, Development Services Fund $ 964,064 $ 1,515,961 $ 1,372,273 $ 967,847 $ 517,022 $ 352,557 $ 311,600 $ 459,800 $ 807,641 ENGINEERING & PUBLIC WORKS FUND Revenues $ 78,368 $ 815,282 $ 392,011 1,448, , , , , ,232 Subtotal, Eng. & PW Fund $ 78,368 $ 815,282 $ 392,011 $ 1,448,075 $ 339,522 $ 195,396 $ 320,200 $ 333,000 $ 490,232 Notes: 1 Expenditures cover pre-recession and post-recession fiscal years, or FY2004-FY2011. Figures for FY2004-FY2009 are budget actuals; figures for FY are projected, and FY are adopted budget values. 2 Excludes transfers in from the Public Safety Tax Fund, Gas Tax Fund, CFD No (Fire Protection Services), and CFD No (Public Safety Services). Sources: City of Oakdale FY Adopted Budgets. Page A-15
45 Table A2: City of Oakdale Gross Revenues Per Capita FY Weighting Factors FY FY FY FY Gen Fund Revenue by Type Resident Employee Resident Employee Resident Employee Resident Employee Resident Employee GENERAL FUND Taxes Property Taxes Estimated in Case Study Property Tax in Lieu of VLF Estimated in Case Study Sales and Use Tax Estimated in Case Study Hotel Motel Tax $ 9.83 $ 3.05 $ $ 3.29 $ $ 3.65 $ $ 3.81 Property Transfer Tax Estimated in Case Study Business License Fee n/a 1.00 $ - $ $ - $ $ - $ $ - $ Franchise Fees and Other Taxes $ $ 9.61 $ $ 8.60 $ $ 9.89 $ $ Subtotal, Taxes $ $ $ $ $ $ $ $ Licenses & Permits $ 0.65 $ 0.20 $ 0.54 $ 0.17 $ 0.54 $ 0.17 $ 0.45 $ 0.14 Fines, Forfeitures & Penalties $ 7.02 $ 2.17 $ 7.81 $ 2.42 $ 8.99 $ 2.79 $ $ 3.50 Intergovernmental Revenues Vehicle In-Lieu Fees Estimated in Case Study Other Intergovernmental $ $ 3.31 $ $ 7.35 $ $ 4.08 $ $ 4.22 Subtotal, Intergovernmental $ $ 3.31 $ $ 7.35 $ $ 4.08 $ $ 4.22 Charges for Services $ 9.54 $ 2.96 $ 9.00 $ 2.79 $ $ 3.47 $ $ 4.73 Other Revenue $ 6.08 $ 1.89 $ 4.89 $ 1.52 $ 3.46 $ 1.07 $ 3.77 $ 1.17 Transfers In $ $ 9.65 $ 3.99 $ 1.24 $ 5.28 $ 1.64 $ 2.17 $ 0.67 TOTAL GENERAL FUND $ $ $ $ $ $ $ $ PUBLIC SAFETY TAX FUND Public Safety Sales Tax Estimated in Case Study GAS TAX FUND Gas Taxes 1.00 n/a $ $ - $ $ - $ $ - $ $ - CFD NO (PUBLIC SAFETY SERVICES) Special Taxes Estimated in Case Study DEVELOPMENT SERVICES FUND Revenues $ $ $ $ $ $ $ $ ENGINEERING & PUBLIC WORKS FUND Revenues $ 4.10 $ 1.27 $ $ $ $ 6.20 $ $ Note: 1 Costs per capita represent the average costs of service per capita for FY2004-FY2011. Figures for FY2004-FY2009 are budget actuals; figures for FY are projected, and FY are adopted budget values. Sources: City of Oakdale FY Adopted Budgets. Page A-16
46 Table A2, cont.: City of Oakdale Gross Revenues Per Capita FY FY FY FY FY Year Average Gen Fund Revenue by Type Resident Employee Resident Employee Resident Employee Resident Employee Resident Employee GENERAL FUND Taxes Property Taxes Estimated in Case Study Property Tax in Lieu of VLF Estimated in Case Study Sales and Use Tax Estimated in Case Study Hotel Motel Tax $ $ 3.69 $ $ 3.18 $ 9.45 $ 2.93 $ 8.94 $ 2.77 $ $ 3.30 Property Transfer Tax Estimated in Case Study Business License Fee $ - $ $ - $ $ - $ $ - $ $ - $ Franchise Fees and Other Taxes $ $ $ $ $ $ $ $ $ $ Subtotal, Taxes $ $ $ $ $ $ $ $ $ $ Licenses & Permits $ 0.58 $ 0.18 $ 0.52 $ 0.16 $ 1.89 $ 0.59 $ 1.70 $ 0.53 $ 0.86 $ 0.27 Fines, Forfeitures & Penalties $ $ 3.26 $ $ 3.47 $ $ 3.79 $ $ 3.58 $ $ 3.12 Intergovernmental Revenues Vehicle In-Lieu Fees Estimated in Case Study Other Intergovernmental $ $ 4.91 $ $ 5.76 $ $ 4.28 $ $ 3.90 $ $ 4.72 Subtotal, Intergovernmental $ $ 4.91 $ $ 5.76 $ $ 4.28 $ $ 3.90 $ $ 4.72 Charges for Services $ $ 3.78 $ $ 4.64 $ $ 5.09 $ $ 4.84 $ $ 4.04 Other Revenue $ 5.20 $ 1.61 $ 4.16 $ 1.29 $ 1.28 $ 0.40 $ 0.96 $ 0.30 $ 3.73 $ 1.15 $ 6.65 $ 2.06 $ $ 3.42 $ $ 5.13 $ 8.71 $ 2.70 $ $ 3.31 TOTAL GENERAL FUND $ $ $ $ $ $ $ $ $ $ PUBLIC SAFETY TAX FUND Public Safety Sales Tax Estimated in Case Study GAS TAX FUND Gas Taxes $ $ - $ 8.48 $ - $ $ - $ $ - $ $ - CFD NO (PUBLIC SAFETY SERVICES) Special Taxes Estimated in Case Study DEVELOPMENT SERVICES FUND Revenues $ $ 7.66 $ $ 5.21 $ $ 4.56 $ $ 6.37 $ $ ENGINEERING & PUBLIC WORKS FUND Revenues $ $ 5.03 $ 9.32 $ 2.89 $ $ 4.69 $ $ 4.61 $ $ 7.49 Note: 1 Costs per capita represent the average costs of service per capita for FY2004-FY2011. Figures for FY2004-FY2009 are budget actuals; figures for FY are projected, and FY are adopted budget values. Sources: City of Oakdale FY Adopted Budgets. Page A-17
47 Table A3: Property Tax Allocation, Estimated Allocation Pre-Annexation Post-Annexation Annexation Notes ERAF Shift Agency Pre-ERAF County General Fund County splits Gen Fund with City; County keeps 70% County Superintendent of Schools County Fire Service City of Oakdale General Fund City shares 30% County Gen Fund & 100% Oakdale Fire Oakdale Fire District Oakdale Fire transfers to City Eastside Mosquito Abatement Oakdale Irrigation Oakdale Unified School District Yosemite Community College County Schools Schools-Equalization Aid Schools-Tuition Oakdale Redevelopment TOTAL Agency Post-ERAF County General Fund % County Superintendent of Schools % County Fire Service % City of Oakdale General Fund % Oakdale Fire District % Eastside Mosquito Abatement % Oakdale Irrigation % Oakdale Unified School District % Yosemite Community College % County Schools % Schools-Equalization Aid % Schools-Tuition % Oakdale Redevelopment % ERAF TOTAL Source: Stanislaus County Auditor-Controller Page A-18
48 Table A4: CFD No (Public Safety Services) Revenue Crane Crossing Specific Plan North Development Area South Development Area Entire Specific Plan Area Use Tax Rate Units Annual Revenues Units Annual Revenues Units Annual Revenues Residential Uses Very Low Density Residential $ $ 46,524 0 $ $ 46,524 Low Density Residential $ , , ,038 Medium Density Residential/Flex Use $ , , ,217 High Density Residential $ , ,919 Total 658 $ 297, $ 143,486 1,011 $ 440,698 Source: City of Oakdale Page A-19
49 Table A5: Sales and Use Tax Assumptions Basic Sales Tax Rate (includes property tax in-lieu of sales tax) 1.00% Countywide and Statewide Pooled Sales Tax Revenue as a Percentage of Basic Sales Tax Rate 11.21% County's Share of Oakdale's Sales Tax Revenue 5.00% Public Safety (Prop. 172) Sales Tax Rate 0.50% Percent of Public Safety Sales Tax Revenue Allocated to City 0.40% Taxable Sales General Commercial - Retail (per Improved Square Foot) $250 General Commercial - Other (per Improved Square Foot) $5 Flex Use/Gen. Commercial (per Improved Square Foot) $5 Sources: City of Oakdale; County of Stanislaus; State Board of Equalization; ULI; Goodwin Consulting Group, Inc. Page A-20
50 Table A6: Sales Tax Analysis Crane Crossing Specific Plan North Development Area South Development Area Entire Specific Plan Area Non-Residential Taxable Sales General Commercial - Retail $0 $48,825,250 $48,825,250 General Commercial - Other $0 $976,505 $976,505 Flex Use/Gen. Commercial $0 $1,599,520 $1,599,520 Total Taxable Sales $0 $51,401,275 $51,401,275 Direct Sales and Use Tax $0 $488,312 $488,312 Countywide and Statewide Pooled Sales Tax $0 $54,755 $54,755 Public Safety (Prop. 172) Sales Tax $0 $1,022 $1,022 Source: Goodwin Consulting Group, Inc. Page A-21
51 Table A7: Property Transfer Tax Revenue Crane Crossing Specific Plan Item North Development Area South Development Area Entire Specific Plan Area Total Assessed Value (Residential) A $ 195,410,000 $ 78,780,000 $ 274,190,000 Average Property Holding Period (years) B C = A / B $ 19,541,000 $ 7,878,000 $ 27,419,000 Total Assessed Value (Non-Residential) D $ - $ 142,101,200 $ 142,101,200 Average Property Holding Period (years) E F = D / E $ - $ 7,105,060 $ 7,105,060 Annual Appraised Value of Transferred Property G = C + F $ 19,541,000 $ 14,983,060 $ 34,524,060 Property Transfer Tax Rate - City Share 1 H 0.055% 0.055% 0.055% Property Transfer Tax Revenue, Annual I = G x H $ 10,700 $ 8,200 $ 19,000 Note: Totals have been rounded. 1 Property Transfer Tax rate is $0.55 per $500 sales value. Revenue is split evenly between City and County. This results in revenue to the City of percent of sales price. Sources: City of Oakdale; Goodwin Consulting Group, Inc. Page A-22
52 Table A8: Property Tax In-Lieu of Vehicle License Fee Revenues Crane Crossing Specific Plan North Development Area South Development Area Entire Specific Plan Area Property Tax In-Lieu of VLF Total Existing City Net Assessed Value (FY ) $ 1,565,511,526 $ 1,565,511,526 $ 1,565,511,526 Citywide VLF Property Tax In-lieu Revenue (FY ) 1,183,145 1,183,145 1,183,145 VLF Property Tax In-lieu Per $1000 Assessed Value $ 0.76 $ 0.76 $ 0.76 Growth in Assessed Value $ 195,410,000 $ 220,881,200 $ 416,291,200 Property Tax In-Lieu of VLF Revenue $ 148,512 $ 167,870 $ 316,381 Note: Figures rounded where appropriate. Sources: County of Stanislaus; Goodwin Consulting Group, Inc. Page A-23
53 APPENDIX 3 INFRASTRUCTURE COST ESTIMATES FOR EXISTING DEVELOPMENT Page A-24
54 Preliminary Opinion of Probable Cost for Existing Communities within the Crane Crossing Specific Plan Oakdale, CA Note: The estimate shown below was prepared to provide probable construction costs associated with annexing the named community into the City of Oakdale. It is assumed that annexation will require improvements (sewer, water, streets, etc) to meet current City of Oakdale Standards. Please see the attached exhibit for an illustration of the improvements assumed to be required. Specific Plan: Community Name: CRANE CROSSING - NORTH SUNSET PARK SUBDIVISION (MAGNOLIA AVE) Sewer 8" SDR 26 PIPE 1,770 LF $35 $61,950 SEWER MANHOLE 4 EA $4,000 $16,000 SEWER CLEANOUT/LAMPHOLE 2 EA $1,000 $2,000 SEWER LATERAL 30 EA $1,000 $30,000 ASPHALT PAVING-TRENCH PATCH 9,180 SF $3.00 $27,540 Total $137,490 Unit Cost per Street Foot $ Prepared by Giuliani Kull, Inc. 11/6/2012 Page 1 of 1 Page A-25


55 Page A-26
56 APPENDIX 4 ANDERSON HOMES REIMBURSEMENT AGREEMENT MAPS Page A-27

57 Page A-28
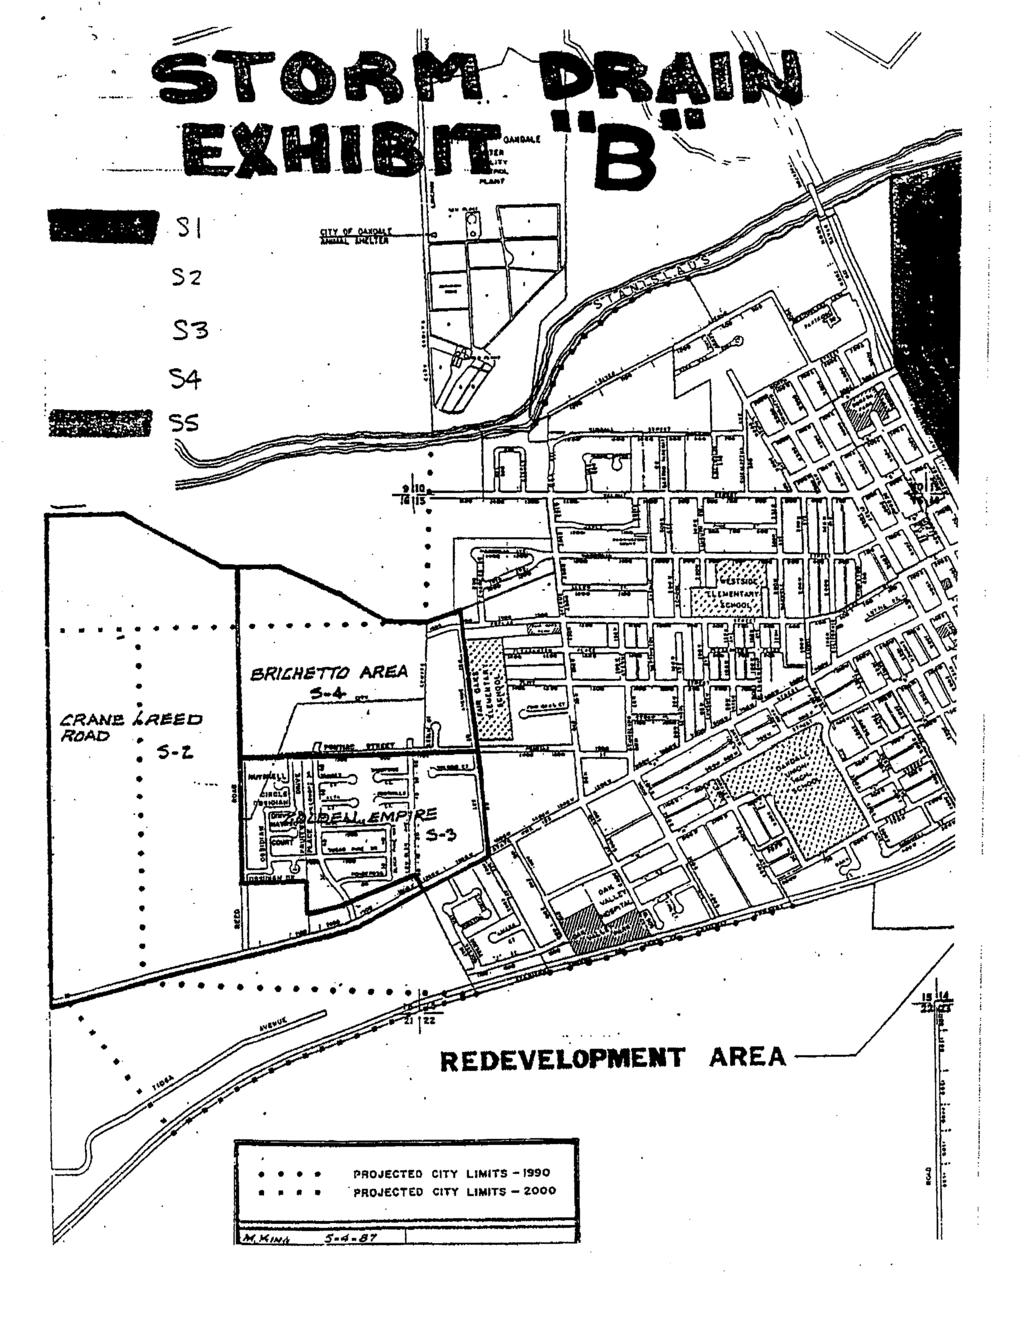
58 Page A-29
CITY OF MODESTO COMMUNITY FACILITIES DISTRICT NO (HETCH HETCHY) CFD REPORT
 CFD REPORT") CITY OF MODESTO COMMUNITY FACILITIES DISTRICT NO. 2005-1 (HETCH HETCHY) CFD REPORT September 23, 2005 Goodwin Consulting Group, Inc. 555 University Avenue, Suite 280 Sacramento, California 95825 Phone
CITY OF MODESTO COMMUNITY FACILITIES DISTRICT NO. 2005-1 (HETCH HETCHY) CFD REPORT September 23, 2005 Goodwin Consulting Group, Inc. 555 University Avenue, Suite 280 Sacramento, California 95825 Phone
TAUSSIG. & Associates, Inc. FISCAL IMPACT ANALYSIS DELTA COVE (ATLAS TRACT) DAVID. Public Finance Facilities Planning Urban Economics
 DAVID. Public Finance Facilities Planning Urban Economics") DAVID TAUSSIG & Associates, Inc. FISCAL IMPACT ANALYSIS DELTA COVE (ATLAS TRACT) August 31, 2010 Prepared By: Public Finance Facilities Planning Urban Economics David Taussig & Associates, Inc 5000 Birch
DAVID TAUSSIG & Associates, Inc. FISCAL IMPACT ANALYSIS DELTA COVE (ATLAS TRACT) August 31, 2010 Prepared By: Public Finance Facilities Planning Urban Economics David Taussig & Associates, Inc 5000 Birch
CITY OF DIXON COMMUNITY FACILITIES DISTRICT NO (VALLEY GLEN NO. 2) CFD TAX ADMINISTRATION REPORT FISCAL YEAR
 CFD TAX ADMINISTRATION REPORT FISCAL YEAR") CITY OF DIXON COMMUNITY FACILITIES DISTRICT NO. 2015-1 (VALLEY GLEN NO. 2) CFD TAX ADMINISTRATION REPORT FISCAL YEAR 2017-18 January 8, 2018 333(University(Ave,(Suite(160( (Sacramento,(CA(95825 Phone:(d916l(561-0890(
CITY OF DIXON COMMUNITY FACILITIES DISTRICT NO. 2015-1 (VALLEY GLEN NO. 2) CFD TAX ADMINISTRATION REPORT FISCAL YEAR 2017-18 January 8, 2018 333(University(Ave,(Suite(160( (Sacramento,(CA(95825 Phone:(d916l(561-0890(
DISCOVERY VILLAGE SOUTH SAN MARCOS, CALIFORNIA
 DAVID TAUSSIG & Associates, Inc. FISCAL IMPACT STUDY DISCOVERY VILLAGE SOUTH SAN MARCOS, CALIFORNIA JANUARY 11, 2018 Public Finance Public Private Partnerships Urban Economics Clean Energy Bonds Newport
HACKBERRY HIDDEN COVE PUBLIC IMPROVEMENT DISTRICT NO. 2 SERVICE AND ASSESSMENT PLAN (UTILITY IMPROVEMENTS)
") HACKBERRY HIDDEN COVE PUBLIC IMPROVEMENT DISTRICT NO. 2 SERVICE AND ASSESSMENT PLAN (UTILITY IMPROVEMENTS) SEPTEMBER 15, 2009 HACKBERRY HIDDEN COVE PUBLIC IMPROVEMENT DISTRICT NO. 2 SERVICE AND ASSESSMENT
HACKBERRY HIDDEN COVE PUBLIC IMPROVEMENT DISTRICT NO. 2 SERVICE AND ASSESSMENT PLAN (UTILITY IMPROVEMENTS) SEPTEMBER 15, 2009 HACKBERRY HIDDEN COVE PUBLIC IMPROVEMENT DISTRICT NO. 2 SERVICE AND ASSESSMENT
SECOND AMENDED AND RESTATED RATE AND METHOD OF APPORTIONMENT OF SPECIAL TAX
 SECOND AMENDED AND RESTATED RATE AND METHOD OF APPORTIONMENT OF SPECIAL TAX A Special Tax for the City of Moreno Valley Community Facilities District No. 2014-01 (Maintenance Services) (the CFD ) shall
FINDINGS. The Board of Supervisors finds that: Resolution No declaring its intention to form Community Facilities District No.
 ORDINANCE NO. 879 AN ORDINANCE OF THE COUNTY OF RIVERSIDE AUTHORIZING THE LEVY OF SPECIAL TAXES IN IMPROVEMENT AREA NO. 2 OF COMMUNITY FACILITIES DISTRICT NO. 07-1(NEWPORT/I-215 INTERCHANGE) OF THE COUNTY
A Look at Voter-Approval Requirements for Local Taxes
 A Look at Voter-Approval Requirements for Local Taxes MAC TAYLOR LEGISLATIVE ANALYST MARCH 20, 2014 Introduction For about 100 years, California s local governments generally could raise taxes without
PUBLIC SERVICES AND PUBLIC FACILITIES FINANCING PLAN SALINAS FUTURE GROWTH AREA. November 12, 2007
 PUBLIC SERVICES AND PUBLIC FACILITIES FINANCING PLAN SALINAS FUTURE GROWTH AREA November 12, 2007 Prepared for the City of Salinas Prepared by Applied Development Economics 100 Pringle Avenue, Suite 560
Fiscal Impact Analysis
 May 12, 2017 Fiscal Impact Analysis Westport Cupertino Development Prepared for: KT Urban, LLC Prepared by: Applied Development Economics, Inc. 1756 Lacassie Avenue, #100, Walnut Creek, CA 94596 925.934.8712
POWAY UNIFIED SCHOOL DISTRICT
 POWAY UNIFIED SCHOOL DISTRICT ADMINISTRATION REPORT FISCAL YEAR 2017/2018 IMPROVEMENT AREA C OF COMMUNITY FACILITIES DISTRICT NO. 6 June 29, 2017 PREPARED FOR: Poway Unified School District Planning Department
RESOLUTION NUMBER 3305
 RESOLUTION NUMBER 3305 RESOLUTION OF INTENTION OF THE CITY COUNCIL OF THE CITY OF PERRIS TO ESTABLISH COMMUNITY FACILITIES DISTRICT NO. 2004-5 (AMBER OAKS II) OF THE CITY OF PERRIS AND TO AUTHORIZE THE
The Board of Supervisors of the County of Riverside ordains as follows:
 ORDINANCE NO. 936 AN ORDINANCE OF THE COUNTY OF RIVERSIDE AUTHORIZING THE LEVY OF A SPECIAL TAX WITHIN COMMUNITY FACILITIES DISTRICT NO. 17-2M (BELLA VISTA II) OF THE COUNTY OF RIVERSIDE The Board of Supervisors
METRO AIR PARK COUNTY OF SACRAMENTO
 PUBLIC FACILITIES FINANCING PLAN METRO AIR PARK COUNTY OF SACRAMENTO Prepared for the Hearing of the Board of Supervisors On December 11, 2007 DECEMBER 11, 2007 COUNTY OF SACRAMENTO METRO AIR PARK PROJECT
ORDINANCE NUMBER 1174
 ORDINANCE NUMBER 1174 AN ORDINANCE OF THE CITY COUNCIL OF THE CITY OF PERRIS, COUNTY OF RIVERSIDE, STATE OF CALIFORNIA, ACTING IN ITS CAPACITY AS THE LEGISLATIVE BODY OF COMMUNITY FACILITIES DISTRICT NO.
RESOLUTION NUMBER 3415
 RESOLUTION NUMBER 3415 A RESOLUTION OF THE CITY COUNCIL OF THE CITY OF PERRIS, ACTING AS THE LEGISLATIVE BODY OF COMMUNITY FACILITIES DISTRICT NO. 2001-3 (NORTH PERRIS PUBLIC SAFETY) OF THE CITY OF PERRIS,
COMMUNITY FACILITIES DISTRICT NO.
 DAVID TAUSSIG & ASSOCIATES, INC. CITY OF ANAHEIM COMMUNITY FACILITIES DISTRICT NO. 1989-2 ADMINISTRATION REPORT FISCAL YEAR 2015-16 AUGUST 10, 2015 Public Finance Urban Economics Newport Beach Riverside
WHEREAS, notice of the public hearing was duly given as required by Section of the Act or has been duly waived by the property owner; and
 RESOLUTION NUMBER 4983 A RESOLUTION OF THE CITY COUNCIL OF THE CITY OF PERRIS, ACTING AS THE LEGISLATIVE BODY OF COMMUNITY FACILITIES DISTRICT NO. 2001-3 (NORTH PERRIS PUBLIC SAFETY) OF THE CITY OF PERRIS,
City of Redding, California Development Impact Mitigation Fee Nexus Study
 , California Development Impact Mitigation Fee Nexus Study December 5, 2017 Prepared by helping communities fund to morrow This page intentionally left blank. TABLE OF CONTENTS Executive Summary...1 Background
TAUSSIG DEVELOPMENT IMPACT FEE JUSTIFICATION STUDY CITY OF ESCALON. Public Finance Public Private Partnerships Urban Economics Clean Energy Bonds
 DAVID TAUSSIG & ASSOCIATES, INC. DEVELOPMENT IMPACT FEE JUSTIFICATION STUDY CITY OF ESCALON B. C. SEPTEMBER 12, 2016 Public Finance Public Private Partnerships Urban Economics Clean Energy Bonds Prepared
City of Antioch Development Impact Fee Study
 Report City of Antioch Development Impact Fee Study Prepared for: City of Antioch Prepared by: Economic & Planning Systems, Inc. February 2014 EPS #20001 Table of Contents 1. INTRODUCTION AND RESULTS...
Chapter VIII. General Plan Implementation A. INTRODUCTION B. SUBMITTAL AND APPROVAL OF SUBSEQUENT PROJECTS C. SPHERE OF INFLUENCE
 Chapter VIII General Plan Implementation A. INTRODUCTION This chapter presents a variety of tools available to the (City) to help build the physical city envisioned in Chapter III. While the Modesto provides
TAUSSIG. & Associates, Inc. LAGUNA BEACH UNIFIED SCHOOL DISTRICT COMMUNITY FACILITIES DISTRICT No DAVID
 DAVID TAUSSIG & Associates, Inc. LAGUNA BEACH UNIFIED SCHOOL DISTRICT COMMUNITY FACILITIES DISTRICT No. 98-1 June 21, 2016 Public Finance Public Private Partnerships Urban Economics Newport Beach Riverside
CITY OF PALM DESERT COMPREHENSIVE GENERAL PLAN
 Comprehensive General Plan/Administration and Implementation CITY OF PALM DESERT COMPREHENSIVE GENERAL PLAN CHAPTER II ADMINISTRATION AND IMPLEMENTATION This Chapter of the General Plan addresses the administration
ORDINANCE NUMBER 1104
 ORDINANCE NUMBER 1104 AN ORDINANCE OF THE CITY COUNCIL OF THE CITY OF PERRIS ACTING IN ITS CAPACITY AS THE LEGISLATIVE BODY OF COMMUNITY FACILITIES DISTRICT NO. 2001-3 (NORTH PERRIS PUBLIC SAFETY) OF THE
For and on behalf of the Director of Public Works of the City of Manteca
 City of Manteca Community Facilities District No. 2015-2 (Crivello Estates) Special Tax Report June 2015 Prepared by For and on behalf of the Director of Public Works of the City of Manteca Main Office
SPECIAL TAX AND BOND ACCOUNTABILITY REPORT
 SPECIAL TAX AND BOND ACCOUNTABILITY REPORT FOR IMPROVEMENT AREA B OF COMMUNITY FACILITIES DISTRICT NO. 10 OF THE POWAY UNIFIED SCHOOL DISTRICT December 23, 2002 SPECIAL TAX AND BOND ACCOUNTABILITY REPORT
Memorandum. Background memorandum for Independence/Constitution Project fiscal impact analysis
 Memorandum To: From: Re: Thomas H. Rogers, City of Menlo Park Ron Golem, Steve Murphy, BAE Background memorandum for Independence/Constitution Project fiscal impact analysis Date: June 16, 2008 Purpose
COMMUNITY FACILITIES DISTRICT NO.
 DAVID TAUSSIG & ASSOCIATES, INC. CITY OF ANAHEIM COMMUNITY FACILITIES DISTRICT NO. 1989-3 ADMINISTRATION REPORT FISCAL YEAR 2015-16 AUGUST 10, 2015 Public Finance Urban Economics Newport Beach Riverside
Fiscal and Economic Impact Analysis of Proposed IKEA in Dublin, California
 Final Report Fiscal and Economic Impact Analysis of Proposed IKEA in Dublin, California Prepared for: IKEA Property, Inc. Prepared by: Economic & Planning Systems, Inc. August 22, 2017 EPS #161062 1. INTRODUCTION
COMMUNITY FACILITIES DISTRICT NO.
 DAVID TAUSSIG & ASSOCIATES, INC. CITY OF ANAHEIM COMMUNITY FACILITIES DISTRICT NO. 1989-1 ADMINISTRATION REPORT FISCAL YEAR 2015-16 AUGUST 10, 2015 Public Finance Urban Economics Newport Beach Riverside
City Council Report 915 I Street, 1 st Floor Sacramento, CA
 City Council Report 915 I Street, 1 st Floor Sacramento, CA 95814 www.cityofsacramento.org File ID: 2018-01465 December 11, 2018 Consent Item 10 Title: Ordinances to Levy Special Taxes within the Greenbriar
COMMUNITY FACILITIES DISTRICT NO.
 DAVID TAUSSIG & Associates, Inc. CITY OF ANAHEIM COMMUNITY FACILITIES DISTRICT NO. 06-2 ADMINISTRATION REPORT FISCAL YEAR 2015-2016 AUGUST 3, 2015 Public Finance Facilities Planning Urban Economics Newport
San Francisco Multi-Purpose Venue Project. Fiscal Impact Analysis: Revenues. Draft Report. Prepared for: The City and County of San Francisco
 Draft Report San Francisco Multi-Purpose Venue Project Fiscal Impact Analysis: Revenues Prepared for: The City and County of San Francisco Prepared by: Economic & Planning Systems, Inc. April 27, 2015
Infrastructure Financing Plan. Infrastructure Financing District No. 1 (Rincon Hill Area) DRAFT
 DRAFT") DRAFT Infrastructure Financing Plan Infrastructure Financing District No. 1 (Rincon Hill Area) Prepared for: City and County of San Francisco Office of Economic Development Prepared by: December 2010 TABLE
DRAFT Infrastructure Financing Plan Infrastructure Financing District No. 1 (Rincon Hill Area) Prepared for: City and County of San Francisco Office of Economic Development Prepared by: December 2010 TABLE
City Council Report 915 I Street, 1 st Floor Sacramento, CA
 City Council Report 915 I Street, 1 st Floor Sacramento, CA 95814 www.cityofsacramento.org File ID: 2017-01623 January 9, 2018 Consent Item 04 Title: Mitigation Fee Act Annual Report for the Year Ending
Exhibit "B" TAX INCREMENT REINVESTMENT ZONE, NUMBER ONE CITY OF BAYTOWN. July 8, 2015
 Exhibit "B" TAX INCREMENT REINVESTMENT ZONE, NUMBER ONE CITY OF BAYTOWN July 8, 2015 2015 AMENDMENT TO THE PROJECT PLAN AND REINVESTMENT ZONE FINANCING PLAN PROJECT PLAN Page I. Existing uses and conditions
Chapter 5. REMAINING REVIEW FACTORS
 Chapter 5. REMAINING REVIEW FACTORS Section 5.1 Finance Constraints and Opportunities Chapter 5 REMAINING REVIEW FACTORS Introduction The remaining review factors required by the Cortese Knox Hertzberg
CITY OF STONE MOUNTAIN 875 Main Street Stone Mountain, Georgia ANNEXATION STUDY 2016
 CITY OF STONE MOUNTAIN 875 Main Street Stone Mountain, Georgia 30083 ANNEXATION STUDY 2016 Presented by the Annexation Study Committee Mayor Patricia Wheeler Alex Brennan Thom DeLoach Mayor Pro Tem Chakira
TAUSSIG. & Associates, Inc. DAVID. Public Finance Facilities Planning Urban Economics. Newport Beach Fresno Riverside San Francisco Chicago Dallas
 DAVID TAUSSIG & Associates, Inc. CITY OF ANAHEIM COMMUNITY FACILITIES DISTRICT NO. 06-2 ADMINISTRATION REPORT FISCAL YEAR 2018-2019 JULY 27, 2018 Public Finance Facilities Planning Urban Economics Newport
PALMDALE SCHOOL DISTRICT COMMUNITY FACILITIES DISTRICT NO ANNUAL REPORT FISCAL YEAR 2013/14
 PALMDALE SCHOOL DISTRICT COMMUNITY FACILITIES DISTRICT NO. 90-1 ANNUAL REPORT FISCAL YEAR 2013/14 District Administration Palmdale School District Cathy A. Shepard, Chief Business Officer Trixie Flores,
River Edge Fiscal Impact Analysis
 Final Report Prepared for: Carbondale Investments Prepared by: Economic & Planning Systems, Inc. EPS #20813 App. N-2 Table of Contents 1. INTRODUCTION AND SUMMARY OF FINDINGS... 1 Summary of Findings...
GENERAL FUND REAL ESTATE TAXES. Total Real Estate Taxes $ 7,993,595 $ 8,287,442 $ 8,055,000 $ 8,232,500 $ 8,278,500
 91 REAL ESTATE TAXES 2015 2016 2017 2017 2018 Actual Actual Budget Estimate Budget Real Estate Taxes Current Real Estate Tax $ 7,889,048 $ 8,041,913 $ 7,931,000 $ 8,070,000 $ 8,126,000 Delinquent Taxes
EXHIBIT A DESCRIPTION OF AUTHORIZED FACILITIES AND SERVICES I. PUBLIC CAPITAL FACILITIES AND RELATED INCIDENTAL EXPENSES
 EXHIBIT A DESCRIPTION OF AUTHORIZED FACILITIES AND SERVICES I. PUBLIC CAPITAL FACILITIES AND RELATED INCIDENTAL EXPENSES A. PUBLIC ROAD IMPROVEMENTS Acquisition, construction, and installation of local
CITY COUNCIL. c-r. Agenda Item No.: Date : July 14, Honorable Mayor and Members of the City Council TO:
 For City Clerk's Use: CITY COUNCIL APPROVED [] DENIED Reso No. File No. Ord No. TO: Honorable Mayor and Members of the City Council Agenda Item No.: Date : July 14, 2010 c-r FROM : Gilbert Rojas, Director
POWAY UNIFIED SCHOOL DISTRICT
 POWAY UNIFIED SCHOOL DISTRICT ADMINISTRATION REPORT FISCAL YEAR 2017/2018 ZONE 2 OF COMMUNITY FACILITIES DISTRICT NO.11 June 29, 2017 PREPARED FOR: Poway Unified School District Planning Department 13626
D R A F T M E M O R A N D U M
 D R A F T M E M O R A N D U M To: From: Joe Speaks, CH2M Darin Smith and Matt Loftis Subject: 4th and King RAB Financing Opportunities; EPS #141018 Date: August 18, 2017 Economic & Planning Systems Inc.
DEFINITION OF REVENUE SOURCES GENERAL FUND
 GENERAL FUND PROPERTY TAX: The valuation of property in the City is determined by the Los Angeles County Tax Assessor, except for Public Utility property, which is assessed by the State Board of Equalization.
CITY OF LOS ANGELES ERIC GARCETTI MAYOR. April 28, CITY OF LOS ANGELES OFFICE OF THE CITY ADMNISTRATIVE OFFICER CFD No.
 Richard H. Llewellyn, Jr. CALIFORNIA ASSISTANT INTERIM CITY ADMINISTRATIVE OFFICER CITY ADMINISTRATIVE OFFICERS PATRICIA J. HUBER BEN CEJA YOLANDA CHAVEZ ERIC GARCETTI MAYOR April 28, 2017 CITY OF LOS
TAUSSIG. & Associates, Inc. DAVID. Public Finance Facilities Planning Urban Economics. Newport Beach Fresno Riverside San Francisco Chicago Dallas
 DAVID TAUSSIG & Associates, Inc. CITY OF ANAHEIM COMMUNITY FACILITIES DISTRICT NO. 06-2 ADMINISTRATION REPORT FISCAL YEAR 2016-2017 AUGUST 1, 2016 Public Finance Facilities Planning Urban Economics Newport
GRASS VALLEY TRANSPORTATION IMPACT FEE PROGRAM NEXUS STUDY
 HEARING REPORT GRASS VALLEY TRANSPORTATION IMPACT FEE PROGRAM NEXUS STUDY Prepared for: City of Grass Valley Prepared by: Economic & Planning Systems, Inc. March 2008 EPS #17525 S A C R A M E N T O 2150
City of Stockton Page 1
 City of Stockton City Council Special Meeting Meeting Agenda - Final City Council Special Michael D. Tubbs Mayor/Chair Elbert H. Holman Jr. Vice Mayor/Vice Chair (District 1) Daniel R. Wright (District
MEMORANDUM Finance Department
 MEMORANDUM Finance Department DATE: TO: FROM: SUBJECT: City Council Dave Warren Director of Finance RECOMMENDATION: GANN APPROPRIATION LIMIT Adopt a Resolution establishing the Appropriation Limit (GANN)
POWAY UNIFIED SCHOOL DISTRICT
 POWAY UNIFIED SCHOOL DISTRICT ADMINISTRATION REPORT FISCAL YEAR 2017/2018 ZONE 1 OF COMMUNITY FACILITIES DISTRICT NO. 11 June 29, 2017 PREPARED FOR: Poway Unified School District Planning Department 13626
Quigley Canyon Ranch Cost/Benefit Study Update
 Quigley Canyon Ranch Cost/Benefit Study Update April 26, 2012 RICHARD CAPLAN & ASSOCIATES Mayor Fritz Haemmerle Hailey City Council 115 Main Street Hailey, ID 83333 April 26, 2012 Dear Mayor Haemmerle
CITY OF LANCASTER FISCAL BUDGET REVENUE SOURCES
 CITY OF LANCASTER FISCAL 2007-08 BUDGET REVENUE SOURCES TAXES The tax raising authority of cities has been severely limited for many years. Proposition 13 enacted in 1978 amended the California Constitution
CITY AND COUNTY OF SAN FRANCISCO STATISTICAL SECTION
 Statistical Section STATISTICAL SECTION This section of the City s comprehensive annual financial report presents detailed information as a context for understanding what the information in the financial
Economic Evaluation and Fiscal Impact Analysis of Gateway Oyster Point
 Report Economic Evaluation and Fiscal Impact Analysis of Gateway Oyster Point Prepared for: BioMed Realty Prepared by: Economic & Planning Systems, Inc. April 9, 2013 EPS #131017 Table of Contents 1. INTRODUCTION
Urban Analytics FISCAL ANALYSIS FOR THE SUCCESSOR AGENCY TO THE REDEVELOPMENT AGENCY OF THE CITY OF SAN JOSE
 FISCAL ANALYSIS FOR THE SUCCESSOR AGENCY TO THE REDEVELOPMENT AGENCY OF THE CITY OF SAN JOSE MERGED AREA REDEVELOPMENT PROJECT FY 2015-1 6 DECEMBER 17, 2015 Urban Analytics INTRODUCTION The Successor Agency
City Services Appendix
 Technical vices 1.0 Introduction... 1 1.1 The Capital Facilities Plan... 1 1.2 Utilities Plan... 2 1.3 Key Principles Guiding Bremerton s Capital Investments... 3 1.4 Capital Facilities and Utilities Addressed
Public Policy Issues and Sustainability in Southern California. Financing Infrastructure Development
 Public Policy Issues and Sustainability in Southern California Financing Infrastructure Development University of California Riverside March 3, 2010 Outline What is Infrastructure?; Infrastructure Need;
Finance Department. DATE: August 26, City Council. Director of Finance GANN APPROPRIATION LIMIT RECOMMENDATION:
 M E M O R A N D U M Finance Department DATE: TO: FROM: SUBJECT: City Council Dave Warren Director of Finance RECOMMENDATION: GANN APPROPRIATION LIMIT Adopt a Resolution establishing the Gann Appropriation
MEMORANDUM. Date: July 28, 2011; amended August 31, 2011
 MEMORANDUM Date: July 28, 2011; amended August 31, 2011 To: From: Project: Subject: Thomas Rogers, City of Menlo Park Mark Hoffheimer, Perkins & Will Prakash Pinto, Perkins & Will Strategic Economics Menlo
COUNTY BUDGET SUMMARY
 COUNTY BUDGET SUMMARY Update The Recommended Budget document was created prior to the Board of Supervisors action to maintain the Amador Program in the Fire Department. No reductions will be made to the
TAUSSIG. & Associates, Inc. SANTA MARGARITA WATER DISTRICT COMMUNITY FACILITIES DISTRICT NO DAVID
 DAVID TAUSSIG & Associates, Inc. SANTA MARGARITA WATER DISTRICT COMMUNITY FACILITIES DISTRICT NO. 2013-1 August 10, 2016 Public Finance Public Private Partnerships Urban Economics Newport Beach Fresno
CITY OF NORTH LAS VEGAS, NEVADA DEBT MANAGEMENT POLICY IN ACCORDANCE WITH NRS (C)
") CITY OF NORTH LAS VEGAS, NEVADA DEBT MANAGEMENT POLICY IN ACCORDANCE WITH NRS 350.013 1(C) JUNE 30, 2007 TABLE OF CONTENTS DEBT MANAGEMENT POLICY NRS 350.013 Subsection 1(c)... 1 Summary of Debt... 2 Affordability
CITY OF NORTH LAS VEGAS, NEVADA DEBT MANAGEMENT POLICY IN ACCORDANCE WITH NRS 350.013 1(C) JUNE 30, 2007 TABLE OF CONTENTS DEBT MANAGEMENT POLICY NRS 350.013 Subsection 1(c)... 1 Summary of Debt... 2 Affordability
 2018 Water Connection Fee Update August 17, 2018 Page 4 environmental effect. Further, the incremental fee increase will not to fund capital projects for the expansion of the existing infrastructure system.
EXHIBIT B RATE AND METHOD OF APPORITONMENT OF SPECIAL TAXES
 EXHIBIT B RATE AND METHOD OF APPORITONMENT OF SPECIAL TAXES REDEVELOPMENT AGENCY OF THE CITY OF LAKE ELSINORE Community Facilities District No. 90-2 (Tuscany Hills Public Improvements) A special tax shall
Heather Hafer, Senior Management Analyst Kate Whan, Public Works Administrative Manager SAN PABLO SUBDIVISION LANDSCAPE & LIGHTING DISTRICT A-03
 I-10 STAFF REPORT MEETING DATE: May 22, 2018 TO: City Council FROM: Heather Hafer, Senior Management Analyst Kate Whan, Public Works Administrative Manager 922 Machin Avenue Novato, CA 94945 (415) 899-8900
TAX EXCHANGE AGREEMENT BETWEEN THE COUNTY OF SACRAMENTO AND THE CITY OF SACRAMENTO, RELATING TO THE PANHANDLE ANNEXATION
 TAX EXCHANGE AGREEMENT BETWEEN THE COUNTY OF SACRAMENTO AND THE CITY OF SACRAMENTO, RELATING TO THE PANHANDLE ANNEXATION This TAX EXCHANGE AGREEMENT ( Agreement ) is made and executed in duplicate this
LAFCO File 14-1: Summit View Homes Reorganization - Request for Addition Information
 LAFCO Santa Barbara Local Agency Formation Commission 105 East Anapamu Street + Santa Barbara CA 93101 805/568-3391 +FAX 805/568-2249 www.sblafco.org + lafco@sblafco.org January 7, 2016 (Agenda) Local
REVENUE MANUAL PALM BEACH COUNTY Edition February 2018
 REVENUE MANUAL PALM BEACH COUNTY 218 Edition February 218 TABLE OF CONTENTS About this. 2 Index of Revenues Index of Revenues by Revenue Source Code Index of Revenues by Name. 3 4 1 About this The Palm
COUNTY DEBT MANAGEMENT POLICY
 PROPOSED BUDGET FY 2017-18 COUNTY DEBT MANAGEMENT POLICY COUNTY OF SANTA CRUZ DEBT MANAGEMENT POLICY TITLE I FINANCE AND ACCOUNTING 800 DEBT MANAGEMENT POLICY A. Introduction/Purpose The purpose of the
LEGEND Bridges Parks Fire Stations Project Locations Libraries Schools A
 LEGEND Bridges Parks Fire Stations Project Locations Libraries Schools A Aid to Construction Fund The Aid to Construction Fund (Water) are funds received from customers for requested water service and
ORDINANCE NO Section 1. The City Council finds the above recitals are true and correct and incorporated herein by this reference.
 ORDINANCE NO. 1814 AN ORDINANCE OF THE CITY COUNCIL OF THE CITY OF CARSON, CALIFORNIA, ACTING IN ITS CAPACITY AS THE LEGISLATIVE BODY OF THE CARSON COMMUNITY FACILITIES DISTRICT NO. 2018-01 (MAINTENANCE
Basics of Municipal Finance: Revenue Sources, Debt Financing, and Spending and Debt Limitations
 Basics of Municipal Finance: Revenue Sources, Debt Financing, and Spending and Debt Limitations Sky Woodruff, Principal Chair, Public Finance Practice October 2, 2015 Overview Municipal Revenue Sources
CAPITAL IMPROVEMENTS ELEMENT
 Goals, Objectives and Policies CAPITAL IMPROVEMENTS ELEMENT GOAL 9.1.: USE SOUND FISCAL POLICIES TO PROVIDE ADEQUATE PUBLIC FACILITIES TO ALL RESIDENTS WITHIN THE CITY. FISCAL POLICIES MUST PROTECT INVESTMENTS
TAX INCREMENT PROJECT PLAN
 TAX INCREMENT PROJECT PLAN THE VILLAGE ON MONROE CITY OF RAPID CITY Prepared by the Rapid City Community Planning and Development Services Department May 2017 INTRODUCTION Tax Increment Financing is a
CITY OF LATHROP SPECIAL FINANCING DISTRICTS. Fiscal Year 2011/12
 CITY OF LATHROP SPECIAL FINANCING DISTRICTS Fiscal Year 2011/12 East Lathrop North Special Financing Districts East Lathrop North is the area generally bounded by the City limits to the north and east,
DESCRIPTIONS OF BUDGET TERMS
 DESCRIPTIONS OF BUDGET TERMS Ad Valorem Tax A tax based on the assessed value of a property. Adopted Budget Financial plan which forms the basis and limits for appropriations and is adopted by the City
sources for FY , only a portion of the statedistributed revenue would be available for new capital projects.
 6 REVENUE PROJECTIONS, SARASOTA/MANATEE 2040 LRTP The purpose of this analysis is to begin to document the financial resources and revenues available for consideration in developing the Financially Feasible
Citizens Guide to the Budget
 How to Read the Budget 23 The Allocation Process 24 Budget Process Timeline 26 City Funds 27 Basis of Budgeting 28-21 - How to Read the Budget The Fiscal Year 1999 Final Budget is contained within five
ORDINANCE NUMBER 1107
 ORDINANCE NUMBER 1107 AN ORDINANCE OF THE CITY COUNCIL OF THE CITY OF PERRIS ACTING IN ITS CAPACITY AS THE LEGISLATIVE BODY OF COMMUNITY FACILITIES DISTRICT NO. 2002-1 (WILLOWBROOK) OF THE CITY OF PERRIS
Fiscal Analysis of the City of Palo Alto 2030 Comprehensive Plan
 Draft Report Fiscal Analysis of the City of Palo Alto 2030 Comprehensive Plan Prepared for: City of Palo Alto Prepared by: Economic & Planning Systems, Inc. February 17, 2017 EPS #151010 Table of Contents
1.0 FISCAL BENEFITS OF PROPOSED GENERAL PLAN
 11661 San Vicente Boulevard, Suite 306 Los Angeles, CA 90049 (310) 820-2680, (310) 820-8341 fax www.stanleyrhoffman.com Memorandum DATE: TO: Laura Stetson, EDAW FROM: Stan Hoffman, SUBJECT: Claremont General
TAX INCREMENTAL PROJECT PLAN
 TAX INCREMENTAL PROJECT PLAN TAX INCREMENT DISTRICT #77 RUSHMORE GATEWAY CORRIDOR CITY OF RAPID CITY Prepared by the Rapid City Community Planning and Development Services Department April 2016 INTRODUCTION
FY 09/10 ADOPTED GENERAL FUND REVENUES $218,840,522
 GENERAL FUND REVENUES FY 09/10 ADOPTED GENERAL FUND REVENUES $218,840,522 State Revenue 11% Transfers Federal Revenue1% 2% Fund Balance 0.1% Other Local Revenue 2% Other Local Taxes 21% Gen. Property Taxes
Finances (Adopted 1969, updated 1975, redone 1976, 1977, 1981 and 1995.)
") 1 INTRODUCTION LEAGUE OF WOMEN VOTERS OF THE CLAREMONT AREA LOCAL STUDY CITY GENERAL FUND BUDGETS April, 2011 This Report presents a survey and comparison of General Fund budgets of six local communities,
1 INTRODUCTION LEAGUE OF WOMEN VOTERS OF THE CLAREMONT AREA LOCAL STUDY CITY GENERAL FUND BUDGETS April, 2011 This Report presents a survey and comparison of General Fund budgets of six local communities,
ONDIDO /1000. Agenda Item No.: Date: July 14, TO: Honorable Mayor and Members of the City Council. FROM : Gilbert Rojas, Director of Finance
 ES City of Choice /1000 ONDIDO For City Clerk's Use: El APPROVED j DENIED Reso No. File No. Ord No. Agenda Item No.: Date: July 14, 2010 TO: Honorable Mayor and Members of the City Council FROM : Gilbert
EXHIBIT 1. Salt Lake City
 EXHIBIT 1 Salt Lake City DRAFT Cost-Benefit and Financial Need Analysis Stadler Development March 5, 2018 COST-BENEFIT AND FINANCIAL NEED ANALYSIS STADLER DEVELOPMENT Zions Public Finance, Inc., has conducted
Klamath Falls Urban Renewal Feasibility Study
 Klamath Falls Urban Renewal Feasibility Study March 17, 2016 Nathan Cherpeski City Manager City of Klamath Falls P.O. Box 237 Klamath Falls, Oregon 97601 Dear Nathan, The Urban Renewal Feasibility Study
RESOLUTION NUMBER 4778
 RESOLUTION NUMBER 4778 RESOLUTION OF CITY COUNCIL, ACTING AS LEGISLATIVE BODY OF COMMUNITY FACILITIES DISTRICT 91-1 (PERRIS VALLEY SPECTRUM) OF THE CITY OF PERRIS APPROVING A PLEDGE AGREEMENT IN CONNECTION
2017 WATER AND WASTEWATER IMPACT FEE STUDY CITY OF AZLE, TEXAS
 2017 WATER AND WASTEWATER IMPACT FEE STUDY CITY OF AZLE, TEXAS JULY 2017 Prepared by: Weatherford Office Address: 1508 Santa Fe Drive, Suite 203 Weatherford, Texas 76086 (817) 594-9880 www.jacobmartin.com
Introductory Section
 Introductory Section COMPREHENSIVE ANNUAL FINANCIAL REPORT FISCAL YEAR ENDED JUNE 30, 2005 TABLE OF CONTENTS INTRODUCTORY SECTION: Page No. Table of Contents...i Letter of Transmittal...v Certificate
ORDINANCE NO WHEREAS, on September 14, 2004, the Board of Supervisors (the Board of
 ORDINANCE NO. 834 AN ORDINANCE OF THE BOARD OF SUPERVISORS OF RIVERSIDE COUNTY, CALIFORNIA AUTHORIZING THE LEVY OF SPECIAL TAXES IN COMMUNITY FACILITIES DISTRICT NO. 04-2 (LAKE HILLS CREST) OF THE COUNTY
Draft-Fiscal Impact Analysis of Union Square and Boynton Yards
 Draft-Fiscal Impact Analysis of Union Square and Boynton Yards Prepared for: City of Somerville, Massachusetts November 16, 2015 Prepared by: 4701 Sangamore Road Suite S240 Bethesda, Maryland 20816 800.424.4318
MUNICIPAL SERVICE REVIEW & SPHERE OF INFLUENCE UPDATE
 CITY OF RIVERBANK MUNICIPAL SERVICE REVIEW & SPHERE OF INFLUENCE UPDATE Existing SOI Proposed SOI Final Draft Prepared By: Adopted: July 27, 2016 February 2016 STANISLAUS LOCAL AGENCY FORMATION COMMISSION
RESOLUTION NO Adopted by the Sacramento City Council. September 17, 2013
 RESOLUTION NO. 2013-0307 Adopted by the Sacramento City Council September 17, 2013 RESOLUTION OF INTENTION TO ESTABLISH NATOMAS CROSSING YOUTH SERVICES COMMUNITY FACILITIES DISTRICT NO. 2013-01 AND TO
SALES TAX ATTRIBUTABLE TO VISITORS
 EXECUTIVE SUMMARY Applied Analysis was retained by the Las Vegas Convention and Visitors Authority (the LVCVA ) to review and analyze the economic impacts associated with its various operations and southern
AN ACT. Be it enacted by the General Assembly of the State of Ohio:
 (131st General Assembly) (Amended Substitute House Bill Number 233) AN ACT To amend sections 133.04, 133.06, 149.311, 709.024, 709.19, 3317.021, 4582.56, 5501.311, 5709.12, 5709.121, 5709.82, 5709.83,