2908 E Oakland Ave, Johnson City, TN 37601
|
|
|
- Justina Charles
- 5 years ago
- Views:
Transcription
 Unit Price: $12 PSF (Annual) Base Monthly Rent: $7,800 Lease Type: Modified Gross Overview/Comments Beautiful Commercial building")

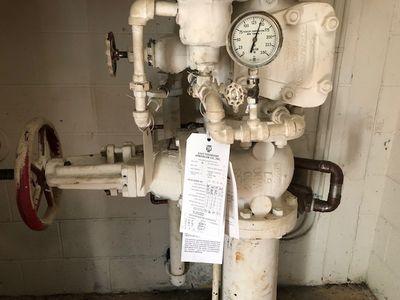
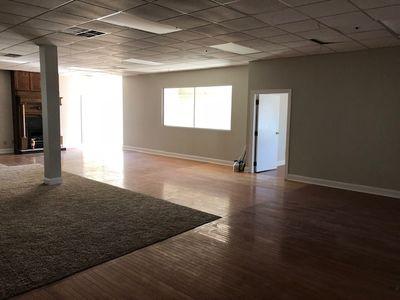
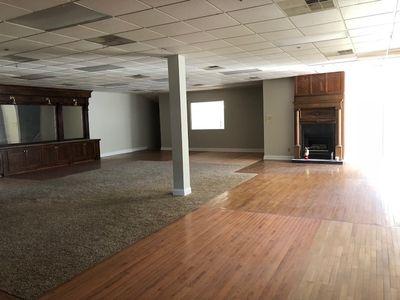
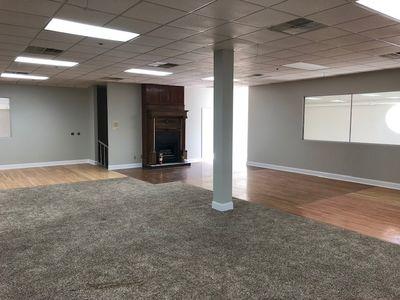
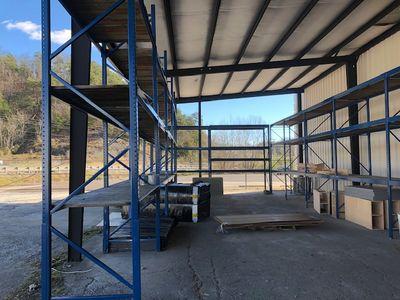
1 Office/retail Lease 2908 E Oakland Ave, Johnson City, TN Listing ID: Status: Active Property Type: Office For Lease Office Type: Executive Suites, Governmental Contiguous Space: 2,800-7,800 SF Total Available: 7,800 SF Lease Rate: $7,800 (Monthly) Unit Price: $12 PSF (Annual) Base Monthly Rent: $7,800 Lease Type: Modified Gross Overview/Comments Beautiful Commercial building near Bristol Highway on E Oakland now available for lease. Two floors, available, approximately 7800 square feet, 4800 lower level, and 2800 upper level. Storage warehouse off of main area, 1500 sq ft with 23 ft high ceilings. Second floor has large break room, and floor plan is modern and wide open. Lease one floor, or both. More Information Online QR Code Scan this image with your mobile device: General Information Office Type: Zoning: Executive Suites, Governmental, High-Tech, Institutional, Mixed Use, Flex Space, Office Building, Research & Development, Other B Class of Space: Gross Building Area: Usable Size (USF): Land Area: Class B 12,200 SF 7,800 SF 5 Acres Available Space Suite/Unit Number: Space Available: Minimum Divisible: Maximum Contiguous: Space Subcategory 1: Space Subcategory 2: A 7,800 SF 2,800 SF 7,800 SF Office Building Mixed Use Space Type: Relet Date Available: 01/18/2019 Lease Rate: $7,800 (Monthly) Lease Type: Modified Gross Parking Spaces: 0 Space Description total space available is 2 floors, approximately 7800 ft, first floor at 4800, second at Bottom floor sq footage includes 1500 sq ft of warehousing/ storage space, with roll up door, and a back lot with storage racking. Office/retail space is 2800 above, and 3300 below. Foyer has a bathroom, then another on both floors. Open bullpen design, one large office on each floor. plus breakroom. Rent is a modified gross, and includes taxes, Insurance, and CAM. Area & Location Property Located Between: Highway Access: East Oakland by Bristol Hwy near I-26 onramp Airports: Site Description: Tri-Cities Airport flat, large parking lot. Building Related Total Number of Buildings: 1 Number of Stories: 2 Year Built: 1968 Passenger Elevators: 0 Freight Elevators: 0 Page 1


2 Location Address: 2908 E Oakland Ave, Johnson City, TN County: Washington MSA: Johnson City Property Images IMG_6817 IMG_6818 Page 2


3 IMG_6820 IMG_6829 IMG_6821 IMG_6830 IMG_6824 IMG_6832 Page 3


4 IMG_6836 IMG_6843 IMG_6839 IMG_6851 IMG_6841 Page 4

5 Property Contacts Stephen J Goodson, ChFC Remax Checkmate, Commercial Division [M] [O] steveg@remax.net Page 5


6 Market Summary December, 2018 Tennessee 21.8 million SF Commercial Space For Sale 23,297 Acres Land & Farm For Sale 9.6 million SF Commercial Space For Lease $2.0 billion Total Sale Price Current Statistics for Tennessee Property Type Listings Asking Lease Rate Asking Sale Price Below List Days on Market Total Available Industrial 267 $4.37 PSF $25.54 PSF 14.3% million SF Office 1,233 $15.86 PSF $ PSF 15.8% million SF Retail-Commercial 872 $13.03 PSF $90.49 PSF 16.2% million SF Shopping Center 161 $13.14 PSF $59.37 PSF 12.6% ,105 SF Vacant Land 1,322 $0.98 PSF $1.15 PSF 19.5% million SF Farm/Ranch 9 - $0.61 PSF million SF Hospitality 13 - $2.26 PSF 15.3% million SF Multi-Family 61 - $75.67 PSF 27.0% ,426 SF Frequency: Statistics are compiled at the beginning of each month. Reliability: The quality of the data will vary based on many factors, including whether or not your CIE verifies the data on an ongoing basis. Statistics based on larger numbers of listings (as indicated by the "Listings" column) are generally more trustworthy. Accuracy: We make all attempts to normalize these stats, but make no guarantees about their accuracy. Outliers (extremely high or low values) are excluded from calculations. Counts: Listing and Transaction counts reflect the number of records with price and size information within valid ranges. The actual counts of all records in the CIE are larger. Weighted Averages: Price averages are weighed using the square footage available. Direct: Lease statistics are direct (exclude subleases). Lease Types: Because of discrepancies in how lease types (NNN, Gross, etc) are reported, we ignore differences in type all types are folded together into the lease rate stats. Below List: Reflects the average percent difference between the original listed price and the final transaction price. Net Absorption: We calculate absorption using a 90 day period. Locations: We only allow filters for locations with at least 100 active listings. Asking vs. Reported: "Asking" prices are based on active listings for the chosen locale, while "Reported" prices are calculated using completed transactions as reported by CIE members. Disclaimer: All statistics on this page have been gathered from user-loaded listings and userreported transactions. We have not verified accuracy and make no guarantees. By using the information provided on this page, the user acknowledges that the data may contain errors or other nonconformities. You and/or your client should diligently and independently verify the specifics of the information that you are using. Statistics courtesy of: Northeast Tennessee Association of REALTORS Page 6

7 Demographics, Labor/Workforce, and Consumer Expenditures 2908 E Oakland Ave, Johnson City, TN Disclaimer: While we believe this information (via GeoLytics) to be reliable, we have not checked its accuracy and make no guarantee as to its validity. By using the information provided on this page, the user acknowledges that the data may contain errors or other nonconformities. You and/or your client should diligently and independently verify the specifics of the information that you are using. Population 2023 Projection 3,982 33,946 90, Estimate 3,924 33,268 88, Estimate 4,090 34,588 90, Census 3,887 33,073 84,868 Growth % 2.04% 2.58% Growth % -3.82% -2.94% Growth % 4.58% 7.01% Population (Male) 2023 Projection 1,836 16,110 44, Estimate 1,822 15,728 43, Estimate 1,890 16,284 44, Census 1,757 15,649 41,188 Growth % 2.43% 2.57% Growth % -3.41% -2.75% Growth % 4.06% 7.47% Page 7
8 Population (Female) 2023 Projection 2,146 17,836 46, Estimate 2,102 17,540 45, Estimate 2,200 18,304 46, Census 2,130 17,424 43,680 Growth % 1.69% 2.6% Growth % -4.17% -3.11% Growth % 5.05% 6.59% Population by Age (2018 Estimate) Age 0 to ,168 5,785 Age 5 to ,916 5,043 Age 10 to ,909 4,899 Age 15 to ,879 4,746 Age 20 to ,851 4,762 Age 25 to ,833 4,992 Age 30 to ,889 5,437 Age 35 to ,970 5,827 Age 40 to ,089 6,132 Age 45 to ,260 6,359 Age 50 to ,280 6,229 Age 55 to ,285 6,001 Age 60 to ,154 5,529 Age 65 and over 891 6,785 16,413 Total Population 3,924 33,268 88,154 Median Age Age 0 to 5 Age 5 to 10 Age 10 to 15 Age 15 to 20 Age 20 to 25 Age 25 to 30 Age 30 to 35 Age 35 to 40 Age 40 to 45 Age 45 to 50 Age 50 to 55 Age 55 to 60 Age 60 to 65 Age 65 and over 6% 7% 7% 5% 6% 6% 5% 6% 6% 4% 6% 5% 4% 6% 5% 4% 6% 6% 6% 6% 6% 6% 6% 7% 7% 6% 7% 8% 7% 7% 7% 7% 7% 7% 7% 7% 7% 6% 6% 23% 20% 19% Median Age (Male) 2010 Census Median Age (Female) 2010 Census High School Graduates Age 25+ by Educational Attainment (2018 Estimate) High School Graduate (or GED) 764 5,605 16,195 Some College, No Degree 617 5,004 13,635 Associate or Bachelor's Degree 245 1,164 3,070 Master's Degree 124 1,468 3,646 Professional School Degree ,631 Doctorate Degree Total High School Graduates Age 25+ 1,905 14,459 39,122 High School Graduate (or GED) Some College, No Degree Associate or Bachelor's Degree Master's Degree Professional School Degree Doctorate Degree 40% 39% 41% 32% 35% 35% 13% 8% 8% 7% 10% 9% 5% 6% 4% 3% 3% 2% Page 8
9 Households 2023 Projection 2,051 15,061 38, Estimate 2,022 14,776 37, Estimate 2,108 15,371 38, Census 2,002 14,706 36,262 Growth % 1.93% 2.62% Growth % -3.87% -2.91% Growth % 4.52% 6.89% Average Household Size 2023 Projection Estimate Estimate Census Growth % -0.06% 0.01% Growth % 0.66% 0.33% Growth % -0.07% 0.05% Page 9
10 Households by Household Type and Size and Presence of Children (2018 Estimate) Family Households 934 8,689 21,937 Married-couple family 657 6,334 15,907 With own 191 2,260 5,527 No own 466 4,074 10,380 Male Householder: ,634 no wife present With own No own Female Householder: no husband 202 1,778 4,396 present With own ,406 No own ,990 Nonfamily Households 1,088 6,087 15,693 1 Person households 922 5,089 12, Unrelated people ,226 Total Households 2,022 14,776 37,630 Family Households Married-couple family With own No own Male Householder: no wife present With own No own Female Householder: no husband present With own No own Nonfamily Households 1 Person households 2+ Unrelated people 46% 59% 58% 32% 43% 42% 9% 15% 15% 23% 28% 28% 4% 4% 4% 1% 2% 2% 2% 2% 2% 10% 12% 12% 5% 6% 6% 5% 6% 5% 54% 41% 42% 46% 34% 33% 8% 7% 9% Page 10
11 Households by Household Income (2018 Estimate) Less than $25, ,858 12,651 $25,000 to $49, ,517 10,271 $50,000 to $74, ,279 6,075 $75,000 to $99, ,484 3,414 $100,000 to $124, ,891 $125,000 to $149, $150,000 to $199, $200,000 or more ,415 Total Households 2,022 14,776 37,630 Average Household Income $47, $60, $55, Median Household Income $31, $48, $43, Less than $25,000 $25,000 to $49,999 $50,000 to $74,999 $75,000 to $99,999 $100,000 to $124,999 $125,000 to $149,999 $150,000 to $199,999 $200,000 or more 39% 33% 34% 32% 24% 27% 16% 15% 16% 4% 10% 9% 0% 7% 5% 4% 3% 2% 3% 4% 3% 3% 4% 4% Households by Household Income (2023 Projection) Less than $25, ,976 13,029 $25,000 to $49, ,577 10,535 $50,000 to $74, ,317 6,216 $75,000 to $99, ,510 3,495 $100,000 to $124, ,941 $125,000 to $149, $150,000 to $199, ,015 $200,000 or more ,440 Total Households 2,051 15,061 38,615 Average Household Income $47, $61, $55, Median Household Income $32, $48, $43, Less than $25,000 $25,000 to $49,999 $50,000 to $74,999 $75,000 to $99,999 $100,000 to $124,999 $125,000 to $149,999 $150,000 to $199,999 $200,000 or more 39% 33% 34% 31% 24% 27% 16% 15% 16% 4% 10% 9% 0% 7% 5% 4% 3% 2% 3% 4% 3% 3% 4% 4% Per Capita Income 2018 Estimate $24, $26, $23, Estimate $24, $26, $23, Growth % 1.86% 1.2% Unemployment Rate 2018 Estimate 1.5% 3.2% 3.6% 2015 Estimate 4.32% 7.37% 6.81% Growth % % % Page 11
12 Population Age 16+ By Employment Status (2018 Estimate) Labor Force 1,988 16,207 42,800 Civilian, Employed 1,958 15,700 41,313 Civilian, Unemployed ,487 Not in Labor Force 1,245 10,627 28,545 Total Population Age 16+ 3,233 26,834 71,345 Labor Force Civilian, Employed Civilian, Unemployed Not in Labor Force 61% 60% 60% 61% 59% 58% 1% 2% 2% 39% 40% 40% Employed Civilian Population Age 16+ by Industry (2018 Estimate) Agriculture, forestry, fishing and hunting, mining and 125 1,192 2,962 construction Manufacturing 180 1,596 4,534 Wholesale & retail trade 389 2,008 6,451 Transportation and warehousing, and ,359 utilities Information ,184 Finance, insurance, real estate and ,434 rental and leasing Professional, scientific, and 181 1,212 3,055 technical services Educational, health and social services 551 4,751 11,604 Arts, entertainment, recreation, accommodation and 168 1,567 4,618 food services Other services (except public 75 1,369 2,886 administration) Public Administration ,226 Total Employed Civilian Population Age 16+ 1,958 15,700 41,313 Agriculture, forestry, fishing and hunting, mining and construction Manufacturing Wholesale & retail trade Transportation and warehousing, and utilities Information Finance, insurance, real estate and rental and leasing Professional, scientific, and technical services Educational, health and social services Arts, entertainment, recreation, accommodation and food services Other services (except public administration) Public Administration 6% 8% 7% 9% 10% 11% 20% 13% 16% 6% 3% 3% 3% 2% 3% 4% 5% 3% 9% 8% 7% 28% 30% 28% 9% 10% 11% 4% 9% 7% 1% 2% 3% Housing Units by Tenure (2018 Estimate) Vacant Housing Units 610 4,307 9,125 Occupied Housing Units 2,022 14,776 37,630 Owner- Occupied 974 9,109 22,309 Renter- Occupied 1,048 5,667 15,321 Total Housing Units 2,632 19,083 46,755 Vacant Housing Units Occupied Housing Units Owner- Occupied Renter- Occupied 23% 23% 20% 77% 77% 80% 37% 48% 48% 40% 30% 33% Page 12
1112 Carroll Creek Rd, Johnson City, TN 37601
 Deanwood Apartments for Sale 1112 Carroll Creek Rd, Johnson City, TN 37601 Listing ID: 30363543 Status: Active Property Type: Multi-Family For Sale Multi-Family Type: Low-Rise/Garden Size: 23,432 SF Sale
3424 East Road, Saginaw, MI 48601
 R & W Investment 3424 East Road, Saginaw, MI 48601 Listing ID: 30298825 Status: Active Property Type: Industrial For Sale Industrial Type: Flex Space, Free-Standing Size: 7,564 SF Sale Price: $230,000
11701 Orpington St, Orlando, FL 32817
 Professional Space for Lease 11701 Orpington St, Orlando, FL 32817 Listing ID: 30295554 Status: Active Property Type: Office For Lease Office Type: Business Park, Governmental Contiguous Space: 1,250 SF
Benchmark Avenue, Fort Myers, FL 33905
 Available October 2017 Benchmark Industrial For Lease 1681-1687 Benchmark Avenue, Fort Myers, FL 33905 Listing ID: 30132311 Status: Active Property Type: Industrial For Lease Industrial Type: Flex Space,
14114 Palm Beach Blvd, Fort Myers, FL 33905
 Palm Beach Boulevard Land 14114 Palm Beach Blvd, Fort Myers, FL 33905 Listing ID: 30318883 Status: Active Property Type: Vacant Land For Sale Possible Uses: Office, Retail Gross Land Area: 18,000 SF Sale
46 Acres - Fronting Interstate 81 & Hopewell Rd. Prime Location - Zoned Industrial Potential for 2 Building Complexes
 46 Acre Land Opportunity - I-81 Frontage Design Concept: 2 Potential Building Parcels Prepared on 46 Acres - Fronting Interstate 81 & Hopewell Rd. Prime Location - Zoned Industrial Potential for 2 Building
 12519 S Cleveland Ave Details Prepared on Prepared By Josh Burdine 239-362-3173 josh@rockstar-realestate.com Page 1 14,000 sq feet building on 41 in Fort Myers 12519 S Cleveland Ave, Fort Myers, FL 33907
5419 S Decatur Blvd, Las Vegas, NV 89118
 Call Center, Office, Showroom, Warehouse, Auto, Flex 5419 S Decatur Blvd, Las Vegas, NV 89118 Listing ID: 29978730 Status: Active Property Type: Office For Lease Office Type: Business Park, Governmental
1208 S Eastern Ave, Las Vegas, NV 89104
 Office Medical Veterinarin Signage Frontage Visibility 89104 1208 S Eastern Ave, Las Vegas, NV 89104 Listing ID: 30138546 Status: Active Property Type: Office For Lease Office Type: Governmental, High-Tech
4575 Bay Rd, Saginaw, MI 48603
 Georges 4575 Bay Rd, Saginaw, MI 48603 Listing ID: 30340682 Status: Active Property Type: Business Opportunity For Sale Industry: Professional Services Size: 6,600 SF Sale Price: $852,000 Sale Terms: Cash
2415 Reynolds Ave, North Las Vegas, NV 89030
 7,221' *Reynolds Medical Center* Gray Shell w/ Elevator 89030 2415 Reynolds Ave, North Las Vegas, NV 89030 Listing ID: 29944098 Status: Active Property Type: Office For Sale (also listed as Special Purpose)
1320 S Casino Center Blvd, Las Vegas, NV 89104
 Professional or Attorney Office Arts District Casino Center 1320 S Casino Center Blvd, Las Vegas, NV 89104 Listing ID: 30030990 Status: Active Property Type: Office For Sale Office Type: Business Park,
5715 W. Alexander #150, Las Vegas, NV 89130
 Brand New Everything! NW Professional Office Condo 5715 W. Alexander #150, Las Vegas, NV 89130 Listing ID: 30279487 Status: Active Property Type: Office For Lease Office Type: Business Park, Executive
2365 Reynolds Ave, North Las Vegas, NV 89030
 10% Down $77 psf 7,072' Medical Office Elevator & Gray Shell 2365 Reynolds Ave, North Las Vegas, NV 89030 Listing ID: 29944110 Status: Active Property Type: Office For Sale Office Type: Business Park,
2965 S Jones Blvd, Las Vegas, NV 89146
 10% Down Data Center Office Call Center Fiber Optic Cubicles 2965 S Jones Blvd, Las Vegas, NV 89146 Listing ID: 30029430 Status: Active Property Type: Office For Sale Office Type: Business Park, Governmental
5715 W. Alexander #150, Las Vegas, NV 89130
 10% Down Office Condo 49c PSF Payments 5715 W. Alexander #150, Las Vegas, NV 89130 Listing ID: 30279469 Status: Active Property Type: Office For Sale Office Type: Business Park, Executive Suites Size:
2465 Reynolds Ave, North Las Vegas, NV 89030
 12,020' Reynolds Medical & Attorney Build-Out Elevator 89030 2465 Reynolds Ave, North Las Vegas, NV 89030 Listing ID: 29944111 Status: Active Property Type: Office For Sale (also listed as Special Purpose)
5419 S Decatur Blvd, Las Vegas, NV 89118
 10% Down, Call Center, Office, Showroom, Warehouse, Auto, Flex 5419 S Decatur Blvd, Las Vegas, NV 89118 Listing ID: 29978727 Status: Active Property Type: Industrial For Sale Industrial Type: Flex Space,
7401 W Charleston Blvd, Las Vegas, NV 89117
 Cool $1,000,000.00 Discount Off Sale Price 7401 W Charleston Blvd, Las Vegas, NV 89117 Listing ID: 30193298 Status: Active Property Type: Office For Sale Office Type: Business Park, Executive Suites Size:
7401 W Charleston Blvd, Las Vegas, NV 89117
 Cool $1.25 Million Discounted Las Vegas Company HQ Office 7401 W Charleston Blvd, Las Vegas, NV 89117 Listing ID: Status: Property Type: Office Type: Size: Sale Price: Unit Price: Sale Terms: Overview/Comments
3280 E Tropicana Ave, Las Vegas, NV 89121
 65c Rent NNN Various Size Retail Shop Office Store Medical 3280 E Tropicana Ave, Las Vegas, NV 89121 Listing ID: 29848683 Status: Active Property Type: Retail-Commercial For Lease (also listed as Office,
Contact: Larry Hausman (502) Outer Loop, Louisville, KY Knobview Shopping Center
 Outer Loop, Louisville, KY Knobview Shopping Center") 5603-5637 Outer Loop, Louisville, KY 40219 Knobview Shopping Center Jefferson Mall Academy Sports Center SUBJECT Knobview Shopping Center offers a diverse mix of local and national tenants. The center
5603-5637 Outer Loop, Louisville, KY 40219 Knobview Shopping Center Jefferson Mall Academy Sports Center SUBJECT Knobview Shopping Center offers a diverse mix of local and national tenants. The center
E. Flamingo Rd, Las Vegas, NV 89121
 School Restaurant Retail Office Convenience 89c to $1.25 3620 3650 3654 E. Flamingo Rd, Las Vegas, NV 89121 Listing ID: 30284747 Status: Active Property Type: Retail-Commercial For Lease Retail-Commercial
5200 Ocean Blvd, Siesta Key, FL 34242
 Siesta Key Restaurant- BEST LOCATION IN THE VILLAGE! 5200 Ocean Blvd, Siesta Key, FL 34242 Listing ID: 29826583 Status: Active Property Type: Business Opportunity For Sale Industry: Food and Beverage Size:
E. Flamingo Rd, Las Vegas, NV 89121
 Restaurant Supper Club Retail Office Convenience 89c to $1.25 3620 3650 3654 E. Flamingo Rd, Las Vegas, NV 89121 Listing ID: 30214834 Status: Active Property Type: Retail-Commercial For Lease Retail-Commercial
SELECTED ECONOMIC CHARACTERISTICS American Community Survey 5-Year Estimates
 DP03 SELECTED ECONOMIC CHARACTERISTICS 2008-2012 American Community Survey 5-Year Estimates Supporting documentation on code lists, subject definitions, data accuracy, and statistical testing can be found
SOUTH DAKOTA KIDS COUNT BEACOM SCHOOL OF BUSINESS UNIVERSITY OF SOUTH DAKOTA 414 E. CLARK STREET VERMILLION, SD
 Brookings County Compared to o SDSD Undergrad Enrollment approximately 11,225 o USD Undergrad Enrollment approximately 7,600 o Brookings County 1 year population estimate for 2013 is 32,968 o 1 year population
American Community Survey 5-Year Estimates
 DP03 SELECTED ECONOMIC CHARACTERISTICS 2013-2017 American Community Survey 5-Year Estimates Supporting documentation on code lists, subject definitions, data accuracy, and statistical testing can be found
Mid - City Industrial
 Minneapolis neighborhood profile October 2011 Mid - City Industrial About this area The Mid-City Industrial neighborhood is bordered by I- 35W, Highway 280, East Hennepin Avenue, and Winter Street Northeast.
Tell us what you think. Provide feedback to help make American Community Survey data more useful for you.
 DP03 SELECTED ECONOMIC CHARACTERISTICS 2016 American Community Survey 1-Year Estimates Supporting documentation on code lists, subject definitions, data accuracy, and statistical testing can be found on
American Community Survey 5-Year Estimates
 DP03 SELECTED ECONOMIC CHARACTERISTICS 2012-2016 American Community Survey 5-Year Estimates Supporting documentation on code lists, subject definitions, data accuracy, and statistical testing can be found
American Community Survey 5-Year Estimates
 DP03 SELECTED ECONOMIC CHARACTERISTICS 2012-2016 American Community Survey 5-Year Estimates Supporting documentation on code lists, subject definitions, data accuracy, and statistical testing can be found
American Community Survey 5-Year Estimates
 DP03 SELECTED ECONOMIC CHARACTERISTICS 2012-2016 American Community Survey 5-Year Estimates Supporting documentation on code lists, subject definitions, data accuracy, and statistical testing can be found
American Community Survey 5-Year Estimates
 DP03 SELECTED ECONOMIC CHARACTERISTICS 2012-2016 American Community Survey 5-Year Estimates Supporting documentation on code lists, subject definitions, data accuracy, and statistical testing can be found
American Community Survey 5-Year Estimates
 DP03 SELECTED ECONOMIC CHARACTERISTICS 2012-2016 American Community Survey 5-Year Estimates Supporting documentation on code lists, subject definitions, data accuracy, and statistical testing can be found
American Community Survey 5-Year Estimates
 DP03 SELECTED ECONOMIC CHARACTERISTICS 2012-2016 American Community Survey 5-Year Estimates Supporting documentation on code lists, subject definitions, data accuracy, and statistical testing can be found
American Community Survey 5-Year Estimates
 DP03 SELECTED ECONOMIC CHARACTERISTICS 2012-2016 American Community Survey 5-Year Estimates Supporting documentation on code lists, subject definitions, data accuracy, and statistical testing can be found
American Community Survey 5-Year Estimates
 DP03 SELECTED ECONOMIC CHARACTERISTICS 2012-2016 American Community Survey 5-Year Estimates Supporting documentation on code lists, subject definitions, data accuracy, and statistical testing can be found
American Community Survey 5-Year Estimates
 DP03 SELECTED ECONOMIC CHARACTERISTICS 2012-2016 American Community Survey 5-Year Estimates Supporting documentation on code lists, subject definitions, data accuracy, and statistical testing can be found
American Community Survey 5-Year Estimates
 DP03 SELECTED ECONOMIC CHARACTERISTICS 2012-2016 American Community Survey 5-Year Estimates Supporting documentation on code lists, subject definitions, data accuracy, and statistical testing can be found
American Community Survey 5-Year Estimates
 DP03 SELECTED ECONOMIC CHARACTERISTICS 2012-2016 American Community Survey 5-Year Estimates Supporting documentation on code lists, subject definitions, data accuracy, and statistical testing can be found
American Community Survey 5-Year Estimates
 DP03 SELECTED ECONOMIC CHARACTERISTICS 2012-2016 American Community Survey 5-Year Estimates Supporting documentation on code lists, subject definitions, data accuracy, and statistical testing can be found
American Community Survey 5-Year Estimates
 DP03 SELECTED ECONOMIC CHARACTERISTICS 2012-2016 American Community Survey 5-Year Estimates Supporting documentation on code lists, subject definitions, data accuracy, and statistical testing can be found
American Community Survey 5-Year Estimates
 DP03 SELECTED ECONOMIC CHARACTERISTICS 2012-2016 American Community Survey 5-Year Estimates Supporting documentation on code lists, subject definitions, data accuracy, and statistical testing can be found
American Community Survey 5-Year Estimates
 DP03 SELECTED ECONOMIC CHARACTERISTICS 2012-2016 American Community Survey 5-Year Estimates Supporting documentation on code lists, subject definitions, data accuracy, and statistical testing can be found
American Community Survey 5-Year Estimates
 DP03 SELECTED ECONOMIC CHARACTERISTICS 2012-2016 American Community Survey 5-Year Estimates Supporting documentation on code lists, subject definitions, data accuracy, and statistical testing can be found
American Community Survey 5-Year Estimates
 DP03 SELECTED ECONOMIC CHARACTERISTICS 2012-2016 American Community Survey 5-Year Estimates Supporting documentation on code lists, subject definitions, data accuracy, and statistical testing can be found
American Community Survey 5-Year Estimates
 DP03 SELECTED ECONOMIC CHARACTERISTICS 2012-2016 American Community Survey 5-Year Estimates Supporting documentation on code lists, subject definitions, data accuracy, and statistical testing can be found
American Community Survey 5-Year Estimates
 DP03 SELECTED ECONOMIC CHARACTERISTICS 2012-2016 American Community Survey 5-Year Estimates Supporting documentation on code lists, subject definitions, data accuracy, and statistical testing can be found
American Community Survey 5-Year Estimates
 DP03 SELECTED ECONOMIC CHARACTERISTICS 2012-2016 American Community Survey 5-Year Estimates Supporting documentation on code lists, subject definitions, data accuracy, and statistical testing can be found
American Community Survey 5-Year Estimates
 DP03 SELECTED ECONOMIC CHARACTERISTICS 2012-2016 American Community Survey 5-Year Estimates Supporting documentation on code lists, subject definitions, data accuracy, and statistical testing can be found
American Community Survey 5-Year Estimates
 DP03 SELECTED ECONOMIC CHARACTERISTICS 2012-2016 American Community Survey 5-Year Estimates Supporting documentation on code lists, subject definitions, data accuracy, and statistical testing can be found
American Community Survey 5-Year Estimates
 DP03 SELECTED ECONOMIC CHARACTERISTICS 2012-2016 American Community Survey 5-Year Estimates Supporting documentation on code lists, subject definitions, data accuracy, and statistical testing can be found
American Community Survey 5-Year Estimates
 DP03 SELECTED ECONOMIC CHARACTERISTICS 2012-2016 American Community Survey 5-Year Estimates Supporting documentation on code lists, subject definitions, data accuracy, and statistical testing can be found
American Community Survey 5-Year Estimates
 DP03 SELECTED ECONOMIC CHARACTERISTICS 2012-2016 American Community Survey 5-Year Estimates Supporting documentation on code lists, subject definitions, data accuracy, and statistical testing can be found
American Community Survey 5-Year Estimates
 DP03 SELECTED ECONOMIC CHARACTERISTICS 2012-2016 American Community Survey 5-Year Estimates Supporting documentation on code lists, subject definitions, data accuracy, and statistical testing can be found
Camden Industrial. Minneapolis neighborhood profile. About this area. Trends in the area. Neighborhood in Minneapolis.
 Minneapolis neighborhood profile October 2011 Camden Industrial About this area The Camden Industrial neighborhood is bordered by 48th Avenue North, the Mississippi River, Dowling Avenue North, Washington
University of Minnesota
 neighborhood profile October 2011 About this area The University neighborhood is bordered by 11th Avenue Southeast, University Avenue, 15th Avenue Southeast, the railroad tracks, Oak Street, and the Mississippi
Shingle Creek. Minneapolis neighborhood profile. About this area. Trends in the area. Neighborhood in Minneapolis. October 2011
 neighborhood profile October 2011 About this area The neighborhood is bordered by 53rd Avenue North, Humboldt Avenue North, 49th Avenue North, and Xerxes Avenue North. It is home to Olson Middle School.
Town Profiles: Demographic, Economic, and Housing Statistics for De Smet City and Wall Town, SOuth Dakota
 South Dakota State University Open PRAIRIE: Open Public Research Access Institutional Repository and Information Exchange Census Data Center News Releases SDSU Census Data Center 12-7-2017 Town Profiles:
TABLE 1. PROFILE OF GENERAL DEMOGRAPHIC CHARACTERISTICS
 Waterloo city, Iowa TABLE 1. PROFILE OF GENERAL DEMOGRAPHIC CHARACTERISTICS Estimate Lower Bound Upper Bound Total population 66,659 64,093 69,225 SEX AND AGE Male 32,096 30,415 33,777 Female 34,563 33,025
$1,600,000. Boston Reid LAKESIDE BUSINESS PARK. 117 Crosslake Park Drive Mooresville, NC SITE FEATURES. Lead 2 Real Estate Group
 LAKESIDE BUSINESS PARK 117 Crosslake Park Drive Mooresville, NC 28117 $1,600,000 Marketed By SITE FEATURES 17,000 + SF Industrial Building on 2.6 Acres Located in Lakeside Business Park High Power for
City of Edmonton Population Change by Age,
 Population Change by Age, 1996-2001 2001 Edmonton Demographic Profile The City of Edmonton s 2001population increased by 49,800 since the 1996 census. Migration figures are not available at the municipal
LAND FOR SALE Blair Road, Mint Hill, NC PROPERTY OVERVIEW. Large parcel with I-485 access via Blair Road exit in the path of. growth.
 LAND FOR SALE 10395 Blair Road, Mint Hill, NC 28227 OFFERING SUMMARY SALE PRICE: $1,000,000 PROPERTY OVERVIEW Large parcel with I485 access via Blair Road exit in the path of growth. LOT SIZE: 9.28 Acres
Economic Overview City of Tyler, TX. January 8, 2018
 Economic Overview City of Tyler, TX January 8, 2018 DEMOGRAPHIC PROFILE...3 EMPLOYMENT TRENDS...5 WAGE TRENDS...5 COST OF LIVING INDEX...6 INDUSTRY SNAPSHOT...7 OCCUPATION SNAPSHOT...9 INDUSTRY CLUSTERS...
Average persons in household. Top three industries Post-secondary education (25 64 years) 7.1% Unemployment rate
 7.1% Unemployment rate") Demographic snapshot The Town of Oakville City of Burl ington City of Mis sissauga Town of Milton Population 198,042 Median age Average persons in household 41 2.8 years old $149,945 Average household
Demographic snapshot The Town of Oakville City of Burl ington City of Mis sissauga Town of Milton Population 198,042 Median age Average persons in household 41 2.8 years old $149,945 Average household
Economic Overview York County, South Carolina. February 14, 2018
 Economic Overview York County, February 14, 2018 DEMOGRAPHIC PROFILE... 3 EMPLOYMENT TRENDS... 5 UNEMPLOYMENT RATE... 5 WAGE TRENDS... 6 COST OF LIVING INDEX... 6 INDUSTRY SNAPSHOT... 7 OCCUPATION SNAPSHOT...
ECONOMIC OVERVIEW DuPage County, Illinois
 ECONOMIC OVERVIEW DuPage County, Illinois DEMOGRAPHIC PROFILE... 3 EMPLOYMENT TRENDS... 5 UNEMPLOYMENT RATE... 5 WAGE TRENDS... 6 COST OF LIVING INDEX... 7 INDUSTRY SNAPSHOT... 8 OCCUPATION SNAPSHOT...
Economic Overview. Lawrence, KS MSA
 Economic Overview Lawrence, KS MSA March 5, 2019 DEMOGRAPHIC PROFILE... 3 EMPLOYMENT TRENDS... 5 UNEMPLOYMENT RATE... 5 WAGE TRENDS... 6 COST OF LIVING INDEX... 7 INDUSTRY SNAPSHOT... 8 OCCUPATION SNAPSHOT...
PROPOSED SHOPPING CENTER
 PROPOSED SHOPPING CENTER Southeast Corner I-95 & Highway 192 Melbourne, Florida In a 5 Mile Radius 80,862 Population 32,408 Households $61K Avg HH Income SOONER INVESTMENT Commercial & Investment Real
Wisconsin Economic Development Corporation
 Wisconsin Economic Development Corporation 201 W. Washington Ave. Madison, Wisconsin 53707 608.267.4417 Analyst Report Economic Modeling Specialists, Inc. www.economicmodeling.com 1 Region Info Region:
ACS DEMOGRAPHIC AND HOUSING ESTIMATES American Community Survey 1-Year Estimates
 DP05 ACS DEMOGRAPHIC AND HOUSING ESTIMATES 2010 American Community Survey 1-Year s Supporting documentation on code lists, subject definitions, data accuracy, and statistical testing can be found on the
ACS DEMOGRAPHIC AND HOUSING ESTIMATES American Community Survey 1-Year Estimates
 DP05 ACS DEMOGRAPHIC AND HOUSING ESTIMATES 2012 American Community Survey 1-Year Estimates Supporting documentation on code lists, subject definitions, data accuracy, and statistical testing can be found
Monte Vista Population, ,744 4,651 4,564 4,467 4,458 4,432 4,451
 1 Monte Vista 4,8 4,7 4,6 4,5 4,4 4,3 4,2 4,1 4,61 4,612 4,61 4,676 Monte Vista, 2-213 4,744 4,651 4,564 4,467 4,458 4,432 4,451 4,418 4,412 4,355 2 21 22 23 24 25 26 27 28 29 21 211 212 213 Year Monte
EVEREST. Retail Investment Opportunity. Ivy Hills Retail Center 7397 Main Street Newtown, OH CONTACT: Chris Nachtrab.
 Retail Investment Opportunity CONTACT: Chris Nachtrab chris.nachtrab@everestrealestate.com 513/769-2509 John Thompson john.thompson@everestrealestate.com 513/769-2514 Ivy Hills Retail Center 7397 Main
Economic Overview 45-Minute Commute From Airport Park. June 6, 2017
 Economic Overview 45-Minute Commute From Airport Park June 6, 2017 DEMOGRAPHIC PROFILE... 3 EMPLOYMENT TRENDS... 5 WAGE TRENDS... 5 COST OF LIVING INDEX... 6 INDUSTRY SNAPSHOT... 7 OCCUPATION SNAPSHOT...
Economic Overview Monterey County, California. July 22, 2016
 Economic Overview Monterey July 22, 2016 DEMOGRAPHIC PROFILE... 3 EMPLOYMENT TRENDS... 5 UNEMPLOYMENT RATE... 5 WAGE TRENDS... 6 COST OF LIVING INDEX... 6 INDUSTRY SNAPSHOT... 7 OCCUPATION SNAPSHOT...
Procter Properties P.O. Box 3484 Greensboro, NC
 Procter Properties P.O. Box 3484 Greensboro, NC 27402 3208 West Gate City Boulevard 3208 W Gate City Blv Greensboro, NC 27407 Property Type Retail Building Size 11,747 SF Owner (Legal) Property Subtype
Economic Overview Capital District
 August 29, 2017 Economic Overview Capital District Contact: Lisa.Montiel@suny.edu DEMOGRAPHIC PROFILE... 3 EMPLOYMENT TRENDS... 5 UNEMPLOYMENT RATE... 5 WAGE TRENDS... 6 COST OF LIVING INDEX... 6 INDUSTRY
Woodlands County Economic Indicators 2015
 Woodlands County Economic Indicators 215 Message from the Mayor In my time as Mayor, I have witnessed several recessions, and it certainly says a lot about our community. In 28, while businesses around
Economic Overview Loudoun County, Virginia. October 23, 2017
 Economic Overview October 23, 2017 DEMOGRAPHIC PROFILE... 3 EMPLOYMENT TRENDS... 5 UNEMPLOYMENT RATE... 5 WAGE TRENDS... 6 COST OF LIVING INDEX... 6 INDUSTRY SNAPSHOT... 7 OCCUPATION SNAPSHOT... 9 INDUSTRY
DEMOGRAPHIC PROFILE...3 EMPLOYMENT TRENDS...5 UNEMPLOYMENT RATE...5 WAGE TRENDS...6 COST OF LIVING INDEX...6 INDUSTRY SNAPSHOT...7
 March 14, 2017 DEMOGRAPHIC PROFILE...3 EMPLOYMENT TRENDS...5 UNEMPLOYMENT RATE...5 WAGE TRENDS...6 COST OF LIVING INDEX...6 INDUSTRY SNAPSHOT...7 OCCUPATION SNAPSHOT...9 INDUSTRY CLUSTERS... 12 EDUCATION
Economic Overview Long Island
 Report created on August 29, 2017 Economic Overview Long Island Contact: Lisa.Montiel@suny.edu DEMOGRAPHIC PROFILE... 3 EMPLOYMENT TRENDS... 5 UNEMPLOYMENT RATE... 5 WAGE TRENDS... 6 COST OF LIVING INDEX...
Daniel Jung CRENSHAW BLVD CRENSHAW BLVD INGLEWOOD CA, CA Priming Capital 6 Centerpointe Dr La Palma, CA
 11225 CRENSHAW BLVD 11225 CRENSHAW BLVD INGLEWOOD CA, CA 90303 Property Type Retail Building Size Owner (Legal) Property Subtype Auto Dealer Office SF Owner (True) Zoning Industrial SF County Los Angeles
Economic Overview Western New York
 Report created on August 29, 2017 Economic Overview Western New Contact: Lisa.Montiel@suny.edu DEMOGRAPHIC PROFILE... 3 EMPLOYMENT TRENDS... 5 UNEMPLOYMENT RATE... 5 WAGE TRENDS... 6 COST OF LIVING INDEX...
October 28, Economic Overview Yellowstone County, Montana
 October 28, 2016 Economic Overview Yellowstone DEMOGRAPHIC PROFILE...3 EMPLOYMENT TRENDS...5 UNEMPLOYMENT RATE...5 WAGE TRENDS...6 COST OF LIVING INDEX...6 INDUSTRY SNAPSHOT...7 OCCUPATION SNAPSHOT...9
Economic Overview Fairfax / Falls Church. October 23, 2017
 Economic Overview Fairfax / Falls Church October 23, 2017 DEMOGRAPHIC PROFILE... 3 EMPLOYMENT TRENDS... 5 UNEMPLOYMENT RATE... 5 WAGE TRENDS... 6 COST OF LIVING INDEX... 6 INDUSTRY SNAPSHOT... 7 OCCUPATION
 http://www.tennessee.gov/tacir/_profile/hardin_profile.htm Page 1 of 13 I. Geography & Demographics VI. Government Finance II. Income & Poverty VII. Public Infrastructure Needs Inventory III. Health &
Economic Overview Prince William/Manassas. October 23, 2017
 Economic Overview Prince William/Manassas October 23, 2017 DEMOGRAPHIC PROFILE... 3 EMPLOYMENT TRENDS... 5 UNEMPLOYMENT RATE... 5 WAGE TRENDS... 6 COST OF LIVING INDEX... 6 INDUSTRY SNAPSHOT... 7 OCCUPATION
The Trails. 1,500 sf Space Available. In a 3 Mile Radius 69,985 Population 25,450 Households $78,216 Avg HH Inc. 1,500 sf Corner Space
 1,500 sf Space Available The Trails Edmond Rd (2nd St) & Santa Fe Ave ~ Edmond, Oklahoma Current Tenancy: Edmond YMCA Spinal Wellness Clinic Lemongrass Thai Cuisine Kumon Learning Center Katie s Family
W Republic Rd, Springfield, MO 65807
 Republic Plaza, All Available Suites 2141-2155 W Republic Rd, Springfield, MO 65807 Listing ID: 29778068 Status: Active Property Type: Shopping Center For Lease (also listed as Retail-Commercial, Office)
Urban Action Agenda Community Profiles COVER TO GO HERE. City of Beacon
 Urban Action Agenda Community Profiles COVER TO GO HERE City of Beacon COMMUNITY OVERVIEW MAP POPULATION & DEMOGRAPHICS Population Basics 2,212 Population (2015) Population Change 2. since 2000 0.5 Square
SEVEN HILLS MEDICAL & BUSINESS PARK
 PROPERTY HIGHLIGHTS: Turnkey medical and professional suites available Unit sizes range from ±1,808 - ±8,130 SF Lease rate: $1.29 - $1.50 SF/M NNN CAM s: $0.40 SF/M Zoning: C-O (Office Commercial) Parcel
American Community Survey 5-Year Estimates
 DP02 SELECTED SOCIAL CHARACTERISTICS IN THE UNITED STATES 2007-2011 American Community Survey 5-Year Estimates Supporting documentation on code lists, subject definitions, data accuracy, and statistical
Standing Rock Indian Reservation Agricultural Statistics 2002 Census of Agriculture
 Standing Rock Indian Reservation Agricultural Statistics 2002 Census of Agriculture Farms Operated by All Farms American Indians Farms Farms: (number) 358 63 Land in farms (acres) 1,686,593 392,239 Average
APPENDIX 6: CENSUS DATA BURLINGTON, VERMONT
 APPENDIX 6: CENSUS DATA BURLINGTON, VERMONT 2000 CENSUS DATA 2005-2007 AMERICAN COMMUNITY SURVEY Burlington city, Vermont - Fact Sheet - American FactFinder Page 1 of 2 FACT SHEET Burlington
Economic Overview Mohawk Valley
 Report created on August 29, 2017 Economic Overview Mohawk Valley Contact: Lisa.Montiel@suny.edu DEMOGRAPHIC PROFILE... 3 EMPLOYMENT TRENDS... 5 UNEMPLOYMENT RATE... 5 WAGE TRENDS... 6 COST OF LIVING INDEX...
Rosebud Indian Reservation Agricultural Statistics 2002 Census of Agriculture
 Rosebud Indian Reservation Agricultural Statistics 2002 Census of Agriculture Farms Operated by All Farms American Indians Farms Farms: (number) 349 103 Land in farms (acres) 1,367,027 516,793 Average
Urban Action Agenda Community Profiles COVER TO GO HERE. City of Beacon
 Urban Action Agenda Community Profiles COVER TO GO HERE City of Beacon COMMUNITY OVERVIEW MAP POPULATION & DEMOGRAPHICS Population Basics 27,828 Population (2015) Population Change 9.6% since 2000 5.1
American Community Survey 5-Year Estimates
 DP05 ACS DEMOGRAPHIC AND HOUSING ESTIMATES 2011-2015 American Community Survey 5-Year Estimates Supporting documentation on code lists, subject definitions, data accuracy, and statistical testing can be