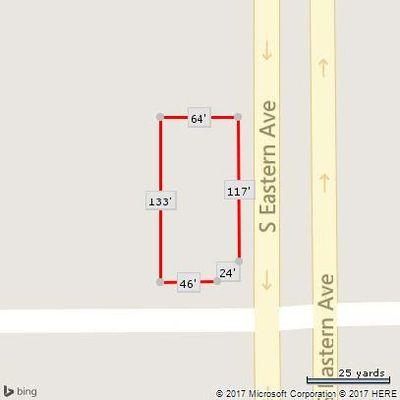
1208 S Eastern Ave, Las Vegas, NV 89104
|
|
|
- Arthur Cain
- 5 years ago
- Views:
Transcription
 Unit Price: $12 PSF (Annual) Base Monthly Rent: $2,343 Lease Type: NNN Overview/Comments Pro Office, Medical, Veterinarian,")

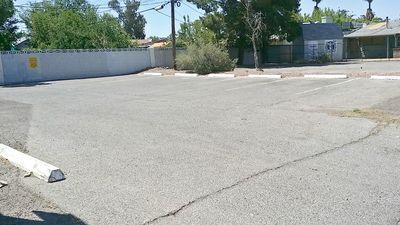
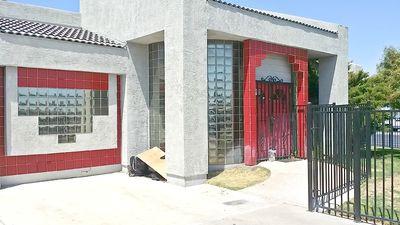
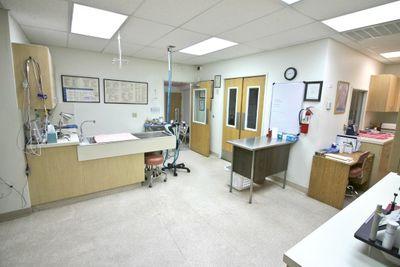
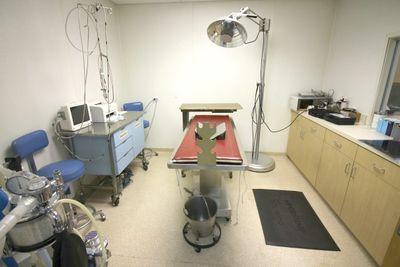
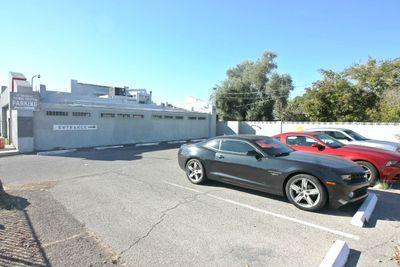
1 Office Medical Veterinarin Signage Frontage Visibility S Eastern Ave, Las Vegas, NV Listing ID: Status: Active Property Type: Office For Lease Office Type: Governmental, High-Tech Contiguous Space: Total Available: Lease Rate: $1 PSF (Monthly) Unit Price: $12 PSF (Annual) Base Monthly Rent: $2,343 Lease Type: NNN Overview/Comments Pro Office, Medical, Veterinarian, Signage, Frontage, Visibility Qualifies for 10% down SBA loan for owner/user, 5.2% fixed, 20, $2,400 mo payments. 100% available for purchase or lease S. Eastern is a 2,343 professional office building.19 acres, on the corner of Houston Dr., just south of E. Charleston, just north of Oakey. Previously used as an animal hospital, but now can be re-purposed for a new life. Could be professional office, medical, urgent quick care, chiropractor, check cashing, laboratory, financial services, employment agency, tutoring center, adult day care, tax service, travel, immigration, etc... Currently has reception room, waiting rooms, day surgery room, 3 private exam rooms, many counter tops with sinks, 2 private restrooms, x-ray room. private executive office, break room, many built-in cabinets, kennels and cages, plenty of plumbing, lots of private locked storage. S. Eastern Ave. has over 35,000 cars per day. This corner building has excellent frontage, signage, and visibility. Front and rear parking. Can add additional parking. Mature landscaping. Easy access to Charleston, I-95, Fremont St, The Strip, Downtown, and Boulder Highway. APN: , built 1969, remodeled 1994, City of Las Vegas zoned Professional Offices and Parking (P-R) Clark County Land Use Offices, Professional and Business Services For sale at $374,999 or only $160 per square foot. Also available for purchase at $374,999 or $160 psf. More Information Online QR Code Scan this image with your mobile device: General Information Taxing Authority: Cirty of Las Vegas Tax ID/APN: Office Type: Governmental, High-Tech, Institutional, Medical, Net Leased, Office Building, Research & Development, Other Zoning: CITY OF LAS VEGAS ZONED PROFESSIONAL OFFICES AND PARKING (P-R) Building Name: Class of Space: Gross Building Area: Building/Unit Size (RSF): Usable Size (USF): Land Area: Office Medical Veterinarin Signage Frontage Visibility Class C 0.19 Acres Page 1
: 60 Months Lease Rate: $1 PSF (Monthly) Lease Type: NNN Conference Rooms: 1 Offices: 3 Kitchen/Breakroom: Yes Operating")
2 Available Space Suite/Unit Number: Complete Building Suite Floor/Level: 1 Space Available: Minimum Divisible: Maximum Contiguous: Space Subcategory 1: Office Showroom Space Subcategory 2: Research & Development Space Type: Relet Date Available: 08/01/2017 Lease Term (Months): 60 Months Lease Rate: $1 PSF (Monthly) Lease Type: NNN Conference Rooms: 1 Offices: 3 Kitchen/Breakroom: Yes Operating Expenses: $3.60 PSF (Annual) Rent Escalators: Step-Up Lease Area & Location Property Located Between: Property Visibility: Charleston and Oakey Excellent Building Related Total Number of Buildings: 1 Number of Stories: 1 Typical SF / Floor: Year Built: 1969 Year Renovated: 1994 Parking Description: Front and back can add additional parking Loading Doors: 0 Loading Docks: 0 Passenger Elevators: 0 Freight Elevators: 0 Location Address: 1208 S Eastern Ave, Las Vegas, NV County: Clark MSA: Submarket: Las Vegas-Henderson-Paradise Downtown Page 2

3 Property Images _ ae973c9b60439aa25fa1eba11babb S Eastern Realist Report _ Page 3


4 Gizmo High Page 4


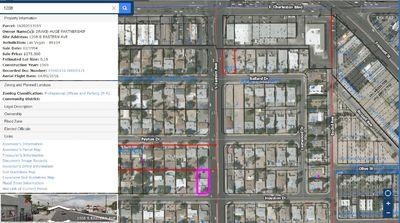
5 Gizmo Map Property Contacts 702Michael Hawkes Great Bridge Properties [M] [O] Page 5 Copyright Catylist. All Rights Reserved. The information presented herein is provided as is, without warranty of any kind. Neither Catylist nor Catylist Real Estate Software, Inc. assume any liability for errors or omissions.

6 Demographics, Labor/Workforce, and Consumer Expenditures 1208 S Eastern Ave, Las Vegas, NV Disclaimer: While we believe this information (via GeoLytics) to be reliable, we have not checked its accuracy and make no guarantee as to its validity. By using the information provided on this page, the user acknowledges that the data may contain errors or other nonconformities. You and/or your client should diligently and independently verify the specifics of the information that you are using. Population 2020 Projection 44, , , Estimate 36, , , Census 32, , ,105 Growth % 19.64% 18.74% Growth % 13.44% 14.93% Population (Male) 2020 Projection 22, , , Estimate 18, , , Census 17, , ,820 Growth % 19.08% 18.42% Growth % 7.99% 11.27% Page 6 Copyright Catylist. All Rights Reserved. The information presented herein is provided as is, without warranty of any kind. Neither Catylist nor Catylist Real Estate Software, Inc. assume any liability for errors or omissions.
7 Population (Female) 2020 Projection 22, , , Estimate 18, , , Census 14, , ,285 Growth % 20.21% 19.05% Growth % 19.57% 18.87% Population by Age (2015 Estimate) Age 0 to 5 3,435 27,036 62,919 Age 5 to 10 3,292 26,515 62,611 Age 10 to 15 2,740 22,582 54,221 Age 15 to 20 2,374 19,888 48,359 Age 20 to 25 2,310 19,080 46,219 Age 25 to 30 2,345 18,922 45,212 Age 30 to 35 2,388 18,844 44,649 Age 35 to 40 2,412 19,159 45,167 Age 40 to 45 2,526 19,446 45,841 Age 45 to 50 2,624 19,904 46,516 Age 50 to 55 2,415 17,950 42,141 Age 55 to 60 2,133 15,997 37,524 Age 60 to 65 1,792 13,559 31,866 Age 65 and over 4,188 35,372 81,079 Total Population 36, , ,324 Median Age Age 0 to 5 Age 5 to 10 Age 10 to 15 Age 15 to 20 Age 20 to 25 Age 25 to 30 Age 30 to 35 Age 35 to 40 Age 40 to 45 Age 45 to 50 Age 50 to 55 Age 55 to 60 Age 60 to 65 Age 65 and over 9% 9% 9% 9% 9% 9% 7% 8% 8% 6% 7% 7% 6% 6% 7% 6% 6% 7% 6% 6% 6% 7% 7% 7% 7% 7% 7% 7% 7% 7% 7% 6% 6% 6% 5% 5% 5% 5% 5% 11% 12% 12% Median Age (Male) 2010 Census Median Age (Female) 2010 Census High School Graduates Age 25+ by Educational Attainment (2015 Estimate) High School Graduate (or GED) 6,913 53, ,095 Some College, No Degree 4,156 36,981 94,553 Associate or Bachelor's Degree 1,072 7,811 22,744 Master's Degree 395 3,578 10,182 Professional School Degree 394 2,528 6,117 Doctorate Degree 148 1,402 3,790 Total High School Graduates Age , , ,481 High School Graduate (or GED) Some College, No Degree Associate or Bachelor's Degree Master's Degree Professional School Degree Doctorate Degree 53% 51% 47% 32% 35% 36% 8% 7% 9% 3% 3% 4% 3% 2% 2% 1% 1% 1% Page 7 Copyright Catylist. All Rights Reserved. The information presented herein is provided as is, without warranty of any kind. Neither Catylist nor Catylist Real Estate Software, Inc. assume any liability for errors or omissions.
8 Households 2020 Projection 16, , , Estimate 13, , , Census 12,264 90, ,848 Growth % 18.01% 17.48% Growth % 11.51% 13.4% Population in Households 2010 Census 32, , ,105 Average Household Size 2020 Projection Estimate Census Growth % -0.07% 0.01% Growth % 1.66% 1.32% Page 8 Copyright Catylist. All Rights Reserved. The information presented herein is provided as is, without warranty of any kind. Neither Catylist nor Catylist Real Estate Software, Inc. assume any liability for errors or omissions.
9 Households by Household Type and Size and Presence of Children (2015 Estimate) Family Households 7,290 59, ,194 Married-couple family 4,055 34,897 89,930 2,160 18,197 45,657 1,895 16,700 44,273 Male Householder: 1,213 8,551 20,194 no wife present 532 4,017 9, ,534 10,714 Female Householder: no husband 2,022 16,533 39,070 present 1,106 9,486 22, ,047 16,980 Nonfamily Households 6,539 41,043 85,378 1 Person households 5,048 31,340 63, Unrelated people 1,491 9,703 21,431 Total Households 13, , ,572 Family Households Married-couple family Male Householder: no wife present Female Householder: no husband present Nonfamily Households 1 Person households 2+ Unrelated people 53% 59% 64% 29% 35% 38% 16% 18% 19% 14% 17% 19% 9% 8% 9% 4% 4% 4% 5% 4% 5% 15% 16% 17% 8% 9% 9% 7% 7% 7% 47% 41% 36% 37% 31% 27% 11% 10% 9% Page 9 Copyright Catylist. All Rights Reserved. The information presented herein is provided as is, without warranty of any kind. Neither Catylist nor Catylist Real Estate Software, Inc. assume any liability for errors or omissions.
10 Households by Household Income (2015 Estimate) Less than $25,000 5,838 34,862 67,864 $25,000 to $49,999 4,230 32,881 72,483 $50,000 to $74,999 2,444 17,473 47,353 $75,000 to $99, ,304 23,476 $100,000 to $124, ,269 10,303 $125,000 to $149, ,723 5,797 $150,000 to $199, ,640 4,731 $200,000 or more ,565 Total Households 13, , ,572 Average Household Income $40, $45, $51, Median Household Income $33, $39, $45, Less than $25,000 $25,000 to $49,999 $50,000 to $74,999 $75,000 to $99,999 $100,000 to $124,999 $125,000 to $149,999 $150,000 to $199,999 $200,000 or more 42% 35% 29% 31% 33% 31% 18% 17% 20% 4% 8% 10% 2% 3% 4% 2% 2% 2% 1% 2% 2% 0% 1% 1% Households by Household Income (2020 Projection) Less than $25,000 6,850 40,994 79,710 $25,000 to $49,999 5,029 38,923 85,571 $50,000 to $74,999 2,924 20,722 55,709 $75,000 to $99, ,907 27,553 $100,000 to $124, ,823 12,031 $125,000 to $149, ,023 6,703 $150,000 to $199, ,878 5,415 $200,000 or more ,873 Total Households 16, , ,565 Average Household Income $40, $45, $51, Median Household Income $34, $40, $46, Less than $25,000 $25,000 to $49,999 $50,000 to $74,999 $75,000 to $99,999 $100,000 to $124,999 $125,000 to $149,999 $150,000 to $199,999 $200,000 or more 42% 34% 29% 31% 33% 31% 18% 17% 20% 4% 8% 10% 2% 3% 4% 2% 2% 2% 1% 2% 2% 0% 1% 1% Per Capita Income 2015 Estimate $14, $15,551 $17, Unemployment Rate 2015 Estimate 16.51% 16.91% 15.73% Page 10 Copyright Catylist. All Rights Reserved. The information presented herein is provided as is, without warranty of any kind. Neither Catylist nor Catylist Real Estate Software, Inc. assume any liability for errors or omissions.
11 Population Age 16+ By Employment Status (2015 Estimate) Labor Force 15, , ,157 Civilian, Employed 13, , ,208 Civilian, Unemployed 1,874 16,287 37,949 Not in Labor Force 15, , ,539 Total Population Age , , ,696 Labor Force Civilian, Employed Civilian, Unemployed Not in Labor Force 49% 52% 55% 43% 45% 49% 6% 7% 6% 51% 48% 45% Employed Civilian Population Age 16+ by Industry (2015 Estimate) Agriculture, forestry, fishing and hunting, mining and 1,054 13,384 32,975 construction Manufacturing 615 4,444 11,037 Wholesale & retail trade 2,292 17,095 41,724 Transportation and warehousing, and 291 4,354 12,937 utilities Information 212 1,853 5,022 Finance, insurance, real estate and 486 2,831 7,847 rental and leasing Professional, scientific, and 1,706 13,888 32,461 technical services Educational, health and social services 1,399 12,126 34,525 Arts, entertainment, recreation, accommodation and 6,221 44, ,735 food services Other services (except public 777 8,846 23,143 administration) Public Administration 173 2,366 7,852 Total Employed Civilian Population Age , , ,258 Agriculture, forestry, fishing and hunting, mining and construction Manufacturing Wholesale & retail trade Transportation and warehousing, and utilities Information Finance, insurance, real estate and rental and leasing Professional, scientific, and technical services Educational, health and social services Arts, entertainment, recreation, accommodation and food services Other services (except public administration) Public Administration 7% 11% 11% 4% 4% 4% 15% 14% 13% 2% 3% 4% 1% 1% 2% 3% 2% 3% 11% 11% 10% 9% 10% 11% 41% 36% 33% 5% 7% 7% 1% 2% 3% Housing Units by Tenure (2015 Estimate) Vacant Housing Units 3,468 34,111 56,732 Occupied Housing Units 13, , ,572 Owner- Occupied 3,202 37, ,216 Renter- Occupied 10,627 63, ,356 Total Housing Units 17, , ,304 Vacant Housing Units Occupied Housing Units Owner- Occupied Renter- Occupied 20% 25% 19% 80% 75% 81% 19% 28% 35% 61% 47% 45% Page 11 Copyright Catylist. All Rights Reserved. The information presented herein is provided as is, without warranty of any kind. Neither Catylist nor Catylist Real Estate Software, Inc. assume any liability for errors or omissions.
7401 W Charleston Blvd, Las Vegas, NV 89117
 Cool $1,000,000.00 Discount Off Sale Price 7401 W Charleston Blvd, Las Vegas, NV 89117 Listing ID: 30193298 Status: Active Property Type: Office For Sale Office Type: Business Park, Executive Suites Size:
2365 Reynolds Ave, North Las Vegas, NV 89030
 10% Down $77 psf 7,072' Medical Office Elevator & Gray Shell 2365 Reynolds Ave, North Las Vegas, NV 89030 Listing ID: 29944110 Status: Active Property Type: Office For Sale Office Type: Business Park,
5419 S Decatur Blvd, Las Vegas, NV 89118
 Call Center, Office, Showroom, Warehouse, Auto, Flex 5419 S Decatur Blvd, Las Vegas, NV 89118 Listing ID: 29978730 Status: Active Property Type: Office For Lease Office Type: Business Park, Governmental
2415 Reynolds Ave, North Las Vegas, NV 89030
 7,221' *Reynolds Medical Center* Gray Shell w/ Elevator 89030 2415 Reynolds Ave, North Las Vegas, NV 89030 Listing ID: 29944098 Status: Active Property Type: Office For Sale (also listed as Special Purpose)
1320 S Casino Center Blvd, Las Vegas, NV 89104
 Professional or Attorney Office Arts District Casino Center 1320 S Casino Center Blvd, Las Vegas, NV 89104 Listing ID: 30030990 Status: Active Property Type: Office For Sale Office Type: Business Park,
7401 W Charleston Blvd, Las Vegas, NV 89117
 Cool $1.25 Million Discounted Las Vegas Company HQ Office 7401 W Charleston Blvd, Las Vegas, NV 89117 Listing ID: Status: Property Type: Office Type: Size: Sale Price: Unit Price: Sale Terms: Overview/Comments
2465 Reynolds Ave, North Las Vegas, NV 89030
 12,020' Reynolds Medical & Attorney Build-Out Elevator 89030 2465 Reynolds Ave, North Las Vegas, NV 89030 Listing ID: 29944111 Status: Active Property Type: Office For Sale (also listed as Special Purpose)
2965 S Jones Blvd, Las Vegas, NV 89146
 10% Down Data Center Office Call Center Fiber Optic Cubicles 2965 S Jones Blvd, Las Vegas, NV 89146 Listing ID: 30029430 Status: Active Property Type: Office For Sale Office Type: Business Park, Governmental
5715 W. Alexander #150, Las Vegas, NV 89130
 Brand New Everything! NW Professional Office Condo 5715 W. Alexander #150, Las Vegas, NV 89130 Listing ID: 30279487 Status: Active Property Type: Office For Lease Office Type: Business Park, Executive
5715 W. Alexander #150, Las Vegas, NV 89130
 10% Down Office Condo 49c PSF Payments 5715 W. Alexander #150, Las Vegas, NV 89130 Listing ID: 30279469 Status: Active Property Type: Office For Sale Office Type: Business Park, Executive Suites Size:
Benchmark Avenue, Fort Myers, FL 33905
 Available October 2017 Benchmark Industrial For Lease 1681-1687 Benchmark Avenue, Fort Myers, FL 33905 Listing ID: 30132311 Status: Active Property Type: Industrial For Lease Industrial Type: Flex Space,
5419 S Decatur Blvd, Las Vegas, NV 89118
 10% Down, Call Center, Office, Showroom, Warehouse, Auto, Flex 5419 S Decatur Blvd, Las Vegas, NV 89118 Listing ID: 29978727 Status: Active Property Type: Industrial For Sale Industrial Type: Flex Space,
2908 E Oakland Ave, Johnson City, TN 37601
 Office/retail Lease 2908 E Oakland Ave, Johnson City, TN 37601 Listing ID: 30369980 Status: Active Property Type: Office For Lease Office Type: Executive Suites, Governmental Contiguous Space: 2,800-7,800
4575 Bay Rd, Saginaw, MI 48603
 Georges 4575 Bay Rd, Saginaw, MI 48603 Listing ID: 30340682 Status: Active Property Type: Business Opportunity For Sale Industry: Professional Services Size: 6,600 SF Sale Price: $852,000 Sale Terms: Cash
3424 East Road, Saginaw, MI 48601
 R & W Investment 3424 East Road, Saginaw, MI 48601 Listing ID: 30298825 Status: Active Property Type: Industrial For Sale Industrial Type: Flex Space, Free-Standing Size: 7,564 SF Sale Price: $230,000
3280 E Tropicana Ave, Las Vegas, NV 89121
 65c Rent NNN Various Size Retail Shop Office Store Medical 3280 E Tropicana Ave, Las Vegas, NV 89121 Listing ID: 29848683 Status: Active Property Type: Retail-Commercial For Lease (also listed as Office,
11701 Orpington St, Orlando, FL 32817
 Professional Space for Lease 11701 Orpington St, Orlando, FL 32817 Listing ID: 30295554 Status: Active Property Type: Office For Lease Office Type: Business Park, Governmental Contiguous Space: 1,250 SF
1112 Carroll Creek Rd, Johnson City, TN 37601
 Deanwood Apartments for Sale 1112 Carroll Creek Rd, Johnson City, TN 37601 Listing ID: 30363543 Status: Active Property Type: Multi-Family For Sale Multi-Family Type: Low-Rise/Garden Size: 23,432 SF Sale
E. Flamingo Rd, Las Vegas, NV 89121
 School Restaurant Retail Office Convenience 89c to $1.25 3620 3650 3654 E. Flamingo Rd, Las Vegas, NV 89121 Listing ID: 30284747 Status: Active Property Type: Retail-Commercial For Lease Retail-Commercial
 12519 S Cleveland Ave Details Prepared on Prepared By Josh Burdine 239-362-3173 josh@rockstar-realestate.com Page 1 14,000 sq feet building on 41 in Fort Myers 12519 S Cleveland Ave, Fort Myers, FL 33907
E. Flamingo Rd, Las Vegas, NV 89121
 Restaurant Supper Club Retail Office Convenience 89c to $1.25 3620 3650 3654 E. Flamingo Rd, Las Vegas, NV 89121 Listing ID: 30214834 Status: Active Property Type: Retail-Commercial For Lease Retail-Commercial
46 Acres - Fronting Interstate 81 & Hopewell Rd. Prime Location - Zoned Industrial Potential for 2 Building Complexes
 46 Acre Land Opportunity - I-81 Frontage Design Concept: 2 Potential Building Parcels Prepared on 46 Acres - Fronting Interstate 81 & Hopewell Rd. Prime Location - Zoned Industrial Potential for 2 Building
14114 Palm Beach Blvd, Fort Myers, FL 33905
 Palm Beach Boulevard Land 14114 Palm Beach Blvd, Fort Myers, FL 33905 Listing ID: 30318883 Status: Active Property Type: Vacant Land For Sale Possible Uses: Office, Retail Gross Land Area: 18,000 SF Sale
Contact: Larry Hausman (502) Outer Loop, Louisville, KY Knobview Shopping Center
 Outer Loop, Louisville, KY Knobview Shopping Center") 5603-5637 Outer Loop, Louisville, KY 40219 Knobview Shopping Center Jefferson Mall Academy Sports Center SUBJECT Knobview Shopping Center offers a diverse mix of local and national tenants. The center
5603-5637 Outer Loop, Louisville, KY 40219 Knobview Shopping Center Jefferson Mall Academy Sports Center SUBJECT Knobview Shopping Center offers a diverse mix of local and national tenants. The center
5200 Ocean Blvd, Siesta Key, FL 34242
 Siesta Key Restaurant- BEST LOCATION IN THE VILLAGE! 5200 Ocean Blvd, Siesta Key, FL 34242 Listing ID: 29826583 Status: Active Property Type: Business Opportunity For Sale Industry: Food and Beverage Size:
W Republic Rd, Springfield, MO 65807
 Republic Plaza, All Available Suites 2141-2155 W Republic Rd, Springfield, MO 65807 Listing ID: 29778068 Status: Active Property Type: Shopping Center For Lease (also listed as Retail-Commercial, Office)
SOUTH DAKOTA KIDS COUNT BEACOM SCHOOL OF BUSINESS UNIVERSITY OF SOUTH DAKOTA 414 E. CLARK STREET VERMILLION, SD
 Brookings County Compared to o SDSD Undergrad Enrollment approximately 11,225 o USD Undergrad Enrollment approximately 7,600 o Brookings County 1 year population estimate for 2013 is 32,968 o 1 year population
SELECTED ECONOMIC CHARACTERISTICS American Community Survey 5-Year Estimates
 DP03 SELECTED ECONOMIC CHARACTERISTICS 2008-2012 American Community Survey 5-Year Estimates Supporting documentation on code lists, subject definitions, data accuracy, and statistical testing can be found
American Community Survey 5-Year Estimates
 DP03 SELECTED ECONOMIC CHARACTERISTICS 2013-2017 American Community Survey 5-Year Estimates Supporting documentation on code lists, subject definitions, data accuracy, and statistical testing can be found
Tell us what you think. Provide feedback to help make American Community Survey data more useful for you.
 DP03 SELECTED ECONOMIC CHARACTERISTICS 2016 American Community Survey 1-Year Estimates Supporting documentation on code lists, subject definitions, data accuracy, and statistical testing can be found on
American Community Survey 5-Year Estimates
 DP03 SELECTED ECONOMIC CHARACTERISTICS 2012-2016 American Community Survey 5-Year Estimates Supporting documentation on code lists, subject definitions, data accuracy, and statistical testing can be found
American Community Survey 5-Year Estimates
 DP03 SELECTED ECONOMIC CHARACTERISTICS 2012-2016 American Community Survey 5-Year Estimates Supporting documentation on code lists, subject definitions, data accuracy, and statistical testing can be found
American Community Survey 5-Year Estimates
 DP03 SELECTED ECONOMIC CHARACTERISTICS 2012-2016 American Community Survey 5-Year Estimates Supporting documentation on code lists, subject definitions, data accuracy, and statistical testing can be found
American Community Survey 5-Year Estimates
 DP03 SELECTED ECONOMIC CHARACTERISTICS 2012-2016 American Community Survey 5-Year Estimates Supporting documentation on code lists, subject definitions, data accuracy, and statistical testing can be found
American Community Survey 5-Year Estimates
 DP03 SELECTED ECONOMIC CHARACTERISTICS 2012-2016 American Community Survey 5-Year Estimates Supporting documentation on code lists, subject definitions, data accuracy, and statistical testing can be found
American Community Survey 5-Year Estimates
 DP03 SELECTED ECONOMIC CHARACTERISTICS 2012-2016 American Community Survey 5-Year Estimates Supporting documentation on code lists, subject definitions, data accuracy, and statistical testing can be found
American Community Survey 5-Year Estimates
 DP03 SELECTED ECONOMIC CHARACTERISTICS 2012-2016 American Community Survey 5-Year Estimates Supporting documentation on code lists, subject definitions, data accuracy, and statistical testing can be found
American Community Survey 5-Year Estimates
 DP03 SELECTED ECONOMIC CHARACTERISTICS 2012-2016 American Community Survey 5-Year Estimates Supporting documentation on code lists, subject definitions, data accuracy, and statistical testing can be found
American Community Survey 5-Year Estimates
 DP03 SELECTED ECONOMIC CHARACTERISTICS 2012-2016 American Community Survey 5-Year Estimates Supporting documentation on code lists, subject definitions, data accuracy, and statistical testing can be found
American Community Survey 5-Year Estimates
 DP03 SELECTED ECONOMIC CHARACTERISTICS 2012-2016 American Community Survey 5-Year Estimates Supporting documentation on code lists, subject definitions, data accuracy, and statistical testing can be found
American Community Survey 5-Year Estimates
 DP03 SELECTED ECONOMIC CHARACTERISTICS 2012-2016 American Community Survey 5-Year Estimates Supporting documentation on code lists, subject definitions, data accuracy, and statistical testing can be found
American Community Survey 5-Year Estimates
 DP03 SELECTED ECONOMIC CHARACTERISTICS 2012-2016 American Community Survey 5-Year Estimates Supporting documentation on code lists, subject definitions, data accuracy, and statistical testing can be found
American Community Survey 5-Year Estimates
 DP03 SELECTED ECONOMIC CHARACTERISTICS 2012-2016 American Community Survey 5-Year Estimates Supporting documentation on code lists, subject definitions, data accuracy, and statistical testing can be found
American Community Survey 5-Year Estimates
 DP03 SELECTED ECONOMIC CHARACTERISTICS 2012-2016 American Community Survey 5-Year Estimates Supporting documentation on code lists, subject definitions, data accuracy, and statistical testing can be found
American Community Survey 5-Year Estimates
 DP03 SELECTED ECONOMIC CHARACTERISTICS 2012-2016 American Community Survey 5-Year Estimates Supporting documentation on code lists, subject definitions, data accuracy, and statistical testing can be found
American Community Survey 5-Year Estimates
 DP03 SELECTED ECONOMIC CHARACTERISTICS 2012-2016 American Community Survey 5-Year Estimates Supporting documentation on code lists, subject definitions, data accuracy, and statistical testing can be found
American Community Survey 5-Year Estimates
 DP03 SELECTED ECONOMIC CHARACTERISTICS 2012-2016 American Community Survey 5-Year Estimates Supporting documentation on code lists, subject definitions, data accuracy, and statistical testing can be found
American Community Survey 5-Year Estimates
 DP03 SELECTED ECONOMIC CHARACTERISTICS 2012-2016 American Community Survey 5-Year Estimates Supporting documentation on code lists, subject definitions, data accuracy, and statistical testing can be found
American Community Survey 5-Year Estimates
 DP03 SELECTED ECONOMIC CHARACTERISTICS 2012-2016 American Community Survey 5-Year Estimates Supporting documentation on code lists, subject definitions, data accuracy, and statistical testing can be found
American Community Survey 5-Year Estimates
 DP03 SELECTED ECONOMIC CHARACTERISTICS 2012-2016 American Community Survey 5-Year Estimates Supporting documentation on code lists, subject definitions, data accuracy, and statistical testing can be found
American Community Survey 5-Year Estimates
 DP03 SELECTED ECONOMIC CHARACTERISTICS 2012-2016 American Community Survey 5-Year Estimates Supporting documentation on code lists, subject definitions, data accuracy, and statistical testing can be found
American Community Survey 5-Year Estimates
 DP03 SELECTED ECONOMIC CHARACTERISTICS 2012-2016 American Community Survey 5-Year Estimates Supporting documentation on code lists, subject definitions, data accuracy, and statistical testing can be found
American Community Survey 5-Year Estimates
 DP03 SELECTED ECONOMIC CHARACTERISTICS 2012-2016 American Community Survey 5-Year Estimates Supporting documentation on code lists, subject definitions, data accuracy, and statistical testing can be found
American Community Survey 5-Year Estimates
 DP03 SELECTED ECONOMIC CHARACTERISTICS 2012-2016 American Community Survey 5-Year Estimates Supporting documentation on code lists, subject definitions, data accuracy, and statistical testing can be found
American Community Survey 5-Year Estimates
 DP03 SELECTED ECONOMIC CHARACTERISTICS 2012-2016 American Community Survey 5-Year Estimates Supporting documentation on code lists, subject definitions, data accuracy, and statistical testing can be found
American Community Survey 5-Year Estimates
 DP03 SELECTED ECONOMIC CHARACTERISTICS 2012-2016 American Community Survey 5-Year Estimates Supporting documentation on code lists, subject definitions, data accuracy, and statistical testing can be found
Mid - City Industrial
 Minneapolis neighborhood profile October 2011 Mid - City Industrial About this area The Mid-City Industrial neighborhood is bordered by I- 35W, Highway 280, East Hennepin Avenue, and Winter Street Northeast.
University of Minnesota
 neighborhood profile October 2011 About this area The University neighborhood is bordered by 11th Avenue Southeast, University Avenue, 15th Avenue Southeast, the railroad tracks, Oak Street, and the Mississippi
SEVEN HILLS MEDICAL & BUSINESS PARK
 PROPERTY HIGHLIGHTS: Turnkey medical and professional suites available Unit sizes range from ±1,808 - ±8,130 SF Lease rate: $1.29 - $1.50 SF/M NNN CAM s: $0.40 SF/M Zoning: C-O (Office Commercial) Parcel
Camden Industrial. Minneapolis neighborhood profile. About this area. Trends in the area. Neighborhood in Minneapolis.
 Minneapolis neighborhood profile October 2011 Camden Industrial About this area The Camden Industrial neighborhood is bordered by 48th Avenue North, the Mississippi River, Dowling Avenue North, Washington
Shingle Creek. Minneapolis neighborhood profile. About this area. Trends in the area. Neighborhood in Minneapolis. October 2011
 neighborhood profile October 2011 About this area The neighborhood is bordered by 53rd Avenue North, Humboldt Avenue North, 49th Avenue North, and Xerxes Avenue North. It is home to Olson Middle School.
Town Profiles: Demographic, Economic, and Housing Statistics for De Smet City and Wall Town, SOuth Dakota
 South Dakota State University Open PRAIRIE: Open Public Research Access Institutional Repository and Information Exchange Census Data Center News Releases SDSU Census Data Center 12-7-2017 Town Profiles:
TABLE 1. PROFILE OF GENERAL DEMOGRAPHIC CHARACTERISTICS
 Waterloo city, Iowa TABLE 1. PROFILE OF GENERAL DEMOGRAPHIC CHARACTERISTICS Estimate Lower Bound Upper Bound Total population 66,659 64,093 69,225 SEX AND AGE Male 32,096 30,415 33,777 Female 34,563 33,025
LAND FOR SALE Blair Road, Mint Hill, NC PROPERTY OVERVIEW. Large parcel with I-485 access via Blair Road exit in the path of. growth.
 LAND FOR SALE 10395 Blair Road, Mint Hill, NC 28227 OFFERING SUMMARY SALE PRICE: $1,000,000 PROPERTY OVERVIEW Large parcel with I485 access via Blair Road exit in the path of growth. LOT SIZE: 9.28 Acres
Average persons in household. Top three industries Post-secondary education (25 64 years) 7.1% Unemployment rate
 7.1% Unemployment rate") Demographic snapshot The Town of Oakville City of Burl ington City of Mis sissauga Town of Milton Population 198,042 Median age Average persons in household 41 2.8 years old $149,945 Average household
Demographic snapshot The Town of Oakville City of Burl ington City of Mis sissauga Town of Milton Population 198,042 Median age Average persons in household 41 2.8 years old $149,945 Average household
Daniel Jung CRENSHAW BLVD CRENSHAW BLVD INGLEWOOD CA, CA Priming Capital 6 Centerpointe Dr La Palma, CA
 11225 CRENSHAW BLVD 11225 CRENSHAW BLVD INGLEWOOD CA, CA 90303 Property Type Retail Building Size Owner (Legal) Property Subtype Auto Dealer Office SF Owner (True) Zoning Industrial SF County Los Angeles
For Lease. Free-standing Retail / Office Building 1304 Saratoga Avenue San Jose, CA
 For Lease Free-standing Retail / Office Building 1304 Saratoga Avenue San Jose, CA 95117 Description Approximately 4,500 sf plus mezzanine Outstanding identity and visibility In neighborhood shopping center
City of Edmonton Population Change by Age,
 Population Change by Age, 1996-2001 2001 Edmonton Demographic Profile The City of Edmonton s 2001population increased by 49,800 since the 1996 census. Migration figures are not available at the municipal
PROPOSED SHOPPING CENTER
 PROPOSED SHOPPING CENTER Southeast Corner I-95 & Highway 192 Melbourne, Florida In a 5 Mile Radius 80,862 Population 32,408 Households $61K Avg HH Income SOONER INVESTMENT Commercial & Investment Real
$1,600,000. Boston Reid LAKESIDE BUSINESS PARK. 117 Crosslake Park Drive Mooresville, NC SITE FEATURES. Lead 2 Real Estate Group
 LAKESIDE BUSINESS PARK 117 Crosslake Park Drive Mooresville, NC 28117 $1,600,000 Marketed By SITE FEATURES 17,000 + SF Industrial Building on 2.6 Acres Located in Lakeside Business Park High Power for
Procter Properties P.O. Box 3484 Greensboro, NC
 Procter Properties P.O. Box 3484 Greensboro, NC 27402 3208 West Gate City Boulevard 3208 W Gate City Blv Greensboro, NC 27407 Property Type Retail Building Size 11,747 SF Owner (Legal) Property Subtype
Economic Overview City of Tyler, TX. January 8, 2018
 Economic Overview City of Tyler, TX January 8, 2018 DEMOGRAPHIC PROFILE...3 EMPLOYMENT TRENDS...5 WAGE TRENDS...5 COST OF LIVING INDEX...6 INDUSTRY SNAPSHOT...7 OCCUPATION SNAPSHOT...9 INDUSTRY CLUSTERS...
Economic Overview York County, South Carolina. February 14, 2018
 Economic Overview York County, February 14, 2018 DEMOGRAPHIC PROFILE... 3 EMPLOYMENT TRENDS... 5 UNEMPLOYMENT RATE... 5 WAGE TRENDS... 6 COST OF LIVING INDEX... 6 INDUSTRY SNAPSHOT... 7 OCCUPATION SNAPSHOT...
Woodlands County Economic Indicators 2015
 Woodlands County Economic Indicators 215 Message from the Mayor In my time as Mayor, I have witnessed several recessions, and it certainly says a lot about our community. In 28, while businesses around
Monthly Availability Report
 Monthly Availability Report April 2015 Medical Office Space 3450 E. Fletcher Ave Tampa, FL 33613 Lease Rate: $21.50/sf MG 2,764sf up to 8,000sf Close to Florida Hospital Tampa Red light for easy ingress
ACS DEMOGRAPHIC AND HOUSING ESTIMATES American Community Survey 1-Year Estimates
 DP05 ACS DEMOGRAPHIC AND HOUSING ESTIMATES 2012 American Community Survey 1-Year Estimates Supporting documentation on code lists, subject definitions, data accuracy, and statistical testing can be found
The Trails. 1,500 sf Space Available. In a 3 Mile Radius 69,985 Population 25,450 Households $78,216 Avg HH Inc. 1,500 sf Corner Space
 1,500 sf Space Available The Trails Edmond Rd (2nd St) & Santa Fe Ave ~ Edmond, Oklahoma Current Tenancy: Edmond YMCA Spinal Wellness Clinic Lemongrass Thai Cuisine Kumon Learning Center Katie s Family
ACS DEMOGRAPHIC AND HOUSING ESTIMATES American Community Survey 1-Year Estimates
 DP05 ACS DEMOGRAPHIC AND HOUSING ESTIMATES 2010 American Community Survey 1-Year s Supporting documentation on code lists, subject definitions, data accuracy, and statistical testing can be found on the
ECONOMIC OVERVIEW DuPage County, Illinois
 ECONOMIC OVERVIEW DuPage County, Illinois DEMOGRAPHIC PROFILE... 3 EMPLOYMENT TRENDS... 5 UNEMPLOYMENT RATE... 5 WAGE TRENDS... 6 COST OF LIVING INDEX... 7 INDUSTRY SNAPSHOT... 8 OCCUPATION SNAPSHOT...
Roseville Towne Center Gratiot Avenue Roseville, MI 48066
 Retail Space Available 65,000 SF Second Level Space and Outparcel Florence Street Massachusetts Street Gratiot Avenue E. 12 Mile Road Property Highlights is shadow-anchored by Walmart and includes national
Economic Overview. Lawrence, KS MSA
 Economic Overview Lawrence, KS MSA March 5, 2019 DEMOGRAPHIC PROFILE... 3 EMPLOYMENT TRENDS... 5 UNEMPLOYMENT RATE... 5 WAGE TRENDS... 6 COST OF LIVING INDEX... 7 INDUSTRY SNAPSHOT... 8 OCCUPATION SNAPSHOT...
CRESCENT PLACE CONDO FOR LEASE
 For More Information CRESCENT PLACE CONDO Retail Property $28.00 SF/yr (NNN) September 23, 2018 EXECUTIVE SUMMARY Executive Summary LEASE RATE $28.00 SF/YR OFFERING SUMMARY Available SF: 840 SF Lease Rate:
EVEREST. Retail Investment Opportunity. Ivy Hills Retail Center 7397 Main Street Newtown, OH CONTACT: Chris Nachtrab.
 Retail Investment Opportunity CONTACT: Chris Nachtrab chris.nachtrab@everestrealestate.com 513/769-2509 John Thompson john.thompson@everestrealestate.com 513/769-2514 Ivy Hills Retail Center 7397 Main
Wisconsin Economic Development Corporation
 Wisconsin Economic Development Corporation 201 W. Washington Ave. Madison, Wisconsin 53707 608.267.4417 Analyst Report Economic Modeling Specialists, Inc. www.economicmodeling.com 1 Region Info Region:
Monte Vista Population, ,744 4,651 4,564 4,467 4,458 4,432 4,451
 1 Monte Vista 4,8 4,7 4,6 4,5 4,4 4,3 4,2 4,1 4,61 4,612 4,61 4,676 Monte Vista, 2-213 4,744 4,651 4,564 4,467 4,458 4,432 4,451 4,418 4,412 4,355 2 21 22 23 24 25 26 27 28 29 21 211 212 213 Year Monte
City of Utica Central Industrial Corridor ReVITALization Plan Appendix A. Socio-Economic Profile
 City of Utica Central Industrial Corridor ReVITALization Plan Appendix A. Socio-Economic Profile Population Graphic 1 City of Utica Population Change: 1960-2010 Since the 1960s, the population of Utica
Durango. Medical Building ±15,163 SF $3,639,000 UNIQUE OPPORTUNITY SINGLE-STORY MEDICAL BUILDING FOR SALE VIRTUAL TOUR
 FOR SALE 3012 S. Drive, Las Vegas, NV 89117 DO NOT DISTURB BUSINESS OPERATOR. CALL FOR DETAILS OR TO SCHEDULE A TOUR WITH BROKER. UNIQUE OPPORTUNITY SINGLE-STORY MEDICAL BUILDING ±15,163 SF $3,639,000
IAG Commercial. Albertville Retail - Land. For Sale. Prepared By:
 Albertville Retail - Land For Sale Albertville Retail - Land 6600 Laketowne Place Albertville, MN 55301 Prepared By: IAG Commercial 222 South Ninth Street, Suite 1600 Minneapolis, MN 55402 Jeff LaFavre,
PRIME SW KELLY OFFICE BUILDING UNIQUE SALE PORTLAND SOUTH CBD PORTLAND CBD OFFICE BUILDING FOR SALE OFFICE BLDG. OPPORTUNITY HIGH-TRAFFIC LOCATION!
 FOR SALE HIGH-TRAFFIC LOCATION! HEART OF NAITO-405-I5 INTERCHANGE DOWNTOWN UNIQUE OFFICE BLDG. OPPORTUNITY - in - PRIME SOUTH CBD PORTLAND SW KELLY AVE OFF ROSS ISLAND BRIDGE - HIGH VISIBILITY 2839 SW
Economic Overview Monterey County, California. July 22, 2016
 Economic Overview Monterey July 22, 2016 DEMOGRAPHIC PROFILE... 3 EMPLOYMENT TRENDS... 5 UNEMPLOYMENT RATE... 5 WAGE TRENDS... 6 COST OF LIVING INDEX... 6 INDUSTRY SNAPSHOT... 7 OCCUPATION SNAPSHOT...
717 E. Washington Street Petaluma, California
 717 E. Washington Street Property Highlights ±1,350 SF Free standing building 12 parking spaces Available for lease at $2.50/SF Gross Great visibility & Building signage Sale Price: $900,000 Adjacent to
American Community Survey 5-Year Estimates
 DP02 SELECTED SOCIAL CHARACTERISTICS IN THE UNITED STATES 2007-2011 American Community Survey 5-Year Estimates Supporting documentation on code lists, subject definitions, data accuracy, and statistical
Urban Action Agenda Community Profiles COVER TO GO HERE. City of Beacon
 Urban Action Agenda Community Profiles COVER TO GO HERE City of Beacon COMMUNITY OVERVIEW MAP POPULATION & DEMOGRAPHICS Population Basics 2,212 Population (2015) Population Change 2. since 2000 0.5 Square
APPENDIX 6: CENSUS DATA BURLINGTON, VERMONT
 APPENDIX 6: CENSUS DATA BURLINGTON, VERMONT 2000 CENSUS DATA 2005-2007 AMERICAN COMMUNITY SURVEY Burlington city, Vermont - Fact Sheet - American FactFinder Page 1 of 2 FACT SHEET Burlington
Economic Overview Loudoun County, Virginia. October 23, 2017
 Economic Overview October 23, 2017 DEMOGRAPHIC PROFILE... 3 EMPLOYMENT TRENDS... 5 UNEMPLOYMENT RATE... 5 WAGE TRENDS... 6 COST OF LIVING INDEX... 6 INDUSTRY SNAPSHOT... 7 OCCUPATION SNAPSHOT... 9 INDUSTRY
DEMOGRAPHIC PROFILE...3 EMPLOYMENT TRENDS...5 UNEMPLOYMENT RATE...5 WAGE TRENDS...6 COST OF LIVING INDEX...6 INDUSTRY SNAPSHOT...7
 March 14, 2017 DEMOGRAPHIC PROFILE...3 EMPLOYMENT TRENDS...5 UNEMPLOYMENT RATE...5 WAGE TRENDS...6 COST OF LIVING INDEX...6 INDUSTRY SNAPSHOT...7 OCCUPATION SNAPSHOT...9 INDUSTRY CLUSTERS... 12 EDUCATION
Economic Overview Long Island
 Report created on August 29, 2017 Economic Overview Long Island Contact: Lisa.Montiel@suny.edu DEMOGRAPHIC PROFILE... 3 EMPLOYMENT TRENDS... 5 UNEMPLOYMENT RATE... 5 WAGE TRENDS... 6 COST OF LIVING INDEX...
American Community Survey 5-Year Estimates
 DP05 ACS DEMOGRAPHIC AND HOUSING ESTIMATES 2011-2015 American Community Survey 5-Year Estimates Supporting documentation on code lists, subject definitions, data accuracy, and statistical testing can be
American Community Survey 5-Year Estimates
 DP05 ACS DEMOGRAPHIC AND HOUSING ESTIMATES 2011-2015 American Community Survey 5-Year Estimates Supporting documentation on code lists, subject definitions, data accuracy, and statistical testing can be
Economic Overview Western New York
 Report created on August 29, 2017 Economic Overview Western New Contact: Lisa.Montiel@suny.edu DEMOGRAPHIC PROFILE... 3 EMPLOYMENT TRENDS... 5 UNEMPLOYMENT RATE... 5 WAGE TRENDS... 6 COST OF LIVING INDEX...