5419 S Decatur Blvd, Las Vegas, NV 89118
|
|
|
- Justin Palmer
- 5 years ago
- Views:
Transcription

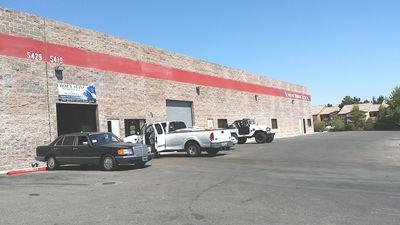
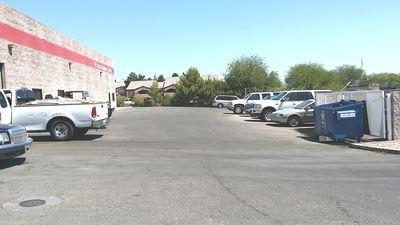
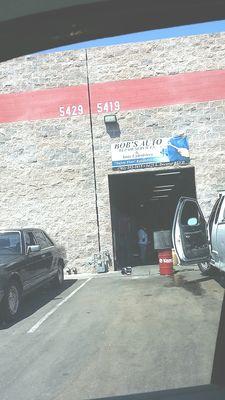
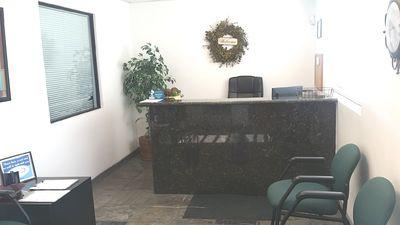
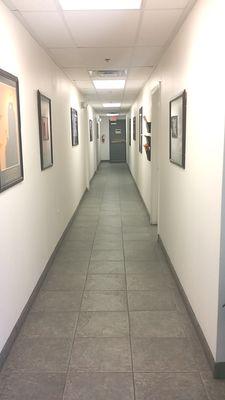
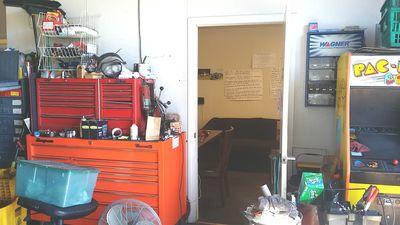
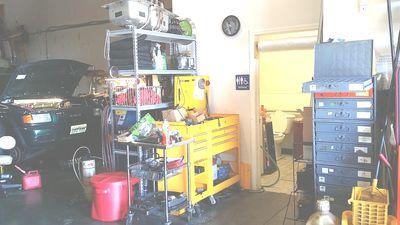
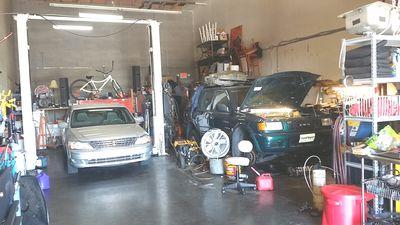
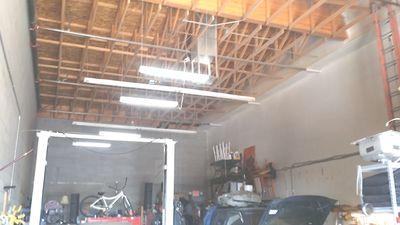
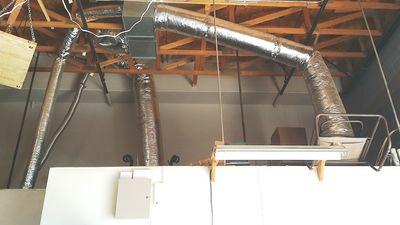
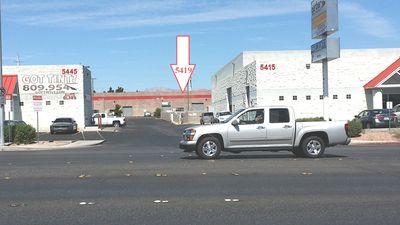
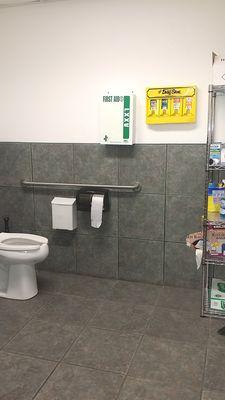
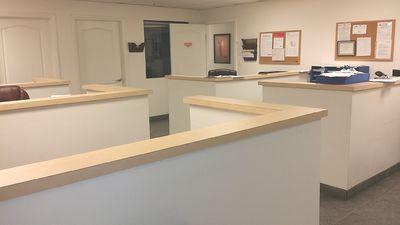
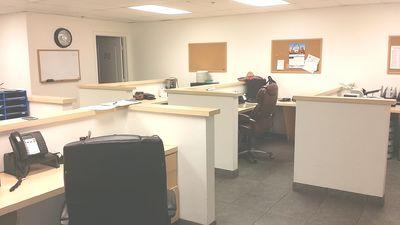
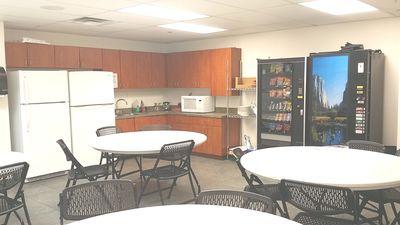
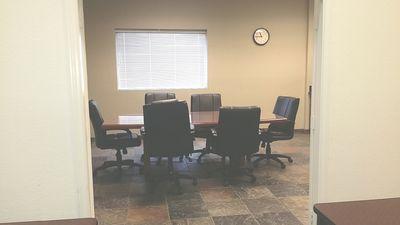
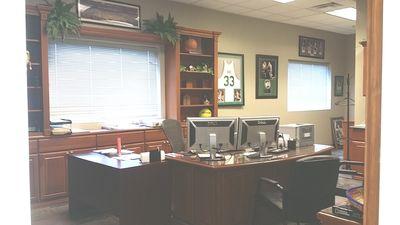
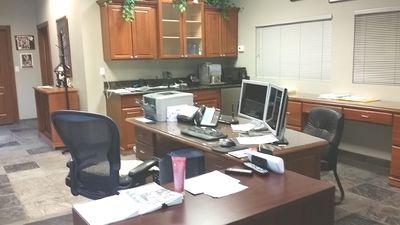
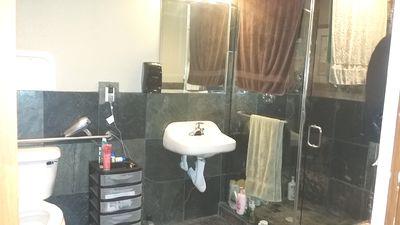
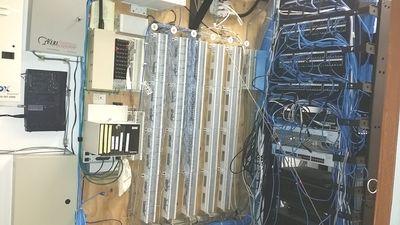
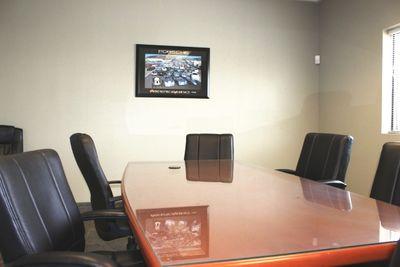
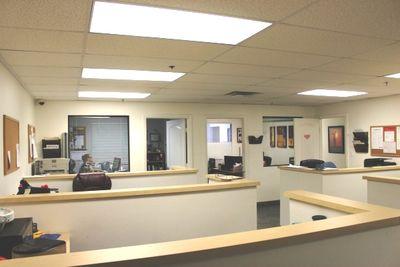
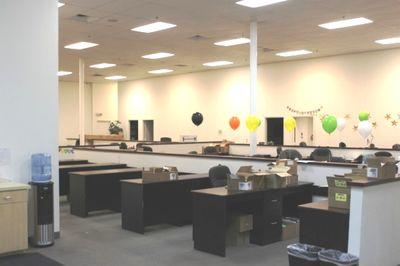
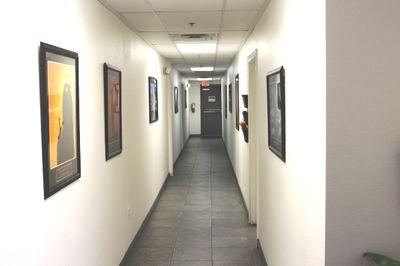
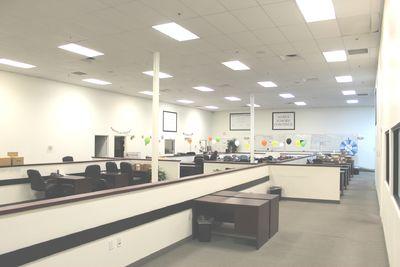
1 10% Down, Call Center, Office, Showroom, Warehouse, Auto, Flex 5419 S Decatur Blvd, Las Vegas, NV Listing ID: Status: Active Property Type: Industrial For Sale Industrial Type: Flex Space, Free-Standing Size: 13,463 SF Sale Price: $1,899,999 Unit Price: $ PSF Sale Terms: Cash to Seller Loading: 3 Doors Ceiling: 21 ft. Office SF: 13,463 SF Drive-In Bays: 3 Bays Overview/Comments 100% available for purchase or lease today. All furniture and equipment is gone. Now vacant and empty. Qualifies for an SBA 10% down loan for an owner user. Monthly payments as low as 75c per foot per month. Cheaper than leasing! See attached. Highly upgraded industrial building with 3-phase electric, HVAC private offices with high-image call center with administrative offices, reception area, executive offices, HVAC cooled warehouse storage areas, huge call center / sales floor, multiple perimeter offices, training room, XL break room, dining area, server room, conference, multiple restrooms, second floor professional sales associate offices, 3 ground roll-up doors, great access to I-215 and I-15, central south-west location with close proximity to Strip corridor. This is the most highly sought after industrial office area in town with low inventory. Existing alarm system. Full sprinklers. Zoning Clark County M-D Manufacturer Design, Land Use: Professional and Business Services, BDRP, Business Design + Research Park. All 9,776 square feet HVAC office, small receptionist, waiting, call center, bull pen, multiple private offices, XL break room, multiple private restrooms, XL executive private office with private restroom and shower, upstairs additional many private offices with private restroom, (6 restrooms and one shower). Also HVAC 1,699 warehouse with two roll up ground level doors, many high class upgrades. Please ask for lease details. 1,988 square feet evaporative cooled warehouse, 3-phase electric, one HVAC office & private restroom, was an auto mechanic shop. Could be manufacturing, ground level roll-up door, etc... All three suites in the building can be combined. for 13,463 square feet. Owner / developer making dreams happen daily. More Information Online QR Code Scan this image with your mobile device: Page 1
: Usable Size (USF): Land Area: Sale Terms: 13,860 SF 13,463 SF 13,463 SF 17,424 SF Cash to Seller Industrial Type")
2 General Information Taxing Authority: Clark County Tax ID/APN: Zoning: CLARK COUNTY M-D DESIGN MANUFACTURER Property Use Type: Vacant/Owner-User Building Name: 10% Down Call Center, Office, Showroom, Warehouse, Auto, Flex Gross Building Area: Building/Unit Size (RSF): Usable Size (USF): Land Area: Sale Terms: 13,860 SF 13,463 SF 13,463 SF 17,424 SF Cash to Seller Industrial Type Flex Space, Free-Standing, Industrial-Business Park, Manufacturing, Mixed Use, Light Industrial, Office Showroom, Research & Development, Warehouse/ Distribution, Other Area & Location Property Located Between: Hacienda and Diablo Highway Access: 215, I-15 Airports: McCarran Building Related Tenancy: Multiple Tenants Total Number of Buildings: 1 Number of Stories: 2 Typical SF / Floor: 13,463 SF Office Space SF: 13,463 SF Property Condition: Average Year Built: 2005 Exterior Description: Concrete Block Parking Ratio: 3 (per 1000 SF) Parking Type: Parking Description: Ceiling Height: 21 Clear Height: 21 Loading Doors: 3 Drive-In Bays: 3 Passenger Elevators: 0 Freight Elevators: 0 Sprinklers: Wet Surface Reciprical Location Address: 5419 S Decatur Blvd, Las Vegas, NV County: Clark MSA: Submarket: Las Vegas-Henderson-Paradise Southwest Page 2
3

![$141 psf For Property Information: 702Michael Hawkes Great Bridge Properties 702-642-4235 [M] 702-642-4235 [O] 702Michael@702Michael.](/docs-images/95/125413767/images/4-3.jpg "com 90% SBA 504 Financing Example Financing Package Amount Rate Term Amort Monthly Pymt Bank 1st Mortgage 50% $ 950,000 4.75% 10 Yrs 25 Yrs $ 5,416 SBA 504 2nd Mortgage* 40% $ 779,000 5.")
4 SBA 504 Loan Scenario Flex Space Building Scenario as of: 8/18/2018 Own the Business? Own the Building. Purchase Price $1,899, S Decatur Blvd, Las Vegas, NV Improvements $0 Building Size 13,463 sf Other $0 Total Project Costs $1,899,999 Price per Sq. Ft. $141 psf For Property Information: 702Michael Hawkes Great Bridge Properties [M] [O] 702Michael@702Michael.com 90% SBA 504 Financing Example Financing Package Amount Rate Term Amort Monthly Pymt Bank 1st Mortgage 50% $ 950, % 10 Yrs 25 Yrs $ 5,416 SBA 504 2nd Mortgage* 40% $ 779, % 25 Yrs 25 Yrs $ 4,710 Down Payment 10% $ 190,000 *Includes financed SBA fee of $19, % $0.75 PSF $ 10,126 Monthly Costs Adjusted Monthly Costs PSF Monthly PSF Monthly Mortgage Payments $0.75 $10,126 Total Monthly Payment $0.75 $10,126 Less Depreciation ($0.24) -$3,248 Total Monthly Payment $0.75 PSF $10,126 Total Adjusted Monthly Pa $0.51 PSF $6,878 Out of Pocket Expenses Invest in Your Future: Equity Over First 10 Years Cash Down Payment 10.0% $190,000 Estimated Bank Fees 1.5% $14,250 Estimated Appraisal & Environmental $5,800 $1,500,000 $1,000,000 $500,000 EQUITY $ Assumptions: The following assumptions were made in the preparation of this sample. Please let us know if there are specific values you'd like to see. Bank rate, terms and fees are estimated and vary depending on lender. Operating costs, title and insurance are estimates. SBA rate is as of Aug '18. Actual rate is set at debenture sale. Depreciation is estimated at an 80% bracket over 39. SBA Fee is estimated at 2.15% plus a $2,500 legal fee. Fees are financed. 90% LTV financing generally does not require additional collateral. For more information contact your 504 loan experts: Chris Hunter TMC Financing SVP, Business Development Officer chris@tmcfinancing.com


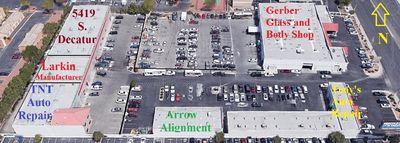
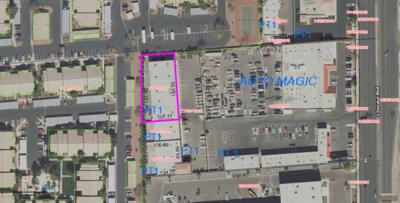
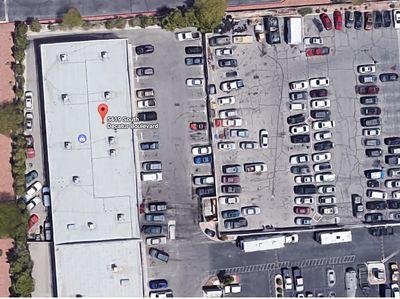
5 Property Images 5419 S Decatur Aerial 3b a5a4ddcbe5b59378f1958ed _ Google Close Up of Parcel _ S. Decatur Google Earth _ Page 3
6 _ _ _ _ Page 4
7 _ _ _ _ _ _ Page 5
8 _ _ _ _ _ _ Page 6
9 _ _ _ Page 7


10 Google Aerial c255a7e992ee4af9bff2d1ee989bf76f Suite B 1,699' Plus or Minus Page 8


11 5419 S Decatur Aerial 5419 S Decatur Aerial 5419 S Decatur Google Earth #2 Warehouse Space Property Contacts 702Michael Hawkes Great Bridge Properties [M] [O] 702Michael@702Michael.com Page 9 Copyright Catylist. All Rights Reserved. The information presented herein is provided as is, without warranty of any kind. Neither the administrators of this site nor Catylist assume any liability for errors or omissions.

12 Demographics, Labor/Workforce, and Consumer Expenditures 5419 S Decatur Blvd, Las Vegas, NV Disclaimer: While we believe this information (via GeoLytics) to be reliable, we have not checked its accuracy and make no guarantee as to its validity. By using the information provided on this page, the user acknowledges that the data may contain errors or other nonconformities. You and/or your client should diligently and independently verify the specifics of the information that you are using. Population 2020 Projection 19, , , Estimate 17, , , Census 16, , ,044 Growth % 11.56% 12.11% Growth % 11.79% 12.36% Population (Male) 2020 Projection 9,529 72, , Estimate 8,692 65, , Census 8,357 60, ,587 Growth % 11.3% 11.78% Growth % 7.34% 8.5% Page 10 Copyright Catylist. All Rights Reserved. The information presented herein is provided as is, without warranty of any kind. Neither the administrators of this site nor Catylist assume any liability for errors or omissions.
13 Population (Female) 2020 Projection 9,594 73, , Estimate 8,696 65, , Census 7,705 56, ,457 Growth % 11.81% 12.44% Growth % 16.58% 16.44% Population by Age (2015 Estimate) Age 0 to 5 1,041 8,802 33,293 Age 5 to 10 1,044 8,897 33,684 Age 10 to ,628 29,015 Age 15 to ,837 26,150 Age 20 to ,753 25,664 Age 25 to ,130 26,670 Age 30 to 35 1,062 7,670 28,189 Age 35 to 40 1,274 8,408 30,395 Age 40 to 45 1,442 9,034 32,516 Age 45 to 50 1,513 9,425 34,012 Age 50 to 55 1,386 8,979 32,615 Age 55 to 60 1,223 8,715 31,229 Age 60 to 65 1,035 8,262 28,890 Age 65 and over 3,168 24,772 83,005 Total Population 17, , ,327 Median Age Age 0 to 5 Age 5 to 10 Age 10 to 15 Age 15 to 20 Age 20 to 25 Age 25 to 30 Age 30 to 35 Age 35 to 40 Age 40 to 45 Age 45 to 50 Age 50 to 55 Age 55 to 60 Age 60 to 65 Age 65 and over 6% 7% 7% 6% 7% 7% 5% 6% 6% 4% 5% 6% 4% 5% 5% 5% 5% 6% 6% 6% 6% 7% 6% 6% 8% 7% 7% 9% 7% 7% 8% 7% 7% 7% 7% 7% 6% 6% 6% 18% 19% 17% Median Age (Male) 2010 Census Median Age (Female) 2010 Census High School Graduates Age 25+ by Educational Attainment (2015 Estimate) High School Graduate (or GED) 4,560 28,497 95,936 Some College, No Degree 3,351 23,609 85,789 Associate or Bachelor's Degree 738 5,617 19,556 Master's Degree 532 3,160 11,768 Professional School Degree 96 1,375 6,485 Doctorate Degree ,431 Total High School Graduates Age 25+ 9,287 62, ,965 High School Graduate (or GED) Some College, No Degree Associate or Bachelor's Degree Master's Degree Professional School Degree Doctorate Degree 49% 45% 43% 36% 38% 39% 8% 9% 9% 6% 5% 5% 1% 2% 3% 0% 1% 1% Page 11 Copyright Catylist. All Rights Reserved. The information presented herein is provided as is, without warranty of any kind. Neither the administrators of this site nor Catylist assume any liability for errors or omissions.
14 Households 2020 Projection 8,896 60, , Estimate 8,096 54, , Census 7,494 48, ,850 Growth % 11.57% 11.77% Growth % 11.11% 11.73% Population in Households 2010 Census 16, , ,044 Average Household Size 2020 Projection Estimate Census Growth % -0% 0% Growth % 0.5% 0.61% Page 12 Copyright Catylist. All Rights Reserved. The information presented herein is provided as is, without warranty of any kind. Neither the administrators of this site nor Catylist assume any liability for errors or omissions.
15 Households by Household Type and Size and Presence of Children (2015 Estimate) Family Households 3,832 29, ,984 Married-couple family 2,272 18,821 69,532 With own 795 7,603 28,840 No own 1,477 11,218 40,692 Male Householder: 572 4,152 13,940 no wife present With own 225 1,749 6,062 No own 347 2,403 7,878 Female Householder: no husband 988 6,899 24,512 present With own 465 3,422 12,800 No own 523 3,477 11,712 Nonfamily Households 4,264 24,438 84,016 1 Person households 3,238 17,594 60, Unrelated people 1,026 6,844 23,057 Total Households 8,096 54, ,000 Family Households Married-couple family With own No own Male Householder: no wife present With own No own Female Householder: no husband present With own No own Nonfamily Households 1 Person households 2+ Unrelated people 47% 55% 56% 28% 35% 36% 10% 14% 15% 18% 21% 21% 7% 8% 7% 3% 3% 3% 4% 4% 4% 12% 13% 13% 6% 6% 7% 6% 6% 6% 53% 45% 44% 40% 32% 32% 13% 13% 12% Page 13 Copyright Catylist. All Rights Reserved. The information presented herein is provided as is, without warranty of any kind. Neither the administrators of this site nor Catylist assume any liability for errors or omissions.
16 Households by Household Income (2015 Estimate) Less than $25,000 1,564 11,177 41,506 $25,000 to $49,999 2,750 17,005 54,620 $50,000 to $74,999 1,958 11,608 41,169 $75,000 to $99, ,543 23,402 $100,000 to $124, ,494 12,915 $125,000 to $149, ,571 6,406 $150,000 to $199, ,445 6,500 $200,000 or more 105 1,467 5,482 Total Households 8,096 54, ,000 Average Household Income $56, $61, $63, Median Household Income $50, $55, $56, Less than $25,000 $25,000 to $49,999 $50,000 to $74,999 $75,000 to $99,999 $100,000 to $124,999 $125,000 to $149,999 $150,000 to $199,999 $200,000 or more 19% 21% 22% 34% 31% 28% 24% 21% 21% 11% 12% 12% 6% 6% 7% 3% 3% 3% 1% 3% 3% 1% 3% 3% Households by Household Income (2020 Projection) Less than $25,000 1,688 12,666 46,968 $25,000 to $49,999 3,015 19,112 61,624 $50,000 to $74,999 2,150 12,896 45,871 $75,000 to $99,999 1,008 7,230 25,971 $100,000 to $124, ,854 14,206 $125,000 to $149, ,703 7,020 $150,000 to $199, ,558 7,065 $200,000 or more 107 1,574 5,883 Total Households 8,896 60, ,608 Average Household Income $55, $61, $63, Median Household Income $53, $57, $58, Less than $25,000 $25,000 to $49,999 $50,000 to $74,999 $75,000 to $99,999 $100,000 to $124,999 $125,000 to $149,999 $150,000 to $199,999 $200,000 or more 19% 21% 22% 34% 32% 29% 24% 21% 21% 11% 12% 12% 6% 6% 7% 3% 3% 3% 1% 3% 3% 1% 3% 3% Per Capita Income 2015 Estimate $26, $25, $25, Unemployment Rate 2015 Estimate 11.83% 9.35% 9.91% Page 14 Copyright Catylist. All Rights Reserved. The information presented herein is provided as is, without warranty of any kind. Neither the administrators of this site nor Catylist assume any liability for errors or omissions.
17 Population Age 16+ By Employment Status (2015 Estimate) Labor Force 11,079 72, ,692 Civilian, Employed 10,077 67, ,450 Civilian, Unemployed 1,002 5,201 19,242 Not in Labor Force 5,958 49, ,927 Total Population Age , , ,619 Labor Force Civilian, Employed Civilian, Unemployed Not in Labor Force 65% 59% 59% 59% 55% 54% 6% 4% 4% 35% 41% 41% Employed Civilian Population Age 16+ by Industry (2015 Estimate) Agriculture, forestry, fishing and hunting, mining and 884 5,059 18,200 construction Manufacturing 325 1,836 6,979 Wholesale & retail trade 1,276 9,116 33,778 Transportation and warehousing, and 880 4,282 12,194 utilities Information 179 1,452 4,367 Finance, insurance, real estate and 253 2,179 8,631 rental and leasing Professional, scientific, and 1,103 7,723 27,549 technical services Educational, health and social services 904 6,607 27,677 Arts, entertainment, recreation, accommodation and 3,905 27,171 91,047 food services Other services (except public 723 5,330 19,612 administration) Public Administration 300 1,707 5,994 Total Employed Civilian Population Age ,732 72, ,028 Agriculture, forestry, fishing and hunting, mining and construction Manufacturing Wholesale & retail trade Transportation and warehousing, and utilities Information Finance, insurance, real estate and rental and leasing Professional, scientific, and technical services Educational, health and social services Arts, entertainment, recreation, accommodation and food services Other services (except public administration) Public Administration 8% 7% 7% 3% 3% 3% 12% 13% 13% 8% 6% 5% 2% 2% 2% 2% 3% 3% 10% 11% 11% 8% 9% 11% 36% 37% 36% 7% 7% 8% 3% 2% 2% Housing Units by Tenure (2015 Estimate) Vacant Housing Units 3,008 24,876 57,392 Occupied Housing Units 8,096 54, ,000 Owner- Occupied 3,088 23,401 83,339 Renter- Occupied 5,008 30, ,661 Total Housing Units 11,104 79, ,392 Vacant Housing Units Occupied Housing Units Owner- Occupied Renter- Occupied 27% 31% 23% 73% 69% 77% 28% 30% 33% 45% 39% 44% Page 15 Copyright Catylist. All Rights Reserved. The information presented herein is provided as is, without warranty of any kind. Neither the administrators of this site nor Catylist assume any liability for errors or omissions.
5419 S Decatur Blvd, Las Vegas, NV 89118
 Call Center, Office, Showroom, Warehouse, Auto, Flex 5419 S Decatur Blvd, Las Vegas, NV 89118 Listing ID: 29978730 Status: Active Property Type: Office For Lease Office Type: Business Park, Governmental
5715 W. Alexander #150, Las Vegas, NV 89130
 10% Down Office Condo 49c PSF Payments 5715 W. Alexander #150, Las Vegas, NV 89130 Listing ID: 30279469 Status: Active Property Type: Office For Sale Office Type: Business Park, Executive Suites Size:
5715 W. Alexander #150, Las Vegas, NV 89130
 Brand New Everything! NW Professional Office Condo 5715 W. Alexander #150, Las Vegas, NV 89130 Listing ID: 30279487 Status: Active Property Type: Office For Lease Office Type: Business Park, Executive
1320 S Casino Center Blvd, Las Vegas, NV 89104
 Professional or Attorney Office Arts District Casino Center 1320 S Casino Center Blvd, Las Vegas, NV 89104 Listing ID: 30030990 Status: Active Property Type: Office For Sale Office Type: Business Park,
2365 Reynolds Ave, North Las Vegas, NV 89030
 10% Down $77 psf 7,072' Medical Office Elevator & Gray Shell 2365 Reynolds Ave, North Las Vegas, NV 89030 Listing ID: 29944110 Status: Active Property Type: Office For Sale Office Type: Business Park,
2415 Reynolds Ave, North Las Vegas, NV 89030
 7,221' *Reynolds Medical Center* Gray Shell w/ Elevator 89030 2415 Reynolds Ave, North Las Vegas, NV 89030 Listing ID: 29944098 Status: Active Property Type: Office For Sale (also listed as Special Purpose)
2965 S Jones Blvd, Las Vegas, NV 89146
 10% Down Data Center Office Call Center Fiber Optic Cubicles 2965 S Jones Blvd, Las Vegas, NV 89146 Listing ID: 30029430 Status: Active Property Type: Office For Sale Office Type: Business Park, Governmental
2465 Reynolds Ave, North Las Vegas, NV 89030
 12,020' Reynolds Medical & Attorney Build-Out Elevator 89030 2465 Reynolds Ave, North Las Vegas, NV 89030 Listing ID: 29944111 Status: Active Property Type: Office For Sale (also listed as Special Purpose)
7401 W Charleston Blvd, Las Vegas, NV 89117
 Cool $1,000,000.00 Discount Off Sale Price 7401 W Charleston Blvd, Las Vegas, NV 89117 Listing ID: 30193298 Status: Active Property Type: Office For Sale Office Type: Business Park, Executive Suites Size:
7401 W Charleston Blvd, Las Vegas, NV 89117
 Cool $1.25 Million Discounted Las Vegas Company HQ Office 7401 W Charleston Blvd, Las Vegas, NV 89117 Listing ID: Status: Property Type: Office Type: Size: Sale Price: Unit Price: Sale Terms: Overview/Comments
1208 S Eastern Ave, Las Vegas, NV 89104
 Office Medical Veterinarin Signage Frontage Visibility 89104 1208 S Eastern Ave, Las Vegas, NV 89104 Listing ID: 30138546 Status: Active Property Type: Office For Lease Office Type: Governmental, High-Tech
Benchmark Avenue, Fort Myers, FL 33905
 Available October 2017 Benchmark Industrial For Lease 1681-1687 Benchmark Avenue, Fort Myers, FL 33905 Listing ID: 30132311 Status: Active Property Type: Industrial For Lease Industrial Type: Flex Space,
3424 East Road, Saginaw, MI 48601
 R & W Investment 3424 East Road, Saginaw, MI 48601 Listing ID: 30298825 Status: Active Property Type: Industrial For Sale Industrial Type: Flex Space, Free-Standing Size: 7,564 SF Sale Price: $230,000
4575 Bay Rd, Saginaw, MI 48603
 Georges 4575 Bay Rd, Saginaw, MI 48603 Listing ID: 30340682 Status: Active Property Type: Business Opportunity For Sale Industry: Professional Services Size: 6,600 SF Sale Price: $852,000 Sale Terms: Cash
2908 E Oakland Ave, Johnson City, TN 37601
 Office/retail Lease 2908 E Oakland Ave, Johnson City, TN 37601 Listing ID: 30369980 Status: Active Property Type: Office For Lease Office Type: Executive Suites, Governmental Contiguous Space: 2,800-7,800
1112 Carroll Creek Rd, Johnson City, TN 37601
 Deanwood Apartments for Sale 1112 Carroll Creek Rd, Johnson City, TN 37601 Listing ID: 30363543 Status: Active Property Type: Multi-Family For Sale Multi-Family Type: Low-Rise/Garden Size: 23,432 SF Sale
 12519 S Cleveland Ave Details Prepared on Prepared By Josh Burdine 239-362-3173 josh@rockstar-realestate.com Page 1 14,000 sq feet building on 41 in Fort Myers 12519 S Cleveland Ave, Fort Myers, FL 33907
3280 E Tropicana Ave, Las Vegas, NV 89121
 65c Rent NNN Various Size Retail Shop Office Store Medical 3280 E Tropicana Ave, Las Vegas, NV 89121 Listing ID: 29848683 Status: Active Property Type: Retail-Commercial For Lease (also listed as Office,
11701 Orpington St, Orlando, FL 32817
 Professional Space for Lease 11701 Orpington St, Orlando, FL 32817 Listing ID: 30295554 Status: Active Property Type: Office For Lease Office Type: Business Park, Governmental Contiguous Space: 1,250 SF
E. Flamingo Rd, Las Vegas, NV 89121
 School Restaurant Retail Office Convenience 89c to $1.25 3620 3650 3654 E. Flamingo Rd, Las Vegas, NV 89121 Listing ID: 30284747 Status: Active Property Type: Retail-Commercial For Lease Retail-Commercial
E. Flamingo Rd, Las Vegas, NV 89121
 Restaurant Supper Club Retail Office Convenience 89c to $1.25 3620 3650 3654 E. Flamingo Rd, Las Vegas, NV 89121 Listing ID: 30214834 Status: Active Property Type: Retail-Commercial For Lease Retail-Commercial
14114 Palm Beach Blvd, Fort Myers, FL 33905
 Palm Beach Boulevard Land 14114 Palm Beach Blvd, Fort Myers, FL 33905 Listing ID: 30318883 Status: Active Property Type: Vacant Land For Sale Possible Uses: Office, Retail Gross Land Area: 18,000 SF Sale
46 Acres - Fronting Interstate 81 & Hopewell Rd. Prime Location - Zoned Industrial Potential for 2 Building Complexes
 46 Acre Land Opportunity - I-81 Frontage Design Concept: 2 Potential Building Parcels Prepared on 46 Acres - Fronting Interstate 81 & Hopewell Rd. Prime Location - Zoned Industrial Potential for 2 Building
Contact: Larry Hausman (502) Outer Loop, Louisville, KY Knobview Shopping Center
 Outer Loop, Louisville, KY Knobview Shopping Center") 5603-5637 Outer Loop, Louisville, KY 40219 Knobview Shopping Center Jefferson Mall Academy Sports Center SUBJECT Knobview Shopping Center offers a diverse mix of local and national tenants. The center
5603-5637 Outer Loop, Louisville, KY 40219 Knobview Shopping Center Jefferson Mall Academy Sports Center SUBJECT Knobview Shopping Center offers a diverse mix of local and national tenants. The center
5200 Ocean Blvd, Siesta Key, FL 34242
 Siesta Key Restaurant- BEST LOCATION IN THE VILLAGE! 5200 Ocean Blvd, Siesta Key, FL 34242 Listing ID: 29826583 Status: Active Property Type: Business Opportunity For Sale Industry: Food and Beverage Size:
1540 S. Grand Avenue Santa Ana, CA 92705
 SALE PRICE: $1,250,000 Property Highlights 3 Stories, 4,668 SF Class C Office Flex Space Major Street Frontage and Signage Zoned M1 Fenced and Paved Yard Land:.17 AC (7,405 SF) Year Built: 1981 Great owner
For Sale: Office Condominium
 4302 Redwood Hwy., Ste. 100, San Rafael Owner/User Opportunity High Ceilings Freeway Frontage Excellent On-Site Parking Offering Summary Asking Price: $695,000 Price Per Sq. Ft.: $363 psf Building Sq.
SOUTH DAKOTA KIDS COUNT BEACOM SCHOOL OF BUSINESS UNIVERSITY OF SOUTH DAKOTA 414 E. CLARK STREET VERMILLION, SD
 Brookings County Compared to o SDSD Undergrad Enrollment approximately 11,225 o USD Undergrad Enrollment approximately 7,600 o Brookings County 1 year population estimate for 2013 is 32,968 o 1 year population
SELECTED ECONOMIC CHARACTERISTICS American Community Survey 5-Year Estimates
 DP03 SELECTED ECONOMIC CHARACTERISTICS 2008-2012 American Community Survey 5-Year Estimates Supporting documentation on code lists, subject definitions, data accuracy, and statistical testing can be found
American Community Survey 5-Year Estimates
 DP03 SELECTED ECONOMIC CHARACTERISTICS 2013-2017 American Community Survey 5-Year Estimates Supporting documentation on code lists, subject definitions, data accuracy, and statistical testing can be found
Tell us what you think. Provide feedback to help make American Community Survey data more useful for you.
 DP03 SELECTED ECONOMIC CHARACTERISTICS 2016 American Community Survey 1-Year Estimates Supporting documentation on code lists, subject definitions, data accuracy, and statistical testing can be found on
American Community Survey 5-Year Estimates
 DP03 SELECTED ECONOMIC CHARACTERISTICS 2012-2016 American Community Survey 5-Year Estimates Supporting documentation on code lists, subject definitions, data accuracy, and statistical testing can be found
American Community Survey 5-Year Estimates
 DP03 SELECTED ECONOMIC CHARACTERISTICS 2012-2016 American Community Survey 5-Year Estimates Supporting documentation on code lists, subject definitions, data accuracy, and statistical testing can be found
American Community Survey 5-Year Estimates
 DP03 SELECTED ECONOMIC CHARACTERISTICS 2012-2016 American Community Survey 5-Year Estimates Supporting documentation on code lists, subject definitions, data accuracy, and statistical testing can be found
American Community Survey 5-Year Estimates
 DP03 SELECTED ECONOMIC CHARACTERISTICS 2012-2016 American Community Survey 5-Year Estimates Supporting documentation on code lists, subject definitions, data accuracy, and statistical testing can be found
American Community Survey 5-Year Estimates
 DP03 SELECTED ECONOMIC CHARACTERISTICS 2012-2016 American Community Survey 5-Year Estimates Supporting documentation on code lists, subject definitions, data accuracy, and statistical testing can be found
American Community Survey 5-Year Estimates
 DP03 SELECTED ECONOMIC CHARACTERISTICS 2012-2016 American Community Survey 5-Year Estimates Supporting documentation on code lists, subject definitions, data accuracy, and statistical testing can be found
American Community Survey 5-Year Estimates
 DP03 SELECTED ECONOMIC CHARACTERISTICS 2012-2016 American Community Survey 5-Year Estimates Supporting documentation on code lists, subject definitions, data accuracy, and statistical testing can be found
American Community Survey 5-Year Estimates
 DP03 SELECTED ECONOMIC CHARACTERISTICS 2012-2016 American Community Survey 5-Year Estimates Supporting documentation on code lists, subject definitions, data accuracy, and statistical testing can be found
American Community Survey 5-Year Estimates
 DP03 SELECTED ECONOMIC CHARACTERISTICS 2012-2016 American Community Survey 5-Year Estimates Supporting documentation on code lists, subject definitions, data accuracy, and statistical testing can be found
American Community Survey 5-Year Estimates
 DP03 SELECTED ECONOMIC CHARACTERISTICS 2012-2016 American Community Survey 5-Year Estimates Supporting documentation on code lists, subject definitions, data accuracy, and statistical testing can be found
American Community Survey 5-Year Estimates
 DP03 SELECTED ECONOMIC CHARACTERISTICS 2012-2016 American Community Survey 5-Year Estimates Supporting documentation on code lists, subject definitions, data accuracy, and statistical testing can be found
American Community Survey 5-Year Estimates
 DP03 SELECTED ECONOMIC CHARACTERISTICS 2012-2016 American Community Survey 5-Year Estimates Supporting documentation on code lists, subject definitions, data accuracy, and statistical testing can be found
American Community Survey 5-Year Estimates
 DP03 SELECTED ECONOMIC CHARACTERISTICS 2012-2016 American Community Survey 5-Year Estimates Supporting documentation on code lists, subject definitions, data accuracy, and statistical testing can be found
American Community Survey 5-Year Estimates
 DP03 SELECTED ECONOMIC CHARACTERISTICS 2012-2016 American Community Survey 5-Year Estimates Supporting documentation on code lists, subject definitions, data accuracy, and statistical testing can be found
American Community Survey 5-Year Estimates
 DP03 SELECTED ECONOMIC CHARACTERISTICS 2012-2016 American Community Survey 5-Year Estimates Supporting documentation on code lists, subject definitions, data accuracy, and statistical testing can be found
American Community Survey 5-Year Estimates
 DP03 SELECTED ECONOMIC CHARACTERISTICS 2012-2016 American Community Survey 5-Year Estimates Supporting documentation on code lists, subject definitions, data accuracy, and statistical testing can be found
American Community Survey 5-Year Estimates
 DP03 SELECTED ECONOMIC CHARACTERISTICS 2012-2016 American Community Survey 5-Year Estimates Supporting documentation on code lists, subject definitions, data accuracy, and statistical testing can be found
American Community Survey 5-Year Estimates
 DP03 SELECTED ECONOMIC CHARACTERISTICS 2012-2016 American Community Survey 5-Year Estimates Supporting documentation on code lists, subject definitions, data accuracy, and statistical testing can be found
American Community Survey 5-Year Estimates
 DP03 SELECTED ECONOMIC CHARACTERISTICS 2012-2016 American Community Survey 5-Year Estimates Supporting documentation on code lists, subject definitions, data accuracy, and statistical testing can be found
American Community Survey 5-Year Estimates
 DP03 SELECTED ECONOMIC CHARACTERISTICS 2012-2016 American Community Survey 5-Year Estimates Supporting documentation on code lists, subject definitions, data accuracy, and statistical testing can be found
American Community Survey 5-Year Estimates
 DP03 SELECTED ECONOMIC CHARACTERISTICS 2012-2016 American Community Survey 5-Year Estimates Supporting documentation on code lists, subject definitions, data accuracy, and statistical testing can be found
American Community Survey 5-Year Estimates
 DP03 SELECTED ECONOMIC CHARACTERISTICS 2012-2016 American Community Survey 5-Year Estimates Supporting documentation on code lists, subject definitions, data accuracy, and statistical testing can be found
American Community Survey 5-Year Estimates
 DP03 SELECTED ECONOMIC CHARACTERISTICS 2012-2016 American Community Survey 5-Year Estimates Supporting documentation on code lists, subject definitions, data accuracy, and statistical testing can be found
American Community Survey 5-Year Estimates
 DP03 SELECTED ECONOMIC CHARACTERISTICS 2012-2016 American Community Survey 5-Year Estimates Supporting documentation on code lists, subject definitions, data accuracy, and statistical testing can be found
American Community Survey 5-Year Estimates
 DP03 SELECTED ECONOMIC CHARACTERISTICS 2012-2016 American Community Survey 5-Year Estimates Supporting documentation on code lists, subject definitions, data accuracy, and statistical testing can be found
American Community Survey 5-Year Estimates
 DP03 SELECTED ECONOMIC CHARACTERISTICS 2012-2016 American Community Survey 5-Year Estimates Supporting documentation on code lists, subject definitions, data accuracy, and statistical testing can be found
W Republic Rd, Springfield, MO 65807
 Republic Plaza, All Available Suites 2141-2155 W Republic Rd, Springfield, MO 65807 Listing ID: 29778068 Status: Active Property Type: Shopping Center For Lease (also listed as Retail-Commercial, Office)
Town Profiles: Demographic, Economic, and Housing Statistics for De Smet City and Wall Town, SOuth Dakota
 South Dakota State University Open PRAIRIE: Open Public Research Access Institutional Repository and Information Exchange Census Data Center News Releases SDSU Census Data Center 12-7-2017 Town Profiles:
SEVEN HILLS MEDICAL & BUSINESS PARK
 PROPERTY HIGHLIGHTS: Turnkey medical and professional suites available Unit sizes range from ±1,808 - ±8,130 SF Lease rate: $1.29 - $1.50 SF/M NNN CAM s: $0.40 SF/M Zoning: C-O (Office Commercial) Parcel
University of Minnesota
 neighborhood profile October 2011 About this area The University neighborhood is bordered by 11th Avenue Southeast, University Avenue, 15th Avenue Southeast, the railroad tracks, Oak Street, and the Mississippi
Mid - City Industrial
 Minneapolis neighborhood profile October 2011 Mid - City Industrial About this area The Mid-City Industrial neighborhood is bordered by I- 35W, Highway 280, East Hennepin Avenue, and Winter Street Northeast.
3855 ATHERTON ROAD ROCKLIN EXCELLENT OWNER-USER OPPORTUNITY
 3855 ROCKLIN AVAILABLE FOR SALE OR LEASE EXCELLENT OWNER-USER OPPORTUNITY Rick Phillips, CCIM Principal Tel: (916) 677-8139 rphillips@tricommercial.com BRE Lic. #01061757 Brandon Sessions Vice President
LAND FOR SALE Blair Road, Mint Hill, NC PROPERTY OVERVIEW. Large parcel with I-485 access via Blair Road exit in the path of. growth.
 LAND FOR SALE 10395 Blair Road, Mint Hill, NC 28227 OFFERING SUMMARY SALE PRICE: $1,000,000 PROPERTY OVERVIEW Large parcel with I485 access via Blair Road exit in the path of growth. LOT SIZE: 9.28 Acres
Camden Industrial. Minneapolis neighborhood profile. About this area. Trends in the area. Neighborhood in Minneapolis.
 Minneapolis neighborhood profile October 2011 Camden Industrial About this area The Camden Industrial neighborhood is bordered by 48th Avenue North, the Mississippi River, Dowling Avenue North, Washington
Shingle Creek. Minneapolis neighborhood profile. About this area. Trends in the area. Neighborhood in Minneapolis. October 2011
 neighborhood profile October 2011 About this area The neighborhood is bordered by 53rd Avenue North, Humboldt Avenue North, 49th Avenue North, and Xerxes Avenue North. It is home to Olson Middle School.
FOR SALE UARE E SQ TH The Square
 THE SQUARE FOR SALE SITE PLAN TENAYA WAY POST ROAD The SQUARE, is a newly constructed, office condo development in the desirable Southwest Las Vegas submarket. The project is uniquely designed with modern
Daniel Jung CRENSHAW BLVD CRENSHAW BLVD INGLEWOOD CA, CA Priming Capital 6 Centerpointe Dr La Palma, CA
 11225 CRENSHAW BLVD 11225 CRENSHAW BLVD INGLEWOOD CA, CA 90303 Property Type Retail Building Size Owner (Legal) Property Subtype Auto Dealer Office SF Owner (True) Zoning Industrial SF County Los Angeles
TABLE 1. PROFILE OF GENERAL DEMOGRAPHIC CHARACTERISTICS
 Waterloo city, Iowa TABLE 1. PROFILE OF GENERAL DEMOGRAPHIC CHARACTERISTICS Estimate Lower Bound Upper Bound Total population 66,659 64,093 69,225 SEX AND AGE Male 32,096 30,415 33,777 Female 34,563 33,025
$1,600,000. Boston Reid LAKESIDE BUSINESS PARK. 117 Crosslake Park Drive Mooresville, NC SITE FEATURES. Lead 2 Real Estate Group
 LAKESIDE BUSINESS PARK 117 Crosslake Park Drive Mooresville, NC 28117 $1,600,000 Marketed By SITE FEATURES 17,000 + SF Industrial Building on 2.6 Acres Located in Lakeside Business Park High Power for
Average persons in household. Top three industries Post-secondary education (25 64 years) 7.1% Unemployment rate
 7.1% Unemployment rate") Demographic snapshot The Town of Oakville City of Burl ington City of Mis sissauga Town of Milton Population 198,042 Median age Average persons in household 41 2.8 years old $149,945 Average household
Demographic snapshot The Town of Oakville City of Burl ington City of Mis sissauga Town of Milton Population 198,042 Median age Average persons in household 41 2.8 years old $149,945 Average household
Durango. Medical Building ±15,163 SF $3,639,000 UNIQUE OPPORTUNITY SINGLE-STORY MEDICAL BUILDING FOR SALE VIRTUAL TOUR
 FOR SALE 3012 S. Drive, Las Vegas, NV 89117 DO NOT DISTURB BUSINESS OPERATOR. CALL FOR DETAILS OR TO SCHEDULE A TOUR WITH BROKER. UNIQUE OPPORTUNITY SINGLE-STORY MEDICAL BUILDING ±15,163 SF $3,639,000
Monte Vista Population, ,744 4,651 4,564 4,467 4,458 4,432 4,451
 1 Monte Vista 4,8 4,7 4,6 4,5 4,4 4,3 4,2 4,1 4,61 4,612 4,61 4,676 Monte Vista, 2-213 4,744 4,651 4,564 4,467 4,458 4,432 4,451 4,418 4,412 4,355 2 21 22 23 24 25 26 27 28 29 21 211 212 213 Year Monte
Economic Overview City of Tyler, TX. January 8, 2018
 Economic Overview City of Tyler, TX January 8, 2018 DEMOGRAPHIC PROFILE...3 EMPLOYMENT TRENDS...5 WAGE TRENDS...5 COST OF LIVING INDEX...6 INDUSTRY SNAPSHOT...7 OCCUPATION SNAPSHOT...9 INDUSTRY CLUSTERS...
Economic Overview York County, South Carolina. February 14, 2018
 Economic Overview York County, February 14, 2018 DEMOGRAPHIC PROFILE... 3 EMPLOYMENT TRENDS... 5 UNEMPLOYMENT RATE... 5 WAGE TRENDS... 6 COST OF LIVING INDEX... 6 INDUSTRY SNAPSHOT... 7 OCCUPATION SNAPSHOT...
ECONOMIC OVERVIEW DuPage County, Illinois
 ECONOMIC OVERVIEW DuPage County, Illinois DEMOGRAPHIC PROFILE... 3 EMPLOYMENT TRENDS... 5 UNEMPLOYMENT RATE... 5 WAGE TRENDS... 6 COST OF LIVING INDEX... 7 INDUSTRY SNAPSHOT... 8 OCCUPATION SNAPSHOT...
Economic Overview. Lawrence, KS MSA
 Economic Overview Lawrence, KS MSA March 5, 2019 DEMOGRAPHIC PROFILE... 3 EMPLOYMENT TRENDS... 5 UNEMPLOYMENT RATE... 5 WAGE TRENDS... 6 COST OF LIVING INDEX... 7 INDUSTRY SNAPSHOT... 8 OCCUPATION SNAPSHOT...
City of Utica Central Industrial Corridor ReVITALization Plan Appendix A. Socio-Economic Profile
 City of Utica Central Industrial Corridor ReVITALization Plan Appendix A. Socio-Economic Profile Population Graphic 1 City of Utica Population Change: 1960-2010 Since the 1960s, the population of Utica
PROPOSED SHOPPING CENTER
 PROPOSED SHOPPING CENTER Southeast Corner I-95 & Highway 192 Melbourne, Florida In a 5 Mile Radius 80,862 Population 32,408 Households $61K Avg HH Income SOONER INVESTMENT Commercial & Investment Real
ACS DEMOGRAPHIC AND HOUSING ESTIMATES American Community Survey 1-Year Estimates
 DP05 ACS DEMOGRAPHIC AND HOUSING ESTIMATES 2012 American Community Survey 1-Year Estimates Supporting documentation on code lists, subject definitions, data accuracy, and statistical testing can be found
City of Edmonton Population Change by Age,
 Population Change by Age, 1996-2001 2001 Edmonton Demographic Profile The City of Edmonton s 2001population increased by 49,800 since the 1996 census. Migration figures are not available at the municipal
EVEREST. Retail Investment Opportunity. Ivy Hills Retail Center 7397 Main Street Newtown, OH CONTACT: Chris Nachtrab.
 Retail Investment Opportunity CONTACT: Chris Nachtrab chris.nachtrab@everestrealestate.com 513/769-2509 John Thompson john.thompson@everestrealestate.com 513/769-2514 Ivy Hills Retail Center 7397 Main
Economic Overview 45-Minute Commute From Airport Park. June 6, 2017
 Economic Overview 45-Minute Commute From Airport Park June 6, 2017 DEMOGRAPHIC PROFILE... 3 EMPLOYMENT TRENDS... 5 WAGE TRENDS... 5 COST OF LIVING INDEX... 6 INDUSTRY SNAPSHOT... 7 OCCUPATION SNAPSHOT...
ACS DEMOGRAPHIC AND HOUSING ESTIMATES American Community Survey 1-Year Estimates
 DP05 ACS DEMOGRAPHIC AND HOUSING ESTIMATES 2010 American Community Survey 1-Year s Supporting documentation on code lists, subject definitions, data accuracy, and statistical testing can be found on the
Procter Properties P.O. Box 3484 Greensboro, NC
 Procter Properties P.O. Box 3484 Greensboro, NC 27402 3208 West Gate City Boulevard 3208 W Gate City Blv Greensboro, NC 27407 Property Type Retail Building Size 11,747 SF Owner (Legal) Property Subtype
Economic Overview Monterey County, California. July 22, 2016
 Economic Overview Monterey July 22, 2016 DEMOGRAPHIC PROFILE... 3 EMPLOYMENT TRENDS... 5 UNEMPLOYMENT RATE... 5 WAGE TRENDS... 6 COST OF LIVING INDEX... 6 INDUSTRY SNAPSHOT... 7 OCCUPATION SNAPSHOT...
Economic Overview Loudoun County, Virginia. October 23, 2017
 Economic Overview October 23, 2017 DEMOGRAPHIC PROFILE... 3 EMPLOYMENT TRENDS... 5 UNEMPLOYMENT RATE... 5 WAGE TRENDS... 6 COST OF LIVING INDEX... 6 INDUSTRY SNAPSHOT... 7 OCCUPATION SNAPSHOT... 9 INDUSTRY
DEMOGRAPHIC PROFILE...3 EMPLOYMENT TRENDS...5 UNEMPLOYMENT RATE...5 WAGE TRENDS...6 COST OF LIVING INDEX...6 INDUSTRY SNAPSHOT...7
 March 14, 2017 DEMOGRAPHIC PROFILE...3 EMPLOYMENT TRENDS...5 UNEMPLOYMENT RATE...5 WAGE TRENDS...6 COST OF LIVING INDEX...6 INDUSTRY SNAPSHOT...7 OCCUPATION SNAPSHOT...9 INDUSTRY CLUSTERS... 12 EDUCATION
Economic Overview Long Island
 Report created on August 29, 2017 Economic Overview Long Island Contact: Lisa.Montiel@suny.edu DEMOGRAPHIC PROFILE... 3 EMPLOYMENT TRENDS... 5 UNEMPLOYMENT RATE... 5 WAGE TRENDS... 6 COST OF LIVING INDEX...
Economic Overview Western New York
 Report created on August 29, 2017 Economic Overview Western New Contact: Lisa.Montiel@suny.edu DEMOGRAPHIC PROFILE... 3 EMPLOYMENT TRENDS... 5 UNEMPLOYMENT RATE... 5 WAGE TRENDS... 6 COST OF LIVING INDEX...
CAMARILLO CORPORATE PLAZA
 CAMARILLO, CA CAMARILLO CORPORATE PLAZA CLASS A OFFICE CONDOMINIUMS UNIT SIZES: 1,023 RSF - 1,661 RSF POSSIBLE TO COMBINE UNITS FOR LARGER SPACES Subject to Structural Engineer Analysis 2151 ALESSANDRO
The Trails. 1,500 sf Space Available. In a 3 Mile Radius 69,985 Population 25,450 Households $78,216 Avg HH Inc. 1,500 sf Corner Space
 1,500 sf Space Available The Trails Edmond Rd (2nd St) & Santa Fe Ave ~ Edmond, Oklahoma Current Tenancy: Edmond YMCA Spinal Wellness Clinic Lemongrass Thai Cuisine Kumon Learning Center Katie s Family
October 28, Economic Overview Yellowstone County, Montana
 October 28, 2016 Economic Overview Yellowstone DEMOGRAPHIC PROFILE...3 EMPLOYMENT TRENDS...5 UNEMPLOYMENT RATE...5 WAGE TRENDS...6 COST OF LIVING INDEX...6 INDUSTRY SNAPSHOT...7 OCCUPATION SNAPSHOT...9
Jefferson County, Mississippi (MS)
") UPDATED 3/ Jefferson County, Mississippi (MS) Mississippi Development Bank, Special Obligation Bonds, (Jefferson County, Mississippi Regional Correctional Facility Refunding Bond Project), $2,845,000,
UPDATED 3/ Jefferson County, Mississippi (MS) Mississippi Development Bank, Special Obligation Bonds, (Jefferson County, Mississippi Regional Correctional Facility Refunding Bond Project), $2,845,000,
Economic Overview Fairfax / Falls Church. October 23, 2017
 Economic Overview Fairfax / Falls Church October 23, 2017 DEMOGRAPHIC PROFILE... 3 EMPLOYMENT TRENDS... 5 UNEMPLOYMENT RATE... 5 WAGE TRENDS... 6 COST OF LIVING INDEX... 6 INDUSTRY SNAPSHOT... 7 OCCUPATION
OWNER USER / SBA FINANCING: Office Building For Sale. PROPERTY HIGHLIGHTS: Currently 90% Occupied, but in 2016 the whole top floor.
 OWNER USER / SBA FINANCING: Office Building For Sale Investment Lake Sahara Plaza at 8685 West Sahara Avenue is an 11,858 +/ SF Office building located in the prestigious Lakes subdivision on the edge
181 BLUE RAVINE rd FOR SALE THE FOLSOM COLLECTIVE PROPERTY HIGHLIGHTS FOLSOM, CALIFORNIA
 THE FOLSOM COLLECTIVE PROPERTY HIGHLIGHTS Total Building Size: ±41,472 RSF Former light manufacturing/ lab space with open office improvements 800 Amps, 277/480 V, 3-phase electrical service available
Economic Overview Prince William/Manassas. October 23, 2017
 Economic Overview Prince William/Manassas October 23, 2017 DEMOGRAPHIC PROFILE... 3 EMPLOYMENT TRENDS... 5 UNEMPLOYMENT RATE... 5 WAGE TRENDS... 6 COST OF LIVING INDEX... 6 INDUSTRY SNAPSHOT... 7 OCCUPATION
Economic Overview Capital District
 August 29, 2017 Economic Overview Capital District Contact: Lisa.Montiel@suny.edu DEMOGRAPHIC PROFILE... 3 EMPLOYMENT TRENDS... 5 UNEMPLOYMENT RATE... 5 WAGE TRENDS... 6 COST OF LIVING INDEX... 6 INDUSTRY
SDs from Regional Peer Group Mean. SDs from Size Peer Group Mean
 Family: Population Demographics Population Entire MSA 2414616 Central Cities (CC) 764431 Outside Central Cities 1650185 Percent of Entire MSA 31.66% Population in CC Percent Change in Population from 1999