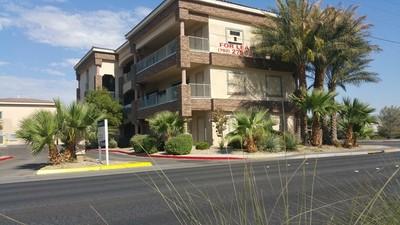
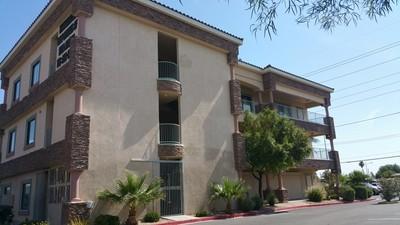
2465 Reynolds Ave, North Las Vegas, NV 89030
|
|
|
- Domenic Stewart
- 5 years ago
- Views:
Transcription
 Office Type: Business Park, Governmental Size: 12,020 SF Sale Price: $999,999 Unit Price: $83.19 PSF Sale Terms: Cash to Seller Ceiling: 9 ft.")

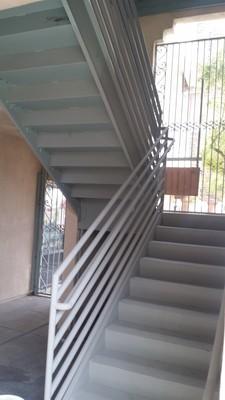
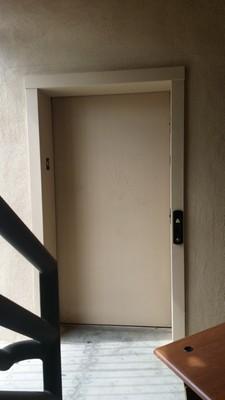
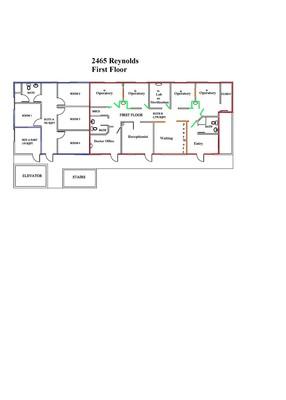
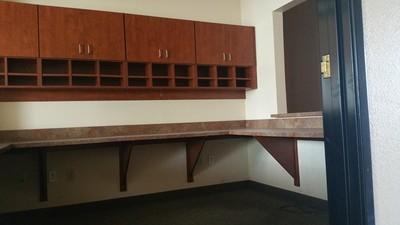
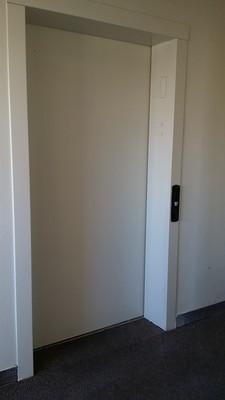
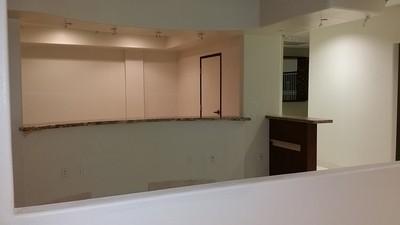
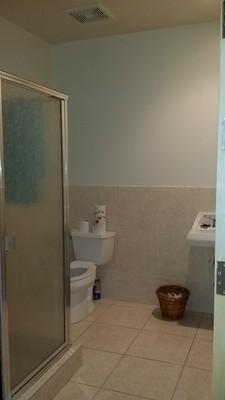
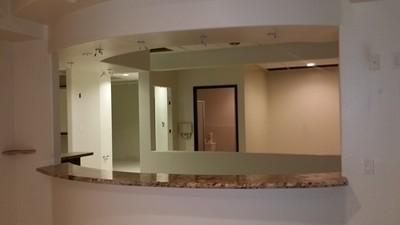
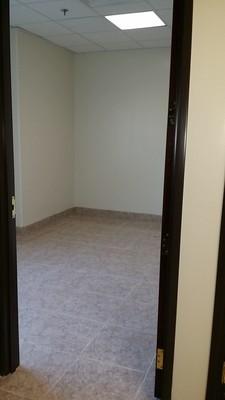
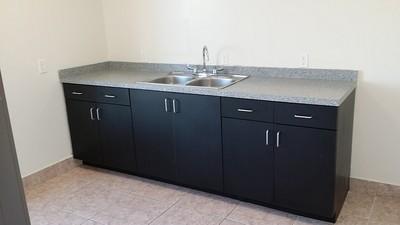
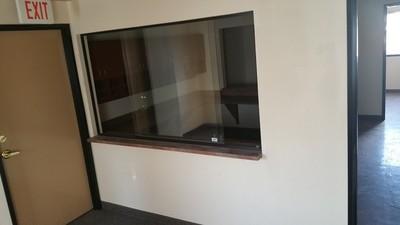
1 12,020' Reynolds Medical & Attorney Build-Out Elevator Reynolds Ave, North Las Vegas, NV Listing ID: Status: Active Property Type: Office For Sale (also listed as Special Purpose) Office Type: Business Park, Governmental Size: 12,020 SF Sale Price: $999,999 Unit Price: $83.19 PSF Sale Terms: Cash to Seller Ceiling: 9 ft. Overview/Comments Property Type: Medical Attorney Office, commercial Buildings Size: 8,464' usable square feet Buildings Size: 12,020' rentable square feet Structure: 3 story, elevator, 2 stairs, Building: Class B Year Built: 2006 Sprinklers: Yes Status: 66% Built-Out Medical and Office,1st & 3rd Floors Status: 33% gray shell 2nd floor, one to four suites Status: Partially 33% leased Zoning: Commercial Professional Two miles from North Vista Hospital. Six minutes from I-95 and I-15 Downtown NLV District Load Factor 15% Awesome new city approved parking plan First floor, long term leased to Urgent Care, turnkey built-out medical with check-in check-out receptionist, 8 exam rooms, private doctor offices, three private restrooms, rolladen roll up shutters for security and protection. Second floor, gray shell including HVAC units on roof, sprinklers, stairs and elevator already installed. The shell can be custom built for your specific needs, one to four suites. Third floor private elevator, three restrooms, check-in check-out receptionist, waiting room, private stairs tile floors, 6 large offices built for attorney, waiting area, conference rooms. Fresh paint, ceramic tile floors, cabinets, HVAC. Purchase one, two, or all three buildings. More Information Online QR Code Scan this image with your mobile device: Page 1
2 All three medical, office, dental buildings are for sale in one package deal also. Three elevators and six sets of stairs and multiple restrooms are all within ADA compliance. All 21,223 usable square feet of all three buildings have sprinklers. Tenant in place at 2465 Reynolds. Perfect setting for a dentist, any doctor practice, professional office user, turnkey office and medical suite available. One space previously used by immigration attorney firm. Existing Lessee has exclusive rights to Urgent Care. These are the premiere buildings at the premiere location in North Las Vegas. Situated on Eastern / Casino Center and Reynolds in between Owens Ave and Lake Mead Blvd. These three building have high visibility, signage, and great access to all community sites. 30,000 cars a day traffic count on Eastern / Civic Center. Monument sign. All information is deemed to be reliable but not guaranteed. All buyers and agents shall inspect and verify all facts for themselves. General Information Taxing Authority: North Las Vegas Tax ID/APN: Office Type: Business Park, Governmental, High-Tech, Institutional, Medical, Mixed Use, Office Building Zoning: C-P COMMERCIAL PROFESSIONAL Property Use Type: Investment, Vacant/Owner-User Building Name: 12,020' Reynolds Medical & Attorney Build-Out Elevator Class of Space: Class B Gross Building Area: 12,020 SF Building/Unit Size (RSF): 12,020 SF Usable Size (USF): 8,464 SF Land Area: 0.34 Acres Sale Terms: Cash to Seller Average Occupancy Rate: 33 Area & Location Property Located Between: Property Visibility: Lake Mead Blvd and Owens Ave Excellent Highway Access: 15 Airports: North Las Vegas Building Related Total Number of Buildings: 1 Number of Stories: 2 Typical SF / Floor: 3,000 SF Year Built: 2006 Parking Type: Surface Parking Description: 4:1 Ceiling Height: 9 Loading Doors: 0 Loading Docks: 0 Passenger Elevators: 3 Freight Elevators: 0 Land Related Zoning Description: Water Service: Sewer Type: C-P Commercial Professional Municipal Municipal Location Address: 2465 Reynolds Ave, North Las Vegas, NV County: Clark MSA: Submarket: Las Vegas-Henderson-Paradise North Las Vegas Page 2

3 Property Images _ _ Page 3

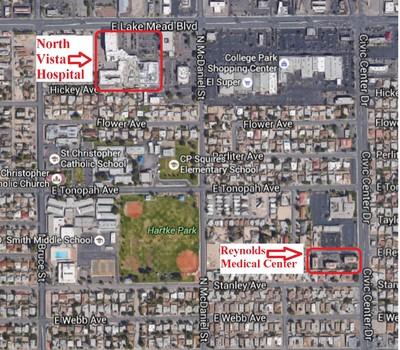
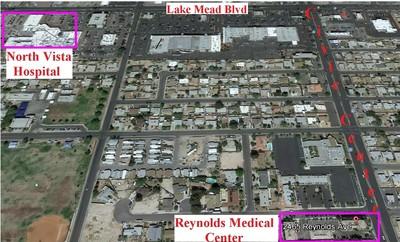
4 001 Close Aerial 29a0659f7f78421d84cd8175ce4d6e1e _ f491f8649b5b97f7c74a4bfd095 Reynolds Close to NLV Hospital Page 4
5 1391bad3e61546c798c e _ Dr Vargas T.I Google Earth Page 5
6 _ _ _ _ Page 6
7 a8d c4407a f8678 Goodle Earth Small _ _ Page 7


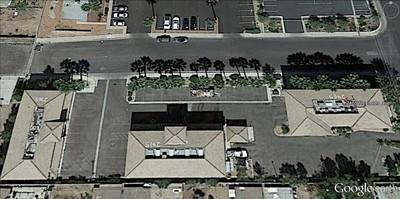
8 Close Up Parking Property Contacts 702Michael Hawkes Great Bridge Properties [M] [O] Page 8 Copyright Catylist. All Rights Reserved. The information presented herein is provided as is, without warranty of any kind. Neither Catylist nor Catylist Real Estate Software, Inc. assume any liability for errors or omissions.

9 Demographics, Labor/Workforce, and Consumer Expenditures 2465 Reynolds Ave, North Las Vegas, NV Disclaimer: While we believe this information (via GeoLytics) to be reliable, we have not checked its accuracy and make no guarantee as to its validity. By using the information provided on this page, the user acknowledges that the data may contain errors or other nonconformities. You and/or your client should diligently and independently verify the specifics of the information that you are using. Population 2020 Projection 58, , , Estimate 45, , , Census 38, , ,943 Growth % 22.47% 18.82% Growth % 16.54% 16.06% Population (Male) 2020 Projection 28, , , Estimate 22, , , Census 20, , ,498 Growth % 21.95% 18.64% Growth % 12.22% 12.48% Page 9 Copyright Catylist. All Rights Reserved. The information presented herein is provided as is, without warranty of any kind. Neither Catylist nor Catylist Real Estate Software, Inc. assume any liability for errors or omissions.
10 Population (Female) 2020 Projection 29, , , Estimate 23, , , Census 18, , ,445 Growth % 23.01% 18.99% Growth % 21.32% 19.84% Population by Age (2015 Estimate) Age 0 to 5 5,401 28,890 62,016 Age 5 to 10 5,245 28,655 62,354 Age 10 to 15 4,496 24,914 54,749 Age 15 to 20 4,001 22,315 49,268 Age 20 to 25 3,703 21,087 46,372 Age 25 to 30 3,451 19,989 44,017 Age 30 to 35 3,198 19,076 42,307 Age 35 to 40 3,069 18,698 42,272 Age 40 to 45 2,896 18,455 42,800 Age 45 to 50 2,756 18,369 43,542 Age 50 to 55 2,260 15,997 39,542 Age 55 to 60 1,781 13,710 34,912 Age 60 to 65 1,323 11,036 29,339 Age 65 and over 2,220 23,804 73,782 Total Population 45, , ,272 Median Age Age 0 to 5 Age 5 to 10 Age 10 to 15 Age 15 to 20 Age 20 to 25 Age 25 to 30 Age 30 to 35 Age 35 to 40 Age 40 to 45 Age 45 to 50 Age 50 to 55 Age 55 to 60 Age 60 to 65 Age 65 and over 12% 10% 9% 11% 10% 9% 10% 9% 8% 9% 8% 7% 8% 7% 7% 8% 7% 7% 7% 7% 6% 7% 7% 6% 6% 6% 6% 6% 6% 7% 5% 6% 6% 4% 5% 5% 3% 4% 4% 5% 8% 11% Median Age (Male) 2010 Census Median Age (Female) 2010 Census High School Graduates Age 25+ by Educational Attainment (2015 Estimate) High School Graduate (or GED) 5,512 43, ,796 Some College, No Degree 3,235 30,075 85,523 Associate or Bachelor's Degree 612 6,222 24,673 Master's Degree 242 2,729 10,801 Professional School Degree 353 2,003 6,016 Doctorate Degree 225 1,505 3,834 Total High School Graduates Age ,179 86, ,643 High School Graduate (or GED) Some College, No Degree Associate or Bachelor's Degree Master's Degree Professional School Degree Doctorate Degree 54% 51% 46% 32% 35% 35% 6% 7% 10% 2% 3% 4% 3% 2% 2% 2% 2% 2% Page 10 Copyright Catylist. All Rights Reserved. The information presented herein is provided as is, without warranty of any kind. Neither Catylist nor Catylist Real Estate Software, Inc. assume any liability for errors or omissions.
11 Households 2020 Projection 14, , , Estimate 11,581 83, , Census 9,789 72, ,001 Growth % 21.4% 17.7% Growth % 14.77% 14.64% Population in Households 2010 Census 38, , ,943 Average Household Size 2020 Projection Estimate Census Growth % -0.03% -0.03% Growth % 1.26% 1.21% Page 11 Copyright Catylist. All Rights Reserved. The information presented herein is provided as is, without warranty of any kind. Neither Catylist nor Catylist Real Estate Software, Inc. assume any liability for errors or omissions.
12 Households by Household Type and Size and Presence of Children (2015 Estimate) Family Households 9,179 57, ,669 Married-couple family 5,701 33,534 89,580 With own 3,891 19,991 47,248 No own 1,810 13,543 42,332 Male Householder: 1,300 7,818 18,567 no wife present With own 673 3,957 9,069 No own 627 3,861 9,498 Female Householder: no husband 2,178 16,291 37,522 present With own 1,372 9,715 21,660 No own 806 6,576 15,862 Nonfamily Households 2,402 25,832 69,846 1 Person households 1,686 19,360 52, Unrelated people 716 6,472 17,590 Total Households 11,581 83, ,515 Family Households Married-couple family With own No own Male Householder: no wife present With own No own Female Householder: no husband present With own No own Nonfamily Households 1 Person households 2+ Unrelated people 79% 69% 68% 49% 40% 42% 34% 24% 22% 16% 16% 20% 11% 9% 9% 6% 5% 4% 5% 5% 4% 19% 20% 17% 12% 12% 10% 7% 8% 7% 21% 31% 32% 15% 23% 24% 6% 8% 8% Page 12 Copyright Catylist. All Rights Reserved. The information presented herein is provided as is, without warranty of any kind. Neither Catylist nor Catylist Real Estate Software, Inc. assume any liability for errors or omissions.
13 Households by Household Income (2015 Estimate) Less than $25,000 3,463 28,479 57,931 $25,000 to $49,999 4,021 26,481 64,792 $50,000 to $74,999 2,355 15,458 44,479 $75,000 to $99,999 1,076 7,227 23,540 $100,000 to $124, ,804 11,286 $125,000 to $149, ,535 5,993 $150,000 to $199, ,021 5,029 $200,000 or more ,465 Total Households 11,581 83, ,515 Average Household Income $46, $45, $54, Median Household Income $39, $39, $48, Less than $25,000 $25,000 to $49,999 $50,000 to $74,999 $75,000 to $99,999 $100,000 to $124,999 $125,000 to $149,999 $150,000 to $199,999 $200,000 or more 30% 34% 27% 35% 32% 30% 20% 19% 21% 9% 9% 11% 2% 3% 5% 2% 2% 3% 1% 1% 2% 1% 1% 1% Households by Household Income (2020 Projection) Less than $25,000 4,423 34,230 68,335 $25,000 to $49,999 5,143 32,269 76,653 $50,000 to $74, $75,000 to $99, $100,000 to $124, ,403 13,113 $125,000 to $149, ,863 6,955 $150,000 to $199, $200,000 or more Total Households 10,135 71, ,056 Average Household Income $46, $45, $54, Median Household Income $41, $40, $49, Less than $25,000 $25,000 to $49,999 $50,000 to $74,999 $75,000 to $99,999 $100,000 to $124,999 $125,000 to $149,999 $150,000 to $199,999 $200,000 or more 44% 48% 41% 51% 45% 46% 0% 0% 0% 0% 0% 0% 3% 5% 8% 3% 3% 4% 0% 0% 0% 0% 0% 0% Per Capita Income 2015 Estimate $11, $13, $17, Unemployment Rate 2015 Estimate 21.74% 18.85% 16.4% Page 13 Copyright Catylist. All Rights Reserved. The information presented herein is provided as is, without warranty of any kind. Neither Catylist nor Catylist Real Estate Software, Inc. assume any liability for errors or omissions.
14 Population Age 16+ By Employment Status (2015 Estimate) Labor Force 17, , ,343 In Armed Forces Civilian, Employed 14, , ,413 Civilian, Unemployed 2,809 16,844 37,930 Not in Labor Force 17, , ,071 Total Population Age , , ,414 Labor Force In Armed Forces Civilian, Employed Civilian, Unemployed Not in Labor Force 49% 51% 55% 0% 0% 0% 41% 44% 48% 8% 7% 7% 51% 49% 45% Page 14 Copyright Catylist. All Rights Reserved. The information presented herein is provided as is, without warranty of any kind. Neither Catylist nor Catylist Real Estate Software, Inc. assume any liability for errors or omissions.
15 Employed Civilian Population Age 16+ by Industry (2015 Estimate) Agriculture, forestry, fishing and hunting, mining and 3,164 16,185 33,051 construction Manufacturing 810 4,397 10,368 Wholesale & retail trade 1,636 15,336 39,366 Transportation and warehousing, and 474 3,680 11,683 utilities Information 129 1,658 4,438 Finance, insurance, real estate and 357 2,126 8,171 rental and leasing Professional, scientific, management, administrative, and 1,934 12,318 29,958 waste management services Professional, scientific, and technical 1,934 12,318 29,958 services Management of companies and enterprises Administrative and support and waste management services Educational, health and social services 1,110 11,002 34,079 Arts, entertainment, recreation, accommodation and 4,955 33,591 88,219 food services Other services (except public 1,331 9,137 21,469 administration) Public Administration 180 2,922 9,520 Total Employed Civilian Population Age , , ,322 Agriculture, forestry, fishing and hunting, mining and construction Manufacturing Wholesale & retail trade Transportation and warehousing, and utilities Information Finance, insurance, real estate and rental and leasing Professional, scientific, management, administrative, and waste management services Professional, scientific, and technical services Management of companies and enterprises Administrative and support and waste management services Educational, health and social services Arts, entertainment, recreation, accommodation and food services Other services (except public administration) Public Administration 20% 14% 11% 5% 4% 4% 10% 14% 14% 3% 3% 4% 1% 1% 2% 2% 2% 3% 12% 11% 10% 12% 11% 10% 0% 0% 0% 0% 0% 0% 7% 10% 12% 31% 30% 30% 8% 8% 7% 1% 3% 3% Page 15 Copyright Catylist. All Rights Reserved. The information presented herein is provided as is, without warranty of any kind. Neither Catylist nor Catylist Real Estate Software, Inc. assume any liability for errors or omissions.
16 Housing Units by Tenure (2015 Estimate) Vacant Housing Units 1,132 15,499 40,462 Occupied Housing Units 11,581 83, ,515 Owner- Occupied 4,989 34, ,154 Renter- Occupied 6,592 48, ,361 Total Housing Units 12,713 98, ,977 Vacant Housing Units Occupied Housing Units Owner- Occupied Renter- Occupied 9% 16% 16% 91% 84% 84% 39% 35% 40% 52% 49% 44% Page 16 Copyright Catylist. All Rights Reserved. The information presented herein is provided as is, without warranty of any kind. Neither Catylist nor Catylist Real Estate Software, Inc. assume any liability for errors or omissions.
2415 Reynolds Ave, North Las Vegas, NV 89030
 7,221' *Reynolds Medical Center* Gray Shell w/ Elevator 89030 2415 Reynolds Ave, North Las Vegas, NV 89030 Listing ID: 29944098 Status: Active Property Type: Office For Sale (also listed as Special Purpose)
2365 Reynolds Ave, North Las Vegas, NV 89030
 10% Down $77 psf 7,072' Medical Office Elevator & Gray Shell 2365 Reynolds Ave, North Las Vegas, NV 89030 Listing ID: 29944110 Status: Active Property Type: Office For Sale Office Type: Business Park,
1320 S Casino Center Blvd, Las Vegas, NV 89104
 Professional or Attorney Office Arts District Casino Center 1320 S Casino Center Blvd, Las Vegas, NV 89104 Listing ID: 30030990 Status: Active Property Type: Office For Sale Office Type: Business Park,
5715 W. Alexander #150, Las Vegas, NV 89130
 10% Down Office Condo 49c PSF Payments 5715 W. Alexander #150, Las Vegas, NV 89130 Listing ID: 30279469 Status: Active Property Type: Office For Sale Office Type: Business Park, Executive Suites Size:
7401 W Charleston Blvd, Las Vegas, NV 89117
 Cool $1,000,000.00 Discount Off Sale Price 7401 W Charleston Blvd, Las Vegas, NV 89117 Listing ID: 30193298 Status: Active Property Type: Office For Sale Office Type: Business Park, Executive Suites Size:
1208 S Eastern Ave, Las Vegas, NV 89104
 Office Medical Veterinarin Signage Frontage Visibility 89104 1208 S Eastern Ave, Las Vegas, NV 89104 Listing ID: 30138546 Status: Active Property Type: Office For Lease Office Type: Governmental, High-Tech
5419 S Decatur Blvd, Las Vegas, NV 89118
 10% Down, Call Center, Office, Showroom, Warehouse, Auto, Flex 5419 S Decatur Blvd, Las Vegas, NV 89118 Listing ID: 29978727 Status: Active Property Type: Industrial For Sale Industrial Type: Flex Space,
2965 S Jones Blvd, Las Vegas, NV 89146
 10% Down Data Center Office Call Center Fiber Optic Cubicles 2965 S Jones Blvd, Las Vegas, NV 89146 Listing ID: 30029430 Status: Active Property Type: Office For Sale Office Type: Business Park, Governmental
5715 W. Alexander #150, Las Vegas, NV 89130
 Brand New Everything! NW Professional Office Condo 5715 W. Alexander #150, Las Vegas, NV 89130 Listing ID: 30279487 Status: Active Property Type: Office For Lease Office Type: Business Park, Executive
5419 S Decatur Blvd, Las Vegas, NV 89118
 Call Center, Office, Showroom, Warehouse, Auto, Flex 5419 S Decatur Blvd, Las Vegas, NV 89118 Listing ID: 29978730 Status: Active Property Type: Office For Lease Office Type: Business Park, Governmental
7401 W Charleston Blvd, Las Vegas, NV 89117
 Cool $1.25 Million Discounted Las Vegas Company HQ Office 7401 W Charleston Blvd, Las Vegas, NV 89117 Listing ID: Status: Property Type: Office Type: Size: Sale Price: Unit Price: Sale Terms: Overview/Comments
Benchmark Avenue, Fort Myers, FL 33905
 Available October 2017 Benchmark Industrial For Lease 1681-1687 Benchmark Avenue, Fort Myers, FL 33905 Listing ID: 30132311 Status: Active Property Type: Industrial For Lease Industrial Type: Flex Space,
3424 East Road, Saginaw, MI 48601
 R & W Investment 3424 East Road, Saginaw, MI 48601 Listing ID: 30298825 Status: Active Property Type: Industrial For Sale Industrial Type: Flex Space, Free-Standing Size: 7,564 SF Sale Price: $230,000
4575 Bay Rd, Saginaw, MI 48603
 Georges 4575 Bay Rd, Saginaw, MI 48603 Listing ID: 30340682 Status: Active Property Type: Business Opportunity For Sale Industry: Professional Services Size: 6,600 SF Sale Price: $852,000 Sale Terms: Cash
2908 E Oakland Ave, Johnson City, TN 37601
 Office/retail Lease 2908 E Oakland Ave, Johnson City, TN 37601 Listing ID: 30369980 Status: Active Property Type: Office For Lease Office Type: Executive Suites, Governmental Contiguous Space: 2,800-7,800
1112 Carroll Creek Rd, Johnson City, TN 37601
 Deanwood Apartments for Sale 1112 Carroll Creek Rd, Johnson City, TN 37601 Listing ID: 30363543 Status: Active Property Type: Multi-Family For Sale Multi-Family Type: Low-Rise/Garden Size: 23,432 SF Sale
11701 Orpington St, Orlando, FL 32817
 Professional Space for Lease 11701 Orpington St, Orlando, FL 32817 Listing ID: 30295554 Status: Active Property Type: Office For Lease Office Type: Business Park, Governmental Contiguous Space: 1,250 SF
3280 E Tropicana Ave, Las Vegas, NV 89121
 65c Rent NNN Various Size Retail Shop Office Store Medical 3280 E Tropicana Ave, Las Vegas, NV 89121 Listing ID: 29848683 Status: Active Property Type: Retail-Commercial For Lease (also listed as Office,
 12519 S Cleveland Ave Details Prepared on Prepared By Josh Burdine 239-362-3173 josh@rockstar-realestate.com Page 1 14,000 sq feet building on 41 in Fort Myers 12519 S Cleveland Ave, Fort Myers, FL 33907
E. Flamingo Rd, Las Vegas, NV 89121
 School Restaurant Retail Office Convenience 89c to $1.25 3620 3650 3654 E. Flamingo Rd, Las Vegas, NV 89121 Listing ID: 30284747 Status: Active Property Type: Retail-Commercial For Lease Retail-Commercial
14114 Palm Beach Blvd, Fort Myers, FL 33905
 Palm Beach Boulevard Land 14114 Palm Beach Blvd, Fort Myers, FL 33905 Listing ID: 30318883 Status: Active Property Type: Vacant Land For Sale Possible Uses: Office, Retail Gross Land Area: 18,000 SF Sale
Contact: Larry Hausman (502) Outer Loop, Louisville, KY Knobview Shopping Center
 Outer Loop, Louisville, KY Knobview Shopping Center") 5603-5637 Outer Loop, Louisville, KY 40219 Knobview Shopping Center Jefferson Mall Academy Sports Center SUBJECT Knobview Shopping Center offers a diverse mix of local and national tenants. The center
5603-5637 Outer Loop, Louisville, KY 40219 Knobview Shopping Center Jefferson Mall Academy Sports Center SUBJECT Knobview Shopping Center offers a diverse mix of local and national tenants. The center
46 Acres - Fronting Interstate 81 & Hopewell Rd. Prime Location - Zoned Industrial Potential for 2 Building Complexes
 46 Acre Land Opportunity - I-81 Frontage Design Concept: 2 Potential Building Parcels Prepared on 46 Acres - Fronting Interstate 81 & Hopewell Rd. Prime Location - Zoned Industrial Potential for 2 Building
E. Flamingo Rd, Las Vegas, NV 89121
 Restaurant Supper Club Retail Office Convenience 89c to $1.25 3620 3650 3654 E. Flamingo Rd, Las Vegas, NV 89121 Listing ID: 30214834 Status: Active Property Type: Retail-Commercial For Lease Retail-Commercial
5200 Ocean Blvd, Siesta Key, FL 34242
 Siesta Key Restaurant- BEST LOCATION IN THE VILLAGE! 5200 Ocean Blvd, Siesta Key, FL 34242 Listing ID: 29826583 Status: Active Property Type: Business Opportunity For Sale Industry: Food and Beverage Size:
SELECTED ECONOMIC CHARACTERISTICS American Community Survey 5-Year Estimates
 DP03 SELECTED ECONOMIC CHARACTERISTICS 2008-2012 American Community Survey 5-Year Estimates Supporting documentation on code lists, subject definitions, data accuracy, and statistical testing can be found
SOUTH DAKOTA KIDS COUNT BEACOM SCHOOL OF BUSINESS UNIVERSITY OF SOUTH DAKOTA 414 E. CLARK STREET VERMILLION, SD
 Brookings County Compared to o SDSD Undergrad Enrollment approximately 11,225 o USD Undergrad Enrollment approximately 7,600 o Brookings County 1 year population estimate for 2013 is 32,968 o 1 year population
American Community Survey 5-Year Estimates
 DP03 SELECTED ECONOMIC CHARACTERISTICS 2013-2017 American Community Survey 5-Year Estimates Supporting documentation on code lists, subject definitions, data accuracy, and statistical testing can be found
Tell us what you think. Provide feedback to help make American Community Survey data more useful for you.
 DP03 SELECTED ECONOMIC CHARACTERISTICS 2016 American Community Survey 1-Year Estimates Supporting documentation on code lists, subject definitions, data accuracy, and statistical testing can be found on
American Community Survey 5-Year Estimates
 DP03 SELECTED ECONOMIC CHARACTERISTICS 2012-2016 American Community Survey 5-Year Estimates Supporting documentation on code lists, subject definitions, data accuracy, and statistical testing can be found
American Community Survey 5-Year Estimates
 DP03 SELECTED ECONOMIC CHARACTERISTICS 2012-2016 American Community Survey 5-Year Estimates Supporting documentation on code lists, subject definitions, data accuracy, and statistical testing can be found
American Community Survey 5-Year Estimates
 DP03 SELECTED ECONOMIC CHARACTERISTICS 2012-2016 American Community Survey 5-Year Estimates Supporting documentation on code lists, subject definitions, data accuracy, and statistical testing can be found
American Community Survey 5-Year Estimates
 DP03 SELECTED ECONOMIC CHARACTERISTICS 2012-2016 American Community Survey 5-Year Estimates Supporting documentation on code lists, subject definitions, data accuracy, and statistical testing can be found
American Community Survey 5-Year Estimates
 DP03 SELECTED ECONOMIC CHARACTERISTICS 2012-2016 American Community Survey 5-Year Estimates Supporting documentation on code lists, subject definitions, data accuracy, and statistical testing can be found
American Community Survey 5-Year Estimates
 DP03 SELECTED ECONOMIC CHARACTERISTICS 2012-2016 American Community Survey 5-Year Estimates Supporting documentation on code lists, subject definitions, data accuracy, and statistical testing can be found
American Community Survey 5-Year Estimates
 DP03 SELECTED ECONOMIC CHARACTERISTICS 2012-2016 American Community Survey 5-Year Estimates Supporting documentation on code lists, subject definitions, data accuracy, and statistical testing can be found
American Community Survey 5-Year Estimates
 DP03 SELECTED ECONOMIC CHARACTERISTICS 2012-2016 American Community Survey 5-Year Estimates Supporting documentation on code lists, subject definitions, data accuracy, and statistical testing can be found
American Community Survey 5-Year Estimates
 DP03 SELECTED ECONOMIC CHARACTERISTICS 2012-2016 American Community Survey 5-Year Estimates Supporting documentation on code lists, subject definitions, data accuracy, and statistical testing can be found
American Community Survey 5-Year Estimates
 DP03 SELECTED ECONOMIC CHARACTERISTICS 2012-2016 American Community Survey 5-Year Estimates Supporting documentation on code lists, subject definitions, data accuracy, and statistical testing can be found
American Community Survey 5-Year Estimates
 DP03 SELECTED ECONOMIC CHARACTERISTICS 2012-2016 American Community Survey 5-Year Estimates Supporting documentation on code lists, subject definitions, data accuracy, and statistical testing can be found
American Community Survey 5-Year Estimates
 DP03 SELECTED ECONOMIC CHARACTERISTICS 2012-2016 American Community Survey 5-Year Estimates Supporting documentation on code lists, subject definitions, data accuracy, and statistical testing can be found
American Community Survey 5-Year Estimates
 DP03 SELECTED ECONOMIC CHARACTERISTICS 2012-2016 American Community Survey 5-Year Estimates Supporting documentation on code lists, subject definitions, data accuracy, and statistical testing can be found
American Community Survey 5-Year Estimates
 DP03 SELECTED ECONOMIC CHARACTERISTICS 2012-2016 American Community Survey 5-Year Estimates Supporting documentation on code lists, subject definitions, data accuracy, and statistical testing can be found
American Community Survey 5-Year Estimates
 DP03 SELECTED ECONOMIC CHARACTERISTICS 2012-2016 American Community Survey 5-Year Estimates Supporting documentation on code lists, subject definitions, data accuracy, and statistical testing can be found
American Community Survey 5-Year Estimates
 DP03 SELECTED ECONOMIC CHARACTERISTICS 2012-2016 American Community Survey 5-Year Estimates Supporting documentation on code lists, subject definitions, data accuracy, and statistical testing can be found
American Community Survey 5-Year Estimates
 DP03 SELECTED ECONOMIC CHARACTERISTICS 2012-2016 American Community Survey 5-Year Estimates Supporting documentation on code lists, subject definitions, data accuracy, and statistical testing can be found
American Community Survey 5-Year Estimates
 DP03 SELECTED ECONOMIC CHARACTERISTICS 2012-2016 American Community Survey 5-Year Estimates Supporting documentation on code lists, subject definitions, data accuracy, and statistical testing can be found
American Community Survey 5-Year Estimates
 DP03 SELECTED ECONOMIC CHARACTERISTICS 2012-2016 American Community Survey 5-Year Estimates Supporting documentation on code lists, subject definitions, data accuracy, and statistical testing can be found
American Community Survey 5-Year Estimates
 DP03 SELECTED ECONOMIC CHARACTERISTICS 2012-2016 American Community Survey 5-Year Estimates Supporting documentation on code lists, subject definitions, data accuracy, and statistical testing can be found
American Community Survey 5-Year Estimates
 DP03 SELECTED ECONOMIC CHARACTERISTICS 2012-2016 American Community Survey 5-Year Estimates Supporting documentation on code lists, subject definitions, data accuracy, and statistical testing can be found
American Community Survey 5-Year Estimates
 DP03 SELECTED ECONOMIC CHARACTERISTICS 2012-2016 American Community Survey 5-Year Estimates Supporting documentation on code lists, subject definitions, data accuracy, and statistical testing can be found
American Community Survey 5-Year Estimates
 DP03 SELECTED ECONOMIC CHARACTERISTICS 2012-2016 American Community Survey 5-Year Estimates Supporting documentation on code lists, subject definitions, data accuracy, and statistical testing can be found
American Community Survey 5-Year Estimates
 DP03 SELECTED ECONOMIC CHARACTERISTICS 2012-2016 American Community Survey 5-Year Estimates Supporting documentation on code lists, subject definitions, data accuracy, and statistical testing can be found
American Community Survey 5-Year Estimates
 DP03 SELECTED ECONOMIC CHARACTERISTICS 2012-2016 American Community Survey 5-Year Estimates Supporting documentation on code lists, subject definitions, data accuracy, and statistical testing can be found
American Community Survey 5-Year Estimates
 DP03 SELECTED ECONOMIC CHARACTERISTICS 2012-2016 American Community Survey 5-Year Estimates Supporting documentation on code lists, subject definitions, data accuracy, and statistical testing can be found
Mid - City Industrial
 Minneapolis neighborhood profile October 2011 Mid - City Industrial About this area The Mid-City Industrial neighborhood is bordered by I- 35W, Highway 280, East Hennepin Avenue, and Winter Street Northeast.
Shingle Creek. Minneapolis neighborhood profile. About this area. Trends in the area. Neighborhood in Minneapolis. October 2011
 neighborhood profile October 2011 About this area The neighborhood is bordered by 53rd Avenue North, Humboldt Avenue North, 49th Avenue North, and Xerxes Avenue North. It is home to Olson Middle School.
SEVEN HILLS MEDICAL & BUSINESS PARK
 PROPERTY HIGHLIGHTS: Turnkey medical and professional suites available Unit sizes range from ±1,808 - ±8,130 SF Lease rate: $1.29 - $1.50 SF/M NNN CAM s: $0.40 SF/M Zoning: C-O (Office Commercial) Parcel
University of Minnesota
 neighborhood profile October 2011 About this area The University neighborhood is bordered by 11th Avenue Southeast, University Avenue, 15th Avenue Southeast, the railroad tracks, Oak Street, and the Mississippi
W Republic Rd, Springfield, MO 65807
 Republic Plaza, All Available Suites 2141-2155 W Republic Rd, Springfield, MO 65807 Listing ID: 29778068 Status: Active Property Type: Shopping Center For Lease (also listed as Retail-Commercial, Office)
Camden Industrial. Minneapolis neighborhood profile. About this area. Trends in the area. Neighborhood in Minneapolis.
 Minneapolis neighborhood profile October 2011 Camden Industrial About this area The Camden Industrial neighborhood is bordered by 48th Avenue North, the Mississippi River, Dowling Avenue North, Washington
Daniel Jung CRENSHAW BLVD CRENSHAW BLVD INGLEWOOD CA, CA Priming Capital 6 Centerpointe Dr La Palma, CA
 11225 CRENSHAW BLVD 11225 CRENSHAW BLVD INGLEWOOD CA, CA 90303 Property Type Retail Building Size Owner (Legal) Property Subtype Auto Dealer Office SF Owner (True) Zoning Industrial SF County Los Angeles
$1,600,000. Boston Reid LAKESIDE BUSINESS PARK. 117 Crosslake Park Drive Mooresville, NC SITE FEATURES. Lead 2 Real Estate Group
 LAKESIDE BUSINESS PARK 117 Crosslake Park Drive Mooresville, NC 28117 $1,600,000 Marketed By SITE FEATURES 17,000 + SF Industrial Building on 2.6 Acres Located in Lakeside Business Park High Power for
Procter Properties P.O. Box 3484 Greensboro, NC
 Procter Properties P.O. Box 3484 Greensboro, NC 27402 3208 West Gate City Boulevard 3208 W Gate City Blv Greensboro, NC 27407 Property Type Retail Building Size 11,747 SF Owner (Legal) Property Subtype
LAND FOR SALE Blair Road, Mint Hill, NC PROPERTY OVERVIEW. Large parcel with I-485 access via Blair Road exit in the path of. growth.
 LAND FOR SALE 10395 Blair Road, Mint Hill, NC 28227 OFFERING SUMMARY SALE PRICE: $1,000,000 PROPERTY OVERVIEW Large parcel with I485 access via Blair Road exit in the path of growth. LOT SIZE: 9.28 Acres
TABLE 1. PROFILE OF GENERAL DEMOGRAPHIC CHARACTERISTICS
 Waterloo city, Iowa TABLE 1. PROFILE OF GENERAL DEMOGRAPHIC CHARACTERISTICS Estimate Lower Bound Upper Bound Total population 66,659 64,093 69,225 SEX AND AGE Male 32,096 30,415 33,777 Female 34,563 33,025
Town Profiles: Demographic, Economic, and Housing Statistics for De Smet City and Wall Town, SOuth Dakota
 South Dakota State University Open PRAIRIE: Open Public Research Access Institutional Repository and Information Exchange Census Data Center News Releases SDSU Census Data Center 12-7-2017 Town Profiles:
Average persons in household. Top three industries Post-secondary education (25 64 years) 7.1% Unemployment rate
 7.1% Unemployment rate") Demographic snapshot The Town of Oakville City of Burl ington City of Mis sissauga Town of Milton Population 198,042 Median age Average persons in household 41 2.8 years old $149,945 Average household
Demographic snapshot The Town of Oakville City of Burl ington City of Mis sissauga Town of Milton Population 198,042 Median age Average persons in household 41 2.8 years old $149,945 Average household
For Lease. Free-standing Retail / Office Building 1304 Saratoga Avenue San Jose, CA
 For Lease Free-standing Retail / Office Building 1304 Saratoga Avenue San Jose, CA 95117 Description Approximately 4,500 sf plus mezzanine Outstanding identity and visibility In neighborhood shopping center
EVEREST. Retail Investment Opportunity. Ivy Hills Retail Center 7397 Main Street Newtown, OH CONTACT: Chris Nachtrab.
 Retail Investment Opportunity CONTACT: Chris Nachtrab chris.nachtrab@everestrealestate.com 513/769-2509 John Thompson john.thompson@everestrealestate.com 513/769-2514 Ivy Hills Retail Center 7397 Main
Economic Overview City of Tyler, TX. January 8, 2018
 Economic Overview City of Tyler, TX January 8, 2018 DEMOGRAPHIC PROFILE...3 EMPLOYMENT TRENDS...5 WAGE TRENDS...5 COST OF LIVING INDEX...6 INDUSTRY SNAPSHOT...7 OCCUPATION SNAPSHOT...9 INDUSTRY CLUSTERS...
City of Edmonton Population Change by Age,
 Population Change by Age, 1996-2001 2001 Edmonton Demographic Profile The City of Edmonton s 2001population increased by 49,800 since the 1996 census. Migration figures are not available at the municipal
Economic Overview York County, South Carolina. February 14, 2018
 Economic Overview York County, February 14, 2018 DEMOGRAPHIC PROFILE... 3 EMPLOYMENT TRENDS... 5 UNEMPLOYMENT RATE... 5 WAGE TRENDS... 6 COST OF LIVING INDEX... 6 INDUSTRY SNAPSHOT... 7 OCCUPATION SNAPSHOT...
PROPERTY FOR SALE 500 Sunrise Highway. Patchogue, NY BUILDING FEATURES. Building Size. Warehouse Ceiling Height 20. Sale Price $6,000,000.
 PROPERTY FOR SALE 500 Sunrise Highway Patchogue, NY INDUSTRIAL BUILDING FOR SALE PROPERTY HIGHLIGHTS Excellent visibility from Sunrise Highway Sprinklers Traffic count of 50,000 cars per day on Sunrise
ECONOMIC OVERVIEW DuPage County, Illinois
 ECONOMIC OVERVIEW DuPage County, Illinois DEMOGRAPHIC PROFILE... 3 EMPLOYMENT TRENDS... 5 UNEMPLOYMENT RATE... 5 WAGE TRENDS... 6 COST OF LIVING INDEX... 7 INDUSTRY SNAPSHOT... 8 OCCUPATION SNAPSHOT...
Economic Overview. Lawrence, KS MSA
 Economic Overview Lawrence, KS MSA March 5, 2019 DEMOGRAPHIC PROFILE... 3 EMPLOYMENT TRENDS... 5 UNEMPLOYMENT RATE... 5 WAGE TRENDS... 6 COST OF LIVING INDEX... 7 INDUSTRY SNAPSHOT... 8 OCCUPATION SNAPSHOT...
CRESCENT PLACE CONDO FOR LEASE
 For More Information CRESCENT PLACE CONDO Retail Property $28.00 SF/yr (NNN) September 23, 2018 EXECUTIVE SUMMARY Executive Summary LEASE RATE $28.00 SF/YR OFFERING SUMMARY Available SF: 840 SF Lease Rate:
Economic Overview 45-Minute Commute From Airport Park. June 6, 2017
 Economic Overview 45-Minute Commute From Airport Park June 6, 2017 DEMOGRAPHIC PROFILE... 3 EMPLOYMENT TRENDS... 5 WAGE TRENDS... 5 COST OF LIVING INDEX... 6 INDUSTRY SNAPSHOT... 7 OCCUPATION SNAPSHOT...
Urban Action Agenda Community Profiles COVER TO GO HERE. City of Beacon
 Urban Action Agenda Community Profiles COVER TO GO HERE City of Beacon COMMUNITY OVERVIEW MAP POPULATION & DEMOGRAPHICS Population Basics 2,212 Population (2015) Population Change 2. since 2000 0.5 Square
Economic Overview Monterey County, California. July 22, 2016
 Economic Overview Monterey July 22, 2016 DEMOGRAPHIC PROFILE... 3 EMPLOYMENT TRENDS... 5 UNEMPLOYMENT RATE... 5 WAGE TRENDS... 6 COST OF LIVING INDEX... 6 INDUSTRY SNAPSHOT... 7 OCCUPATION SNAPSHOT...
Economic Overview Loudoun County, Virginia. October 23, 2017
 Economic Overview October 23, 2017 DEMOGRAPHIC PROFILE... 3 EMPLOYMENT TRENDS... 5 UNEMPLOYMENT RATE... 5 WAGE TRENDS... 6 COST OF LIVING INDEX... 6 INDUSTRY SNAPSHOT... 7 OCCUPATION SNAPSHOT... 9 INDUSTRY
Roseville Towne Center Gratiot Avenue Roseville, MI 48066
 Retail Space Available 65,000 SF Second Level Space and Outparcel Florence Street Massachusetts Street Gratiot Avenue E. 12 Mile Road Property Highlights is shadow-anchored by Walmart and includes national
Monte Vista Population, ,744 4,651 4,564 4,467 4,458 4,432 4,451
 1 Monte Vista 4,8 4,7 4,6 4,5 4,4 4,3 4,2 4,1 4,61 4,612 4,61 4,676 Monte Vista, 2-213 4,744 4,651 4,564 4,467 4,458 4,432 4,451 4,418 4,412 4,355 2 21 22 23 24 25 26 27 28 29 21 211 212 213 Year Monte
DEMOGRAPHIC PROFILE...3 EMPLOYMENT TRENDS...5 UNEMPLOYMENT RATE...5 WAGE TRENDS...6 COST OF LIVING INDEX...6 INDUSTRY SNAPSHOT...7
 March 14, 2017 DEMOGRAPHIC PROFILE...3 EMPLOYMENT TRENDS...5 UNEMPLOYMENT RATE...5 WAGE TRENDS...6 COST OF LIVING INDEX...6 INDUSTRY SNAPSHOT...7 OCCUPATION SNAPSHOT...9 INDUSTRY CLUSTERS... 12 EDUCATION
Economic Overview Long Island
 Report created on August 29, 2017 Economic Overview Long Island Contact: Lisa.Montiel@suny.edu DEMOGRAPHIC PROFILE... 3 EMPLOYMENT TRENDS... 5 UNEMPLOYMENT RATE... 5 WAGE TRENDS... 6 COST OF LIVING INDEX...
Durango. Medical Building ±15,163 SF $3,639,000 UNIQUE OPPORTUNITY SINGLE-STORY MEDICAL BUILDING FOR SALE VIRTUAL TOUR
 FOR SALE 3012 S. Drive, Las Vegas, NV 89117 DO NOT DISTURB BUSINESS OPERATOR. CALL FOR DETAILS OR TO SCHEDULE A TOUR WITH BROKER. UNIQUE OPPORTUNITY SINGLE-STORY MEDICAL BUILDING ±15,163 SF $3,639,000
TEMPE CROSSING II - RETAIL PAD
 Excellent infill pad opportunity in dynamic retail corridor, 1 mi. East of I-10 Fully finished pad. Over $250,000 worth of site work already completed. Buildable up to 8,500 square feet. Excellent parking!
Economic Overview Western New York
 Report created on August 29, 2017 Economic Overview Western New Contact: Lisa.Montiel@suny.edu DEMOGRAPHIC PROFILE... 3 EMPLOYMENT TRENDS... 5 UNEMPLOYMENT RATE... 5 WAGE TRENDS... 6 COST OF LIVING INDEX...
October 28, Economic Overview Yellowstone County, Montana
 October 28, 2016 Economic Overview Yellowstone DEMOGRAPHIC PROFILE...3 EMPLOYMENT TRENDS...5 UNEMPLOYMENT RATE...5 WAGE TRENDS...6 COST OF LIVING INDEX...6 INDUSTRY SNAPSHOT...7 OCCUPATION SNAPSHOT...9
Economic Overview Fairfax / Falls Church. October 23, 2017
 Economic Overview Fairfax / Falls Church October 23, 2017 DEMOGRAPHIC PROFILE... 3 EMPLOYMENT TRENDS... 5 UNEMPLOYMENT RATE... 5 WAGE TRENDS... 6 COST OF LIVING INDEX... 6 INDUSTRY SNAPSHOT... 7 OCCUPATION
Wisconsin Economic Development Corporation
 Wisconsin Economic Development Corporation 201 W. Washington Ave. Madison, Wisconsin 53707 608.267.4417 Analyst Report Economic Modeling Specialists, Inc. www.economicmodeling.com 1 Region Info Region:
The Blair Center US Highway 98 North, Lakeland, Fl Jack Strollo, CCIM, CPM
 , LARGE PYLON SIGN CLOSE TO I-4 MULTI TENANT FIVE UNITS EXCELLENT FOR OWNER/OCCUPANT 41,500 VPD Vice President, Broker jstrollo@resbroadway.com BK698301 100 S Kentucky Ave, Suite 290 Lakeland, FL 33801
The Economic Base of San Miguel County, NM. PREPARED BY: The Office of Policy Analysis at Arrowhead Center, New Mexico State University
 The Economic Base of San Miguel County, NM PREPARED BY: The Office of Policy Analysis at Arrowhead Center, New Mexico State University DATE: July 2015 The Economic Base of San Miguel County, New Mexico
PROPOSED SHOPPING CENTER
 PROPOSED SHOPPING CENTER Southeast Corner I-95 & Highway 192 Melbourne, Florida In a 5 Mile Radius 80,862 Population 32,408 Households $61K Avg HH Income SOONER INVESTMENT Commercial & Investment Real
Economic Overview Prince William/Manassas. October 23, 2017
 Economic Overview Prince William/Manassas October 23, 2017 DEMOGRAPHIC PROFILE... 3 EMPLOYMENT TRENDS... 5 UNEMPLOYMENT RATE... 5 WAGE TRENDS... 6 COST OF LIVING INDEX... 6 INDUSTRY SNAPSHOT... 7 OCCUPATION
Economic Overview Capital District
 August 29, 2017 Economic Overview Capital District Contact: Lisa.Montiel@suny.edu DEMOGRAPHIC PROFILE... 3 EMPLOYMENT TRENDS... 5 UNEMPLOYMENT RATE... 5 WAGE TRENDS... 6 COST OF LIVING INDEX... 6 INDUSTRY
The Trails. 1,500 sf Space Available. In a 3 Mile Radius 69,985 Population 25,450 Households $78,216 Avg HH Inc. 1,500 sf Corner Space
 1,500 sf Space Available The Trails Edmond Rd (2nd St) & Santa Fe Ave ~ Edmond, Oklahoma Current Tenancy: Edmond YMCA Spinal Wellness Clinic Lemongrass Thai Cuisine Kumon Learning Center Katie s Family
Economic Overview Mohawk Valley
 Report created on August 29, 2017 Economic Overview Mohawk Valley Contact: Lisa.Montiel@suny.edu DEMOGRAPHIC PROFILE... 3 EMPLOYMENT TRENDS... 5 UNEMPLOYMENT RATE... 5 WAGE TRENDS... 6 COST OF LIVING INDEX...
Economic Overview New York
 Report created on October 20, 2015 Economic Overview Created using: Contact: Lisa.Montiel@suny.edu DEMOGRAPHIC PROFILE...3 EMPLOYMENT TRENDS...5 UNEMPLOYMENT RATE...5 WAGE TRENDS...6 COST OF LIVING INDEX...6
ACS DEMOGRAPHIC AND HOUSING ESTIMATES American Community Survey 1-Year Estimates
 DP05 ACS DEMOGRAPHIC AND HOUSING ESTIMATES 2010 American Community Survey 1-Year s Supporting documentation on code lists, subject definitions, data accuracy, and statistical testing can be found on the