USING THE STOCHASTIC OSCILLATOR 12th February 2015
|
|
|
- Judith Willis
- 6 years ago
- Views:
Transcription

1 TAFX USING THE STOCHASTIC OSCILLATOR 12th February 2015
2 Disclaimer is in no way affiliated or representative of any other company, organisation, club or society, and the views presented are solely our own opinions. The author(s) is not a licensed investment advisor. Our services are educational tools designed to assist you in your personal judgment. It is not designed to replace your licensed financial consultant, and nothing in the content shall be construed to be an offer or solicitation for the purchase or sale of a security. All content on our website and related services is for informational purposes only, and opinions have been made on a general basis. No consideration has been given to any particular individual or specific investment objectives, financial situations or other circumstances. As such, the content should not be relied upon as authoritative without further being subject to the recipient s own independent verification and exercise of judgment. The fact that the content has been made available constitutes neither a recommendation to enter into a particular transaction nor a representation that any product described within is suitable or appropriate for the reader. Readers should be aware that many of the products which may be described within involve significant risks and may not be suitable for all investors, and that any decision to enter into transactions involving such products should not be made unless all such risks are understood and an independent determination has been made that such transactions would be appropriate.
3 Agenda Introduction to Technical Indicators Introduction to the Stochastic Oscillator Using the Oscillator Limitations
4 Agenda Introduction to Technical Indicators Introduction to the Stochastic Oscillator Using the Oscillator Limitations
5 Introduction to Indicators What are they? Statistics used to: Forecast stock trends and price patterns Who uses them? Short-term traders Technical Indicators Long-term investors Entry/Exit Why use them? To provide confirmation for entry and exit points
6 Agenda Introduction to Technical Indicators Introduction to the Stochastic Oscillator Using the Stochastic Oscillator Limitations
7 Introduction to the Stochastic Oscillator What is it? Oscillator which follows momentum Momentum: Rate of rise/fall in prices When to use it? Best used in a market: Trending sideways With high volatility Why use it? It is a sensitive oscillator
8 Introduction to the Stochastic Oscillator Stochastic Oscillator Consists of: %K Line Shows you the location of the close price in a specified time period %D Line Moving average of %K within a time period (John Murphy)
9 Agenda Introduction to Technical Indicators Introduction to the Stochastic Oscillator Using the Oscillator Limitations
10 Using the Stochastic Oscillator Three ways to utilize the oscillator Make use of overbought/oversold region Look out for crossovers between %K and %D lines Make use of divergences Signals which satisfy all three conditions are the strongest
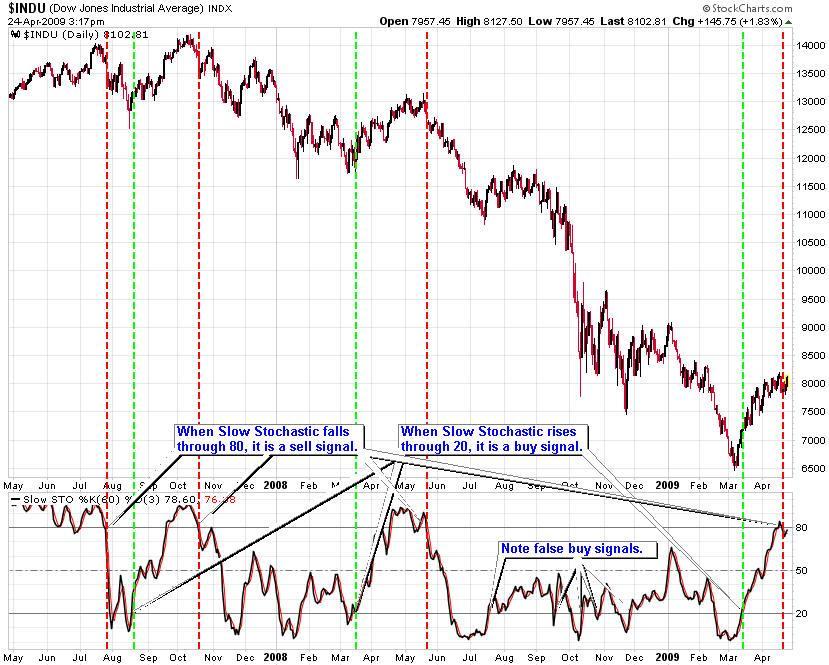
11 Using the Stochastic Oscillator Using Overbought and Oversold Regions
12 Using the Stochastic Oscillator Using the Overbought and Oversold Region Green area above 80 is considered Overbought Red area below 20 is considered Oversold

13 Using the Stochastic Oscillator Using the Overbought and Oversold Region Green area above 80 is considered Overbought High probability of price Red area below 20 is considered Oversold High probability of price
14
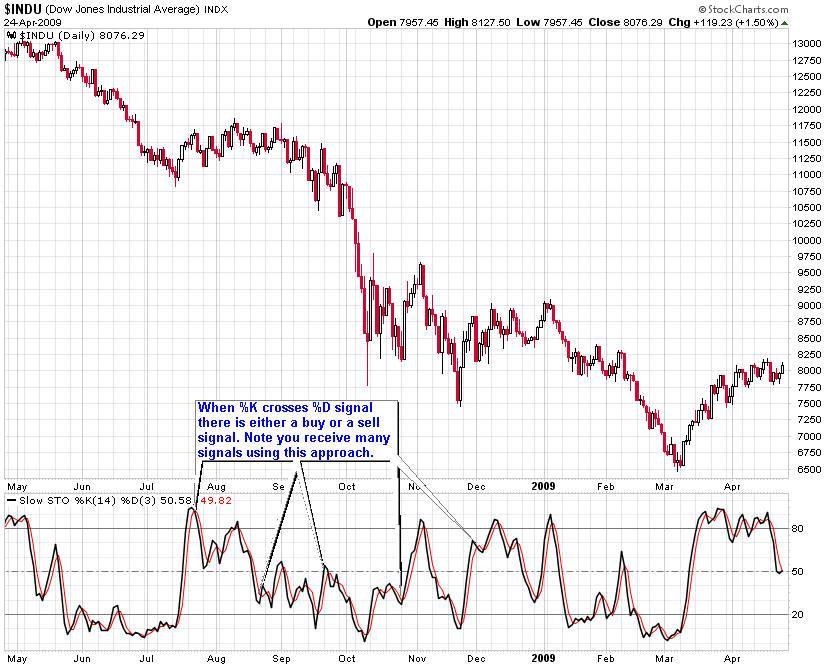
15 Using the Stochastic Oscillator Using Crossovers
16 Using the Stochastic Oscillator Using Crossovers between the %K and %D Lines 1. Identify crossover: A crossover is when: %K line crosses the %D line If the %K moves ABOVE the %D line, it s a BUY signal If %K moves BELOW the %D line, it s a SELL signal

17 Using the Stochastic Oscillator Using Crossovers between the %K and %D Lines 2. Take note if crossover is near/close to Overbought or Oversold region Crossovers near the Overbought and Oversold regions are strong signals
18
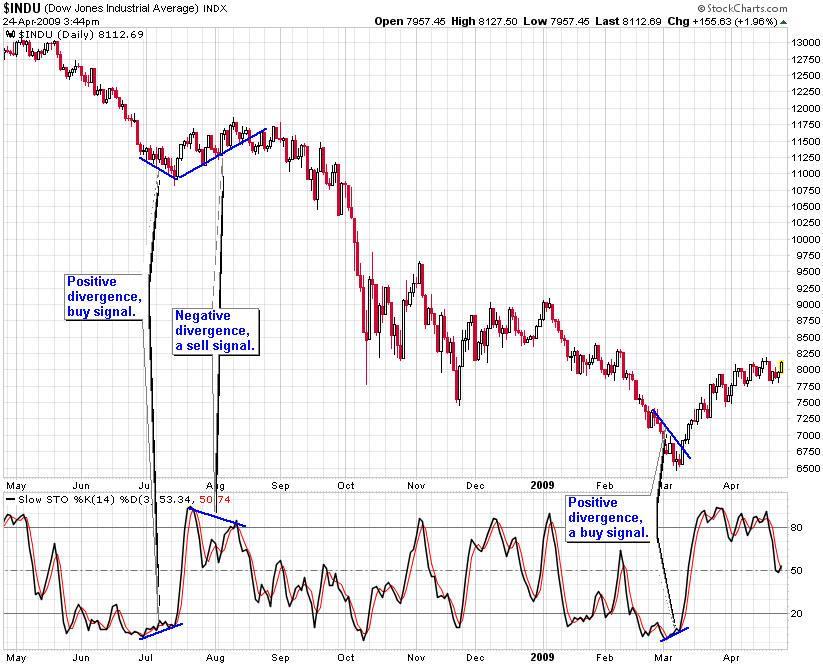
19 Using the Stochastic Oscillator Using Divergences
20 Using the Stochastic Oscillator Using Divergences What is a Divergence? When Price moves in a direction opposite of the Stochastic Oscillator
21
22 Agenda Introduction to Technical Indicators Introduction to the Stochastic Oscillator Using the Oscillator Limitations
23 Limitations False Signals Do not use the Stochastic Oscillator alone Instead, combine with other methods of analysis
24 Additional Information Stochastic Oscillator Strategies: Stochastic Pop and Drop StockCharts.com» ChartSchool» Trading Strategies and Models» Stochastic Pop and Drop In depth information on Stochastic Oscillator: Go to Stockcharts.com» ChartSchool» Technical Indicators and Overlays» Stochastic Oscillator
TRIPLE SCREEN TRADING AND BLOOMBERG INTRODUCTION
 TAFX TRIPLE SCREEN TRADING AND BLOOMBERG INTRODUCTION Disclaimer is in no way affiliated or representative of any other company, organisation, club or society, and the views presented are solely our own
Technical Analysis Workshop Series. Session Ten Semester 2 Week 4 Oscillators Part 1
 Technical Analysis Workshop Series Session Ten Semester 2 Week 4 Oscillators Part 1 DISCLOSURES & DISCLAIMERS This research material has been prepared by NUS Invest. NUS Invest specifically prohibits the
Introduction. Leading and Lagging Indicators
 1/12/2013 Introduction to Technical Indicators By Stephen, Research Analyst NUS Students Investment Society NATIONAL UNIVERSITY OF SINGAPORE Introduction Technical analysis comprises two main categories:
Technical Analysis Workshop Series. Session 11 Semester 2 Week 5 Oscillators Part 2
 Technical Analysis Workshop Series Session 11 Semester 2 Week 5 Oscillators Part 2 DISCLOSURES & DISCLAIMERS This research material has been prepared by NUS Invest. NUS Invest specifically prohibits the
Understanding Oscillators & Indicators March 4, Clarify, Simplify & Multiply
 Understanding Oscillators & Indicators March 4, 2015 Clarify, Simplify & Multiply Disclaimer U.S. Government Required Disclaimer Commodity Futures Trading Commission Futures and Options trading has large
Using Oscillators & Indicators Properly May 7, Clarify, Simplify & Multiply
 Using Oscillators & Indicators Properly May 7, 2016 Clarify, Simplify & Multiply Disclaimer U.S. Government Required Disclaimer Commodity Futures Trading Commission Futures and Options trading has large
Technical Analysis. Dealing Room Peter Leonidou. Peter Leonidou
 Technical Analysis Dealing Room Questions Traders Should Ask What is the trend? What is the pivot point? What is the support levels? What is the resistance levels? Strong or weaker USD? What 1. Trade
Technical Analysis Workshop Series. Session Eight Commodity Channel Index
 Technical Analysis Workshop Series Session Eight DISCLOSURES & DISCLAIMERS This research material has been prepared by NUS Invest. NUS Invest specifically prohibits the redistribution of this material
Chapter 2.3. Technical Analysis: Technical Indicators
 Chapter 2.3 Technical Analysis: Technical Indicators 0 TECHNICAL ANALYSIS: TECHNICAL INDICATORS Charts always have a story to tell. However, from time to time those charts may be speaking a language you
Stock Market Basics Series
 Stock Market Basics Series HOW DO I TRADE STOCKS.COM Copyright 2012 Stock Market Basics Series THE STOCHASTIC OSCILLATOR A Little Background The Stochastic Oscillator was developed by the late George Lane
MAGIC FOREX DIVERGENCE Trading Guide
 Tim Trush & Julie Lavrin Introducing MAGIC FOREX DIVERGENCE Trading Guide Your guide to financial freedom. Tim Trush, Julie Lavrin, T&J Profit Club, 2017, All rights reserved www.forexmystery.com Table
Go No Go Indicators: Part 2
 Go No Go Indicators: Part 2 March 22, 2017 Dennis W. Wilborn Active Trend Trading Disclaimer U.S. Government Required Disclaimer Commodity Futures Trading Commission Futures and Options trading has large
Chapter 2.3. Technical Indicators
 1 Chapter 2.3 Technical Indicators 0 TECHNICAL ANALYSIS: TECHNICAL INDICATORS Charts always have a story to tell. However, sometimes those charts may be speaking a language you do not understand and you
TD AMERITRADE Technical Analysis Night School Week 2
 TD AMERITRADE Technical Analysis Night School Week 2 Hosted By Derek Moore Director, National Education For the audio portion of today s webcast, please enable your computer speakers. Past performance
The six technical indicators for timing entry and exit in a short term trading program
 The six technical indicators for timing entry and exit in a short term trading program Definition Technical analysis includes the study of: Technical analysis the study of a stock s price and trends; volume;
Notices and Disclaimer
 Part 2 March 14, 2013 Saul Seinberg Notices and Disclaimer } This is a copyrighted presentation. It may not be copied or used in whole or in part for any purpose without prior written consent from the
Technical Indicators
 Taken From: Technical Analysis of the Financial Markets A Comprehensive Guide to Trading Methods & Applications John Murphy, New York Institute of Finance, Published 1999 Technical Indicators Technical
Williams Percent Range
 Williams Percent Range (Williams %R or %R) By Marcille Grapa www.surefiretradingchallenge.com RISK DISCLOSURE STATEMENT / DISCLAIMER AGREEMENT Trading any financial market involves risk. This report and
GUIDE TO STOCK trading tools
 P age 1 GUIDE TO STOCK trading tools VI. TECHNICAL INDICATORS AND OSCILLATORS I. Introduction to Indicators and Oscillators Technical indicators, to start, are data points derived from a specific formula.
Introduction. Technicians (also known as quantitative analysts or chartists) usually look at price, volume and psychological indicators over time.
 usually look at price, volume and psychological indicators over time.") Technical Analysis Introduction Technical Analysis is the study of market action, primarily through the use of charts, for the purpose of forecasting future price trends. Technicians (also known as quantitative
Technical Analysis Introduction Technical Analysis is the study of market action, primarily through the use of charts, for the purpose of forecasting future price trends. Technicians (also known as quantitative
Advanced Trading Systems Collection MACD DIVERGENCE FOREX TRADING SYSTEM
 MACD DIVERGENCE FOREX TRADING SYSTEM 1 This system will cover the MACD divergence. With this forex trading system you can trade any currency pair (I suggest EUR/USD and GBD/USD when you start), and you
RISK DISCLOSURE STATEMENT / DISCLAIMER AGREEMENT
 RISK DISCLOSURE STATEMENT / DISCLAIMER AGREEMENT Trading any financial market involves risk. This report and all and any of its contents are neither a solicitation nor an offer to Buy/Sell any financial
Class 7: Moving Averages & Indicators. Quick Review
 Today s Class Moving Averages Class 7: Moving Averages & Indicators 3 Key Ways to use Moving Averages Intro To Indicators 2 Indicators Strength of Lines Quick Review Great for establishing point of Support
Bollinger Trading Methods. Play 1 - The Squeeze
 Overview: Play 1 - The Squeeze Play 2 - The Trend Trade Play 3 - Reversals Wrap up Bollinger Trading Methods Play 1 - The Squeeze The Squeeze The most popular strategy Looks to enter a trend early on Anticipates
Forex Sentiment Report Q2 FORECAST WEAK AS LONG AS BELOW April
 Forex Sentiment Report 08 April 2015 www.ads-securities.com Q2 FORECAST WEAK AS LONG AS BELOW 1.1200 Targets on a break of 1.1534/35: 1.1740/50 1.1870/75 1.2230/35 Targets on a break of 1.0580/70: 1.0160
The Technical Edge Page 1. The Technical Edge. Part 1. Indicator types: price, volume, and moving averages and momentum
 The Technical Edge Page 1 The Technical Edge INDICATORS Technical analysis relies on the study of a range of indicators. These come in many specific types, based on calculations or price patterns. For
OSCILLATORS. TradeSmart Education Center
 OSCILLATORS TradeSmart Education Center TABLE OF CONTENTS Oscillators Bollinger Bands... Commodity Channel Index.. Fast Stochastic... KST (Short term, Intermediate term, Long term) MACD... Momentum Relative
Maybank IB. Understanding technical analysis. by Lee Cheng Hooi. 24 September Slide 1 of Maybank-IB
 Maybank IB Understanding technical analysis 24 September 2011 by Lee Cheng Hooi Slide 1 of 40 Why technical analysis? 1) Market action discounts everything 2) Prices move in trends 3) History repeats itself
Secrets of Forex Trading
 Secrets of Forex Trading www.elliott-wave.webs.com Spatial Trades 2/5/2013 Spatial Trades Inc. SURESH UPRETY Table of Contents CALENDAR ANALYSIS... 4 UNDERSTANDING OSCILLATORS AND VOLUME... 6 ELLIOTT WAVE
Aluminium US Mid West Trans Premium Swap
 Trading Aluminium The technical footprint within the Aluminium US Mid West Premium swap. Agenda Disclaimer This document is made available for general information purposes only and does not constitute
NIFTY. Momentum oscillator, RSI (14) is in bullish crossover which suggests index momentum to remain on the positive side.
 is in bullish crossover which suggests index momentum to remain on the positive side.") Date: 16 th July 2018 NIFTY The Nifty, which reversed its downwards trend in the previous week has continued rallying during the last week. Moreover, the Index has given a trend-line breakout on the weekly
Date: 16 th July 2018 NIFTY The Nifty, which reversed its downwards trend in the previous week has continued rallying during the last week. Moreover, the Index has given a trend-line breakout on the weekly
The very first calculations for average gain and average loss are simple 14- period averages.
 Introduction Developed by J. Welles Wilder, the Relative Strength Index (RSI) is a momentum oscillator that measures the speed and change of price movements. RSI oscillates between zero and 100. Traditionally,
BUY SELL PRO. Improve Profitability & Reduce Risk with BUY SELL Pro. Ultimate BUY SELL Indicator for All Time Frames
 BUY SELL PRO Improve Profitability & Reduce Risk with BUY SELL Pro Ultimate BUY SELL Indicator for All Time Frames Risk Disclosure DISCLAIMER: Crypto, futures, stocks and options trading involves substantial
Introduction. Technical analysis is the attempt to forecast stock prices on the basis of market-derived data.
 Technical Analysis Introduction Technical analysis is the attempt to forecast stock prices on the basis of market-derived data. Technicians (also known as quantitative analysts or chartists) usually look
Compass FX
 SYNERGY Trading Method Disclaimer Unique experiences and past performances do not guarantee future results. Trading in the off-exchange Foreign Exchange market (Forex) is very speculative in nature, involves
By Tri, Senior Analyst
 1/1/2014 Trend Following By Tri, Senior Analyst NUS Students Investment Society NATIONAL UNIVERSITY OF SINGAPORE Introduction Trend following was introduced by Richard Dennis when he taught trading strategies
Introductory Fundamental and Technical Analysis
 Introductory Fundamental and Technical Analysis Tan Junda junda@uobkayhian.com (65) 6590 6616 Jeffrey Tan jeffreytan@uobkayhian.com (65) 6590 6629 Our Focus Today What kind of investor are you? Technical
Intelligent Investing, LLC Major Indices Daily Update 02/26/ 19
 Elliot Wave Updates Yesterday I found a move below last Friday s high (SPX2794.20) will be a first sign of lower prices as then the decline can t be a 4 th wave because 4 th and 1 st waves can t overlap
PART 3 - CHART PATTERNS & TECHNICAL INDICATORS
 Tyler Chianelli s EASYOPTIONTRADING by OPTION TRADING COACH PART 3 - CHART PATTERNS & TECHNICAL INDICATORS A SIMPLE SYSTEM FOR TRADING OPTIONS WORKS IN UP, DOWN, AND SIDEWAYS MARKETS PART 3.1 - PRIMARY
Table of Contents. Risk Disclosure. Things we will be going over. 2 Most Common Chart Layouts Anatomy of a candlestick.
 Table of Contents Risk Disclosure Things we will be going over 2 Most Common Chart Layouts Anatomy of a candlestick Candlestick chart Anatomy of a BAR PLOT Indicators Trend-Lines Volume MACD RSI The Stochastic
Constellation Brands
 1/7 TRADING ALERT Constellation Brands huteauth@trendandtiming,com Phone: 33 (0) 6 11 88 36 11 5-Jan-18 INDEX COMPANY RIC NAME ABSOLUTE TREND Close INDEX S&P 500 INDEX/d COMPANY CONSTELLATION /d d-1 Volat
CHAMELEON INDICATORS. A new way to view the markets. Alex Cole 05/10/17
 CHAMELEON INDICATORS A new way to view the markets. Alex Cole 05/10/17 THE CHAMELEON TREND AND CHAMELEON OSCILLATOR STUDIES One of the most important benefits of visualization is that it allows us visual
What Would It Take to Trigger a Secular Reversal in Bond Yields?
 What Would It Take to Trigger a Secular Reversal in Bond Yields? January 18, 2018 by Martin Pring of Pring Turner Capital Group In the fall of 1981, the twenty-year US bond yield peaked slightly above
Scarsdale Equities llc
 Scarsdale Equities llc Morning Note 1/10/2013 Member FINRA, SIPC SSS Technical Research Morning Note 1/10/2013 Slight Downside Remains NYSE McClellan OB/OS Back To Overbought Opinion: Based on our assessment
Big Picture report April 17 th 2012
 Big Picture report April 17 th 2012 Francesco Maggioni francesco.maggioni@gmail.com +39 393 70 40 234 Quantitative approach for asymmetric results Bouncing back and maybe going beyond recent highs.. and
Intra-Day Trading Techniques
 Pristine.com Presents Intra-Day Trading Techniques With Greg Capra Co-Founder of Pristine.com, and Co-Author of the best selling book, Tools and Tactics for the Master Day Trader Copyright 2001, Pristine
TECHNICAL INDICATORS
 TECHNICAL INDICATORS WHY USE INDICATORS? Technical analysis is concerned only with price Technical analysis is grounded in the use and analysis of graphs/charts Based on several key assumptions: Price
Technical Analysis and Charting Part II Having an education is one thing, being educated is another.
 Chapter 7 Technical Analysis and Charting Part II Having an education is one thing, being educated is another. Technical analysis is a very broad topic in trading. There are many methods, indicators, and
Identifying Probable Market Direction
 Identifying Probable Market Direction Indicators for Market Direction Reversal Indicators The following are great for determining market turns on an index: 1. MACD-Hist(12,26,9) 2. RSI(7) 3. EWI(7,3,5)
Chartbook Review. By Fred Meissner, CMT (charts as of 03/26/14) The FRED Report Chamblee Dunwoody Dunwoody, GA Web:
 The FRED Report Chamblee Dunwoody Dunwoody, GA Web:") Chartbook Review (charts as of 03/26/14) By Fred Meissner, CMT www.thefredreport.com The FRED Report 4514 Chamblee Dunwoody Dunwoody, GA 30338 Web: www.thefredreport.com Phone: 404 875 FRED fred@thefredreport.com
Chartbook Review (charts as of 03/26/14) By Fred Meissner, CMT www.thefredreport.com The FRED Report 4514 Chamblee Dunwoody Dunwoody, GA 30338 Web: www.thefredreport.com Phone: 404 875 FRED fred@thefredreport.com
Different Classes Of Divergence
 Russ Horn Presents Different Classes Of Divergence RISK DISCLOSURE STATEMENT / DISCLAIMER AGREEMENT Trading any financial market involves risk. This report and all and any of its contents are neither a
Quad EMA Strategy. by Admiral Markets Trading Camp
 Quad EMA Strategy by Admiral Markets Trading Camp Contents About the Author 3 Strategy Description 4 Exponential Moving Average 5 Awesome Oscillator 9 MACD Indicator 13 Conclusion 19 About the Author Nenad
Technical analysis & Charting The Foundation of technical analysis is the Chart.
 Technical analysis & Charting The Foundation of technical analysis is the Chart. Charts Mainly there are 2 types of charts 1. Line Chart 2. Candlestick Chart Line charts A chart shown below is the Line
CHAPTER V TIME SERIES IN DATA MINING
 CHAPTER V TIME SERIES IN DATA MINING 5.1 INTRODUCTION The Time series data mining (TSDM) framework is fundamental contribution to the fields of time series analysis and data mining in the recent past.
INTERMEDIATE EDUCATION GUIDE
 INTERMEDIATE EDUCATION GUIDE CONTENTS Key Chart Patterns That Every Trader Needs To Know Continution Patterns Reversal Patterns Statistical Indicators Support And Resistance Fibonacci Retracement Moving
The goal for Part One is to develop a common language that you and I
 PART ONE Basic Training The goal for Part One is to develop a common language that you and I can use. The rest of the book will discuss how the technical indicators highlighted in the first two chapters
Technical Analysis explained: The Gap theory applied on unsustainable movements in EUR/USD
 Technical Analysis explained: The Gap theory applied on unsustainable movements in EUR/USD In late 1980s John J. Murphy published his book titled Technical Analysis of the Futures Markets, a comprehensive
Security Price and Your Bottom Line. Presented by Scott McCormick, CMT DYAD Capital Management Group, LLC
 Security Price and Your Bottom Line Presented by Scott McCormick, CMT DYAD Capital Management Group, LLC Disclosure Acknowledgement: This course of instruction will prepare you to actively invest/trade
The Schaff Trend Cycle
 The Schaff Trend Cycle by Brian Twomey This indicator can be used with great reliability to catch moves in the currency markets. Doug Schaff, president and founder of FX Strategy, created the Schaff trend
FOREX PROFITABILITY CODE
 FOREX PROFITABILITY CODE Forex Secret Protocol Published by Old Tree Publishing CC Suite 509, Private Bag X503 Northway, 4065, KZN, ZA www.oldtreepublishing.com Copyright 2013 by Old Tree Publishing CC,
Forexsignal30 Extreme ver. 2 Tutorials
 Forexsignal30 Extreme ver. 2 Tutorials Forexsignal30.com is a manual trading system that is composed of several indicators that mutually cooperate with each other. Very difficult to find indicators that
TOP 3 INDICATOR BOOT CAMP: PERCENT R
 BIGTRENDS.COM TOP 3 INDICATOR BOOT CAMP: PERCENT R PRICE HEADLEY, CFA, CMT Let s Get Started! Educate Understand the tools you have for trading. Learn what this indicator is and how you can profit from
Icoachtrader Consulting Service WELCOME TO. Trading Boot Camp. Day 5
 Icoachtrader Consulting Service www.icoachtrader.weebly.com WELCOME TO Trading Boot Camp Day 5 David Ha Ngo Trading Coach Phone: 1.650.899.1088 Email: icoachtrader@gmail.com The information presented is
Telephone: Web Address: Forecast
 T T Telephone: 484-278-473 Email: richard@rhodes-capital.com Web Address: http://www.rhodes-capital.com F 213 Russell 2 Small Cap Index (Daily) Correction Imminent?? Price Oscillator (8.17287) The march
TRADING ADDICTS. Lesson 3: Timing and Technical Indicators. Timing the Market. Copyright 2010, Trading Addicts, LLC. All Rights Reserved
 Lesson 3: Timing and Technical Indicators In this chapter, we will be focusing on the timing of the trade, from each individual angle. Timing plays a critical role in a Covered Call strategy, as it can
With that, let s dive into the steps. Step 1 Identify range bound markets on Daily or 4 Hour Charts
 If you have been trading for any length of time, you have probably noticed that the markets are moving sideways A LOT. Consolidation is a huge part of the market s balance and so it makes sense to learn
Compiled by Timon Rossolimos
 Compiled by Timon Rossolimos - 2 - The Seven Best Forex Indicators -All yours! Dear new Forex trader, Everything we do in life, we do for a reason. Why have you taken time out of your day to read this
The Performance of Our Secondary Trend Indicator (a.k.a Technical Indicator Index)
") The Performance of Our Secondary Trend Indicator (a.k.a Technical Indicator Index) By Robert McHugh, Ph.D. March 10th, 2012 Our Market Analysis service specializes in presenting several Indicators designed
The Performance of Our Secondary Trend Indicator (a.k.a Technical Indicator Index) By Robert McHugh, Ph.D. March 10th, 2012 Our Market Analysis service specializes in presenting several Indicators designed
AUTHOR: NG EE HWA, TRAINER, CHARTNEXUS TRADING WITH RSI
 AUTHOR: NG EE HWA, TRAINER, CHARTNEXUS TRADING WITH RSI While the use of Relative Strength Index (RSI) to get technical buy and sell signals in a range-bound market is well understood, the use of this
Using Acceleration Bands and Williams %R
 Price Headley s Simple Trading System for Stock, ETF & Option Traders Using Acceleration Bands and Williams %R How Technical Indicators Can Help You Find the Big Trends For option traders, correctly forecasting
A Trading System that Disproves Efficient Markets
 A Trading System that Disproves Efficient Markets April 5, 2011 by Erik McCurdy Advisor Perspectives welcomes guest contributions. The views presented here do not necessarily represent those of Advisor
Commodities Corner. REP Synopsis Gold (Play the Range)
") REP-039 www.jamapunji.pk Gold prices set to post fourth consecutive weekly gains GOLD: Gold prices fell initially in the previous session, making a low of US$1,307/oz after traders booked profit as the
REP-039 www.jamapunji.pk Gold prices set to post fourth consecutive weekly gains GOLD: Gold prices fell initially in the previous session, making a low of US$1,307/oz after traders booked profit as the
Weekly outlook for Jan 16 Jan
 Weekly outlook for Jan 16 Jan 20 2017 TREND DIRECTION S&P 500 Oil Gold Short Term Intermediate-Term Long Term weak strong strong weak Strong Less strong strong weak strong Conclusion: S&P500 indicator
Intelligent Investing, LLC Major Indices Daily Update 02/28/ 19
 Elliot Wave Updates Today the S&P500 was stuck in a less than 6p range. So there s really not much we can learn. All parameters remain the same a step 2: A move below SPX2764.55 (last Thursday s low) will
Homework Assignment #1 - Based on the MTAEF Glossary of Technical Terms
 Homework Assignment #1 - Based on the MTAEF Glossary of Technical Terms Each block of 3 question is preceded by 5 technical terms. Fill in the blank and make the statement complete. There is only one correct
Technical Analysis Workshop Series. Session Three
 Technical Analysis Workshop Series Session Three DISCLOSURES & DISCLAIMERS This research material has been prepared by NUS Invest. NUS Invest specifically prohibits the redistribution of this material
1 P a g e. Table 1. Ideal wave tracker table for nano and micro-waves of minute-v
 Yesterday I concluded We may get some profit taking over the Holiday; but it should only be corrective (small 4 th waves). And today certainly looked like that with only a 5p range on the S&P. Hence the
Hidden Divergence. Hello there, you will be excited about the information contained in this report.
 Hidden Divergence Hello there, you will be excited about the information contained in this report. Isn t it remarkable how people like us who are in the Trading business have taken frequently interesting
Cycle Turn Indicator Direction and Swing Summary. of Select Markets as of the close on. January 8, Daily CTI. Swing
 Cycle Turn Indicator Direction and Swing Summary of Select Markets as of the close on January 8, 2019 Market Daily CTI Daily Swing Weekly CTI Weekly Swing Industrial Positive Low Positive Low Transports
Adaptive Oscillator for TradeStation
 1 Adaptive Oscillator for TradeStation PZT PROOF is an adaptive oscillator based on a statistical range of price action. Similar to a stochastic indicator, it creates values by comparing the distance between
RELATIVE CURRENCY STRENGTH -ADDON-
 RELATIVE CURRENCY STRENGTH -ADDON- TABLE OF CONTENTS INSTRUCTIONS FOR PACKAGE INSTALLATION 3 USING RELATIVE CURRENCY STRENGTH (RCS) 4 PARAMETERS 4 SIGNALS 5 2 INSTRUCTIONS FOR PACKAGE INSTALLATION 1. As
PRESENTS CHARTING MADE EASY ALL TRADING INFORMATION REVEALED
 PRESENTS CHARTING MADE EASY ALL TRADING INFORMATION REVEALED 1 INTRODUCTION Over the years, investors have developed literally, hundred thousand of different technical market indicators in their efforts
 ADDING THE MACD Forex Strategy Master Published by Old Tree Publishing CC Suite 509, Private Bag X503 Northway, 4065, KZN, ZA www.oldtreepublishing.com Copyright 2013 by Old Tree Publishing CC, KZN, ZA
The truth behind commonly used indicators
 Presents The truth behind commonly used indicators Pipkey Report Published by Alaziac Trading CC Suite 509, Private Bag X503 Northway, 4065, KZN, ZA www.tradeology.com Copyright 2014 by Alaziac Trading
Nifty Auto (CMP: 7464)
") Nifty Auto (CMP: 7464) Positive Bullish Harami pattern at a strong support zone (Lower end of the Channel as well as the 50% Fibonacci retracement level) Technical Overview: The overall Automobile space
Nifty Auto (CMP: 7464) Positive Bullish Harami pattern at a strong support zone (Lower end of the Channel as well as the 50% Fibonacci retracement level) Technical Overview: The overall Automobile space
Continued on the Next Page
 An Overview of the Super Stochastics : A New & Improved Stochastics Indicator Page 3 A Comparison of the Super Stochastics vs. the regular Stochastics: Old vs. New Page 4 - An Overview of the Super Stochastics
An Overview of the Super Stochastics MTF Indicator Page 2. The Advantages and Features of MTF Indicators Page 3
 An Overview of the Super Stochastics MTF Indicator Page 2 The Advantages and Features of MTF Indicators Page 3 The Various Methods of MTF Analysis: Unlocking New Possibilities Page 5 - Different Time Frames
Russ Horn Presents. Forex Money Bounce
 Presents Forex Money Bounce RISK DISCLOSURE STATEMENT / DISCLAIMER AGREEMENT Trading any financial market involves risk. This report and all and any of its contents are neither a solicitation nor an offer
PRESENTS. COG Master Strategy. Trading Forex Using the Center Of Gravity Master Strategy. Wesley Govender
 PRESENTS COG Master Strategy Trading Forex Using the Center Of Gravity Master Strategy Copyright 2013 by Old Tree Publishing CC, KZN, ZA Wesley Govender Reproduction or translation of any part of this
Cycle Turn Indicator Direction and Swing Summary. of Select Markets as of the close on. January 18, Daily CTI. Swing
 Cycle Turn Indicator Direction and Swing Summary of Select Markets as of the close on January 18, 2019 Market Daily CTI Daily Swing Weekly CTI Weekly Swing Industrial Positive Low Positive Low Transports
Intermediate - Trading Analysis
 Intermediate - Trading Analysis Technical Analysis Technical analysis is the attempt to forecast currencies prices on the basis of market-derived data. Technicians (also known as quantitative analysts
Technical Analysis Workshop Series. Session Six 1, 2, 3 Price-Bars Patterns
 Technical Analysis Workshop Series Session Six 1, 2, 3 Price-Bars Patterns DISCLOSURES & DISCLAIMERS This research material has been prepared by NUS Invest. NUS Invest specifically prohibits the redistribution
Cycle Turn Indicator Direction and Swing Summary. of Select Markets as of the close on. January 11, Daily CTI. Swing
 Cycle Turn Indicator Direction and Swing Summary of Select Markets as of the close on January 11, 2019 Market Daily CTI Daily Swing Weekly CTI Weekly Swing Industrial Positive Low Positive Low Transports
Assisting Traders and Investors to Generate Positive Performance
 TRENDadvisor Since 1998 Assisting Traders and Investors to Generate Positive Performance Dear Trader & Investor: We congratulate you on the investment in the acutrade Trading System Software by TRENDadvisor.
Walter Bressert, Inc.
 Walter Bressert, Inc. http://www.walterbressert.com mailto:info@walterbressert.com Copyright Walter Bressert, Inc. All rights reserved. 1 PROFITTRADER for METASTOCK END-OF-DAY AND INTRA VERSIONS The EOD
1. Introduction 2. Chart Basics 3. Trend Lines 4. Indicators 5. Putting It All Together
 Technical Analysis: A Beginners Guide 1. Introduction 2. Chart Basics 3. Trend Lines 4. Indicators 5. Putting It All Together Disclaimer: Neither these presentations, nor anything on Twitter, Cryptoscores.org,
FOREX TRADING STRATEGIES.
 FOREX TRADING STRATEGIES www.ifcmarkets.com www.ifcmarkets.com 2 One of the most powerful means of winning a trade is the portfolio of Forex trading strategies applied by traders in different situations.
Star Search Strategy. Barbara Star, PhD. Wednesday 07/11/2018
 Learn a strategy for finding profitable trades in stocks and commodities using a variation of Bollinger Bands and another, less well-known, indicator that is available on most charting software. Both conservative
Cycle Turn Indicator Direction and Swing Summary. of Select Markets as of the close on. December 6, Daily CTI. Swing
 Cycle Turn Indicator Direction and Swing Summary of Select Markets as of the close on December 6, 2018 Market Daily CTI Daily Swing Weekly CTI Weekly Swing Industrial Negative High Positive Low Transports
Lighting the Way: Using Candlestick Patterns. The Art & Science of Active Trend Trading
 Lighting the Way: Using Candlestick Patterns The Art & Science of Active Trend Trading Disclaimer U.S. Government Required Disclaimer Commodity Futures Trading Commission Futures and Options trading has