PRESENTS CHARTING MADE EASY ALL TRADING INFORMATION REVEALED
|
|
|
- Clemence Leonard
- 5 years ago
- Views:
Transcription

1 PRESENTS CHARTING MADE EASY ALL TRADING INFORMATION REVEALED 1
2 INTRODUCTION Over the years, investors have developed literally, hundred thousand of different technical market indicators in their efforts to predict stock market. Nowadays every investor finds loads of different kinds of technical market indicators available for free on every financial site on the internet. Unfortunately, for the unwary, there are many misleading, untested, overstated or just plain wrong indicators. Additionally, different kind of indicators may contradict to each other. Therefore, such a situation will only lead to a more difficult process for investors to apply a successful and traceable trading approach. Finally, the investors own emotional basis does interfere too often with the desired goal of maximizing trading returns although disciplined trading decisions are as important as accurate knowledge in actually making money. Since there is no indicator which is right all the time, a combination of different kinds of technical market indicators is the best method to understand the big picture plus the best way to beat the market in the long run. A clear and understandable investment process will deliver more predictable results and allows traders to improve their approach over time. The content of this book will give a brief overview on how to classify indicators into subgroups, including the advantage and the complicacy as well as a detailed instruction on how to combine different kinds of indicators to a sound investment process. Furthermore, we highlight which types of indicators should be used by short-or long-term investors as well as which are suitable for low-or high experienced traders. 2

3 HOW TO CLASSIFY DIFFERENT KINDS OF TECHNICAL MARKET INDICATORS DEFINITION A market trend is a tendency of a stock market to move in a particular direction over time. These trends are classified as secular trends for long time frames, primary trends for medium time frames, and secondary trends lasting short times. Trend indicators are always lagging indicators as a trend has to establish first, before it can be measured. ADVANTAGE Money will only be made in strong trends. Identifying a trend is the most important part in technical analysis since a trend is stronger than any other indicator. Since stock markets are trending most of the time, trend-following indicators can be enormouslyprofitable and easy to use. Furthermore the main idea behind those indicators is to catch the middle part of a strong trend COMPLICACY Trend indicators will never lead a price of a security. They are not designed to do so. Trend indicators are always lagging indicators as they follow the price action of the underlying security. In sideways market, trend indicators are not effective. The shorter the trend, the more signals will be produced and the more trading signals will be generated. 3
4 BREADTH INDICATORS Breadth indicators are designed to confirm a price action or an existing trend. DEFINITION Breadth indicators are measuring the overall strength of a price action or an existing trend by analyzing the proportion of the overall stocks or volume that are participating in the market s up or down move. Some measures of market breadth involve the volume of rising stocks compared to the volume of falling stocks. ADVANTAGE Rising stocks should be getting the most of volume in a healthy strong market. In a healthy uptrend the amount of advancing stocks should dominate the amount of declining stocks etc. Positive market breadth occurs when more stocks are moving higher than are moving lower, and it is used to suggest that the condition of the market is healthy. COMPLICACY Breadth indicators are designed to point out unusual conditions but they cannot exactly be categorized by length and severity. A divergence does not necessarily lead to a major price reversal. Nevertheless breadth indicators can be an important red flag on the horizon for traders. 4
5 CONTRARIAN INDICATORS Measure the investing behavior of certain trader groups DEFINITION Contrarian market indicators attempt to measure the overall bullish or bearish attitude towards the market among traders and investors (market sentiment) or tracking down the investing behavior of smart money and dumb money. Those indicators lead and/or confirm price actionssmart money and dumb money. Somehow they are a mixture between trendand breadth indicators and oscillators. ADVANTAGE A contrarian investor or the behavioral finance followers believe that when everybody is fully invested there will be no further purchasing power. At this point, the market is at a peak. On the other hand, when people predict a downturn, they have already sold out, at which point the market can only go up. Normally when the market hits a new low, Smart Money will buy and Dumb Money will sell. Therefore following the behavior of Smartand Dumb Money will give additional edge of information. COMPLICACY If a contrarian indicator flashes a divergence that does not necessarily lead to a major price reversal. Nevertheless contrarian indicators can be an important red flag on the horizon for traders. Most of the contrarian indicators lead prices, and in comparison with oscillators they do work in every market phase (trend and trendless market environments). 5
6 COMPLICACY OF OSCILLATORS Oscillators are leading indicators as they lead a price move DEFINITION Oscillators are leading indicators as they lead a price move. They move above and below a centerline (center oscillators) or are banded (banded oscillators) between two extreme values. The banded oscillators are designed for discovering short-term overbought or oversold conditions. As the value of the oscillator approaches the upper extreme band the stock market is deemed to be overbought, and as it approaches the lower extreme it is deemed to be oversold. ADVANTAGE Oscillators are designed to lead prices and they work the best if the market is in a trading range or if the trend market is not confirmed by breadth. If the market is in a strong uptrend, the best opportunity to buy is when the oscillator flashes an oversold signal. If the market in a downtrend, it is the best to look for overbought conditions to sell your position. COMPLICACY It is expensive to trade an oscillator signal against the major trend of the market. Banded oscillators are used to identify overbought and oversold conditions, but overbought does not necessarily mean that a trend reversal is ahead. The bottom line: oscillators should only be used in combination with trend and breadth indicators. 6

7 ALL TECHNICAL MARKET INDICATORS HAVE A TRADE OFF BETWEEN SENSITIVITY AND CONSISTENCY Overview: factors being influenced by the underlying time period INDICATORS YOU SHOULD USE, ACCORDING TO YOUR TRADING HORIZON AND TRADING EXPERIENCE: 7


8 COMBINING DIFFERENT KINDS OF TECHNICAL MARKET INDICATORS INTO A SOUND INVESTMENT PROCESS Trend indicators are crucial to watch since a trend is stronger than anything else. 8

9 TREND INDICATORS FOR SHORT-TERM TRADERS Short-term trend indicator 9 W W W. G L O B C A P I TA L. C O M


10 COMBINATION OF SHORT TO MID-TERM TREND INDICATORS 10

11 TREND INDICATORS FOR MID TO LONG TERM INVESTORS Short-term trend indicator TREND INDICATORS FOR MID TO LONG-TERM INVESTORS Mid-term trend indicator 11


12 How our payoff would have looked like if you had followed the Global Futures Trend Index? Long-term trend indicator How our payoff would have looked like if you had followed the Global Futures Trend Index? 12 W W W. G L O B C A P I TA L. C O M


13 Long-term trend indicator Long-term trend indicator 13

14 BREADTH INDICATORS DETERMINE THE STRENGTHS OF A TREND TREND INDICATORS ARE CRUCIAL TO WATCH SINCE A TREND IS STRONGER THAN ANYTHING ELSE TREND INDICATORS ARE ALWAYS LAGGING INDICATORS AS THEY FOLLOW THE PRICE ACTION OF THE UNDERLYING SECURITY SO INVESTORS ARE ALWAYS LATE IN AND LATE OUT WITH THEIR TRADES! 14


15 BREADTH INDICATORS FOR SHORT - TERM TRADERS Example: short-to mid-term breadth indicator. 15

16 BREADTH INDICATORS FOR MID-TO LONG-TERM INVESTORS Mid-to long-term investors: using breadth indicators to minimize wrong trend indicator signals. Example: long-term breadth indicator 16

17 Example: long-term breadth indicator 17

18 CONTRARIAN INDICATORS Trend indicators are crucial to watch since a trend is stronger than anything else. Contrarian indicators are tracking the investing behavior of four different kinds of investment groups 18


19 CONTRARIAN INDICATORS ARE BEING USED FOR MONEY MANAGEMENT OR TO ACT CONTRARIAN Money management refers to taking profits/averaging down the portfolio THE SMART MONEY FLOW INDEX Track what smart money is doing 19


20 THE GLOBAL FUTURES DUMB MONEY INDICATOR Do not behave like dumb money! STOCK MARKET CYCLES DO APPEAR IN DIFFERENT WEEKLY REGULARITY AND THEY ARE VERY PROFITABLE FOR SHORT-TERM OPPORTUNISTIC TRADERS Average weekly returns of the S&P 500 compared with the different bullish cycles 20


21 MARKET SENTIMENT BETWEEN CONFIRMING AND CONTRARIAN INDICATOR Do not get bearish when others are DAILY PUT/CALL RATIO ALL CBOE OPTIONS Do not buy calls/puts when the crowd is betting on further gains/losses 21


22 WSC CAPITULATION INDEX Buy when dumb money is throwing in the towel THE GLOBAL FUTURES BOTTOM INDICATOR Cover your shorts at the bottom 22


23 OSCILLATORS Mixture of trend, breadth - and contrarian indicators are providing another unique inside about the condition of the market. Modified McClellan Oscillator Daily a mixture between trend and breadth indicator. Use this indicator in combination with other short-term trend and breadth indicators! EQUITY OPTIONS CALL/PUT RATIO OSCILLATOR Measure the momentum of calls and puts which are being bought by the crowd 23

24 MODIFIED MCCLELLAN OSCILLATOR WEEKLY A MIXTURE BETWEEN TREND AND BREADTH INDICATOR Use this indicator in combination with other mid-to long-term trend and breadth indicators! 24
25 APPENDIX SYSTEMATIC SECTOR ROTATION INVESTING Theoretical aspects of sector rotation investing THE BASICS The basic idea behind a sector rotation strategy is that economy operates in repetitive cycles. An economic cycle is generally divided into four stages: early expansion, late expansion, early recession and full recession. The stage in which an economy operates has a significant impact on the profitability and prospects of different sectors (a sector refers to a group of stocks representing companies in a similar line of business or industry). For example, consumer staples or the health care sector is considered to be defensive, meaning companies in this sector are generally unaffected by economic fluctuations. The health care sector consists of pharmaceutical firms, biotech firms and medical equipment suppliers. The demand of such products is fairly steady and these companies are not affected by rising or falling interest rates during an economic cycle. Therefore this sector is considered to be very defensive and it. Therefore various sectors become more or less attractive at different stages in the economic cycle. So in other words, at various stages in an economic cycle, certain sectors will outperform and other will underperform the underlying market. 25


26 SECTOR ROTATION INVESTING Overview Select Sector ETFs yearly performance Stock Market Cycle leads the Economic Cycle by 3 to 6 months 26
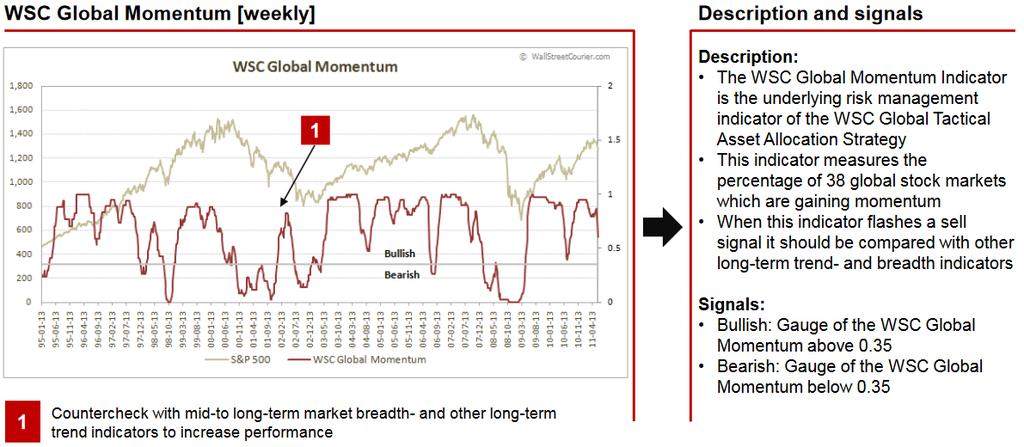
 Weekly buy/sell decisions for the strongest global equity markets")

27 SYSTEMATIC GLOBAL INVESTING GLOBAL TACTICAL ASSET ALLOCATION STRATEGY (GTAAS) Weekly buy/sell decisions for the strongest global equity markets SINCE THE GLOBAL TACTICAL ASSET ALLOCATION HAS NO BENCHMARK ONLY YEARLY RESULTS ARE SHOWN Yearly results of the Global Tactical Asset Allocation Strategy 27

28 EXAMPLE OF THE WEEKLY BUY/SELL DECISIONS DELIVERED BY THE GLOBAL TACTICAL ASSET ALLOCATION STRATEGY High portfolio turnover and therefore perfect suitable short-term traders 28
29 The analysis and data contained herein are provided as is and without warranty of any kind, either expressed or implied. SUMMARY All opinions expressed herein are subject to change without notice, and you should always obtain current information and perform due diligence before trading. Shareholders, directors, officers and/or employees, may have long or short positions in the securities discussed herein and may purchase or sell such securities without notice. When evaluating the results and performance rankings, one should also consider that we may modify the methods it uses to evaluate investment opportunities from time to time, that model results do not show the adverse effect of transaction cost. For this and for many other reasons, our past recommendations and model results are not a guarantee of future results. All of the views expressed in this research reports accurately reflect the research analyst s personal views regarding any and all of the subject securities or issuers. EXPECTING YOUR SUCCESS... 29
WallStreetCourier.com Starter Kit & Guidelines. How to maximize your results with WallStreetCourier.com. 1 v1.
 WallStreetCourier.com Starter Kit & Guidelines How to maximize your results with WallStreetCourier.com www.wallstreetcourier.com 1 v1.7 Philosophy & Services of WallStreetCourier.com 2 www.wallstreetcourier.com
OSCILLATORS. TradeSmart Education Center
 OSCILLATORS TradeSmart Education Center TABLE OF CONTENTS Oscillators Bollinger Bands... Commodity Channel Index.. Fast Stochastic... KST (Short term, Intermediate term, Long term) MACD... Momentum Relative
Introduction. Technicians (also known as quantitative analysts or chartists) usually look at price, volume and psychological indicators over time.
 usually look at price, volume and psychological indicators over time.") Technical Analysis Introduction Technical Analysis is the study of market action, primarily through the use of charts, for the purpose of forecasting future price trends. Technicians (also known as quantitative
Technical Analysis Introduction Technical Analysis is the study of market action, primarily through the use of charts, for the purpose of forecasting future price trends. Technicians (also known as quantitative
Chapter 8 Stock Price Behavior and Market Efficiency
 Chapter 8 Stock Price Behavior and Market Efficiency Concept Questions 1. There are three trends at all times, the primary, secondary, and tertiary trends. For a market timer, the secondary, or short-run
Introduction. Technical analysis is the attempt to forecast stock prices on the basis of market-derived data.
 Technical Analysis Introduction Technical analysis is the attempt to forecast stock prices on the basis of market-derived data. Technicians (also known as quantitative analysts or chartists) usually look
1. Introduction 2. Chart Basics 3. Trend Lines 4. Indicators 5. Putting It All Together
 Technical Analysis: A Beginners Guide 1. Introduction 2. Chart Basics 3. Trend Lines 4. Indicators 5. Putting It All Together Disclaimer: Neither these presentations, nor anything on Twitter, Cryptoscores.org,
Monthly Investment Compass Charting The Course Of The Markets
 Monthly Investment Compass Charting The Course Of The Markets April 22 nd, 2016 Monthly Investment Compass Executive Summary: April 22 nd 2016 U.S. Stock Market: The most important takeaway from the latest
IVolatility.com E G A R O N E S e r v i c e
 IVolatility.com E G A R O N E S e r v i c e Stock Sentiment Service User Guide The Stock Sentiment service is a tool equally useful for both stock and options traders as it provides you stock trend analysis
Weekly Market Summary
 Weekly Market Summary August 18, 2015 by Urban Carmel of The Fat Pitch US equities had two opportunities to kick off a rally this week. Neither had much follow through. On Monday, positive breadth was
Technical Analysis Workshop Series. Session 11 Semester 2 Week 5 Oscillators Part 2
 Technical Analysis Workshop Series Session 11 Semester 2 Week 5 Oscillators Part 2 DISCLOSURES & DISCLAIMERS This research material has been prepared by NUS Invest. NUS Invest specifically prohibits the
Schwab Investing Insights Trading Edition Text Close Window Size: November 15, 2007
 Schwab Investing Insights Trading Edition Text Close Window Size: from TheStreet.com November 15, 2007 ON TECHNIQUES Two Indicators Are Better Than One The Relative Strength Index works well but it s better
Introduction. Leading and Lagging Indicators
 1/12/2013 Introduction to Technical Indicators By Stephen, Research Analyst NUS Students Investment Society NATIONAL UNIVERSITY OF SINGAPORE Introduction Technical analysis comprises two main categories:
Top Down Analysis Success Demands Singleness of Purpose
 Chapter 9 Top Down Analysis Success Demands Singleness of Purpose Armed with a little knowledge about the stock and options market as well as a desire to trade, many new traders are faced with the daunting
The very first calculations for average gain and average loss are simple 14- period averages.
 Introduction Developed by J. Welles Wilder, the Relative Strength Index (RSI) is a momentum oscillator that measures the speed and change of price movements. RSI oscillates between zero and 100. Traditionally,
The Technical Edge Page 1. The Technical Edge. Part 1. Indicator types: price, volume, and moving averages and momentum
 The Technical Edge Page 1 The Technical Edge INDICATORS Technical analysis relies on the study of a range of indicators. These come in many specific types, based on calculations or price patterns. For
Chapter 24 DIVERGENCE DECISIONS
 Chapter 24 DIVERGENCE DECISIONS The subject of divergence is one that we will approach with the utmost caution. We hope we have made ourselves clear in the other volumes of this course that we have little
A Trading System that Disproves Efficient Markets
 A Trading System that Disproves Efficient Markets April 5, 2011 by Erik McCurdy Advisor Perspectives welcomes guest contributions. The views presented here do not necessarily represent those of Advisor
BTIG Technical Strategy Year-End Chart Book December 2014
 BTIG Technical Strategy Year-End Chart Book December 2014 This year has been one for the technicians - trends and momentum have dominated conversations about the markets, and for good reason. The following
Chapter 2.3. Technical Analysis: Technical Indicators
 Chapter 2.3 Technical Analysis: Technical Indicators 0 TECHNICAL ANALYSIS: TECHNICAL INDICATORS Charts always have a story to tell. However, from time to time those charts may be speaking a language you
Monthly Investment Compass Charting The Course Of The Markets
 Monthly Investment Compass Charting The Course Of The Markets November 11 th, 2017 Monthly Investment Compass 1) Executive Summary: November 11 th, 2017 U.S. Stock Market: Unmet upside targets in several
PERSPECTIVE ON MARKET VOLATILITY
 LPL RESEARCH WEEKLY MARKET COMMENTARY October 15 2018 PERSPECTIVE ON MARKET VOLATILITY John Lynch Chief Investment Strategist, LPL Financial Ryan Detrick, CMT Senior Market Strategist, LPL Financial Jeffrey
US Financial Market Update for March Prepared for the Market Technicians Association
 US Financial Market Update for March 2016 Prepared for the Market Technicians Association March 16 th, 2016 About Asbury Research Research, Methodology & Clientele Our Research: Asbury Research, established
Monthly Investment Compass Charting The Course Of The Markets
 Monthly Investment Compass Charting The Course Of The Markets September 21st, 2017 Monthly Investment Compass 1) Executive Summary: September 21 st, 2017 U.S. Stock Market: Virtually all of our near term
MARKET VOLATILITY - NUMBER OF "BIG MOVE" TRADING DAYS
 M O O D S W I N G S November 11, 214 Northern Trust Asset Management http://www.northerntrust.com/ investmentstgy James D. McDonald Chief Investment Stgist jxm8@ntrs.com Daniel J. Phillips, CFA Investment
TRADING ADDICTS. Lesson 3: Timing and Technical Indicators. Timing the Market. Copyright 2010, Trading Addicts, LLC. All Rights Reserved
 Lesson 3: Timing and Technical Indicators In this chapter, we will be focusing on the timing of the trade, from each individual angle. Timing plays a critical role in a Covered Call strategy, as it can
Asbury Research s US Investment Analysis: A Review of Q Prepared for Interactive Brokers
 Asbury Research s US Investment Analysis: A Review of Q1 2016 Prepared for Interactive Brokers April 14 th. 2016 About Asbury Research Research, Methodology & Clientele Our Research: Asbury Research, established
Do Moving Average Strategies Really Work?
 Do Moving Average Strategies Really Work? August 19, 2014 by Paul Allen Advisor Perspectives welcomes guest contributions. The views presented here do not necessarily represent those of Advisor Perspectives.
FOREX TRADING STRATEGIES.
 FOREX TRADING STRATEGIES www.ifcmarkets.com www.ifcmarkets.com 2 One of the most powerful means of winning a trade is the portfolio of Forex trading strategies applied by traders in different situations.
The E-Book of Technical Market Indicators
 The E-Book of Technical Market Indicators by Wall Street Courier Version 1.2 editor@wallstreetcourier.com Page 1 Preface The transparency of the American markets offers an array of indicators and allows
Scarsdale Equities llc
 Scarsdale Equities llc Morning Note 1/2/2014 Member FINRA, SIPC SSS Technical Research Morning Note 1/2/2014 Uptrends Remain Intact Psychology Readings At Cautionary Extremes Opinion: Psychology readings
Technical Indicators
 Taken From: Technical Analysis of the Financial Markets A Comprehensive Guide to Trading Methods & Applications John Murphy, New York Institute of Finance, Published 1999 Technical Indicators Technical
NorthPost Partners, LP
 We are a small hedge fund. We re not here to sell you the impossible dream of incredible gains and lavish riches. We re here to make you a steady income for the rest of your life. No boom. No bust. Just
Stock Market Report Review
 January 7, 25 Stock Market Report - 24 Review Market Analysis for Period Ending Friday, December 31, 24 This document presents technical and fundamental analysis commonly used by investment professionals
Technical Analysis Workshop Series. Session Eight Commodity Channel Index
 Technical Analysis Workshop Series Session Eight DISCLOSURES & DISCLAIMERS This research material has been prepared by NUS Invest. NUS Invest specifically prohibits the redistribution of this material
Homework Assignment #1 - Based on the MTAEF Glossary of Technical Terms
 Homework Assignment #1 - Based on the MTAEF Glossary of Technical Terms Each block of 3 question is preceded by 5 technical terms. Fill in the blank and make the statement complete. There is only one correct
Stock Market Report. December 08, 2004
 December 8, 24 Stock Market Report Market Analysis for Period Ending Friday, December 3, 24 This document presents technical and fundamental analysis commonly used by investment professionals to interpret
Williams Percent Range
 Williams Percent Range (Williams %R or %R) By Marcille Grapa www.surefiretradingchallenge.com RISK DISCLOSURE STATEMENT / DISCLAIMER AGREEMENT Trading any financial market involves risk. This report and
Stock Market Report. January 26, 2005
 January 26, 25 Stock Market Report Market Analysis for Period Ending Friday, January 21, 25 This document presents technical and fundamental analysis commonly used by investment professionals to interpret
Forex Sentiment Report Q2 FORECAST WEAK AS LONG AS BELOW April
 Forex Sentiment Report 08 April 2015 www.ads-securities.com Q2 FORECAST WEAK AS LONG AS BELOW 1.1200 Targets on a break of 1.1534/35: 1.1740/50 1.1870/75 1.2230/35 Targets on a break of 1.0580/70: 1.0160
Technical Analysis. Dealing Room Peter Leonidou. Peter Leonidou
 Technical Analysis Dealing Room Questions Traders Should Ask What is the trend? What is the pivot point? What is the support levels? What is the resistance levels? Strong or weaker USD? What 1. Trade
CHAMELEON INDICATORS. A new way to view the markets. Alex Cole 05/10/17
 CHAMELEON INDICATORS A new way to view the markets. Alex Cole 05/10/17 THE CHAMELEON TREND AND CHAMELEON OSCILLATOR STUDIES One of the most important benefits of visualization is that it allows us visual
Technical Tools Partnered With Other Methodologies. May 15, 2014 Adam Grimes, CIO, Waverly Advisors
 Technical Tools Partnered With Other Methodologies May 15, 2014 Adam Grimes, CIO, Waverly Advisors Outline: First principles: the market problem Understanding the market in terms of probabilities Approaches
The Dow Theory in Technical Analysis
 The Dow Theory in Technical Analysis INTRODUCTION Today Foreign Exchange Market is one of the popular segments of the global financial market. FOREX is the largest and the most liquid financial market
FinQuiz Notes
 Reading 13 Technical analysis is a security analysis technique that involves forecasting the future direction of prices by studying past market data, primarily price and volume. Technical Analysis 2. TECHNICAL
Technical Analysis for Options Trading. Fidelity Brokerage Services LLC, Member NYSE, SIPC, 900 Salem Street, Smithfield, RI
 Technical Analysis for Options Trading Fidelity Brokerage Services LLC, Member NYSE, SIPC, 900 Salem Street, Smithfield, RI 02917 747561.2.0 Disclosures Options trading entails significant risk and is
MAGIC FOREX DIVERGENCE Trading Guide
 Tim Trush & Julie Lavrin Introducing MAGIC FOREX DIVERGENCE Trading Guide Your guide to financial freedom. Tim Trush, Julie Lavrin, T&J Profit Club, 2017, All rights reserved www.forexmystery.com Table
Intelligent Investing, LLC Major Indices Daily Update 02/26/ 19
 Elliot Wave Updates Yesterday I found a move below last Friday s high (SPX2794.20) will be a first sign of lower prices as then the decline can t be a 4 th wave because 4 th and 1 st waves can t overlap
Trend Channels: How to Identify Easy Profit-Making Opportunities Using Simple Chart Analysis
 Trend Channels: How to Identify Easy Profit-Making Opportunities Using Simple Chart Analysis Trend channels produce a very powerful trading technique. They are very visible, which makes them easy to utilize
Monthly Stock Market Report
 October 23, 23 Monthly Stock Market Report This document is for internal use only. The document or any of its contents should not be distributed outside of the Federal Reserve System without permission.
Cycle Turn Indicator Direction and Swing Summary. of Select Markets as of the close on. December 21, Daily CTI. Swing
 Cycle Turn Indicator Direction and Swing Summary of Select Markets as of the close on December 21, 2018 Market Daily CTI Daily Swing Weekly CTI Weekly Swing Industrial Negative High Negative High Transports
Scarsdale Equities llc
 Scarsdale Equities llc Morning Note 10/4/2013 Member FINRA, SIPC SSS Technical Research Morning Note 10/4/2013 Sentiment Remains A Short Term Concern DJI Closes Below Another Support Level Opinion: Although
Stock Market Report. August 2, 2006
 August 2, 26 Stock Market Report Market Analysis for Period Ending Friday, July 28, 26 This document presents technical and fundamental analysis commonly used by investment professionals to interpret direction
Stock Market Report. January 21, 2004
 January 21, 24 Stock Market Report Market Analysis for Period Ending Friday, January 16, 24 This document presents technical and fundamental analysis commonly used by investment professionals to interpret
Using Oscillators & Indicators Properly May 7, Clarify, Simplify & Multiply
 Using Oscillators & Indicators Properly May 7, 2016 Clarify, Simplify & Multiply Disclaimer U.S. Government Required Disclaimer Commodity Futures Trading Commission Futures and Options trading has large
Now You Can Have These Trading Gems- Free!
 Presents Killer Patterns Now You Can Have These Trading Gems- Free! The Trading Info Revealed Here is not the Same as the Proven WizardTrader.com Methods But Works Well With Them 1 Copyright Information
AlphaSolutions Sector Rotation Model
 AlphaSolutions Sector Rotation Model An investment model based on trending and momentum strategies Portfolio Goals Primary: Seeks long term growth of capital by investing in highranked U.S. Equity Sectors
The Trifecta Guide to Technical Analysis 1
 The Trifecta Guide to Technical Analysis 1 No trading system is bullet-proof. The list of factors that can impact a stock s share price is long and growing from investor sentiment to economic growth to
Chapter 2.3. Technical Indicators
 1 Chapter 2.3 Technical Indicators 0 TECHNICAL ANALYSIS: TECHNICAL INDICATORS Charts always have a story to tell. However, sometimes those charts may be speaking a language you do not understand and you
Cycle Turn Indicator Direction and Swing Summary. of Select Markets as of the close on. January 4, Daily Swing
 Cycle Turn Indicator Direction and Swing Summary of Select Markets as of the close on January 4, 2018 Market Daily CTI Daily Swing Weekly CTI Weekly Swing Industrial Positive Low Positive Low Transports
Cycle Turn Indicator Direction and Swing Summary. of Select Markets as of the close on. January 18, Daily CTI. Swing
 Cycle Turn Indicator Direction and Swing Summary of Select Markets as of the close on January 18, 2019 Market Daily CTI Daily Swing Weekly CTI Weekly Swing Industrial Positive Low Positive Low Transports
Understanding Oscillators & Indicators March 4, Clarify, Simplify & Multiply
 Understanding Oscillators & Indicators March 4, 2015 Clarify, Simplify & Multiply Disclaimer U.S. Government Required Disclaimer Commodity Futures Trading Commission Futures and Options trading has large
THE RELATIVE STRENGTH CONCEPT APPLIED TO SECTOR INDICES
 THE RELATIVE STRENGTH CONCEPT APPLIED TO SECTOR INDICES An Illustration with the DJ Stoxx 600 Index Yann CORDIER, CFTe, MFTA AXA Investment Managers London, 10/03/2015 OUTLINE The concept and power of
Technical analysis & Charting The Foundation of technical analysis is the Chart.
 Technical analysis & Charting The Foundation of technical analysis is the Chart. Charts Mainly there are 2 types of charts 1. Line Chart 2. Candlestick Chart Line charts A chart shown below is the Line
Scarsdale Equities llc
 Scarsdale Equities llc Morning Note 4/12/2013 Member FINRA, SIPC SSS Technical Research Morning Note 4/12/2013 Indexes Continue With Split Signals McClellan OB/OS Oscillators Remain Neutral Opinion: The
AlphaSolutions Blended Bull/Calendar
 AlphaSolutions Blended Bull/Calendar An investment model based on trending strategies coupled with market analytics for downside risk control with predetermined investment periods Portfolio Goals Primary:
Cycle Turn Indicator Direction and Swing Summary. of Select Markets as of the close on. January 24, Market Daily CTI Daily Swing
 Cycle Turn Indicator Direction and Swing Summary of Select Markets as of the close on January 24, 2017 Market Daily CTI Daily Swing Weekly CTI Weekly Swing Industrial Neutral Low Negative Low Transports
Cycle Turn Indicator Direction and Swing Summary. of Select Markets as of the close on. October 5, 2017
 Cycle Turn Indicator Direction and Swing Summary of Select Markets as of the close on October 5, 2017 Market Daily CTI Daily Swing Weekly CTI Weekly Swing Industrial Positive Low Positive Low Transports
Cycle Turn Indicator Direction and Swing Summary. of Select Markets as of the close on. April 2, Daily CTI. Swing
 Cycle Turn Indicator Direction and Swing Summary of Select Markets as of the close on April 2, 2019 Market Daily CTI Daily Swing Weekly CTI Weekly Swing Industrial Positive Low Positive Low Transports
Figure 3.6 Swing High
 Swing Highs and Lows A swing high is simply any turning point where rising price changes to falling price. I define a swing high (SH) as a price bar high, preceded by two lower highs (LH) and followed
Technical Analysis Workshop Series. Session Ten Semester 2 Week 4 Oscillators Part 1
 Technical Analysis Workshop Series Session Ten Semester 2 Week 4 Oscillators Part 1 DISCLOSURES & DISCLAIMERS This research material has been prepared by NUS Invest. NUS Invest specifically prohibits the
Monthly Investment Compass Charting The Course Of The Markets
 Monthly Investment Compass Charting The Course Of The Markets January 12 th, 2017 Monthly Investment Compass Executive Summary: January 12 th 2017 U.S. Stock Market: A number of near term metrics warn
Resistance to support
 1 2 2.3.3.1 Resistance to support In this example price is clearly consolidated and we can expect a breakout at some time in the future. This breakout could be short or it could be long. 3 2.3.3.1 Resistance
Cycle Turn Indicator Direction and Swing Summary. of Select Markets as of the close on. December 20, Daily CTI. Swing
 Cycle Turn Indicator Direction and Swing Summary of Select Markets as of the close on December 20, 2018 Market Daily CTI Daily Swing Weekly CTI Weekly Swing Industrial Negative High Negative High Transports
Forexsignal30 Extreme ver. 2 Tutorials
 Forexsignal30 Extreme ver. 2 Tutorials Forexsignal30.com is a manual trading system that is composed of several indicators that mutually cooperate with each other. Very difficult to find indicators that
Methodology. Our team of analysts uses technical and chartist analysis to draw an opinion and make decisions. The preferred chartist elements are:
 Methodology Technical analysis is at the heart of TRADING CENTRAL's expertise. Our methodology is proven. Our chartist and quantitative approach allows us to intervene on different investment horizons.
Cycle Turn Indicator Direction and Swing Summary. of Select Markets as of the close on. February 12, Daily CTI. Swing
 Cycle Turn Indicator Direction and Swing Summary of Select Markets as of the close on February 12, 2019 Market Daily CTI Daily Swing Weekly CTI Weekly Swing Industrial Positive Low Positive Low Transports
Combining Rsi With Rsi
 Working Two Stop Levels Combining Rsi With Rsi Optimization and stop-losses can help you minimize risks and give you better returns. channels, and so forth should be kept to a minimum. DAVID GOLDIN ou
Erlanger Squeeze Play - Squeezeometer. Erlanger Squeeze Play
 Page 1 of 5 Indicator Focus: Squeezeometer by Phil Erlanger Erlanger Squeeze Play A core function of our research centers on the concept of advance phases and decline phases. Whether we're in a bull or
Monthly Stock Market Report
 May 1, 22 Monthly Stock Market Report This document is for internal use only. The document or any of its contents should not be distributed outside of the Federal Reserve System without permission. Market
Module 12. Momentum Indicators & Oscillators
 Module 12 Momentum Indicators & Oscillators Oscillators or Indicators Now we will talk about momentum indicators The term momentum refers to the velocity of a price trend. This indicator measures whether
Nasdaq Chaikin Power US Small Cap Index
 Nasdaq Chaikin Power US Small Cap Index A Multi-Factor Approach to Small Cap Introduction Multi-factor investing has become very popular in recent years. The term smart beta has been coined to categorize
Level II Learning Objectives by chapter
 Level II Learning Objectives by chapter 1. Charting Explain the six basic tenets of Dow Theory Interpret a chart data using various chart types (line, bar, candle, etc) Classify a given trend as primary,
Cycle Turn Indicator Direction and Swing Summary. of Select Markets as of the close on. February 9, Daily Swing
 Cycle Turn Indicator Direction and Swing Summary of Select Markets as of the close on February 9, 2018 Market Daily CTI Daily Swing Weekly CTI Weekly Swing Industrial Negative High Negative High Transports
Technical Strategy. Q1 Dollar top as the basis for a sharp correction
 2017 Chart 38. ) DXY with Advance/Decline Line (20 Key Dollar Pairs) Chart 39. ) US Dollar with Presidential Cycle Tactically, we have been bullish US dollar since the May 2016 bottom, which is the base
STEP. Establish Short-Term Trend & Retracements. What is a trend?
 Establish Short-Term Trend & Retracements STEP 3 In Step Three, you will establish Short- Term Trend and Retracements on daily charts. By defining the trend and retracement, you will gain knowledge that
Index. long-term 200-day, 45 market cycle, myths, very long-term, weekly-based longer-term, 46-47
 Appel_Index2.qxd 2/22/05 11:07 AM Page 229 Index Symbols 10-day rate of change, NYSE Index advance-decline line, 133-134 18-month market cycles, 104 21-day rate of change, NYSE Index advance-decline line,
Notices and Disclaimer
 Part 2 March 14, 2013 Saul Seinberg Notices and Disclaimer } This is a copyrighted presentation. It may not be copied or used in whole or in part for any purpose without prior written consent from the
The FRED Report. By Fred Meissner, CMT Chamblee Dunwoody Dunwoody, GA Web:
 The FRED Report Training Manual By Fred Meissner, CMT www.thefredreport.com The FRED Report 4514 Chamblee Dunwoody Dunwoody, GA 30338 Web: www.thefredreport.com Phone: 404 875 FRED fred@thefredreport.com
THE CYCLE TRADING PATTERN MANUAL
 TIMING IS EVERYTHING And the use of time cycles can greatly improve the accuracy and success of your trading and/or system. THE CYCLE TRADING PATTERN MANUAL By Walter Bressert There is no magic oscillator
Monthly Stock Market Report
 January 22, 22 Monthly Stock Market Report This document is for internal use only. The document or any of its contents should not be distributed outside of the Federal Reserve System without permission.
Growth Investing. in Times of Market Volatility. White Paper
 White Paper Growth Investing in Times of Market Volatility April 2018 Executive Summary Many investors may be dismayed by the volatile nature of high-flying growth stocks. While, by definition, growth
Cycle Turn Indicator Direction and Swing Summary. of Select Markets as of the close on. December 27, Daily CTI. Swing
 Cycle Turn Indicator Direction and Swing Summary of Select Markets as of the close on December 27, 2018 Market Daily CTI Daily Swing Weekly CTI Weekly Swing Industrial Positive Low Negative High Transports
US Financial Market Chart Book for February/March February 23, 2012
 US Financial Market Chart Book for February/March 2012 February 23, 2012 US Financial Market Chart Book Executive Summary: February 23 rd 2012 U.S. Stocks: The benchmark S&P 500 and bellwether Dow Jones
3 Price Action Signals to Compliment ANY Approach to ANY Market
 3 Price Action Signals to Compliment ANY Approach to ANY Market Introduction: It is important to start this report by being clear that these signals and tactics for using Price Action are meant to compliment
AlphaSolutions Reduced Volatility Bull-Bear
 AlphaSolutions Reduced Volatility Bull-Bear An investment model based on trending strategies coupled with market analytics for downside risk control Portfolio Goals Primary: Seeks long term growth of capital
Martin Pring s. Weekly InfoMovie Report. April 8, 2014
 Martin Pring s Weekly InfoMovie Report April 8, 2014 Issue 1093 Weekly InfoMovie Report 1 Key level remains $184 on the SPY. US Equity Market - Last time I pointed out that the $184 level on the S&P ETF
The Schaff Trend Cycle
 The Schaff Trend Cycle by Brian Twomey This indicator can be used with great reliability to catch moves in the currency markets. Doug Schaff, president and founder of FX Strategy, created the Schaff trend
Balance Of Market Power. Who s The Boss? Stocks & Commodities V. 19:8 (18-32): Balance Of Power by Igor Livshin INDICATORS
: Balance Of Power by Igor Livshin INDICATORS") INDICATORS Who s The Boss? MIKE YAPPS Balance Of Market Power Who s in charge, bulls or bears? It doesn t take higher-order math to get a good reading. T by Igor Livshin he balance of market power (BMP)
INDICATORS Who s The Boss? MIKE YAPPS Balance Of Market Power Who s in charge, bulls or bears? It doesn t take higher-order math to get a good reading. T by Igor Livshin he balance of market power (BMP)
Trading the Unexpected: Pattern Failures
 Trading the Unexpected: Pattern Failures December 16, 2013 Outline What does unexpected mean? The psychology of trading the unexpected Developing the mental skills to handle trading surprises Two ways
Relative Rotation Graphs (RRG Charts)
") Relative Rotation Graphs (RRG Charts) Introduction Relative Rotation Graphs or RRGs, as they are commonly called, are a unique visualization tool for relative strength analysis. Chartists can use RRGs
Relative Rotation Graphs (RRG Charts) Introduction Relative Rotation Graphs or RRGs, as they are commonly called, are a unique visualization tool for relative strength analysis. Chartists can use RRGs