An Overview of the Super Stochastics MTF Indicator Page 2. The Advantages and Features of MTF Indicators Page 3
|
|
|
- Margery Sparks
- 5 years ago
- Views:
Transcription
1

2 An Overview of the Super Stochastics MTF Indicator Page 2 The Advantages and Features of MTF Indicators Page 3 The Various Methods of MTF Analysis: Unlocking New Possibilities Page 5 - Different Time Frames Page 6 - Different Intervals (Tick, Volume, Range, etc.) Page 7 - Different Trading Instruments or Symbols Page 8 - Creating Your Own Hybrid Method Page 9 Super Stochastics MTF Indicator: A Multiple Time Frame Stochastics Indicator Page 10 - Gradient Color-Coding Page 11 - MidLine Color-Coding Page 11 - Overbought / Oversold (OB/OS) Color-Coding Page 12 - Slope Color-Coding Page 12 Divergence Signals and DOBOS Reversals Page 13 Customizing the Super Stochastics MTF Indicator Page 14 Superior Customer Support Page 16 Risk Disclosure Statement Page Fibozachi LLC All Rights Reserved. 1


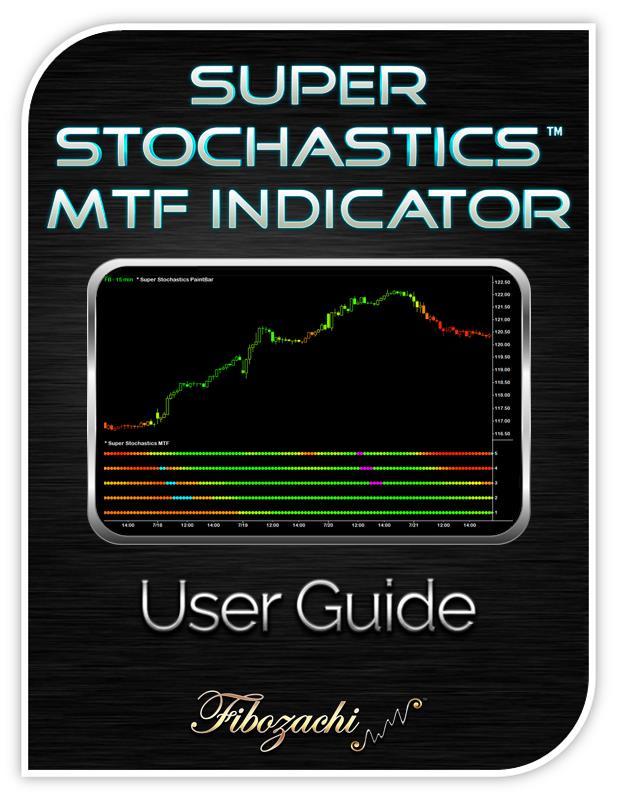
3 The Super Stochastics MTF Indicator lets you track the Stochastics across 5 different timeframes, interval periods, and instruments all from just one chart! Each row of dots corresponds to a different DataStream, and are color-coded based on Stochastic signals and trend conditions. The Super Stochastics MTF Indicator Package includes: Fibozachi LLC All Rights Reserved. 2
4 Choose both the timeframe and instrument for each of the 5 DataStreams, unlocking new possibilities and methods of trading and chart analysis. While some traders are familiar with MTF Indicators, only our versions have the ability to be used as Multi-Interval and Multi-Instrument Indicators as well! Some Indicators are trend-based, some are signal-based, and some are both! That is why we designed the Super Stochastics MTF Indicator to display the color-coded trend at all times, unless a special signal is generated. Special signals always take priority and are plotted on top so that you won't miss them. Each MTF Indicator is designed to plot as 5 rows of dots, where each row corresponds to a specific DataStream. The row on the top is the smallest timeframe (DataStream #1) and the row on the bottom is the largest timeframe (DataStream #5). If you're like most traders, you waste a large portion of your time by constantly switching back and forth between charts in order to check the different timeframes and instruments. Our MTF Indicators will save you from the constant clicking and can make your trading routine more organized and less stressful Fibozachi LLC All Rights Reserved. 3
5 Having two or more charts open with the same Indicators on each is a drain on PC resources. Using our MTF Indicators reduces the amount of calculations, which in turn provides a speed boost over the other methods of MTF chart analysis. We take color-coding to a new level by giving you full control over the color settings for all of the various trend conditions and signals. Each trader has unique color preferences and those with color blindness struggle with the common greens and reds, so we gave traders the ability to customize everything to your specific needs Fibozachi LLC All Rights Reserved. 4
6 Many of the most successful traders rely on monitoring several timeframes at once, from the weekly down to the 1 minute. They do this because using only one timeframe causes most traders to become lost in the "noise" of random price movements resulting in losing trades and overthinking every decision. For instance, the trend on a 30 minute chart may be much different than the trend on a 5 minute or 120 minute chart. By tracking multiple timeframes at once, you'll gain a clearer perspective of the trend and will always know when multiple timeframes are in harmony or disagreement. That said, the Super Stochastics MTF Indicator is capable of much more than just "Multiple Time Frame" functionality. It allows for new methods of trading and chart analysis that have never been possible until now! Fibozachi LLC All Rights Reserved. 5
7 The standard method of MTF analysis is to use a different timeframe for each DataStream. This method allows you to see the trend conditions or signals across various timeframes. DataStream 1 (Row 5): 15 Minute DataStream 2 (Row 4): 30 Minute DataStream 3 (Row 3): 60 Minute DataStream 4 (Row 2): 90 Minute DataStream 5 (Row 1): 120 Minute Fibozachi LLC All Rights Reserved. 6
8 Another method of MTF analysis is to use a different interval of Tick, Volume, or Range for each DataStream. This method allows you to see the trend conditions or signals across various interval periods. DataStream 1 (Row 5): 100 Ticks DataStream 2 (Row 4): 250 Ticks DataStream 3 (Row 3): 500 Ticks DataStream 4 (Row 2): 1,000 Ticks DataStream 5 (Row 1): 2,500 Ticks Fibozachi LLC All Rights Reserved. 7
9 A third method of MTF analysis is to use a different instrument for each DataStream. This method allows you to see the trend conditions or signals across various instruments and symbols. DataStream 1 (Row 5): SPY 60 Minute DataStream 2 (Row 4): QQQ 60 Minute DataStream 3 (Row 3): DIA 60 Minute DataStream 4 (Row 2): GLD 60 Minute DataStream 5 (Row 1): USO 60 Minute Fibozachi LLC All Rights Reserved. 8
10 You can also use a combination of all the various MTF Analysis Methods to create your own custom hybrid approach! DataStream 1 (Row 5): SPY 1 Minute DataStream 2 (Row 610 Ticks DataStream 3 (Row 3): SPY 5 Minute DataStream 4 (Row 5,000 Ticks DataStream 5 (Row 1): NYSE ADV/DEC 5 Minute Fibozachi LLC All Rights Reserved. 9
11 The Super Stochastics MTF Indicator lets you track the Stochastics across 5 different timeframes, interval periods, and instruments all from just one chart! Each row of dots corresponds to a different DataStream, and are color-coded based on Stochastic signals and trend conditions. Choose from any of the following color-coding options: Fibozachi LLC All Rights Reserved. 10
12 Fibozachi LLC All Rights Reserved. 11
13 Fibozachi LLC All Rights Reserved. 12
14 In addition to the color-coded trend conditions, the Super Stochastics MTF Indicator also plots special color-coded dots whenever a Divergence Signal or DOBOS Reversal is registered on any of the datastreams. It s important to note that signals will always take color-coding priority over trend conditions The following are the default signal colors, but all colors are customizable! Fibozachi LLC All Rights Reserved. 13
15 Stochastics Length: Length or period used when calculating the Stochastics. Smoothing Length K: Length or period used when smoothing the Stochastic K Smoothing Length D: Length or period used when smoothing the Stochastic D Price Smoothing Length: Number of bars to include in the averaging method that is used to smooth the price data. Exclude Price Gaps: Set to TRUE to exclude price gaps when calculating the Stochastics Gap % to Exclude: This value is the percent of each price gap that will be ignored when calculating the Stochastic value. For example, a value of 30 means that 30% of each price gap will be ignored when calculating the Stochastic, whereas a value of 100 means that each price gap will be completely ignored when calculating the Stochastic. Gradient Color-Coding: If set to TRUE, the Stochastics will be color-coded using a special gradient method. The color of each bar is based upon the current Stochastics value and where it lies within the possible Stochastics range of MidLine Color-Coding: If set to TRUE, the Stochastics will be color-coded Green when it is above the MidLine ( > 50 ) and Red when below the MidLine ( < 50 ). Overbought / Oversold Color-Coding: If set to TRUE, the Stochastics will be color-coded Green in Oversold territory and Red in Overbought territory Fibozachi LLC All Rights Reserved. 14
16 Slope Color-Coding: If set to TRUE, the Stochastics will be color-coded Green when it is sloping upwards and Red when sloping downwards. Confluence Alerts: Enables alerts when the Super Stochastics becomes bullish or bearish across ALL 5 datastreams Fibozachi LLC All Rights Reserved. 15


17 Have a question about the Super Stochastics MTF Indicator Package? Contact us at support@fibozachi.com. We take great pride in our customer support and are happy to help our fellow traders! Fibozachi LLC All Rights Reserved. 16
18 The terms Company, us or we refer to Fibozachi.com, its parent company Fibozachi LLC, and all subsidiaries, affiliates, officers or employees therein. The term you refers to the user or customer of Fibozachi.com. The terms Content and Information refer to the indicators, tools, strategies, techniques, systems, manuals, data, communications and any other associated products or material of the Company. License: You are purchasing a single user license. You may not: copy, modify, publish, retransmit, participate in the transfer or sale of, distribute, perform, display, or create derivative works from, any of the Content or Information in any way. Disclaimer: All Content and Information provided is for educational purposes only. Fibozachi.com and Fibozachi LLC (the Company ) is not an investment advisory service, broker-dealer, commodity trading advisor, legal advisor, tax advisor, or registered investment advisor, and does not purport to tell or suggest which commodities, currencies or securities customers should buy or sell for themselves. The affiliates, employees or officers of the Company may hold positions in the commodities, currencies or securities discussed here. You understand and acknowledge that there is a high degree of risk involved in trading commodities, currencies or securities. You also understand and acknowledge that there is an extremely high degree of risk involved in trading leveraged vehicles such as futures or options, where you can lose more than the initial sum of your investment. The Company, its subsidiaries, affiliates, officers and employees assume no responsibility or liability for your trading or investment results. It should not be assumed that the indicators, tools, strategies, techniques, systems, manuals, data, communications or any other associated products and material of the Company, collectively the Content and Information, presented in its products or services will be profitable or that they will not result in losses. Past results of any individual trader or trading system published by Company are not indicative of future returns by that trader or system, and are not indicative of future returns, which may or may not be realized by you. In addition, the articles, blogs, chat, columns, indicators, methods, strategies, systems, techniques, tools, and all other features of Company's website (collectively, the Information ) are provided for educational purposes only and should not be construed as investment advice. Any articles, blogs, chat, columns, comments, discussions, drawings, and examples, including any other items intended to illustrate Information presented on Company's website, are for educational purposes only; such are not solicitations of any order to buy or sell. Accordingly, you should not rely solely on the Information in making any investment. Rather, you should use the Information only as a starting point for doing additional independent research in order to allow you to form your own opinion regarding any investment. You should always check with your licensed financial advisor and tax advisor to determine the suitability of any investment Fibozachi LLC All Rights Reserved. 17
19 IN CONSIDERING WHETHER TO TRADE, YOU SHOULD BE AWARE OF THE FOLLOWING: HYPOTHETICAL OR SIMULATED PERFORMANCE RESULTS HAVE CERTAIN INHERENT LIMITATIONS. UNLIKE AN ACTUAL PERFORMANCE RECORD, SIMULATED RESULTS DO NOT REPRESENT ACTUAL TRADING AND MAY NOT BE IMPACTED BY BROKERAGE AND OTHER SLIPPAGE FEES. ALSO, SINCE THE TRADES HAVE NOT ACTUALLY BEEN EXECUTED, THE RESULTS MAY HAVE UNDER- OR OVER-COMPENSATED FOR THE IMPACT, IF ANY, OF CERTAIN MARKET FACTORS, SUCH AS LACK OF LIQUIDITY. SIMULATED TRADING PROGRAMS IN GENERAL ARE ALSO SUBJECT TO THE FACT THAT THEY ARE DESIGNED WITH THE BENEFIT OF HINDSIGHT. NO REPRESENTATION IS BEING MADE THAT ANY ACCOUNT WILL OR IS LIKELY TO ACHIEVE PROFITS OR LOSSES SIMILAR TO THOSE SHOWN. TRADING IS AN EXTREMELY DIFFICULT PROBABILISTIC ENDEAVOR THAT REQUIRES TECHNICAL SKILL AND EMOTIONAL DISCIPLINE AT THE VERY MINIMUM. EVEN A GREAT TRADER WITH EXCELLENT ANALYSIS, RESOURCES, TOOLS, TECHNIQUES, STRATEGIES, PLANS, CONTINGENCIES, AND EXPLICITLY DEFINED RULES FOR MANAGING RISK EXPOSURE IS OFTEN WRONG. THERE ALWAYS REMAIN REAL AND UNQUANTIFIABLE RISKS SUCH AS GOVERNMENT INTERVENTION OF RULE / LAW CHANGES. RISK PREVENTION MEASURES SUCH AS PROTECTIVE STOPS DO NOT PREVENT THE RISK OF GAP OPENINGS OR LOCK-LIMIT MOVES. YOU AGREE THAT NEITHER FIBOZACHI LLC, NOR ITS SUBSIDIARIES, AFFILIATES, OFFICERS OR EMPLOYEES, SHALL BE LIABLE TO YOU OR ANY OTHER THIRD PARTY FOR ANY DIRECT, INDIRECT, INCIDENTAL, SPECIAL, OR CONSEQUENTIAL DAMAGES. MEMBERS AND VISITORS ( USERS ) AGREE TO INDEMNIFY AND HOLD FIBOZACHI LLC, AND ITS SUBSIDIARIES, AFFILIATES, OFFICERS AND EMPLOYEES, HARMLESS FROM ANY CLAIM OR DEMAND, INCLUDING REASONABLE ATTORNEYS FEES, MADE BY ANY THIRD PARTY DUE TO OR ARISING OUT OF A USER S USE OF FIBOZACHI LLC S WEBSITE. TradeStation Disclaimer: Neither TradeStation Technologies nor any of its affiliates has reviewed, certified, endorsed, approved, disapproved or recommended, and neither does or will review, certify, endorse, approve, disapprove or recommend, any trading software tool that is designed to be compatible with the TradeStation Open Platform Fibozachi LLC All Rights Reserved. 18
An Overview of the ZMA : The Superior Moving Average Page 2. ZMA Indicator: Infinite Flexibility and Maximum Adaptability Page 4
 An Overview of the ZMA : The Superior Moving Average Page 2 ZMA Indicator: Infinite Flexibility and Maximum Adaptability Page 4 ZMA PaintBar: Moving Average Color-Coding Page 5 Responsiveness and Inertia:
An Overview of the Dynamic Trailing Stop Page 2. Dynamic Trailing Stop: The Power of Smart-Stop Technology Page 3
 An Overview of the Dynamic Trailing Stop Page 2 Dynamic Trailing Stop: The Power of Smart-Stop Technology Page 3 DTS PaintBar: Color-Coded Trend Status Page 5 Customizing the DTS Indicators Page 6 Expert
An Overview of V-Coils & NR-Breakouts Page 2. V-Coils : Contraction & Expansion Volatility Thresholds Page 4
 An Overview of V-Coils & NR-Breakouts Page 2 V-Coils : Contraction & Expansion Volatility Thresholds Page 4 - Compression Signals Page 5 - Coil Zone Signals Page 6 - V-Coil Signals Page 7 - Mega V-Coil
Continued on the Next Page
 An Overview of the Super RSI : A New & Improved RSI Indicator Page 3 A Comparison of the Super RSI vs. the Regular RSI: Old vs. New Page 4 - An Overview of the Super RSI Features Page 4 Super RSI PaintBar:
Continued on the Next Page
 An Overview of the Super Stochastics : A New & Improved Stochastics Indicator Page 3 A Comparison of the Super Stochastics vs. the regular Stochastics: Old vs. New Page 4 - An Overview of the Super Stochastics
Continued on Next Page
 An Overview of Super DMI : A New & Improved DMI Indicator Page 3 A Comparison of the Super DMI vs. Regular DMI: Old vs. New Page 4 - An Overview of Super DMI Features Page 4 Smoothing Price Data to Improve
TradeStation User Guide
 TradeStation User Guide *For S&P 500 ETF Only (SPY)* Important note: Data subscriptions for NYSE, AMEX and OPRA are required for this indicator. ** DATA SUBSCRIPTIONS FOR NYSE, AMEX AND OPRA ARE REQUIRED
Bullalgo Trading Systems, Inc. Bullalgo Volatility Gauge Study Indicator User Manual Version 1.0 Manual Revision
 Bullalgo Trading Systems, Inc. Bullalgo Volatility Gauge Study Indicator User Manual Version 1.0 Manual Revision 20150917 Bullalgo Volatility Gauge Study Indicator The Bullalgo Volatility Gauge/Brake Indicator
MTF Volatility Squeeze Version 6.0
 MTF Volatility Squeeze Version 6.0 Description: The Multiple Time Frame Volatility Squeeze (MTFVS) indicator shows when there is a reduction in volatility that usually means that consolidation is occurring.
MTF Volatility Squeeze Version 4.0
 MTF Volatility Squeeze Version 4.0 Description: The Multiple Time Frame Volatility Squeeze (MTFVS) indicator shows when there is a reduction in volatility that usually means that consolidation is occurring.
Bullalgo Trading Systems, Inc. Orion Bollinger Band (BB) Threshold Study Indicators User Manual Version 1.0 Manual Revision
 Threshold Study Indicators User Manual Version 1.0 Manual Revision") Bullalgo Trading Systems, Inc. Orion Bollinger Band (BB) Threshold Study Indicators User Manual Version 1.0 Manual Revision 20150917 Orion Bollinger Band (BB) Threshold Study Indicators The Orion Bollinger
Bullalgo Trading Systems, Inc. Orion Bollinger Band (BB) Threshold Study Indicators User Manual Version 1.0 Manual Revision 20150917 Orion Bollinger Band (BB) Threshold Study Indicators The Orion Bollinger
Bullalgo Trading Systems, Inc. Orion NBar Crossover Strategy User Manual Version 1.0 Manual Revision
 Bullalgo Trading Systems, Inc. Orion NBar Crossover Strategy User Manual Version 1.0 Manual Revision 20150917 Orion NBar Crossover Strategy The Orion NBar Crossover Strategy is a tool to show the NBar
High Probability ETF Trading For All
 High Probability ETF Trading For All Version 2.7 Strategy Report Chris White, August 2012 Includes results to end of July 2012 Contents Disclaimer... 2 Summary... 3 The High Probability ETF Trading book
High Probability ETF Trading For All
 High Probability ETF Trading For All Version 2.10 Strategy Report Chris White, March 2014 Includes full year results 01/01/2009 to 12/31/13 And Last 3 months results (01/12/13 to 02/28/14) Contents Disclaimer...
Theories on How Markets Really Work. Copyright 2012 Connors Research, LLC. All Rights Reserved.
 Five Statistically-backed Theories on How Markets Really Work Larry Connors, Co-author Copyright 2012 Connors Research, LLC. All Rights Reserved. 1 DISCLAIMER Connors Research, LLC ("Company") is not an
ECLIPSE DAY TRADING SYSTEM USER GUIDE
 ECLIPSE DAY TRADING SYSTEM USER GUIDE Revised 20 July 2016 METHOD Trend and Countertrend STYLE Day Trading DESCRIPTION Methodology - ECLIPSE is a hedge-fund style day trading system for accredited professional
IBH Cumulative Tick Table of Contents
 IBH Cumulative Tick Table of Contents New in Version 5...2 Overview...2 Getting Started Quick Start...3 IBH Cumulative Tick Indicator H.CT...4 Configuration...4 Configuration: General Tab...4 Configuration:
Options Mastery Day 1 System Training
 Options Mastery Day 1 System Training Day 1 Agenda 10:00-10:15 - Intro & Course Outline 10:15-11:00 Indicator Overview and Setup 11:00-11:15 - Break 11:15-12:15 - Active Swing Trader Training 12:15-12:30
McDowell s Special Market Report Using the TradersCoach.com Software Tools
 McDowell s Special Market Report Using the TradersCoach.com Software Tools JULY 2018: Welcome to this month s Market Report! This written report is going to forecast the Dow Jones Industrial Average (hereafter
Adaptive Oscillator for TradeStation
 1 Adaptive Oscillator for TradeStation PZT PROOF is an adaptive oscillator based on a statistical range of price action. Similar to a stochastic indicator, it creates values by comparing the distance between
Intraday Volume Change - Version 4.0
 Intraday Volume Change - Version 4.0 Description: The Intraday Volume Change (IVC) indicator for TradeStation lets you see how the current intraday volume compares to the same time period from prior days.
The strategy has an average holding period of 4 days and trades times a year on average.
 Introduction Diversity CL is a price pattern based swing trading system for the NYMEX WTI Crude Oil futures contract. The system uses multiple price patterns hence the name "Diversity". The strategy trades
VERY IMPORTANT Before you start you have to follow these instructions to insure that the strategy is working properly:
 Volatility Pivots User Guide help@volatilitypivots.com VERY IMPORTANT Before you start you have to follow these instructions to insure that the strategy is working properly: 1. This strategy works with
MTF Trend Version 4.0
 MTF Trend Version 4.0 Description: The Multiple Time Frame Trend (MTFT) indicator will aggregate multiple timeframes onto 1 chart. Up to 5 time frames can be shown (time frame 1=TF1, time frame 2 =TF2,
Intraday Multi-View Suite (IMV) For Stocks and Futures
 For Stocks and Futures") Intraday Multi-View Suite (IMV) For Stocks and Futures Release Notes Thank you for purchasing the PowerZone Trading IMV custom indicator suite for TradeStation. The following notes are intended to act
Intraday Multi-View Suite (IMV) For Stocks and Futures Release Notes Thank you for purchasing the PowerZone Trading IMV custom indicator suite for TradeStation. The following notes are intended to act
Using Volume Based Bars in Your Trading Exclusive Presentation for Infinity Futures
 Using Volume Based Bars in Your Trading Exclusive Presentation for Infinity Futures Trading Futures, Options on Futures, and retail off-exchange foreign currency transactions involves substantial risk
Understanding Oscillators & Indicators March 4, Clarify, Simplify & Multiply
 Understanding Oscillators & Indicators March 4, 2015 Clarify, Simplify & Multiply Disclaimer U.S. Government Required Disclaimer Commodity Futures Trading Commission Futures and Options trading has large
Using Oscillators & Indicators Properly May 7, Clarify, Simplify & Multiply
 Using Oscillators & Indicators Properly May 7, 2016 Clarify, Simplify & Multiply Disclaimer U.S. Government Required Disclaimer Commodity Futures Trading Commission Futures and Options trading has large
Bullalgo Trading Systems, Inc. Orion ES Intraday High Risk 2A User Manual Version 1.0 Manual Revision
 Bullalgo Trading Systems, Inc. Orion ES Intraday High Risk 2A User Manual Version 1.0 Manual Revision 20160922 Orion ES Intraday High Risk 2A Orion ES Intraday High Risk 2A is the first of a series of
Stacked Moving Averages - Version 4.0
 Stacked Moving Averages - Version 4.0 Description: The Stacked Moving Averages indicator allows you to quickly see if an equity is in an uptrend, downtrend, or no trend based on the condition of the moving
ModeX V1.6 User Guide to Installation and Operation
 ModeX V1.6 User Guide to Installation and Operation A TradeStation Trading System for liquid futures contracts This electronic book is Copyright PMKing Trading 2005. Any unauthorized distribution, copying,
VE N O M Trading System: User Manual VENOM USER MANUAL. Copyright 2007 Third Wave FX. All Rights Reserved.
 VENOM USER MANUAL www.thirdwavefx.com Copyright 2007 Third Wave FX. All Rights Reserved. ww w.third w a v e f x.co m Page 1 Step 1 Copy & paste Third Wave FX Venom A.ex4 & Third Wave FX Venom B.ex4 indicator
RISK DISCLOSURE STATEMENT / DISCLAIMER AGREEMENT
 RISK DISCLOSURE STATEMENT / DISCLAIMER AGREEMENT Trading any financial market involves risk. This report and all and any of its contents are neither a solicitation nor an offer to Buy/Sell any financial
Intra-Day Trading Techniques
 Pristine.com Presents Intra-Day Trading Techniques With Greg Capra Co-Founder of Pristine.com, and Co-Author of the best selling book, Tools and Tactics for the Master Day Trader Copyright 2001, Pristine
BUY SELL PRO. Improve Profitability & Reduce Risk with BUY SELL Pro. Ultimate BUY SELL Indicator for All Time Frames
 BUY SELL PRO Improve Profitability & Reduce Risk with BUY SELL Pro Ultimate BUY SELL Indicator for All Time Frames Risk Disclosure DISCLAIMER: Crypto, futures, stocks and options trading involves substantial
Gold Space USER GUIDE
 Gold Space USER GUIDE The risk of trading can be substantial and each investor and/or trader must consider whether this is a suitable investment. Past performance, whether actual or indicated by simulated
Different Classes Of Divergence
 Russ Horn Presents Different Classes Of Divergence RISK DISCLOSURE STATEMENT / DISCLAIMER AGREEMENT Trading any financial market involves risk. This report and all and any of its contents are neither a
USER GUIDE
 USER GUIDE http://www.winningsignalverifier.com DISCLAIMER Please be aware of the loss, risk, personal or otherwise consequences of the use and application of this book s content. The author and the publisher
Fat Cat Forex Scalper User Manual
 Www.ForexWinners.Net Fat Cat Forex Scalper User Manual Www.ForexWinners.Net 1 2 3 Congratulations on your purchase! You have made the best decision, as the Fat Cat Forex Scalper is one of the most effective
The Launchpad Strategy
 presented by Thomas Wood MicroQuant SM Divergence Trading Workshop Day One The Launchpad Strategy Risk Disclaimer Trading or investing carries a high level of risk, and is not suitable for all persons.
Go No Go Indicators: Part 2
 Go No Go Indicators: Part 2 March 22, 2017 Dennis W. Wilborn Active Trend Trading Disclaimer U.S. Government Required Disclaimer Commodity Futures Trading Commission Futures and Options trading has large
Presents. Trade Predator
 Presents RISK DISCLOSURE STATEMENT / DISCLAIMER AGREEMENT Trading any financial market involves risk. This report and all and any of its contents are neither a solicitation nor an offer to Buy/Sell any
Master Trader Joe Ross
 The purpose of the Trader's Trick Entry (TTE) is to get us into a trade prior to entry by most other traders. Trading is a business in which the more knowledgeable have the advantage over the less knowledgeable.
The FX-Agency Advisor III. User Manual
 The FX-Agency Advisor III User Manual Brought to you by... System Requirements: For use of The FX-Agency Advisor III you will need a few things which you most likely already have or can get very easily.
FOREX PROFITABILITY CODE
 FOREX PROFITABILITY CODE Forex Secret Protocol Published by Old Tree Publishing CC Suite 509, Private Bag X503 Northway, 4065, KZN, ZA www.oldtreepublishing.com Copyright 2013 by Old Tree Publishing CC,
Presents. Forex Profit Boost
 Presents Forex Profit Boost Forex Profit Boost Published by Alzaiak Trading CC Nominee Old Tree Publishing CC Suite 509, Private Bag X503 Northway, 4065, KZN, ZA www.oldtreepublishing.com Copyright 2014
Dividend Status - Version 9.0
 Dividend Status - Version 9.0 Description: The Dividend Status (DS) ShowMe allows you to get information about upcoming dividends as well as historical data about prior dividend announcements. DS allows
Forex Trend Directive
 FOREX GEMINI CODE Presents Forex Trend Directive Forex Gemini Code Published by Alaziac Trading CC Suite 509, Private Bag X503 Northway, 4065, KZN, ZA www.forexgeminicode.com Copyright 2014 by Alaziac
Using Volume to Confirm Price Trend. Confirmed Up Trend
 Using Volume to Confirm Price Trend Today s Trading Forum is going to focus on using volume in conjunction with price trend. Volume is a valuable trading tool that can be used to confirm the price trend
 ADDING THE MACD Forex Strategy Master Published by Old Tree Publishing CC Suite 509, Private Bag X503 Northway, 4065, KZN, ZA www.oldtreepublishing.com Copyright 2013 by Old Tree Publishing CC, KZN, ZA
Point and Figure Charting
 Technical Analysis http://spreadsheetml.com/chart/pointandfigure.shtml Copyright (c) 2009-2018, ConnectCode All Rights Reserved. ConnectCode accepts no responsibility for any adverse affect that may result
Bullalgo Trading Systems, Inc. Trailing Matrix User Manual Version 1.0 Manual Revision
 Bullalgo Trading Systems, Inc. Trailing Matrix User Manual Version 1.0 Manual Revision 20150917 Trailing Matrix The Trailing Matrix is a Bullalgo Trading Systems, Inc. add-on Trailing Stop strategy that
S-Enrooter 1.0. Automatic trading strategy USER GUIDE. Version 1.0
 S-Enrooter 1.0 Automatic trading strategy USER GUIDE Version 1.0 Revised 22.08.2016 Trading method Breakout signals Trading Style Swing trading system Description of automatic strategy S-Enrooter 1.0 -
Williams Percent Range
 Williams Percent Range (Williams %R or %R) By Marcille Grapa www.surefiretradingchallenge.com RISK DISCLOSURE STATEMENT / DISCLAIMER AGREEMENT Trading any financial market involves risk. This report and
- My 4 Favorite Trades - Essential Trades of a Professional Trader
 presented by Thomas Wood MicroQuant SM Divergence Trading Workshop Day One - My 4 Favorite Trades - Essential Trades of a Professional Trader Risk Disclaimer Trading or investing carries a high level of
Trading Success Principles Floor Trader Pivots
 Trading Success Principles Floor Trader Pivots Trading Concepts, Inc. Trading Success Principles Floor Trader Pivots By Todd Mitchell Copyright 2014 by Trading Concepts, Inc. All Rights Reserved This training
USER MANUAL. Version 1.7
 USER MANUAL Version 1.7 1 LEGAL NOTICE NO INVESTMENT ADVICE. The information contained in this user manual has no regard to the specific investment objective, financial situation or particular needs of
TD AMERITRADE Technical Analysis Night School Week 2
 TD AMERITRADE Technical Analysis Night School Week 2 Hosted By Derek Moore Director, National Education For the audio portion of today s webcast, please enable your computer speakers. Past performance
TOP 3 INDICATOR BOOT CAMP: PERCENT R
 BIGTRENDS.COM TOP 3 INDICATOR BOOT CAMP: PERCENT R PRICE HEADLEY, CFA, CMT Let s Get Started! Educate Understand the tools you have for trading. Learn what this indicator is and how you can profit from
The strategy has an average holding period of 4 days and trades times a year on average.
 Introduction Diversity TF is a price pattern based swing trading system for the Emini Russell 2000 futures contract. The system uses multiple price patterns hence the name "Diversity". The strategy trades
FOREX INCOME BOSS. Presents. SRT Profit System
 FOREX INCOME BOSS Presents SRT Profit System Published by Alaziac Trading CC Suite 509, Private Bag X503 Northway, 4065, KZN, ZA www.forexincomeboss.com Copyright 2014 by Alaziac Trading CC, KZN, ZA Reproduction
FOREX TREND SECRETS. New Science Of Forex Trading Published by Alaziac CC Suite 509, Private Bag X503 Northway, 4065, KZN, ZA
 FOREX TREND SECRETS New Science Of Forex Trading Published by Alaziac CC Suite 509, Private Bag X503 Northway, 4065, KZN, ZA www.alaziac.com Copyright 2013 by Alaziac CC, KZN, ZA Reproduction or translation
PROFIT TRADE SCANNER. USER GUIDE
 PROFIT TRADE SCANNER USER GUIDE http://www.profittradescanner.com DISCLAIMER Please be aware of the loss, risk, personal or otherwise consequences of the use and application of this book s content. The
CONTENTS 1 INTRODUCTION RETURNS GET STARTED BROKER OFFER... 7 LEGAL & RISK DISCLAIMER Page 2 londonforexopen.
 CONTENTS 1 INTRODUCTION... 3 2 RETURNS... 4 3 GET STARTED... 6 4- BROKER OFFER... 7 LEGAL & RISK DISCLAIMER... 8 Page 2 londonforexopen.com 1 INTRODUCTION London Forex Open is a 100% mechanical Forex Trading
Intraday Support and Resistance Using Volume-Weighted Average Price (VWAP)
") Issue 11 Intraday Support and Resistance Using Volume-Weighted Average Price (VWAP) Updated by Michael Burke VP, Client Education Nov. 2018 Subscription Link: https://tradestation.tradingappstore.com/products/intradayvwapwithradarscreen
Issue 11 Intraday Support and Resistance Using Volume-Weighted Average Price (VWAP) Updated by Michael Burke VP, Client Education Nov. 2018 Subscription Link: https://tradestation.tradingappstore.com/products/intradayvwapwithradarscreen
Chapter 2.3. Technical Analysis: Technical Indicators
 Chapter 2.3 Technical Analysis: Technical Indicators 0 TECHNICAL ANALYSIS: TECHNICAL INDICATORS Charts always have a story to tell. However, from time to time those charts may be speaking a language you
Assisting Traders and Investors to Generate Positive Performance
 TRENDadvisor Since 1998 Assisting Traders and Investors to Generate Positive Performance Dear Trader & Investor: We congratulate you on the investment in the acutrade Trading System Software by TRENDadvisor.
Thank you For Reading
 Thank you For Reading Welcome to the second issue of the TradingFibz, LLC weekly supplemental newsletter. It is my hope that over the next month, the newsletter will take on a new look and add in additional
Technical analysis & Charting The Foundation of technical analysis is the Chart.
 Technical analysis & Charting The Foundation of technical analysis is the Chart. Charts Mainly there are 2 types of charts 1. Line Chart 2. Candlestick Chart Line charts A chart shown below is the Line
Chapter 2.3. Technical Indicators
 1 Chapter 2.3 Technical Indicators 0 TECHNICAL ANALYSIS: TECHNICAL INDICATORS Charts always have a story to tell. However, sometimes those charts may be speaking a language you do not understand and you
Becoming a Consistent Trader
 presented by Thomas Wood MicroQuant SM Divergence Trading Workshop Day One Becoming a Consistent Trader Risk Disclaimer Trading or investing carries a high level of risk, and is not suitable for all persons.
Presents FOREX ALPHA CODE
 Presents FOREX ALPHA CODE Forex Alpha Code Published by Alaziac Trading CC Suite 509, Private Bag X503 Northway, 4065, KZN, ZA www.tradeology.com Copyright 2014 by Alaziac Trading CC, KZN, ZA Reproduction
Buy rules: Sell rules: Strategy #2. Martingale hedging with exponential lot increase... 6
 Contents Introduction... 2 Data... 2 Short instructions on how to use Forex Tester.... 2 Sum up... 3 STRATEGIES... 3 Martingale strategies... 3 Strategy #1. Martingale Grid & Hedging... 4 Buy rules:...
No-BS Trading System
 No-BS Trading System Techniques The Professionals Don t Want To Be Revealed DISCLAIMER U.S. Government Required Disclaimer - Commodity Futures Trading Commission Futures and Options trading has large potential
NetPicks Keltner Bells
 Page 1 NetPicks Keltner Bells NetPicks, LLC HYPOTHETICAL PERFORMANCE RESULTS HAVE MANY INHERENT LIMITATIONS, SOME OF WHICH ARE DESCRIBED BELOW. NO REPRESENTATION IS BEING MADE THAT ANY TRADING ACCOUNT
Counter Trend Trades. (Trading Against The Trend) By Russ Horn
 By Russ Horn") Counter Trend Trades (Trading Against The Trend) By Russ Horn 1 RISK DISCLOSURE STATEMENT / DISCLAIMER AGREEMENT Trading any financial market involves risk. This report and all and any of its contents
Counter Trend Trades (Trading Against The Trend) By Russ Horn 1 RISK DISCLOSURE STATEMENT / DISCLAIMER AGREEMENT Trading any financial market involves risk. This report and all and any of its contents
Publisher: Jeannette L. Briese Insider Capital Group Editor In Chief: Stephen Elliott Briese
 Publisher: Jeannette L. Briese Insider Capital Group Editor In Chief: Stephen Elliott Briese SUBSCRIBER'S GUIDE Insider Futures (IF) and Insider Currencies (IC) were originally designed at the request
Compiled by Timon Rossolimos
 Compiled by Timon Rossolimos - 2 - The Seven Best Forex Indicators -All yours! Dear new Forex trader, Everything we do in life, we do for a reason. Why have you taken time out of your day to read this
The Master Trader Counter-Trend Trade Set-Ups
 The Master Trader Counter-Trend Trade Set-Ups Trading Concepts, Inc. The Master Trader Counter-Trend Trade Set-Ups By Todd Mitchell Copyright 2014 by Trading Concepts, Inc. All Rights Reserved This training
Bullalgo Trading Systems, Inc. Pyramid Matrix User Manual Version 1.0 Manual Revision
 Bullalgo Trading Systems, Inc. Pyramid Matrix User Manual Version 1.0 Manual Revision 20150917 Pyramid Matrix The Pyramid Matrix is a Bullalgo Trading Systems, Inc. add-on Pyramiding strategy that is applicable
Real Life Fibonacci Trading & Dynamic Targeting with MQ Trend
 presented by Thomas Wood MicroQuant SM Divergence Trading Workshop Day One Real Life Fibonacci Trading & Dynamic Targeting with MQ Trend Risk Disclaimer Trading or investing carries a high level of risk,
A unique trading tool designed to help traders visualize and place orders based on market depth and order flow. DepthFinder TradingApp
 A unique trading tool designed to help traders visualize and place orders based on market depth and order flow. DepthFinder TradingApp DepthFinder Trading App for TradeStation Table of Contents Introduction
Multi Account Manager
 Multi Account Manager User Guide Copyright MetaFX,LLC 1 Disclaimer While MetaFX,LLC make every effort to deliver high quality products, we do not guarantee that our products are free from defects. Our
The Glo Blink EA User Manual
 The Glo Blink EA User Manual Disclaimer You agree to indemnify and hold harmless the author, employees, contractors, and service providers of FxGlo. Should any of the practices described herein turn out
TAS Market Profile Charting Package For Tradestation User s Guide, ver 1.2
 TAS Market Profile Charting Package For Tradestation User s Guide, ver 1.2 Table of Contents Introduction Page 3 Installing the TAS Market Profile Charting Package Page 4 Overview Page 9 TAS Boxes Page
DIY Trade Manager Plus
 DIY Trade Manager Plus Version 25.00 User Guide 11 May 2018 1 P a g e Risk Disclosure Statement and Disclaimer Agreement This User Guide ( User Guide ) is for installation and associated illustrative purposes
CONNECING THE DOTS Candlesticks & Convergence of Clues. The Art & Science of Active Trend Trading
 CONNECING THE DOTS Candlesticks & Convergence of Clues The Art & Science of Active Trend Trading Disclaimer U.S. Government Required Disclaimer Commodity Futures Trading Commission Futures and Options
THE CYCLE TRADING PATTERN MANUAL
 TIMING IS EVERYTHING And the use of time cycles can greatly improve the accuracy and success of your trading and/or system. THE CYCLE TRADING PATTERN MANUAL By Walter Bressert There is no magic oscillator
Forexsignal30 Extreme ver. 2 Tutorials
 Forexsignal30 Extreme ver. 2 Tutorials Forexsignal30.com is a manual trading system that is composed of several indicators that mutually cooperate with each other. Very difficult to find indicators that
Crude oil Arrow USER GUIDE
 Crude oil Arrow USER GUIDE The risk of trading can be substantial and each investor and/or trader must consider whether this is a suitable investment. Past performance, whether actual or indicated by simulated
Table of Contents. Risk Disclosure. Things we will be going over. 2 Most Common Chart Layouts Anatomy of a candlestick.
 Table of Contents Risk Disclosure Things we will be going over 2 Most Common Chart Layouts Anatomy of a candlestick Candlestick chart Anatomy of a BAR PLOT Indicators Trend-Lines Volume MACD RSI The Stochastic
Find Elusive MACD Divergences Easily
 Find Elusive MACD Divergences Easily By using a Custom TradeStation Workspace After following these instructions, you will have Charts displaying MACD lines and histogram which highlight price/indicator
DIG Floor Pivots - PRO
 DIG Floor Pivots - PRO Product Manual Full name in TradeStation: _DIG_Floor_Pivots - PRO 1) Parameters a) FloorPivotType(1) : Controls the type of calculation for the floor pivots. (a) Value = 1 : Standard
ATR Trailing Stop - Version 7.0
 ATR Trailing Stop - Version 7.0 Description: The ATR Trailing Stop indicator allows you to see a user defined ATR Trailing Stop on your charts or in RadarScreen. The ATR Trailing Stop indicator can also
Free Forex Midnight Setup Strategy
 Free Forex Midnight Setup Strategy User s Guide Reviewed and recommended by Rita Lasker www.ritalasker.com Read this There are lots of different strategies on the market. We test most of them and want
Divergence and Momentum Trading
 presented by Thomas Wood MicroQuant SM Divergence Trading Workshop Day One Divergence and Momentum Trading Risk Disclaimer Trading or investing carries a high level of risk, and is not suitable for all
Icoachtrader Consulting Service WELCOME TO. Trading Boot Camp. Day 5
 Icoachtrader Consulting Service www.icoachtrader.weebly.com WELCOME TO Trading Boot Camp Day 5 David Ha Ngo Trading Coach Phone: 1.650.899.1088 Email: icoachtrader@gmail.com The information presented is
Russ Horn Presents. Forex Money Bounce
 Presents Forex Money Bounce RISK DISCLOSURE STATEMENT / DISCLAIMER AGREEMENT Trading any financial market involves risk. This report and all and any of its contents are neither a solicitation nor an offer
An Introduction to the Elite Trader Package : Page 3
 An Introduction to the Elite Trader Package : Page 3 - A Recipe for Trading Success: The Two Main Ingredients Page 5 - Maximizing Reward & Minimizing Risk Page 6 - A Complete Trading Solution Page 8 Elite
Technical Analysis Indicators
 Technical Analysis Indicators William s Percent R Rules, Scans, Adding Filters, Breakout, Retest, and Application across MTFs Course Instructor: Price Headley, CFA, CMT BigTrends Coaching Access to BigTrends