6.1 Graphs of Normal Probability Distributions:
|
|
|
- Austin Murphy
- 5 years ago
- Views:
Transcription
1 6.1 Graphs of Normal Probability Distributions: Normal Distribution one of the most important examples of a continuous probability distribution, studied by Abraham de Moivre ( ) and Carl Friedrich Gauss ( ). (Sometimes called the Gaussian distribution.) We could look at a very complicated formula which speaks of the normal distribution, however, we will just look at the graph of a normal distribution to get a better idea of what we are discussing. 1

2 Graph of a Normal Distribution 2

3 Examples Some Facts to Realize About Normal Curves: 1) The mean and standard deviation have no influence on each other. So, a curve with a large mean need not have a large standard deviation. 2) If a curve is very spread out, it then has a large standard deviation, and vice versa. 3
4 Examples: Sketch the following curves given the information below. Label everything, including transition points.: a) Mean of 24 and Standard Deviation of 11. b) Mean of 19 and Standard Deviation of 6. c) Mean of 111 and Standard Deviation of 10. d) Mean of and Standard Deviation of 9. e) Mean of 20 and Standard Deviation of
5 5
6 Example 6
7 7
8 8
9 9
10 10


11 6.2 Standard Units and Areas Under the Standard Normal Distribution: There is a simple formula that we can use to compute the number z of standard deviations between a measurement x and the mean µ of a normal distribution with standard deviation σ: Definition: The z value or z scores tells us the number of standard deviations the original measurement is from the mean. The z value is in standard units. The mean of the original distribution is always zero, in standard units, which makes sense because the mean is zero standard variations from itself. An x value in the original distribution that is above the mean μ has a corresponding z value that is positive. Again, this makes sense because a measurement above the mean would be a positive number of standard deviations from the mean. Likewise, an x value below the mean has a negative z value. (See below!) 11
12 Examples: 1) Lewis earned 85 on his biology midterm and 81 on his history midterm. However, in the biology class the mean score was 79 with standard deviation 5. In the history class the mean score was 76 with standard deviation 3. a) Convert the biology score to a standard score. b) Convert the history score to a standard score. c) Which score was higher with respect to the rest of the class? 2) Bill earned an 88 on his math final exam and an 85 on his history final exam. The mean score in the math class was 85 and the mean score in the history class was 88. The standard deviation in the math class was 3 and in the history class was 6. a) Convert the math score to standard units. b) Convert the history score to standard units. c) Which score was higher with respect to the rest of the class? 3) Pam earned a 124 on his psychology midterm and an 87 on his foreign language midterm. The average score in accounting was a 102 with a standard deviation of 4.5. The average score in foreign language was 85 with a standard deviation of 2. a) Convert the psychology score to standard units. b) Convert the foreign language score to standard units. c) Which score is higher with respect to the rest of the class? 4) Sal is on two bowling teams. On his first team, he scored a 212. This team had a team average of 242 with a standard deviation of 10. For his second team, Sal bowled a 197. This team averaged 174 with a standard deviation of 3. a) Convert Sal s first score to standard units. b) Convert Sal s second score to standard units. c) Which score is higher with respect to the rest of the team? 12
13 Raw Score: We can convert our formula for z score to a different formula that is helpful when we already know the z score but are looking for the measurement: x = zσ + μ In many testing situations we hear the term raw score and z score. The raw score is just the score in the original measuring units, and the z score is the score in standard units. Examples: 1) Troy took a standardized test to try to get credit for first year Spanish by examination. If he got credit by exam, he would not need to take the courses. The standardized score was reported. His standardized score was 1.9. The mean score on the exam was 100 with standard deviation 12. a) What was Troy s raw score? b) The language department requires a raw score of 117 to get credit by examination for first year Spanish. Will Troy get credit based on this exam? 2) Sam s z score on her college entrance exam is 1.7. If the raw scores have a mean of 364 and a standard deviation of 60 points, what is her raw score? 3) On a standardized test, Phil s z score is If the raw scores have a mean of 364 and a standard deviation of 22 points, what is his raw score? 4) Amanda is a court reporter. She currently types 1.2 as a z score. If the raw scores of all court reporters across the nation average 222 with a standard deviation of 4, what is her raw score? 13
14 Standard Units and Raw Scores: When looking at a range of scores, you should calculate the z score for both the upper limit and lower limit, and then set up an inequality to evaluate your data. Examples: 1) In a class the final exam scores are normally distributed with a mean score of 82 and a standard deviation of 6. What percent of the exams are between 76 and 88? 2) In a class the final exam scores are distributed with a mean score of 85 and a standard deviation of 10 points. The B exams have scores ranging from 76 to 89. What are these scores in standard units? Indicate the possible z scores on a number line. 3) A professor gives A s to students in the class who have scores ranging from 91 to 99. The average score in the class is 88 with a standard deviation of 3. What are the z scores for the A students? Indicate the possible z scores on a number line. 4) Students in Dr. Z s class receive D s if they have grades of 66 to 74. The average score in the class is 90 with a standard deviation of 2. What are the z scores of the D students? Indicate the possible z scores on a number line. 5) Let x represent the life of a 60 watt light bulb. The x distribution has a mean of 1,000 hours with standard deviation of 75 hours. Convert each of the following x intervals into standard z intervals. a) 450 < x <1,350 b) 900 < x <1,100 c) 990 < x <1,010 d) 500 < x e) x < 300 f) x < 1,200 6) Let x represent the average miles per gallon of gasoline that owners get from their new Nissan automobile. For this model the mean of the x distribution is advertised to be 44 mpg, with standard deviation of 6 mpg. Convert each of the following x intervals to standard z intervals. a) x > 44 b) 40 < x < 50 c) 32 < x < 39 7) A high school counselor was given the following z intervals concerning a vocational training aptitude test. The test scores had a mean of 450 points and a standard deviation of 35 points. Convert each x interval into an x test score interval. a) 1.14 < z < 2.27 b) z < 2.58 c) < z 14

15 Areas Under the Standard Normal Curve: The advantage of converting any normal distribution to the standard normal distribution is that there are extensive tables that show the area under the standard normal curve for almost any interval along the z axis. The areas are important because they are equal to the probability that the measurement of an item selected at random falls in this interval. Thus the standard normal distribution can be useful. 15

, the second part being the hundredths digit (ex. 0.07).")

16 We must know how to use Table 6 of Appendix II. To do so take the highest value of z and break it down into two parts. The first part being the whole number, the decimal, and the tenths digit (ex. 2.9), the second part being the hundredths digit (ex. 0.07). Now, just look it up on the chart using the first part in the vertical column and the second part in the horizontal column. Since the normal curve is symmetrical about its mean, we can use Table 6 of Appendix II to find an area under the curve between a negative z value and 0 just in the same way we do positive values. 16

17 Example 17
18 Find the Areas Using the Table 18
19 6.3 Areas Under Any Normal Curve: Converting Normal Distributions to Standard Normal: In many applied situations, the original normal curve is not the standard normal curve. Generally, there will not be a table of areas available for the original normal curve. This does not mean that we cannot find the probability that a measurement x will fall in an interval from a to b. What we must do is convert original measurements x, a, and b to z values. 19
20 20

21 Examples 21

 2ND VARS: Choose Option 2: normalcdf( 2)")
 *If you aren't given an")
22 Calculator Instructions You can find the percent of a certain interval of the data by using your calculator. 1) 2ND VARS: Choose Option 2: normalcdf( 2) normalcdf(lower number, upper number, mean, standard deviation) *If you aren't given an upper or a lower number, use , or
23 23
24 24
25 25

26 Center Case Right Tail Case 26

27 Examples 27
28 Calculator Instructions 28

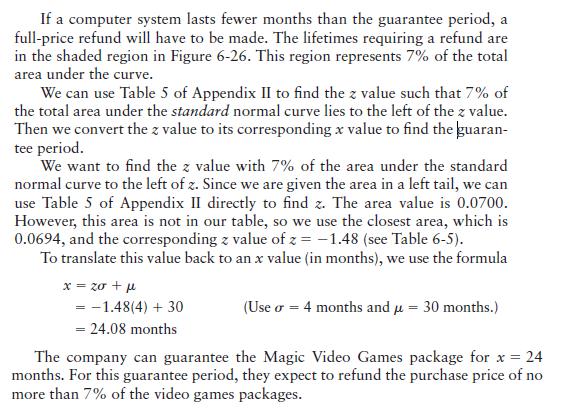
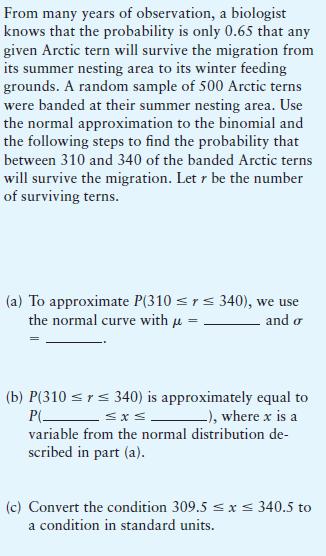
29 6.4 Normal Approximation to the Binomial Distribution: 29

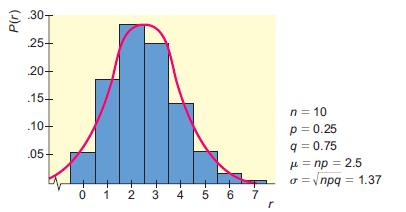
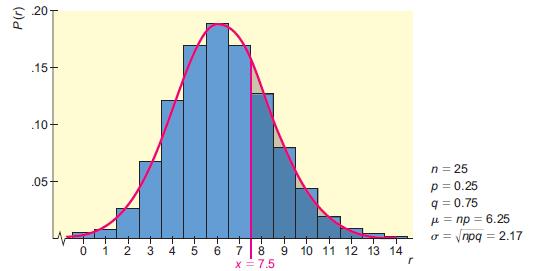
30 n = 3 n = 10 n = 25 n = 50 30

31 Converting r Values to x Values Remember that when using the normal distribution to approximate the binomial, we are computing the areas under bars. The bar over r goes from r 0.5 to r If r is a left endpoint of an interval, we subtract 0.5 to get the corresponding normal variable x. If r is a right endpoint of an interval, we add 0.5 to get the corresponding variable x. 31
32 32
33 33
34 34
The Normal Probability Distribution
 1 The Normal Probability Distribution Key Definitions Probability Density Function: An equation used to compute probabilities for continuous random variables where the output value is greater than zero
Since his score is positive, he s above average. Since his score is not close to zero, his score is unusual.
 Chapter 06: The Standard Deviation as a Ruler and the Normal Model This is the worst chapter title ever! This chapter is about the most important random variable distribution of them all the normal distribution.
Math 2311 Bekki George Office Hours: MW 11am to 12:45pm in 639 PGH Online Thursdays 4-5:30pm And by appointment
 Math 2311 Bekki George bekki@math.uh.edu Office Hours: MW 11am to 12:45pm in 639 PGH Online Thursdays 4-5:30pm And by appointment Class webpage: http://www.math.uh.edu/~bekki/math2311.html Math 2311 Class
Section Distributions of Random Variables
 Section 8.1 - Distributions of Random Variables Definition: A random variable is a rule that assigns a number to each outcome of an experiment. Example 1: Suppose we toss a coin three times. Then we could
Statistics 511 Supplemental Materials
 Gaussian (or Normal) Random Variable In this section we introduce the Gaussian Random Variable, which is more commonly referred to as the Normal Random Variable. This is a random variable that has a bellshaped
Chapter 7 1. Random Variables
 Chapter 7 1 Random Variables random variable numerical variable whose value depends on the outcome of a chance experiment - discrete if its possible values are isolated points on a number line - continuous
Unit 2: Statistics Probability
 Applied Math 30 3-1: Distributions Probability Distribution: - a table or a graph that displays the theoretical probability for each outcome of an experiment. - P (any particular outcome) is between 0
Chapter 6 Confidence Intervals Section 6-1 Confidence Intervals for the Mean (Large Samples) Estimating Population Parameters
 Estimating Population Parameters") Chapter 6 Confidence Intervals Section 6-1 Confidence Intervals for the Mean (Large Samples) Estimating Population Parameters VOCABULARY: Point Estimate a value for a parameter. The most point estimate
Chapter 6 Confidence Intervals Section 6-1 Confidence Intervals for the Mean (Large Samples) Estimating Population Parameters VOCABULARY: Point Estimate a value for a parameter. The most point estimate
Chapter 6 Confidence Intervals
 Chapter 6 Confidence Intervals Section 6-1 Confidence Intervals for the Mean (Large Samples) VOCABULARY: Point Estimate A value for a parameter. The most point estimate of the population parameter is the
Version A. Problem 1. Let X be the continuous random variable defined by the following pdf: 1 x/2 when 0 x 2, f(x) = 0 otherwise.
 = 0 otherwise.") Math 224 Q Exam 3A Fall 217 Tues Dec 12 Version A Problem 1. Let X be the continuous random variable defined by the following pdf: { 1 x/2 when x 2, f(x) otherwise. (a) Compute the mean µ E[X]. E[X] x
Math 224 Q Exam 3A Fall 217 Tues Dec 12 Version A Problem 1. Let X be the continuous random variable defined by the following pdf: { 1 x/2 when x 2, f(x) otherwise. (a) Compute the mean µ E[X]. E[X] x
STAT Chapter 5: Continuous Distributions. Probability distributions are used a bit differently for continuous r.v. s than for discrete r.v. s.
 STAT 515 -- Chapter 5: Continuous Distributions Probability distributions are used a bit differently for continuous r.v. s than for discrete r.v. s. Continuous distributions typically are represented by
Making Sense of Cents
 Name: Date: Making Sense of Cents Exploring the Central Limit Theorem Many of the variables that you have studied so far in this class have had a normal distribution. You have used a table of the normal
Fall 2011 Exam Score: /75. Exam 3
 Math 12 Fall 2011 Name Exam Score: /75 Total Class Percent to Date Exam 3 For problems 1-10, circle the letter next to the response that best answers the question or completes the sentence. You do not
Section Distributions of Random Variables
 Section 8.1 - Distributions of Random Variables Definition: A random variable is a rule that assigns a number to each outcome of an experiment. Example 1: Suppose we toss a coin three times. Then we could
CH 5 Normal Probability Distributions Properties of the Normal Distribution
 Properties of the Normal Distribution Example A friend that is always late. Let X represent the amount of minutes that pass from the moment you are suppose to meet your friend until the moment your friend
Normal Distribution: Introduction
 Connexions module: m16979 1 Normal Distribution: Introduction Susan Dean Barbara Illowsky, Ph.D. This work is produced by The Connexions Project and licensed under the Creative Commons Attribution License
The Binomial Distribution
 The Binomial Distribution Properties of a Binomial Experiment 1. It consists of a fixed number of observations called trials. 2. Each trial can result in one of only two mutually exclusive outcomes labeled
11.5: Normal Distributions
 11.5: Normal Distributions 11.5.1 Up to now, we ve dealt with discrete random variables, variables that take on only a finite (or countably infinite we didn t do these) number of values. A continuous random
Statistical Methods in Practice STAT/MATH 3379
 Statistical Methods in Practice STAT/MATH 3379 Dr. A. B. W. Manage Associate Professor of Mathematics & Statistics Department of Mathematics & Statistics Sam Houston State University Overview 6.1 Discrete
ECON 214 Elements of Statistics for Economists
 ECON 214 Elements of Statistics for Economists Session 7 The Normal Distribution Part 1 Lecturer: Dr. Bernardin Senadza, Dept. of Economics Contact Information: bsenadza@ug.edu.gh College of Education
1/12/2011. Chapter 5: z-scores: Location of Scores and Standardized Distributions. Introduction to z-scores. Introduction to z-scores cont.
 Chapter 5: z-scores: Location of Scores and Standardized Distributions Introduction to z-scores In the previous two chapters, we introduced the concepts of the mean and the standard deviation as methods
NOTES: Chapter 4 Describing Data
 NOTES: Chapter 4 Describing Data Intro to Statistics COLYER Spring 2017 Student Name: Page 2 Section 4.1 ~ What is Average? Objective: In this section you will understand the difference between the three
Statistics, Measures of Central Tendency I
 Statistics, Measures of Central Tendency I We are considering a random variable X with a probability distribution which has some parameters. We want to get an idea what these parameters are. We perfom
The Normal Distribution
 5.1 Introduction to Normal Distributions and the Standard Normal Distribution Section Learning objectives: 1. How to interpret graphs of normal probability distributions 2. How to find areas under the
ECON 214 Elements of Statistics for Economists 2016/2017
 ECON 214 Elements of Statistics for Economists 2016/2017 Topic The Normal Distribution Lecturer: Dr. Bernardin Senadza, Dept. of Economics bsenadza@ug.edu.gh College of Education School of Continuing and
8.3 CI for μ, σ NOT known (old 8.4)
") GOALS: 1. Learn the properties of the student t distribution and the t curve. 2. Understand how degrees of freedom, df, relate to t curves. 3. Recognize that t curves approach the SNC as df increases.
GOALS: 1. Learn the properties of the student t distribution and the t curve. 2. Understand how degrees of freedom, df, relate to t curves. 3. Recognize that t curves approach the SNC as df increases.
8.2 The Standard Deviation as a Ruler Chapter 8 The Normal and Other Continuous Distributions 8-1
 8.2 The Standard Deviation as a Ruler Chapter 8 The Normal and Other Continuous Distributions For Example: On August 8, 2011, the Dow dropped 634.8 points, sending shock waves through the financial community.
Chapter 6. The Normal Probability Distributions
 Chapter 6 The Normal Probability Distributions 1 Chapter 6 Overview Introduction 6-1 Normal Probability Distributions 6-2 The Standard Normal Distribution 6-3 Applications of the Normal Distribution 6-5
Section Random Variables and Histograms
 Section 3.1 - Random Variables and Histograms Definition: A random variable is a rule that assigns a number to each outcome of an experiment. Example 1: Suppose we toss a coin three times. Then we could
5.1 Mean, Median, & Mode
 5.1 Mean, Median, & Mode definitions Mean: Median: Mode: Example 1 The Blue Jays score these amounts of runs in their last 9 games: 4, 7, 2, 4, 10, 5, 6, 7, 7 Find the mean, median, and mode: Example 2
Statistics Class 15 3/21/2012
 Statistics Class 15 3/21/2012 Quiz 1. Cans of regular Pepsi are labeled to indicate that they contain 12 oz. Data Set 17 in Appendix B lists measured amounts for a sample of Pepsi cans. The same statistics
Section 3.4 The Normal Distribution
 Section 3.4 The Normal Distribution Properties of the Normal Distribution Curve 1. We denote the normal random variable with X = x. 2. The curve has a peak at x = µ. 3. The curve is symmetric about the
The Mathematics of Normality
 MATH 110 Week 9 Chapter 17 Worksheet The Mathematics of Normality NAME Normal (bell-shaped) distributions play an important role in the world of statistics. One reason the normal distribution is important
Using the Central Limit Theorem It is important for you to understand when to use the CLT. If you are being asked to find the probability of the
 Using the Central Limit Theorem It is important for you to understand when to use the CLT. If you are being asked to find the probability of the mean, use the CLT for the mean. If you are being asked to
IOP 201-Q (Industrial Psychological Research) Tutorial 5
 Tutorial 5") IOP 201-Q (Industrial Psychological Research) Tutorial 5 TRUE/FALSE [1 point each] Indicate whether the sentence or statement is true or false. 1. To establish a cause-and-effect relation between two variables,
IOP 201-Q (Industrial Psychological Research) Tutorial 5 TRUE/FALSE [1 point each] Indicate whether the sentence or statement is true or false. 1. To establish a cause-and-effect relation between two variables,
Lecture 9. Probability Distributions. Outline. Outline
 Outline Lecture 9 Probability Distributions 6-1 Introduction 6- Probability Distributions 6-3 Mean, Variance, and Expectation 6-4 The Binomial Distribution Outline 7- Properties of the Normal Distribution
Both the quizzes and exams are closed book. However, For quizzes: Formulas will be provided with quiz papers if there is any need.
 Both the quizzes and exams are closed book. However, For quizzes: Formulas will be provided with quiz papers if there is any need. For exams (MD1, MD2, and Final): You may bring one 8.5 by 11 sheet of
Lecture 9. Probability Distributions
 Lecture 9 Probability Distributions Outline 6-1 Introduction 6-2 Probability Distributions 6-3 Mean, Variance, and Expectation 6-4 The Binomial Distribution Outline 7-2 Properties of the Normal Distribution
A probability distribution shows the possible outcomes of an experiment and the probability of each of these outcomes.
 Introduction In the previous chapter we discussed the basic concepts of probability and described how the rules of addition and multiplication were used to compute probabilities. In this chapter we expand
Chapter 3. Lecture 3 Sections
 Chapter 3 Lecture 3 Sections 3.4 3.5 Measure of Position We would like to compare values from different data sets. We will introduce a z score or standard score. This measures how many standard deviation
Chapter 6 Analyzing Accumulated Change: Integrals in Action
 Chapter 6 Analyzing Accumulated Change: Integrals in Action 6. Streams in Business and Biology You will find Excel very helpful when dealing with streams that are accumulated over finite intervals. Finding
7.1 Graphs of Normal Probability Distributions
 7 Normal Distributions In Chapter 6, we looked at the distributions of discrete random variables in particular, the binomial. Now we turn out attention to continuous random variables in particular, the
Central Limit Theorem
 Central Limit Theorem Lots of Samples 1 Homework Read Sec 6-5. Discussion Question pg 329 Do Ex 6-5 8-15 2 Objective Use the Central Limit Theorem to solve problems involving sample means 3 Sample Means
Week 7. Texas A& M University. Department of Mathematics Texas A& M University, College Station Section 3.2, 3.3 and 3.4
 Week 7 Oğuz Gezmiş Texas A& M University Department of Mathematics Texas A& M University, College Station Section 3.2, 3.3 and 3.4 Oğuz Gezmiş (TAMU) Topics in Contemporary Mathematics II Week7 1 / 19
Statistical Intervals (One sample) (Chs )
 (Chs )") 7 Statistical Intervals (One sample) (Chs 8.1-8.3) Confidence Intervals The CLT tells us that as the sample size n increases, the sample mean X is close to normally distributed with expected value µ and
7 Statistical Intervals (One sample) (Chs 8.1-8.3) Confidence Intervals The CLT tells us that as the sample size n increases, the sample mean X is close to normally distributed with expected value µ and
Chapter 5 Normal Probability Distributions
 Chapter 5 Normal Probability Distributions Section 5-1 Introduction to Normal Distributions and the Standard Normal Distribution A The normal distribution is the most important of the continuous probability
As you draw random samples of size n, as n increases, the sample means tend to be normally distributed.
 The Central Limit Theorem The central limit theorem (clt for short) is one of the most powerful and useful ideas in all of statistics. The clt says that if we collect samples of size n with a "large enough
8.1 Estimation of the Mean and Proportion
 8.1 Estimation of the Mean and Proportion Statistical inference enables us to make judgments about a population on the basis of sample information. The mean, standard deviation, and proportions of a population
When the observations of a quantitative random variable can take on only a finite number of values, or a countable number of values.
 5.1 Introduction to Random Variables and Probability Distributions Statistical Experiment - any process by which an observation (or measurement) is obtained. Examples: 1) Counting the number of eggs in
Applications of Data Dispersions
 1 Applications of Data Dispersions Key Definitions Standard Deviation: The standard deviation shows how far away each value is from the mean on average. Z-Scores: The distance between the mean and a given
Continuous Distributions
 Quantitative Methods 2013 Continuous Distributions 1 The most important probability distribution in statistics is the normal distribution. Carl Friedrich Gauss (1777 1855) Normal curve A normal distribution
The topics in this section are related and necessary topics for both course objectives.
 2.5 Probability Distributions The topics in this section are related and necessary topics for both course objectives. A probability distribution indicates how the probabilities are distributed for outcomes
The Central Limit Theorem for Sample Means (Averages)
") The Central Limit Theorem for Sample Means (Averages) By: OpenStaxCollege Suppose X is a random variable with a distribution that may be known or unknown (it can be any distribution). Using a subscript
The Central Limit Theorem for Sample Means (Averages) By: OpenStaxCollege Suppose X is a random variable with a distribution that may be known or unknown (it can be any distribution). Using a subscript
Section Introduction to Normal Distributions
 Section 6.1-6.2 Introduction to Normal Distributions 2012 Pearson Education, Inc. All rights reserved. 1 of 105 Section 6.1-6.2 Objectives Interpret graphs of normal probability distributions Find areas
Section 3.5a Applying the Normal Distribution MDM4U Jensen
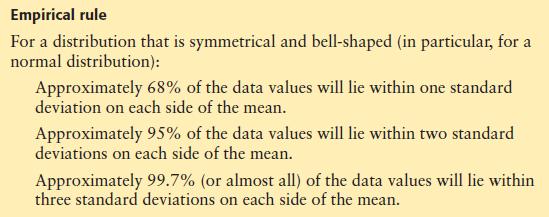
 Section 3.5a Applying the Normal Distribution MDM4U Jensen Part 1: Normal Distribution Video While watching the video, answer the following questions 1. What is another name for the Empirical rule? The
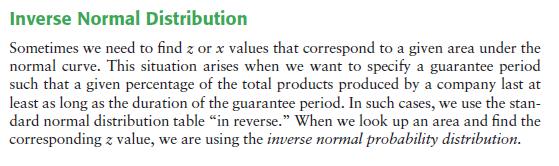
Inverse Normal Distribution and Approximation to Binomial
 Inverse Normal Distribution and Approximation to Binomial Section 5.5 Cathy Poliak, Ph.D. cathy@math.uh.edu Office in Fleming 11c Department of Mathematics University of Houston Lecture 16-3339 Cathy Poliak,
Math 227 Elementary Statistics. Bluman 5 th edition
 Math 227 Elementary Statistics Bluman 5 th edition CHAPTER 6 The Normal Distribution 2 Objectives Identify distributions as symmetrical or skewed. Identify the properties of the normal distribution. Find
Chapter Seven: Confidence Intervals and Sample Size
 Chapter Seven: Confidence Intervals and Sample Size A point estimate is: The best point estimate of the population mean µ is the sample mean X. Three Properties of a Good Estimator 1. Unbiased 2. Consistent
STAT:2010 Statistical Methods and Computing. Using density curves to describe the distribution of values of a quantitative
 STAT:10 Statistical Methods and Computing Normal Distributions Lecture 4 Feb. 6, 17 Kate Cowles 374 SH, 335-0727 kate-cowles@uiowa.edu 1 2 Using density curves to describe the distribution of values of
STT 315 Practice Problems Chapter 3.7 and 4
 STT 315 Practice Problems Chapter 3.7 and 4 Answer the question True or False. 1) The number of children in a family can be modelled using a continuous random variable. 2) For any continuous probability
Lecture 8. The Binomial Distribution. Binomial Distribution. Binomial Distribution. Probability Distributions: Normal and Binomial
 Lecture 8 The Binomial Distribution Probability Distributions: Normal and Binomial 1 2 Binomial Distribution >A binomial experiment possesses the following properties. The experiment consists of a fixed
Focus Points 10/11/2011. The Binomial Probability Distribution and Related Topics. Additional Properties of the Binomial Distribution. Section 5.
 The Binomial Probability Distribution and Related Topics 5 Copyright Cengage Learning. All rights reserved. Section 5.3 Additional Properties of the Binomial Distribution Copyright Cengage Learning. All
Set up a normal distribution curve, to help estimate the percent of the band that, on average, practices a greater number of hours than Alexis.
 Section 5.5 Z-Scores Example 1 Alexis plays in her school jazz band. Band members practice an average of 16.5 h per week, with a standard deviation of 4.2 h. Alexis practices an average of 22 h per week.
The "bell-shaped" curve, or normal curve, is a probability distribution that describes many real-life situations.
 6.1 6.2 The Standard Normal Curve The "bell-shaped" curve, or normal curve, is a probability distribution that describes many real-life situations. Basic Properties 1. The total area under the curve is.
Expected Value of a Random Variable
 Knowledge Article: Probability and Statistics Expected Value of a Random Variable Expected Value of a Discrete Random Variable You're familiar with a simple mean, or average, of a set. The mean value of
2 DESCRIPTIVE STATISTICS
 Chapter 2 Descriptive Statistics 47 2 DESCRIPTIVE STATISTICS Figure 2.1 When you have large amounts of data, you will need to organize it in a way that makes sense. These ballots from an election are rolled
a) Less than 0.66 b) Greater than 0.74 c) Between 0.64 and 0.76
 Less than 0.66 b) Greater than 0.74 c) Between 0.64 and 0.76") Example #7 According to a National Sleep Foundation Survey, 70% of adults takes more than 30 minutes to fall asleep at night. Assume that this percentage is true for the population of all U.S. adults.
Example #7 According to a National Sleep Foundation Survey, 70% of adults takes more than 30 minutes to fall asleep at night. Assume that this percentage is true for the population of all U.S. adults.
THE UNIVERSITY OF TEXAS AT AUSTIN Department of Information, Risk, and Operations Management
 THE UNIVERSITY OF TEXAS AT AUSTIN Department of Information, Risk, and Operations Management BA 386T Tom Shively PROBABILITY CONCEPTS AND NORMAL DISTRIBUTIONS The fundamental idea underlying any statistical
Derived copy of Using the Normal Distribution *
 OpenStax-CNX module: m62375 1 Derived copy of Using the Normal Distribution * Cindy Sun Based on Using the Normal Distribution by OpenStax This work is produced by OpenStax-CNX and licensed under the Creative
Consumer Guide Dealership Word of Mouth Internet
 8.1 Graphing Data In this chapter, we will study techniques for graphing data. We will see the importance of visually displaying large sets of data so that meaningful interpretations of the data can be
DATA HANDLING Five-Number Summary
 DATA HANDLING Five-Number Summary The five-number summary consists of the minimum and maximum values, the median, and the upper and lower quartiles. The minimum and the maximum are the smallest and greatest
5.4 Normal Approximation of the Binomial Distribution
 5.4 Normal Approximation of the Binomial Distribution Bernoulli Trials have 3 properties: 1. Only two outcomes - PASS or FAIL 2. n identical trials Review from yesterday. 3. Trials are independent - probability
Law of Large Numbers, Central Limit Theorem
 November 14, 2017 November 15 18 Ribet in Providence on AMS business. No SLC office hour tomorrow. Thursday s class conducted by Teddy Zhu. November 21 Class on hypothesis testing and p-values December
5.1 Personal Probability
 5. Probability Value Page 1 5.1 Personal Probability Although we think probability is something that is confined to math class, in the form of personal probability it is something we use to make decisions
Statistical Intervals. Chapter 7 Stat 4570/5570 Material from Devore s book (Ed 8), and Cengage
, and Cengage") 7 Statistical Intervals Chapter 7 Stat 4570/5570 Material from Devore s book (Ed 8), and Cengage Confidence Intervals The CLT tells us that as the sample size n increases, the sample mean X is close to
7 Statistical Intervals Chapter 7 Stat 4570/5570 Material from Devore s book (Ed 8), and Cengage Confidence Intervals The CLT tells us that as the sample size n increases, the sample mean X is close to
INFERENTIAL STATISTICS REVISION
 INFERENTIAL STATISTICS REVISION PREMIUM VERSION PREVIEW WWW.MATHSPOINTS.IE/SIGN-UP/ 2016 LCHL Paper 2 Question 9 (a) (i) Data on earnings were published for a particular country. The data showed that the
Chapter 4 Random Variables & Probability. Chapter 4.5, 6, 8 Probability Distributions for Continuous Random Variables
 Chapter 4.5, 6, 8 Probability for Continuous Random Variables Discrete vs. continuous random variables Examples of continuous distributions o Uniform o Exponential o Normal Recall: A random variable =
Binomial and Normal Distributions. Example: Determine whether the following experiments are binomial experiments. Explain.
 Binomial and Normal Distributions Objective 1: Determining if an Experiment is a Binomial Experiment For an experiment to be considered a binomial experiment, four things must hold: 1. The experiment is
MAKING SENSE OF DATA Essentials series
 MAKING SENSE OF DATA Essentials series THE NORMAL DISTRIBUTION Copyright by City of Bradford MDC Prerequisites Descriptive statistics Charts and graphs The normal distribution Surveys and sampling Correlation
Standard Normal, Inverse Normal and Sampling Distributions
 Standard Normal, Inverse Normal and Sampling Distributions Section 5.5 & 6.6 Cathy Poliak, Ph.D. cathy@math.uh.edu Office in Fleming 11c Department of Mathematics University of Houston Lecture 9-3339 Cathy
The probability of having a very tall person in our sample. We look to see how this random variable is distributed.
 Distributions We're doing things a bit differently than in the text (it's very similar to BIOL 214/312 if you've had either of those courses). 1. What are distributions? When we look at a random variable,
Section 7.5 The Normal Distribution. Section 7.6 Application of the Normal Distribution
 Section 7.6 Application of the Normal Distribution A random variable that may take on infinitely many values is called a continuous random variable. A continuous probability distribution is defined by
Confidence Intervals and Sample Size
 Confidence Intervals and Sample Size Chapter 6 shows us how we can use the Central Limit Theorem (CLT) to 1. estimate a population parameter (such as the mean or proportion) using a sample, and. determine
Standard Normal Calculations
 Standard Normal Calculations Section 4.3 Cathy Poliak, Ph.D. cathy@math.uh.edu Office in Fleming 11c Department of Mathematics University of Houston Lecture 10-2311 Cathy Poliak, Ph.D. cathy@math.uh.edu
Dot Plot: A graph for displaying a set of data. Each numerical value is represented by a dot placed above a horizontal number line.
 Introduction We continue our study of descriptive statistics with measures of dispersion, such as dot plots, stem and leaf displays, quartiles, percentiles, and box plots. Dot plots, a stem-and-leaf display,
Normal distribution. We say that a random variable X follows the normal distribution if the probability density function of X is given by
 Normal distribution The normal distribution is the most important distribution. It describes well the distribution of random variables that arise in practice, such as the heights or weights of people,
The Standard Deviation as a Ruler and the Normal Model. Copyright 2009 Pearson Education, Inc.
 The Standard Deviation as a Ruler and the Normal Mol Copyright 2009 Pearson Education, Inc. The trick in comparing very different-looking values is to use standard viations as our rulers. The standard
Introduction to Business Statistics QM 120 Chapter 6
 DEPARTMENT OF QUANTITATIVE METHODS & INFORMATION SYSTEMS Introduction to Business Statistics QM 120 Chapter 6 Spring 2008 Chapter 6: Continuous Probability Distribution 2 When a RV x is discrete, we can
Solutions for practice questions: Chapter 15, Probability Distributions If you find any errors, please let me know at
 Solutions for practice questions: Chapter 15, Probability Distributions If you find any errors, please let me know at mailto:msfrisbie@pfrisbie.com. 1. Let X represent the savings of a resident; X ~ N(3000,
Chapter 4 Continuous Random Variables and Probability Distributions
 Chapter 4 Continuous Random Variables and Probability Distributions Part 2: More on Continuous Random Variables Section 4.5 Continuous Uniform Distribution Section 4.6 Normal Distribution 1 / 27 Continuous
CHAPTER 6 Random Variables
 CHAPTER 6 Random Variables 6.2 Transforming and Combining Random Variables The Practice of Statistics, 5th Edition Starnes, Tabor, Yates, Moore Bedford Freeman Worth Publishers 6.2 Reading Quiz (T or F)
Name: Date: Period: Activity 4.3.1: What is Slope?
 Name: Date: Period: Activity 4.3.: What is Slope? What is slope? If you have ever walked up or down a hill, then you have already experienced a real life example of slope. Keeping this fact in mind, by
The Normal Distribution
 Stat 6 Introduction to Business Statistics I Spring 009 Professor: Dr. Petrutza Caragea Section A Tuesdays and Thursdays 9:300:50 a.m. Chapter, Section.3 The Normal Distribution Density Curves So far we
AP * Statistics Review
 AP * Statistics Review Normal Models and Sampling Distributions Teacher Packet AP* is a trademark of the College Entrance Examination Board. The College Entrance Examination Board was not involved in the
Midterm Exam III Review
 Midterm Exam III Review Dr. Joseph Brennan Math 148, BU Dr. Joseph Brennan (Math 148, BU) Midterm Exam III Review 1 / 25 Permutations and Combinations ORDER In order to count the number of possible ways
7 THE CENTRAL LIMIT THEOREM
 CHAPTER 7 THE CENTRAL LIMIT THEOREM 373 7 THE CENTRAL LIMIT THEOREM Figure 7.1 If you want to figure out the distribution of the change people carry in their pockets, using the central limit theorem and
AP Statistics Chapter 6 - Random Variables
 AP Statistics Chapter 6 - Random 6.1 Discrete and Continuous Random Objective: Recognize and define discrete random variables, and construct a probability distribution table and a probability histogram
MLLunsford 1. Activity: Central Limit Theorem Theory and Computations
 MLLunsford 1 Activity: Central Limit Theorem Theory and Computations Concepts: The Central Limit Theorem; computations using the Central Limit Theorem. Prerequisites: The student should be familiar with
STAB22 section 1.3 and Chapter 1 exercises
 STAB22 section 1.3 and Chapter 1 exercises 1.101 Go up and down two times the standard deviation from the mean. So 95% of scores will be between 572 (2)(51) = 470 and 572 + (2)(51) = 674. 1.102 Same idea
Econ 250 Fall Due at November 16. Assignment 2: Binomial Distribution, Continuous Random Variables and Sampling
 Econ 250 Fall 2010 Due at November 16 Assignment 2: Binomial Distribution, Continuous Random Variables and Sampling 1. Suppose a firm wishes to raise funds and there are a large number of independent financial