DBFS RESEARCH. Mindtree Ltd. StRating - BUY. CMP - 1, Target Price - 1,416
|
|
|
- Katrina Gibbs
- 5 years ago
- Views:
Transcription
1 CMP - 1, Target Price - 1,416 Associate of Doha Bank EQUITIES INDIA Computer Software Analyst : Nina Sundaran research@dbfsindia.com Phone : StRating - BUY Stock Bloomberg Code Reuters Code Information MTCL: Natl India MINT.NS BSE Code NSE Code ISIN Equity Shares (m) Week Range(INR) MINDTREE INE018I /831 M.Cap. (INR b) M.Cap. (USD b) 1.6 Free float market cap (Crs) Sector Shareholding Pattern (%) COMPUTERS - SOFTWARE Sep14 Dec14 Mar15 Indian Promoter Foreign Promoter DII FII Others Stock Performance (6-Months) Mindtree's Q1 earnings surpassed expectations... Mindtree's Q1 earnings matched the street expectations. Company's net profit was reported at Rs Cr which showed a growth of 7.4% Q-o-Q led by forex gains despite lower margins. Revenue increased by 6.9 percent Q-o-Q to Rs Cr as compared to Rs Cr and the company have also crossed USD 150 million in revenues. Company's strategic pillars gives a positive outlook : While analyzing the recent past, we can witness the uncertainty and volatility in world economic markets. But the company with its disruptive technologies and evolving customer requirements helps to enable the company to grow faster and generate higher returns for the company's shareholders. Their focused approach helped them to deliver an industry leading performance with a revenue growth of 16.4% for FY and their customer satisfaction levels are at a record three year high. The company expect that they can sustain the growth in FY16 also. The pillars includes the following; Digital Transformation : Mindtree was born digital. They are helping the clients by using digital tools to elevate customer experiences, build streamlined technology solutions, and bring products and services to market faster in a cost-effective manner. Employer of Choice : Mindtree is providing a nondiscriminatory working environment and equal employment opportunities to employees. The employees wellness and wellbeing and their safe working environment vision guides the company keeping on the right track. Customer Centricity : Mindtree is always focused on the customer needs and this enabled them to become the partner of choice for their clients. With their new technologies such as cloud apps, machine intelligence and connected smart devices makes them stand out in the market place. Delivery Excellence : Mindtree is providing next generation delivery platform and with their digitalization, increased usage of automation and agile principles ensures their excellence in industry.
2 Financial snap shot Y/E March (Rs Cr) FY15 FY16E FY17E FY18E Net Sales 3, , , ,672.6 EBITDA , ,303.7 PAT EPS (INR) Growth (%) BV/Sh. (INR) RoE (%) RoCE (%) P/E (x) P/BV (x) Valuation Y/E March (Rs Cr) FY15 FY16E FY17E FY18E Book Value (Rs) Change (%) Price-BV (x) EPS (Rs) Change (%) Price-Earnings (x) Dividend Per Share Dividend Yield (%) Valuation is trading at INR 1,225.5 and we arrived at a target price of INR 1,416 by using DCF method of Gordon growth model implies an upside of 15% from the CMP. Currently trades at 18.9x FY15 earnings and we value at 15.5x FY16E EPS. Company's Q1 earnings soars over than the expectation. Company Overview Mindtree limited is a public limited multinational company founded in 1999 and it headquartered in Bengaluru, India and New Jersey. It delivers digital transformation and technology business solutions through global software development. The Company globally deals with more than 200 clients and offices in 14 countries including United States of America, United Kingdom, Japan, Singapore, Malaysia, Australia, Germany, Switzerland, Sweden, UAE, Netherlands, Canada, Belgium, France, Ireland, and. Republic of China.. It specializes in e- commerce, mobility, cloud enablement, digital transformation, business intelligence, data analytics, testing, infrastructure, EAI and ERP solutions. The Company offers various services like: Application Development & Maintenance, Data Analytics, Digital Services, EAI BPM, Engineering R&D, Enterprise Application Services, Independent Testing, Infrastructure Management Services and IT strategy and consulting.
3 Midcap Company Mindtree's Q1 Analysis : The software services provider has reported a forex gain of Rs 20.2 crore during June quarter against loss of Rs 13 crore in March quarter. The operating profit dropped 3.2% sequentially to Rs crore and margin declined 189 basis points to 17.61% due to wage hikes in June quarter. The company's 12 months attrition rate was 18.4 percent. MindTree has acquired 100% equity interest in two overseas companies - US-based Relational Solutions and UK-based Bluefin Solution. The company also recommended an interim dividend of Rs 3 per equity share for the quarter ended June 30, Particulars (Cr) Jun '14 Sep '14 Dec '14 Mar '15 Jun'15 Net Sales/Income from operations Other Operating Income Total Income From Operations EXPENDITURE Employees Cost Depreciation Other Expenses P/L Before Other Inc., Int., Excpt. Items & Tax Other Income P/L Before Int., Excpt. Items & Tax Interest P/L Before Exceptional Items & Tax Exceptional Items P/L Before Tax Tax P/L After Tax from Ordinary Activities Prior Year Adjustments Extra Ordinary Items Net Profit/(Loss) For the Period Equity Share Capital Reserves Excluding Revaluation Reserves Equity Dividend Rate (%) Basic EPS Diluted EPS
4 Is Attrition badly affecting company's growth? Company's attrition rate in this fiscal stood at 14.23% which was increased comparing to 13.0% in FY14. Mindtree, which added 900 employees during the quarter on a gross basis dropped from 1,517 employess, said trailing 12 months attrition rate was 18.4% which was increased by comparing 18.2% in previous quarter. The total employees stood at 14,427 as against 14,202 employees on 31st march Employees cost in Q1 increased to Rs Cr from Rs Cr Q-o-Q. The capital employed increased steadily and it stood at 2048 in FY15 as against 1660 in FY14. Natarajan, the CEO said certain exits are bound to happen as the company is preparing itself for its 2020 vision. We restructured our organization to prepare it for the next three-five year. When you do such a transition, there will be some fall-outs. However, I want to categorically say that this is a zero cause of worry for us as we are very fortunate because of the company s depth of leadership,. From the CEO's vision, it is very clear that the attrition won't affect the company as much as expected.

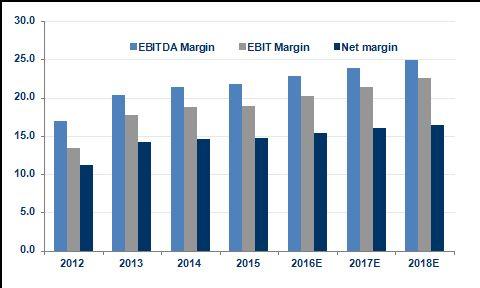
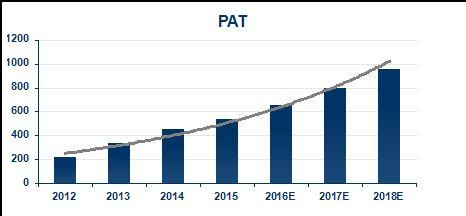
5 Sales pipeline boosted the profitability : The net sales of the company over the last 5 years is constantly increasing. The net sales in this fiscal stood at Rs. 3,562 Crs as against Rs. 3,032 Cr in FY14 with a growth of 17.5 %. The EBITDA Margin is 21.7%. The PAT in this fiscal is Rs. 536 Cr which shows 19% growth over Rs. 451 Cr in FY14. We estimated a 22% growth of Rs. 656 Cr in FY16E. Global economic growth was 3.4 % in FY14 and is projected to reach 3.5 % and 3.8% in FY15 and FY16, respectively. IT Industry : IT industry is now in a downgraded range. All the blue chip companies are facing challenges like visa problems, salary to employees. The uncertainty, volatility and the macro economic factors are affecting the productivity and profitability of the industry. But as per the economic cycle, whenever we see a down swing in economy we will see an upward swing later. So there is a chance for the recovery. India is strongly positioned to gather more market share in the global IT-BPM services sourcing market and expect this to reach its goal of USD 300 billion revenues by At the same time, the stakeholders will need to be addressed about the challenges around economic volatility, protectionism, competition and customer centricity. From an IT services industry perspective, Digital business is estimated to touch $ 225 billion by 2020 with $ 48 billion predicted for Indian IT services firms.
6 SWOT Analysis of Digital business Expert guidance Customer Centricity Strengths Opportunity Innovative business models Corporate governance Alliance & partnerships SWOT Analysis Legislation on outsourcing Pricing pressures & Foreign currency rate fluctuations. Key client loss. Threats Uncertain economic environment Operations risk. Competition Weakness
.")

7 Dividend: The Board of Directors, at its meeting held on April 16, 2015 recommended a final dividend of 100% (Rs 10 per equity share of par value Rs 10 each) for the year ended March 31, Accordingly, the cumulative dividend declared by the Board of Directors for the year ended March 31, 2015 aggregates to 170% (Rs 17 per equity share of par value Rs 10 each). The company also recommended an interim dividend of Rs 3 per equity share for the quarter ended June 30, The dividend payout ratio has increased steadily from 7% in FY12 to 27% in FY15 and we expect the payout to be 33.0% in FY18E. Source : Company, DBFS Research Company s priorities for FY15-16: Mindtree is fully focused on becoming the leading digital transformation partner for their clients, and on delivering high customer satisfaction. Their corporate governance practices have endeared them around their clients. Currently a third of the company s revenue is driven by providing digital services. IT Industry is on the optimistic view that 90% of all incremental spend in the next five years on IT will be on Digital. So the company s vision is to Make Businesses Digital. Mindtree has also reorganized its team with a focus on faster time to market and turnkey cloud-based solutions to make Digital real for its customers.

8
9 Financials & Valuations Balance Sheet Y/E March (Rs Cr) FY12 FY13 FY14 FY15 FY16E FY17E FY18E Share capital Reserves and surplus , , , , , ,217.2 Networth , , , , , ,300.9 Minority Interest Loan Capital Employed , , , , , ,437.9 Gross Block , , , ,717.9 Less; Dep Net Block Capital work-in-progress Investments Current Assets , , , , , ,090.5 Current investments Debtors Cash and bank balances ,191.7 Loans and advances Other current assets Current Liabilities & Provisions ,010.6 Net Current Assets , , , , ,079.9 Deferred tax assets (net) Application of funds. 1, , , , , , ,448.1 Income Statement Y/E March (Rs Cr) FY12 FY13 FY14 FY15 FY16E FY17E FY18E Sales 1, , , , , , ,672.6 Change (%) Cost of services 1, , , , , , ,078.1 SG&A Expenses , ,290.8 EBITDA , ,303.7 % of Net sales Depreciation and amortization expense Interest Other income EBIT , ,317.5 Tax Rate (%) PAT Change (%)
10 Cash flow (Abstract) Y/E March (Rs Cr) FY12 FY13 FY14 FY15 FY16E FY17E FY18E Net profit before Tax , ,317.4 Depreciation (inc)/dec in Current Assets (inc)/dec in current Liabilities CF from operations ,066.0 Other Investments (Purchase)/Sale of Fixed Assets CF from investing Activities Inc / (Dec) in Equity Capital Inc / (Dec) in sec.loan Funds Dividend & Dividend tax Interest Paid on Loans CF from Financial Activities Cash generating during the year Opening cash balance ,137.1 Exchange rate differences Closing cash ,191.7 Key Ratios Y/E March (Rs Cr) E 2017E 2018E Per share data (Rs) EPS BV DPS Profitability Ratios ROE ROCE EBITDA Margin EBIT Margin Net margin Operating revenue/total Income Other Income/Total Income Turnover Ratios Debtors Fixed Asset Turnover Investments Turnover Total assets Turnover Liquidity & solvency Ratios Current Ratio Debt Equity Ratio Cash Flow Indicator Ratios Dividend Payout Ratio Retention Ratio
11 Analyst Certification I Nina Sundaran hereby certify that the views expressed in this research report accurately reflect my personal views about the subject securities and issuers. I also certify that no part of my compensation was, is or will be, directly or indirectly, related to the specific recommendations or view expressed in this research report. Disclaimer This research report provides general information only. Recommendations, opinions or suggestions are given with the understanding that readers acting on this information assume all risks involved. The information provided herein is not, and should not be construed as an offer to buy or sell any securities or other financial instrument or any derivative related to such securities or instruments. This report is not intended to provide personal investment advice and it does not take into account the specific investment objectives, financial situation and the particular needs of any specific person. Investors should seek financial advice regarding the appropriateness of investing in financial instruments and implementing investment strategies discussed or recommended in this report and should understand that statements regarding future prospects may not be realized. Any decision to purchase or subscribe for securities in any offering must be based solely on existing public information on such security or the information in the prospectus or other offering document issued in connection with such offering, and not on this report. We have reviewed the report, and in so far as it includes current or historical information, it is believed to be reliable though its accuracy or completeness cannot be guaranteed. All such information and opinions are subject to change without notice. This document has been produced independently of any company or companies mentioned herein, and forward looking statements; opinions and expectations contained herein are subject to change without notice. Price and value of the investments referred to in this material may go up or down. Past performance is not a guide for future performance. Certain transactions -including those involving futures, options and other derivatives as well as non-investment grade securities - involve substantial risk and are not suitable for all investors. Reports based on technical analysis centers on studying charts of a stock s price movement and trading volume, as opposed to focusing on a company s fundamentals and as such, may not match with a report on a company s fundamentals. Opinions expressed are our current opinions as of the date appearing on this material only. While we endeavor to update on a reasonable basis the information discussed in this material, there may be regulatory, compliance, or other reasons that prevent us from doing so. Doha Brokerage and Financial Services Limited (DBFS), its associate and group companies its directors or employees do not take any responsibility or liability, financial or otherwise, of the losses or the damages sustained due to the investments made or any action taken on basis of this document, including but not restricted to, fluctuation in the prices of the shares and bonds, reduction in the dividend or income, etc. This document is not directed to or intended for display, downloading, printing, reproducing or for distribution to or use by any person or entity who is a citizen or resident or located in any locality, state, country or other jurisdiction where such distribution, publication, reproduction, availability or use would be contrary to law or regulation or would subject DBFS or its associates or group companies to any registration or licensing requirement within such jurisdiction. If this document is inadvertently sent or has reached any individual in such country, the same may be ignored and brought to the attention of the sender.
12 This document may not be reproduced, distributed or published for any purpose without prior written approval of DBFS. Before acting on any advice or recommendation in this document, a customer should consider whether it is suitable given the customer s particular circumstances and, if necessary, seek professional advice. Certain transactions, including those involving futures, options, and high yield securities, give rise to substantial risk and are not suitable for all investors. DBFS, its associates or group companies do not represent or endorse the accuracy or reliability of any of the information or content of the document and reliance upon it is at your own risk. DBFS, its associates or group companies, expressly disclaims any and all warranties, express or implied, including without limitation warranties of merchantability and fitness for a particular purpose with respect to the document and any information in it. DBFS, its associates or group companies, shall not be liable for any direct, indirect, incidental, punitive or consequential damages of any kind with respect to the document. No part of this publication may be reproduced, stored in a retrieval system, or transmitted, on any form or by any means, electronic, mechanical, photocopying, recording, or otherwise, without the prior written permission of DBFS. Special Disclosure In accordance with the SEBI (Foreign Institutional Investors) Regulations and with guidelines issued by the Securities and Exchange Board of India (SEBI), foreign investors (individuals as well as institutional) that wish to transact securities in Indian bourses must have applied to, and have been approved by SEBI and the Reserve Bank of India (RBI). Each investor who transacts securities in Indian bourses will be required to certify approval as a foreign institutional investor or as a sub-account of a foreign institutional investor by SEBI and RBI. General Investment Related Disclosure Our proprietary trading and investment businesses may make investment decisions that are inconsistent with the recommendations expressed herein. DBFS is also a Portfolio Manager. Portfolio Management Team (PMS) takes its investment decisions independent of the Equity research and accordingly PMS may have positions contrary to the client group research recommendation.
Maruti Suzuki India DOHA BROKERAGE. associate of DOHA BANK. associate of DOHA BANK BUY. Stock data and Key Ratios. On track to witness better times
 DBFS EQUITIES RESEARCH INDIA / AUTOS Maruti Suzuki India CMP: Rs 1240.75 Target Price: Rs 1409 On track to witness better times Maruti Suzuki had a tough time in 2011-12. A slowdown in the auto industry,
Thermax Ltd SELL DOHA BROKERAGE. a s s o c i a t e o f D O H A B A N K. Declining Order book A cause of concern
 EQUITIES INDIA CAPITAL GOODS 25th FEBRUARY 2012 DOHA BROKERAGE Research Analyst: Sharon K Abraham e-mail: research@dbfsindia.com Helpline: 0484-3060126 Thermax Ltd SELL Stock Data Declining Order book
SQS India BFSI Ltd HOLD. Impact of Macro Headwinds Still Hurting; Revenue from US May Pick up in FY18E
 Company Update Impact of Macro Headwinds Still Hurting; Revenue from US May Pick up in FY18E EBITDA Margins recovered by 618 bps QoQ: The company has witnessed many challenges over the year FY17 starting
PEER GROUPS CMP MARKET CAP EPS P/E (X) P/BV(X) DIVIDEND Company Name (Rs.) Rs. in mn. (Rs.) Ratio Ratio (%)
 P/BV(X) DIVIDEND Company Name (Rs.) Rs. in mn. (Rs.) Ratio Ratio (%)") BUY CMP 1424.75 Target Price 1630.00 MINDTREE LIMITED Result Update (CONSO:IDATED BASIS): Q2 FY16 OCTOBER 17 th 2015 ISIN: INE018I01017 Index Details Stock Data Sector IT Consulting & Software BSE Code
BUY CMP 1424.75 Target Price 1630.00 MINDTREE LIMITED Result Update (CONSO:IDATED BASIS): Q2 FY16 OCTOBER 17 th 2015 ISIN: INE018I01017 Index Details Stock Data Sector IT Consulting & Software BSE Code
Amber Enterprises India Ltd
 3QFY2019 Result Update Consumer Durable February 16, 2019 Amber Enterprises India Ltd Performance Update (` cr) 3QFY19 3QFY18 % yoy 2QFY19 % qoq Revenue 388.8 338.4 14.9 226.3 71.8 EBITDA 22.1 24.1 (8.2)
Parag Milk Foods BUY. Performance Update CMP. `256 Target Price `330. 2QFY2019 Result Update Dairy Products. Investment Period 12 Months
 2QFY2019 Result Update Dairy Products November 6, 2018 Parag Milk Foods Performance Update Y/E March (` cr) Q2FY19 Q2FY18 % yoy Q1FY19 % qoq Net sales 573 505 13.7% 549 4.4% EBITDA 58 50 16.3% 60-2.7%
Near-term pressure, but long-term outlook positive
 INDUSTRY IT CMP (as on 2 Nov 2015) Rs 1,812 Target Price Rs 2,050 Nifty 8,051 Sensex 26,559 KEY STOCK DATA Bloomberg ECLX IN No. of Shares (mn) 30 MCap (Rs bn) / ($ mn) 55/843 6m avg traded value (Rs mn)
Fineotex Chemical Ltd
 Company Update Decent Performance under Macroeconomic Pressure; Business Traction to Continue: Fineotex Chemical recorded decent set of result as consolidated sales grew by 1.1% YoY (largely in line) to
Quick take. Ruchira Papers Ltd. BUY. Creating value through paper. Target Price. Investment Period 12 Months. 3 year daily price chart.
 Ltd. Creating value through paper Limited (RPL) manufactures writing paper, printing paper and Kraft paper. The company's white writing and printing paper is used in making notebooks and writing material,
Music Broadcast BUY. Performance Update. CMP Target Price `293 `475. 3QFY2019 Result Update Media. Stock Info Sector Market Cap (Rs cr) Media
 Media") Mar-17 May-17 Jul-17 Sep-17 Nov-17 Jan-18 Mar-18 May-18 Jul-18 Sep-18 Nov-18 Jan-19 3QFY2019 Result Update Media January 31, 2019 Music Broadcast Performance Update Y/E March (` cr) 3QFY19 3QFY18 % yoy
Mar-17 May-17 Jul-17 Sep-17 Nov-17 Jan-18 Mar-18 May-18 Jul-18 Sep-18 Nov-18 Jan-19 3QFY2019 Result Update Media January 31, 2019 Music Broadcast Performance Update Y/E March (` cr) 3QFY19 3QFY18 % yoy
Music Broadcast BUY. Performance Update. CMP Target Price `329 `475. 2QFY2019 Result Update Media. Historical share price chart.
 Mar-17 May-17 Jul-17 Sep-17 Nov-17 Jan-18 Mar-18 May-18 Jul-18 Sep-18 2QFY2019 Result Update Media November 3, 2018 Music Broadcast Performance Update Y/E March (` cr) 2QFY19 2QFY18 % yoy 1QFY19 % qoq
GMM Pfaudler Limited BUY. Performance Update CMP. `945 Target Price ` QFY2019 Result Update Industrial Machinery. Investment Period 12 Months
 2QFY2019 Result Update Industrial Machinery October 26, 2018 GMM Pfaudler Limited Performance Update Standalone (` cr) Q2FY19 Q2FY18 % yoy Q1FY19 % qoq Net sales 99.2 93.2 29.8% 76.4 6.4% EBITDA 16.0 15.3
Company Overview. FY15 and recent performance. The company has operating profit of INR65.2m in Q2FY16. Table 1: Key financials
 IT Software Products l BSE Research ABM Knowledgeware Ltd. The Varhad Group CMP: INR265.40 Stock data BSE code 531161 BSE ID ABMKNO Face value (INR) 10.0 No of shares (m) 10.0 Market cap (INRm) 2,654.3
Omega Interactive Technologies Ltd
 IT Software & Products November 05, 2012 CMP Rs. 2.4 BSE Code 511644 BSE ID OMEGAIN High/Low 1Y (Rs.) 4.6/ 2.4 Average Volume (3M) 609 Market Cap (Rs. Cr.) 1 Shareholding % Sep-12 Jun-12 Promoters 8.42
Dr Reddy s Laboratories
 : price: EPS: How does our one year outlook change? We maintain rating on DRRD post the company s 3QFY16 results Revenue growth for the quarter was muted (3% yoy) due to disappointing performances in Russia
Karnataka Bank. Rating: BUY. Bank - Private. Short Note. Brief Financials
 Karnataka Bank Bank - Private Date June 11, 2018 CMP (Rs.) 120 Target (Rs.) 163 Potential Upside 37% BSE Sensex 35484 NSE Nifty 10787 Scrip Code Bloomberg KBLIN Reuters KBNK.BO BSE Group A BSE Code 532652
Blue Star Ltd BUY. Performance Update. CMP Target Price `754 `867. 4QFY2018 Result Update Cons. Durable. 3-year price chart.
 May-15 Aug-15 Nov-15 Feb-16 May-16 Aug-16 Nov-16 Feb-17 May-17 Aug-17 Nov-17 Feb-18 May-18 4QFY2018 Result Update Cons. Durable May 16, 2018 Blue Star Ltd Performance Update 4QFY18 4QFY17 % chg. (yoy)
Marico Kaya BUY RESULTS REVIEW 4QFY15 29 APR 2015
 RESULTS REVIEW 4QFY15 29 APR 2015 Marico Kaya INDUSTRY FMCG CMP (as on 28 Apr 2015) Rs 1,635 Target Price Rs 1,823 Nifty 8,240 Sensex 27,226 KEY STOCK DATA Bloomberg MAKA IN No. of Shares (mn) 13 MCap
KEI Industries BUY. Performance Update. Target Price. 3QFY2018 Result Update Cable. Historical share price chart. Key Financials
 3QFY2018 Result Update Cable January 25, 2018 KEI Industries Performance Update Y/E March (` cr) 3QFY18 3QFY17 % yoy 2QFY18 % qoq Net sales 889 715 24 749 19 EBITDA 84 77 10 76 11 EBITDA margin (%) 9.5
CCL Products BUY. Brewing Steadily. CMP Target Price `300 `360. Initiating Coverage Coffee. January 4, year price chart
 5-Jan 5-Apr 5-Jul 5-Oct 5-Jan 5-Apr 5-Jul 5-Oct 5-Jan 5-Apr 5-Jul 5-Oct CCL Products Brewing Steadily CCL Products Limited (CCL) is the largest Indian manufacturer and exporter of instant coffee. With
Hold Target Price: Rs 574
 03 MAY 2017 Quarterly Update Hold Target Price: Rs 574 Q4FY17: Macro overhang persists SQS India BFSI Ltd delivered a modest performance in Q4FY17, with earnings (PAT) coming in at Rs 4.4 Cr, down 58.8%
Larsen & Toubro Ltd.
 Feb-17 Mar-17 Apr-17 May-17 Jun-17 Jul-17 Aug-17 Sep-17 Oct-17 Nov-17 Dec-17 Jan-18 Feb-18 Volume No.. III Issue No. 163. Larsen & Toubro Ltd. February 26, 2018 BSE Code: 500510 NSE Code: LT Reuters Code:
MCX Ltd. Rating: Target price: EPS: Tepid volume growth continues. Target. Rating CMP. Rs. 1,080 SELL. Rs. 1,176
 : price: EPS: Tepid volume growth continues 4QFY15 traded volumes in MCX showed a small improvement sequentially whereas declined yoy. FY15 traded Values are at a sever year low. We retain our cautious
CMP* (Rs) 208 Upside/ (Downside) (%) 18. Market Cap. (Rs bn) Free Float (%) 65.6 Shares O/S (mn) 630
 208 Upside/ (Downside) (%) 18. Market Cap. (Rs bn) Free Float (%) 65.6 Shares O/S (mn) 630") 1QFY18 Result Update July 28,2017 CMP* (Rs) 208 Bloomberg Ticker CROMPTON IN Market Cap. (Rs bn) 130.6 Free Float (%) 65.6 Shares O/S (mn) 630 Channel De-stocking Impairs Top-line; Recovery Ahead Crompton
1QFY18 Result Update July 28,2017 CMP* (Rs) 208 Bloomberg Ticker CROMPTON IN Market Cap. (Rs bn) 130.6 Free Float (%) 65.6 Shares O/S (mn) 630 Channel De-stocking Impairs Top-line; Recovery Ahead Crompton
Parag Milk Foods BUY. Performance Update CMP. `324 Target Price `410. 1QFY2019 Result Update Dairy Products. Investment Period 12 Months
 1QFY2019 Result Update Dairy Products August 8, 2018 Parag Milk Foods Performance Update Y/E March (` cr) Q1FY19 Q1FY18 % yoy Q4FY18 % qoq Net sales 549 413 32.9 518 5.9 EBITDA 60 29 103% 55 8.4% EBITDA
Blue Star Ltd BUY. Performance Update. CMP Target Price `703 `867. 1QFY2019 Result Update Cons. Durable. 3-year price chart.
 Aug-15 Oct-15 Dec-15 Feb-16 Apr-16 Jun-16 Aug-16 Oct-16 Dec-16 Jan-17 Apr-17 May-17 Jul-17 Sep-17 Nov-17 Jan-18 Mar-18 May-18 Jul-18 1QFY2019 Result Update Cons. Durable August 10, 2018 Blue Star Ltd Performance
Visaka Industries Ltd
 Company Update Superior Product Mix & New Age Markets to Aid Growth New investments to aid growth: Visaka continues to give a good set of numbers. YoY EPS grew at 142% aided by a revenue growth of 1.5%
MCX Ltd. Rating: Target price: EPS: Is commodity option a game changer for MCX? - Unlikely. Target. Rating CMP. Rs. 1,080 SELL. Rs.
 : price: EPS: Is commodity option a game changer for MCX? - Unlikely In the union budget 2015-16, the Finance Minister announced the much anticipated merger of SEBI and FMC. Given the powers accorded to
TV Today Network BUY. Performance Update. CMP Target Price `315 `385. 2QFY2017 Result Update Media. Historical share price chart.
 2QFY2017 Result Update Media December 5, 2016 TV Today Network Performance Update Y/E March (` cr) 2QFY17 2QFY16 % yoy 1QFY17 % qoq Net sales 132 126 5.1 137 (3.4) EBITDA 37 38 (2.4) 37 0.4 EBITDA margin
HOLD. Margins to improve from Q2 AMBUJA CEMENTS. Target Price: Rs 232. Other highlights
 AMBUJA S 4 MAY 2017 Quarterly Update HOLD Target Price: Rs 232 Margins to improve from Q2 Q1CY17standalone EBITDA at Rs 4.0 bn was in line withconsensus estimate.volume was up 3% YoY to 6 mnt. Realization
Cairn India ACCUMULATE. Performance Highlights. CMP Target Price `338 `382. 2QFY2013 Result Update Oil & Gas. Quarterly highlights (Consolidated)
") 2QFY2013 Result Update Oil & Gas October 22, 2012 Cairn India Performance Highlights Quarterly highlights (Consolidated) Y/E March (` cr) 2QFY2013 2QFY2012 % chg (yoy) 1QFY2013 % chg (qoq) Net sales 4,443
2QFY2013 Result Update Oil & Gas October 22, 2012 Cairn India Performance Highlights Quarterly highlights (Consolidated) Y/E March (` cr) 2QFY2013 2QFY2012 % chg (yoy) 1QFY2013 % chg (qoq) Net sales 4,443
Bharat Forge. Result Update. Q4FY13 Result Highlights. Valuation. No Respite in Sight May 29, Institutional Research 1
 [ Result Update Equity India Forging & Industrials Bharat Forge Ltd. No Respite in Sight May 29, 2013 CMP (`) Target (`) 241 238 Potential Upside Absolute Rating (1.24)% HOLD Market Info (as on May 28,
Institutional Equities
 4QFY18 Result Update Institutional Equities Atul Auto 30 May 2018 Reuters: ATUL.BO; Bloomberg: ATUL IN Higher Expenses Mar Profitability Atul Auto s (AAL) 4QFY18 earnings missed our expectations on account
GAIL India NEUTRAL. Performance Highlights CMP. `363 Target Price - 2QFY2013 Result Update Oil & Gas. Investment Period -
 2QFY2013 Result Update Oil & Gas October 26, 2012 GAIL India Performance Highlights Quarterly highlights (Standalone) Y/E March (` cr) 2QFY2013 2QFY2012 % chg (yoy) 1QFY2013 % chg (qoq) Net sales 11,361
Consolidated Sales (Cr) Growth EBITDA (Cr) Margin PAT Margin EPS (Rs) P/E RoE
 Growth EBITDA (Cr) Margin PAT Margin EPS (Rs) P/E RoE") Aug-17 Sep-17 Oct-17 Nov-17 Dec-17 Jan-18 Feb-18 Mar-18 Apr-18 May-18 Jun-18 Jul-18 Aug-18 2904 Recommendation CMP Target Price BUY Rs. 312 Rs. 443 Better times ahead! reported a good set of numbers in
Aug-17 Sep-17 Oct-17 Nov-17 Dec-17 Jan-18 Feb-18 Mar-18 Apr-18 May-18 Jun-18 Jul-18 Aug-18 2904 Recommendation CMP Target Price BUY Rs. 312 Rs. 443 Better times ahead! reported a good set of numbers in
Inox Wind BUY. Performance Highlights. CMP Target Price `390 `505. 2QFY2016 Result Update Capital Goods. 3 year price chart
 2QFY2016 Result Update Capital Goods October 27, 2015 Inox Wind Performance Highlights Quarterly Data (Consolidated) ( ` cr) 2QFY16 2QFY15 % chg (yoy) 1QFY16 % chg (qoq) Revenues 1,008 543 85.6 636 58.6
Key estimate revision. Financial summary. Year FY14 391,088 45,198 34, FY15E 354,262 35,426 23,
 : price: EPS: How does our one year outlook change? We retain our negative stance on the stock. We expect s revenue to de-grow by 9% y-o-y on the back of muted execution (client side and clearance delays)
1 Type of Issue (IPO / FPO) IPO 2 Issue Size (Rs. Cr) Source: Prospectus dated March 28, 2016
 IPO 2 Issue Size (Rs. Cr) Source: Prospectus dated March 28, 2016") Name of the Issue: Infibeam Incorporation Limited Last updated on April 12, 2016 1 Type of Issue (IPO / FPO) IPO 2 Issue Size (Rs. Cr) 450.00 Source: Prospectus dated March 28, 2016 3 Grade of issue along
Name of the Issue: Infibeam Incorporation Limited Last updated on April 12, 2016 1 Type of Issue (IPO / FPO) IPO 2 Issue Size (Rs. Cr) 450.00 Source: Prospectus dated March 28, 2016 3 Grade of issue along
Glance Finance Ltd. Other Financial Services. . Company Overview. Company Fundamentals. Key Strengths. CMP Rs BSE Code BSE ID
 Other Financial Services Nov 15, 2012 CMP Rs. 19.55 BSE Code 531199 BSE ID GLANCE High/Low 1Y (Rs.) 35.15/ 16.55 Average Volume (3M) 279 Market Cap (Rs. Cr.) 6 Shareholding % Sep-12 Jun-12 Promoters 74.83
Cummins India Ltd Bloomberg Code: KKC IN
 Company Update Margins Under Pressure; Domestic Recovery Underway Half-yearly revenue was flat; margins were under pressure: Cummins India revenue, EBITDA and PAT for H1FY17 reached to Rs.24,784mn, Rs.4,649mn
Graphite India BUY. Performance Highlights CMP. `93 Target Price `124. 4QFY2012 Result Update Capital Goods. Investment Period 12 Months
 4QFY2012 Result Update Capital Goods May 11, 2012 Graphite India Performance Highlights Y/E March (` cr) 4QFY2012 3QFY2012 % chg (qoq) 4QFY2011 % chg (yoy) Net sales 452 437 3.5 304 48.6 EBITDA 83 90 (7.7)
Inox Wind BUY. Performance Highlights. CMP Target Price `242 `286. 4QFY2016 Result Update Capital Goods. 3 year price chart
 4QFY216 Result Update Capital Goods May 11, 216 Inox Wind Performance Highlights Quarterly Data (Consolidated) ( ` cr) 4QFY16 4QFY15 % chg (yoy) 3QFY16 % chg (qoq) Total Income 1,829 93 96.6 941 94.2 EBITDA
CMP* (Rs) 840 Upside/ (Downside) (%) (2.4) Bloomberg Ticker Market Cap. (Rs bn) 379 Free Float (%) 53 Shares O/S (mn) 451.6
 840 Upside/ (Downside) (%) (2.4) Bloomberg Ticker Market Cap. (Rs bn) 379 Free Float (%) 53 Shares O/S (mn) 451.6") Event Update November 08, 2017 Market Cap. (Rs bn) 379 Free Float (%) 53 Shares O/S (mn) 451.6 USFDA Warning Letter Entails Further Downside Risk to US Biz The US FDA has issued a Warning Letter (WL) to
Event Update November 08, 2017 Market Cap. (Rs bn) 379 Free Float (%) 53 Shares O/S (mn) 451.6 USFDA Warning Letter Entails Further Downside Risk to US Biz The US FDA has issued a Warning Letter (WL) to
Tata Consultancy Services (TCS)
") Jan-16 Jun-16 Nov-16 Apr-17 Sep-17 Feb-18 Jul-18 Dec-18 3QFY2019 Result Update IT January 11, 2019 Tata Consultancy Services (TCS) Performance highlights (` cr) 3QFY19 2QFY19 % chg (QoQ) 3QFY18 % chg (yoy)
Jan-16 Jun-16 Nov-16 Apr-17 Sep-17 Feb-18 Jul-18 Dec-18 3QFY2019 Result Update IT January 11, 2019 Tata Consultancy Services (TCS) Performance highlights (` cr) 3QFY19 2QFY19 % chg (QoQ) 3QFY18 % chg (yoy)
HOLD. Deleveraging story playing out RAMCO CEMENTS. Target Price: Rs 503. Q4 performance
 RAMCO S HOLD Target Price: Rs 503 Deleveraging story playing out Ramco Cements total debt reduced by a massive Rs 5 bn to Rs 22 bn in FY16. The company generated total EBITDA of Rs 11.5 bn in FY16 and
Sanghvi Movers Ltd. Results above estimates. Figure 1: Actual Vs Religare Estimates. Financial highlights. Valuations and Recommendation
 Institutional Equity Research Key data 3 June 28 Sector Capital Goods Market Cap Rs9bn/US$.2bn 52 Wk H/L (Rs) 337/15.5 BSE Avg. daily vol. (6m) 4,437 BSE Code 5373 NSE Code SANGHVIMOV Bloomberg SGM IN
KEI Industries BUY. Performance Update. CMP Target Price `433 `508. 4QFY2018 Result Update Cable. Historical share price chart.
 May- Aug- Oct-15 Jan-16 Apr-16 Jul-16 Oct-16 Jan-17 Apr-17 Jul-17 Oct-17 Jan-18 Apr-18 4QFY2018 Result Update Cable May 21, 2018 KEI Industries Performance Update Y/E March (` cr) 4QFY18 4QFY17 % yoy 3QFY18
Tech Mahindra. 1QFY18 Result Update. Steps in the right direction, compelling valuation. Sector: Technology CMP: ` 385. Recommendation: Buy
 Tech Mahindra 1QFY18 Result Update Steps in the right direction, compelling valuation Sector: Technology CMP: ` 385 Recommendation: Buy Market statistics Current stock price (`) 385 Shares O/S (cr.) 97.5
Initiating Coverage. Uflex Ltd.
 2904 Recommendation CMP Target Price BUY Rs. 283 Rs. 444 Better times ahead! reported a good set of numbers for the year FY18 and for Q4. Sales for the quarter increase by 11.8% YoY to Rs 1809.8 Cr and
TV Today Network BUY. Performance Update CMP. `323 Target Price `498. 3QFY2019 Result Update Media. Investment Period 12 Months
 Jan-16 Apr-16 Jul-16 Oct-16 Jan-17 Apr-17 Jul-17 Oct-17 Jan-18 Apr-18 Jul-18 Oct-18 Jan-19 3QFY2019 Result Update Media February 14, 2019 TV Today Network Performance Update Y/E March (` cr) 3QFY19 3QFY18
Pidilite Industries Ltd
 Company Update De-stocking as an initial response to GST implementation caused subdued performance; Brighter long term business prospects ahead The company has recorded sales of Rs. 16693 Mn in as against
CMP* (Rs) 417 Upside/ (Downside) (%) 46 Bloomberg Ticker. SUNP IN Market Cap. (Rs bn) 1,001 Free Float (%) 46 Shares O/S (mn) 2399
 417 Upside/ (Downside) (%) 46 Bloomberg Ticker. SUNP IN Market Cap. (Rs bn) 1,001 Free Float (%) 46 Shares O/S (mn) 2399") Company Update January 22, 2019 Market Cap. (Rs bn) 1,001 Free Float (%) 46 Shares O/S (mn) 2399 Multiple Growth Drivers in Place despite Near-term Headwinds Industries (SUNP) has released an investor
Company Update January 22, 2019 Market Cap. (Rs bn) 1,001 Free Float (%) 46 Shares O/S (mn) 2399 Multiple Growth Drivers in Place despite Near-term Headwinds Industries (SUNP) has released an investor
MRF BUY. Performance Highlights. CMP `9,407 Target Price `11,343. Company Update Automobile. Key financials
 Company Update Automobile February 22, 212 MRF Performance Highlights Y/E Sept. (` cr) 1QSY12 1QSY11 % chg (yoy) 4QSY11 % chg (qoq) Net sales 2,875 2,167 32.7 2,62 9.8 EBITDA 258 243 5.9 181 42.6 EBITDA
Maruti Suzuki India BUY. Performance Update. CMP `9,315 Target Price `10,820. 1QFY2019 Result Update Automobile. Historical share price chart
 Jul-15 Sep-15 Nov-15 Jan-16 Mar-16 May-16 Jul-16 Sep-16 Nov-16 Jan-17 Mar-17 May-17 Jul-17 Sep-17 Nov-17 Jan-18 Mar-18 May-18 1QFY2019 Result Update Automobile July 27, 2018 Maruti Suzuki India Performance
Newgen Software Technologies Ltd
 IPO Note IT Jan 12, 2018 Newgen Software Technologies Ltd Incorporated in 1992, Newgen Software Technologies Limited (NSTL) is a New Delhi based IT company and a global provider of Business Process Management
Graphite India BUY. Performance Highlights. CMP Target Price `88 `109. 1QFY2012 Result Update Capital Goods
 1QFY2012 Result Update Capital Goods July 25, 2011 Graphite India Performance Highlights Y/E March (` cr) 1QFY2012 4QFY2011 % chg (qoq) 1QFY2011 % chg (yoy) Net sales 319 303 5.1 258 23.3 EBITDA 61 59
Tata Consultancy Services
 Tata Consultancy Services SALES NOTE 19 th May 2017 May-16 Jul-16 Sep-16 Nov-16 Jan-17 Mar-17 May-17 India Equity Institutional Research II Sales Note II 19th May, 2017 CMP INR 2536 Target INR 2833 Potential
ITC ACCUMULATE. Performance Highlights CMP. `257 Target Price `284. 3QFY2017 Result Update FMCG. Investment Period 12 Months
 3QFY2017 Result Update FMCG January 30, 2017 ITC Performance Highlights Quarterly result (Standalone) (` cr) 3QFY17 3QFY16 % yoy 2QFY17 %qoq Revenue 9,248 8,867 4.3 9,661 (4.3) EBITDA 3,546 3,475 2.1 3,630
He is BTech from IIT Bombay ( , Aeronautical Engineering) and MS from Cornell University ( , Mechanical Engineering).
 and MS from Cornell University ( , Mechanical Engineering).") Stabilizing the Ship; focus shifts to strategy Infosys has appointed Mr. Salil S Parekh as CEO and MD effective January 2, 2018 for a period of 5 years. He would be based out of Bengaluru (India). Also,
Stabilizing the Ship; focus shifts to strategy Infosys has appointed Mr. Salil S Parekh as CEO and MD effective January 2, 2018 for a period of 5 years. He would be based out of Bengaluru (India). Also,
Asian Granito BUY. Performance Highlights CMP. `270 Target Price `351. Outlook and valuation. 3QFY2017 Result Update Ceramics
 3QFY2017 Result Update Ceramics January 25, 2017 Asian Granito Performance Highlights Quarterly Data (` cr) 3QFY17 3QFY16 % yoy 2QFY17 % qoq Revenue 247 236 4.3 265 (7.1) EBITDA 34 27 25.3 31 7.2 Margin
Change EPS. (Rs) FY
 FY") 17 AUG 217 / Quarterly Update BUY Target Price: Rs. 662 : Revenue up 21% Y-o-Y, strong growth in Non-GLE segment GMM Pfaudler Ltd(GMM) in 1QFY18posted revenues of Rs 69 Cr. (up 21% Y-o-Y, down 13% Q-o-Q)
17 AUG 217 / Quarterly Update BUY Target Price: Rs. 662 : Revenue up 21% Y-o-Y, strong growth in Non-GLE segment GMM Pfaudler Ltd(GMM) in 1QFY18posted revenues of Rs 69 Cr. (up 21% Y-o-Y, down 13% Q-o-Q)
HOLD. Coal India Ltd Coal RETAIL EQUITY RESEARCH. Uncertainty remains. GEOJIT BNP PARIBAS Research
 COMPANY UPDATE Dec-15 Jan-16 Feb-16 Mar-16 GEOJIT BNP PARIBAS Research Apr-16 May-16 Jun-16 Jul-16 Aug-16 Sep-16 Oct-16 Nov-16 Dec-16 RETAIL EQUITY RESEARCH Coal India Ltd Coal BSE CODE:533278 NSE CODE:
Tech Mahindra ACCUMULATE. Performance Highlights. CMP Target Price `659 `693. 3QFY2012 Result Update IT. Key financials (Consolidated, Indian GAAP)
") 3QFY2012 Result Update IT February 9, 2012 Tech Mahindra Performance Highlights (` cr) 3QFY12 2QFY12 % chg (qoq) 3QFY11 % chg (yoy) Net revenue 1,445 1,333 8.4 1,211 19.3 EBITDA 234 204 14.8 250 (6.2)
3QFY2012 Result Update IT February 9, 2012 Tech Mahindra Performance Highlights (` cr) 3QFY12 2QFY12 % chg (qoq) 3QFY11 % chg (yoy) Net revenue 1,445 1,333 8.4 1,211 19.3 EBITDA 234 204 14.8 250 (6.2)
Gillette India. Institutional Equities. 2QFY19 Result Update BUY. Marketing Investments Mask Improved Top-line Performance
 2QFY19 Result Update Gillette India 13 February 2019 Reuters: GILE.NS; Bloomberg: GILL IN Marketing Investments Mask Improved Top-line Performance Gillette India s (GILL) 2QFY19 operating and net earnings
Recommendation HOLD Results in line with our expectations CMP (15/10/2010) Rs Target Rs Sector
 Rs Target Rs Sector") Recommendation HOLD Results in line with our expectations CMP (15/10/2010) Rs. 3212 Target Rs. 3208 Sector IT & Software BSE Code NSE Code Bloomberg Code Market Cap (Rs. cr) Free Float (%) 52- wk HI/Lo
Recommendation HOLD Results in line with our expectations CMP (15/10/2010) Rs. 3212 Target Rs. 3208 Sector IT & Software BSE Code NSE Code Bloomberg Code Market Cap (Rs. cr) Free Float (%) 52- wk HI/Lo
BUY. White cement steals the show JK CEMENT. Target Price: Rs 1,220. Other highlights
 JK 20 NOV 2017 Quarterly Update BUY Target Price: Rs 1,220 White cement steals the show JK Cement s (JKCE) Q2FY18 EBITDA at Rs 2.1 bn (up 30% YoY) was higher than our and consensus estimates, mainly due
ITC Ltd. BUY CMP (Rs.) 304 Target (Rs.) 336 Potential Upside(%) 11% Valuation: Investment Rationale. For private circulation only
 304 Target (Rs.) 336 Potential Upside(%) 11% Valuation: Investment Rationale. For private circulation only") Aug-17 Sep-17 Oct-17 Nov-17 Dec-17 Jan-18 Feb-18 Mar-18 Apr-18 May-18 Jun-18 Jul-18 Aug-18. Volume No.. I Issue No. 186 ITC Ltd September 21, 2018 BSE Code: 500875 NSE Code: ITC Reuters Code: ITC.NS Bloomberg
Aug-17 Sep-17 Oct-17 Nov-17 Dec-17 Jan-18 Feb-18 Mar-18 Apr-18 May-18 Jun-18 Jul-18 Aug-18. Volume No.. I Issue No. 186 ITC Ltd September 21, 2018 BSE Code: 500875 NSE Code: ITC Reuters Code: ITC.NS Bloomberg
ULTRAMARINE & PIGMENTS LTD
 02 December 2016 ULTRAMARINE & PIGMENTS LTD CMP INR 170 Initiating Coverage (BUY) Target Price INR 226 Stock Details Industry SPECIALTY CHEMICALS Bloomberg Code UMP:IN BSE Code 506685 Face Value (Rs.)
Colgate-Palmolive (India)
") Result Update Colgate-Palmolive (India) 27 July 218 Reuters: COLG.BO; Bloomberg: CLGT IN Tough Times Continue Colgate-Palmolive (India) or CLGT reported a mixed earnings performance in. Volume and revenue
Result Update Colgate-Palmolive (India) 27 July 218 Reuters: COLG.BO; Bloomberg: CLGT IN Tough Times Continue Colgate-Palmolive (India) or CLGT reported a mixed earnings performance in. Volume and revenue
SpiceJet ACCUMULATE. Performance Highlights. 4QFY2010 Result Update I Aviation
 4QFY2010 Result Update I Aviation June 3, 2010 SpiceJet Performance Highlights For 4QFY2010, SpiceJet s Top-line grew 34.3% yoy but fell 12.8% qoq to Rs560cr, slightly lower than our estimate of Rs590cr.
Religare Investment Call
 v-17 Dec-17 Jan-18 Feb-18 Mar-18 Apr-18 May-18 Jun-18 Jul-18 Aug-18 Sep-18 Oct-18 v-18 Q2FY19 Result Update Q2FY19 Result Update BUY CMP (Rs) 5,813 Target Price (Rs) 6,519 Potential Upside 12.1% Sensex
Vakrangee Ltd BUY. Speciality Retail. Company Update. Aug 07, Vakrangee Ltd. Recommendation (Rs.)
") Company Update Speciality Retail Addition of Service Offerings will Ramp up the Business PAT increased by 38.3% YoY on strong revenue growth: During Q1FY18, the revenue stood at Rs. 13047 Mn as against
Company Update Speciality Retail Addition of Service Offerings will Ramp up the Business PAT increased by 38.3% YoY on strong revenue growth: During Q1FY18, the revenue stood at Rs. 13047 Mn as against
Tech Mahindra ACCUMULATE. Performance Highlights CMP. `955 Target Price `1,070. 2QFY2013 Result Update IT. Investment Period 12 months
 2QFY2013 Result Update IT November 5, 2012 Tech Mahindra Performance Highlights (` cr) 2QFY13 1QFY13 % chg (qoq) 2QFY12 % chg (yoy) Net revenue 1,631 1,543 5.7 1,333 22.4 EBITDA 338 330 2.3 204 65.4 EBITDA
CCL Products BUY. Performance Update. CMP Target Price `278 `360. 3QFY2018 Result Update Coffee. Historical share price chart.
 Feb-15 May-15 Aug-15 Oct-15 Jan-16 Apr-16 Jul-16 Oct-16 Jan-17 Apr-17 Jul-17 Oct-17 Jan-18 3QFY2018 Result Update Coffee February 5, 2018 CCL Products Performance Update Y/E March (` cr) Q3FY18 Q3FY17
Goodyear India ACCUMULATE. Performance Highlights. CMP Target Price `326 `374. 1QCY2012 Result Update Tyres. Key financials
 1QCY212 Result Update Tyres June 6, 212 Goodyear India Performance Highlights Y/E December (` cr) 1QCY212 1QCY211 % chg (yoy) 4QCY211 % chg (qoq) Net sales 331 336 (1.6) 395 (16.2) EBITDA 2 24 (18.6) 34
Garware Wall Ropes ACCUMULATE. Performance Highlights CMP. `550 Target Price `618. 2QFY2017 Result Update Textile. Investment Period 12 months
 2QFY217 Result Update Textile November 16, 216 Garware Wall Ropes Performance Highlights Quarterly Data (`cr) 2QFY17 2QFY16 % yoy 1QFY17 % qoq Revenue 232 214 8.5 225 3.3 EBITDA 4 26 5.9 31 29.4 Margin
Reliance Communication
 1QFY213 Result Update Telecom August 13, 212 Reliance Communication Performance highlights (` cr) 1QFY13 4QFY12 % chg (qoq) 1QFY12 % chg (yoy) Net sales 5,319 5,31.2 4,94 7.7 EBITDA 1,65 1,632 1.1 1,61
Bharat Petroleum Corporation Ltd
 Institutional Equity Research Key data 19 June 2008 Sector Oil& Gas Market Cap Rs.7bn/US$2.3bn 52 Wk H/L (Rs) 560/260.25 Avg. daily vol. (6 month) 799,179 BSE Code 500547 NSE Code BPCL Bloomberg BPCLIN
Century Plyboards Ltd
 May-15 Aug-15 Nov-15 Feb-16 May-16 Aug-16 Nov-16 Feb-17 May-17 Aug-17 Nov-17 Feb-18 4QFY2018 Result Update Plywood May 19, 2018 Century Plyboards Ltd Performance Update (Rs cr) 4QFY18 4QFY17 % yoy 3QFY17
Mahindra & Mahindra Ltd.
 May-15 Aug-15 Nov-15 Feb-16 May-16 Aug-16 Nov-16 Feb-17 May-17 Aug-17 Nov-17 Feb-18 4QFY2018 Result Update Automobile May 30, 2018 Mahindra & Mahindra Ltd. Performance Update Y/E March (` cr) 4QFY18 4QFY17
MindTree Ltd. Investment Rationale. For private circulation only. October 7 th, Volume No. I. Issue No. 43
 Oct-14 Nov-14 Dec-14 Jan-15 Feb-15 Mar-15 Apr-15 May-15 Jun-15 Jul-15 Aug-15 Sep-15 Oct-15. Volume No. I. Issue No. 43. MindTree Ltd. October 7 th, 2015 BSE Code: 532819 NSE Code: MINDTREE Reuters Code:
L&T Infotech Limited
 IPO NOTE Key Details: July 5, 2016 Issue Key Highlights: Price*: `705 - `710 Issue Opens: 11 th July 2016 Issue Size*: `1228 - `1236 Cr Issue Close: 13 th July 2016 *A discount of Rs.10/- per share will
INDIAN TONERS & DEVELOPERS LTD
 29 March 2017 INDIAN TONERS & DEVELOPERS LTD CMP INR 160 Initiating Coverage (BUY) Target Price INR 220 Stock Details Industry SPECIALTY CHEMICALS Bloomberg Code INTD:IN BSE Code 523586 Face Value (Rs.)
Kalpataru Power. Rating: Target price: EPS: Rating CMP. Target BUY. Rs Rs.256
 : price: EPS: How does our one year outlook change? We expect KPP s revenue (standalone) to grow by 21% y-o-y in FY17E backed by an order book of Rs. 91bn (1.7x FY17E book-to-bill). Both Transmission line
APOLLO TYRES LTD. October 19 th, CMP (Rs.) 194. Key Developments
 194. Key Developments") Oct-14 Nov-14 Dec-14 Jan-15 Feb-15 Mar-15 Apr-15 May-15 Jun-15 Jul-15 Aug-15 Sep-15 Oct-15 s. APOLLO TYRES LTD.. October 19 th, 2015 BSE Code: 500877 NSE Code: APOLLOTYRE Reuters Code: APLO.NS Bloomberg
Oct-14 Nov-14 Dec-14 Jan-15 Feb-15 Mar-15 Apr-15 May-15 Jun-15 Jul-15 Aug-15 Sep-15 Oct-15 s. APOLLO TYRES LTD.. October 19 th, 2015 BSE Code: 500877 NSE Code: APOLLOTYRE Reuters Code: APLO.NS Bloomberg
Mahindra & Mahindra Ltd.
 Jan-16 Apr-16 Jul-16 Oct-16 Jan-17 Apr-17 Jul-17 Oct-17 Jan-18 Apr-18 Jul-18 Oct-18 Jan-19 3QFY2019 Result Update Automobile February 15, 2019 Mahindra & Mahindra Ltd. Performance Update Y/E March (` cr)
Punjab National Bank
 Nov-14 Dec-14 Jan-15 Mar-15 Apr-15 May-15 Jul-15 Aug-15 Sep-15 Nov-15 India Research Banking November 09, 2015 QUARTERLY REVIEW Bloomberg: PNB IN Reuters: PNBK.BO SELL Asset quality improves but recovery
BUY. Efforts on cost cutting paying off RAMCO CEMENTS. Target Price: Rs 435. Key highlights. Key drivers FY15 FY16E FY17E
 RAMCO S BUY Target Price: Rs 435 Efforts on cost cutting paying off Q2 EBITDA at Rs 2.8 bn (up 30% YoY) was ahead of our estimates due to lower-than-expected costs. Average costs (excluding freight) declined
Reduce. Punjab National Bank Banking RETAIL EQUITY RESEARCH. Not out of the woods. GEOJIT BNP PARIBAS Research. 10 th August 2016 Q1FY17 RESULT UPDATE
 Q1FY17 RESULT UPDATE Aug-15 Sep-15 Oct-15 GEOJIT BNP PARIBAS Research Nov-15 Dec-15 Jan-16 Feb-16 Mar-16 Apr-16 May-16 Jun-16 Jul-16 Aug-16 RETAIL EQUITY RESEARCH Punjab National Bank Banking BSE CODE:
Persistent Systems Ltd
 Dec-15 Jan-16 Feb-16 Mar-16 Apr-16 May-16 Jun-16 Jul-16 Aug-16 Sep-16 Oct-16 Nov-16 Dec-16. Volume No.. I Issue No. 102 Persistent Systems Ltd Dec. 23, 2016 BSE Code: 533179 NSE Code: PERSISTENT Reuters
Key estimate revision. Financial summary. Year FY15 121, % 16, % FY16E 137, % 20,
 : price: EPS: How does our one year outlook change? We maintain rating on Aurobindo post the company s 3QFY16 results. Revenue growth for the quarter was 10% yoy: US sales of $238mn (vs. estimate of $251mn
Tata Steel NEUTRAL. Performance Highlights CMP. `226 Target Price - 2QFY2016 Result Update Steel. Investment Period - 3-year price chart
 2QFY2016 Result Update Steel November 6, 2015 Tata Steel Performance Highlights Standalone (` cr) 2QFY16 2QFY15 yoy % 1QFY16 qoq % Net revenue 9,531 10,785 (11.6) 9,094 4.8 EBITDA 1,862 3,094 (39.8) 1,689
HCL Technologies. Rating: Target price: EPS: Target CMP. Rating. Rs. 826 REDUCE. Rs.760
 : price: EPS: How does our one year outlook change? HCLT registered a strong quarter with revenues growing at 6.5% qoq (4% qoq organic) including $40m contribution from Volvo, after a disappointing show
Reliance Industries. Timing is everything BUY COMPANY UPDATE 1 OCT 2014
 INDUSTRY OIL & GAS Timing is everything COMPANY UPDATE 1 OCT 2014 Reliance Industries BUY CMP (as on 30 Sep 2014) Rs 945 Target Price Rs 1,100 Nifty 7,965 Sensex 26,631 KEY STOCK DATA Bloomberg/Reuters
NIIT Technologies. 3QFY19 Result Update. Robust revenue visibility, Outlook robust
 NIIT Technologies 3QFY19 Result Update Robust revenue visibility, Outlook robust Sector: Technology CMP: `1227 Recommendation: Buy Market statistics Current stock price (`) 1,227 Shares O/S (cr.) 6.1 Mcap
Apollo Hospitals Enterprise Ltd.
 Dec-16 Jan-17 Feb-17 Mar-17 Apr-17 May-17 Jun-17 Jul-17 Aug-17 Sep-17 Oct-17 Nov-17 Dec-17. Volume No.. I Issue No. 154 Apollo Hospitals Enterprise Ltd. December 19, 2017 BSE Code: 508869 NSE Code: APOLLOHOSP
Apollo Micro Systems Ltd
 IPO Note Financials Jan 08, 2018 Apollo Micro Systems Ltd Incorporated in 1997, Apollo Micro Systems Limited (AMSL) is a Hyderabad based company engaged in the business of electronic, electro-mechanical,
Ambuja Cements NEUTRAL. Performance Highlights CMP. `184 Target Price - 2QCY2012 Result Update Cement. Quarterly results (Standalone)
") 2QCY2012 Result Update Cement Ambuja Cements Performance Highlights Quarterly results (Standalone) Y/E Dec. (` cr) 2QCY2012 1QCY2012 % chg qoq 2QCY2011 % chg yoy Net Sales 2,566 2,633 (2.6) 2,173 18.1
2QCY2012 Result Update Cement Ambuja Cements Performance Highlights Quarterly results (Standalone) Y/E Dec. (` cr) 2QCY2012 1QCY2012 % chg qoq 2QCY2011 % chg yoy Net Sales 2,566 2,633 (2.6) 2,173 18.1
D-Link India (DLILIM) 105
 105") Company Update Rating matrix Rating : Buy Target : 140 Target Period : 18-24 months Potential Upside : 34% What s Changed? Target Changed from 150 to 140 EPS FY18E Changed from 11.4 to 9.5 EPS FY19E Introduced
Company Update Rating matrix Rating : Buy Target : 140 Target Period : 18-24 months Potential Upside : 34% What s Changed? Target Changed from 150 to 140 EPS FY18E Changed from 11.4 to 9.5 EPS FY19E Introduced
Greenply Industries BUY. The plywood maker for growing India. Target Price. Initiating Coverage Plywood. 3-year price chart.
 Initiating Coverage Plywood March 03, 2018 Greenply Industries The plywood maker for growing India Greenply Industries Ltd (GIL) manufactures plywood & allied products and medium density fibreboards (MDF).