JPMorgan High Yield Conference January 22, 2008
|
|
|
- Buddy Carr
- 6 years ago
- Views:
Transcription


1 JPMorgan High Yield Conference January 22, 2008

2 Forward Looking Statements Disclaimer The following information contains, or may be deemed to contain, forward-looking statements (as defined in the U.S. Private Securities Litigation Reform Act of 1995). By their nature, forward-looking statements involve risks and uncertainties because they relate to events and depend on circumstances that may or may not occur in the future. The future results of the company may vary from the results expressed in, or implied by, the following forward-looking statements, possibly to a material degree. For a discussion of some of the important factors that could cause the company s results to differ from those expressed in, or implied by, the following forward-looking statements, please refer to the company s Offering Circular. The company undertakes no obligation to update or revise any forward-looking statements. 2
3 Company Overview High-end specialty retailer offering luxury apparel and accessories Specialty Retail LTM Revenue: Neiman Marcus Direct $4.5 Billion* 3 * Note: LTM revenue is as of Q1 FY 2008 and excludes Kate Spade LLC.
4 Prime Store Locations Minneapolis Chicago Northbrook, Oakbrook Troy Westchester, NYC - BG (2) LA, SF, Palo Alto, San Diego, Newport Beach 1 Honolulu 5 Las Vegas 1 1 Scottsdale Denver King of Prussia Atlanta 2 Short Hills, Paramus Tyson s Corner Boston, Natick Washington D.C. Charlotte 39 Neiman Marcus Stores 2 Bergdorf Goodman Stores Total Specialty Square Footage: 5.6M Northpark, Houston, Dallas, Plano, Ft. Worth, San Antonio, Austin St. Louis Bal Harbour, Coral Gables, Ft. Lauderdale, Tampa Bay, Orlando, Palm Beach, Boca Raton Geographically diverse store base in premier locations in the nation s most affluent markets 4
5 Professional, Relationship-Focused Salesforce Focus on building long-term relationships, not just transactions Highly specialized sales associate selection, training, and development programs Sales Associate Turnover Sales Associate Productivity (3) 65% 66% 32% 20% Neiman Marcus Specialty Retail (2) Retail Average (1) % of Associates Selling Over $500K % of Associates Selling Over $1M (1) Includes all full-time and part-time sales associates for fiscal 2007 for Neiman Marcus Stores and Bergdorf Goodman. (2) Retail average turnover statistics are for full-time only sales staff provided by 2005 National Retail Federation Annual Compensation and Benefits Survey. (3) Represents fiscal 2007 revenues at Neiman Marcus full-line stores and Bergdorf Goodman only. Excludes associates with less than one year of service. 5
 $1,600 $1,400 %")


6 Unique Customer Loyalty Program Unique and powerful InCircle rewards program drives superior loyalty from an attractive, affluent customer base InCircle Program Revenue InCircle Customer Behavior InCircle Sales Non-InCircle InCircle ($ in millions) $1,600 $1,400 % of Total Neiman Marcus Store Sales 10% CAGR $1,324 $1,567 60% Annual Purchases ($) $629 $12,333 Difference vs. Non-InCircle 19.6x Trips Per Year Difference vs. Non-InCircle 5.1x $1,200 $1,000 $800 $880 40% $850 $894 41% $1,174 $1,008 45% 43% 46% 51% 50% 40% Spend Per Item ($) $86 $212 Difference vs. Non-InCircle 2.5x $600 37% $ Calendar Year 30% Note: InCircle customer behavior data presented for calendar year Customer behavior statistics based on private label credit card information only. 6
7 Powerful Relationships With Diverse Group of Top Vendors 2007 Merchandise Mix (1) No dependency on any one product category Designer and Precious Jewelry Home Furnishings and Décor 9% 11% 37% Women s Apparel Men s Apparel and Shoes 12% 11% 20% Cosmetics and Fragrances Women s Shoes, Handbags and Accessories Neiman Marcus long-term relationships with leading designers and diverse merchandise base mitigates fashion / brand risk (1) Amounts exclude revenues from leased departments. 7
8 Specialty Retail Initiatives Drive Greater Merchandise Productivity Attract and Develop a Younger Customer Base Maximize Return on Full Line Stores Expand Last Call Clearance Centers Maintaining and Expanding our Leadership Position 8
9 Focused Expansion Strategy STATE COMPLETION DATE SQ. FOOTAGE New Stores Natick Massachusetts September 2007 (Opened) 100,000 Topanga California Fall ,000 Bellevue Washington Fall ,000 Sarasota Florida Fall ,000 Princeton New Jersey Spring ,000 Long Island New York TBD 150,000 Remodels San Diego California Summer 2007 No additional sq. footage Atlanta Georgia Spring 2008 Additional 50,000 Westchester New York Summer 2008 No additional sq. footage 9

10 Natick, MA Natick Mall Opened: September ,000 square feet 10

11 Topanga, CA Topanga Plaza Scheduled opening: Fall ,000 square feet 11

12 Bellevue, WA The Bravern Scheduled opening: Fall ,000 square feet 12
13 Last Call Clearance Centers 22 Clearance Centers in 12 states 20 Last Call 2 Horchow Planned 3 additional stores in FY 08 including 1 Horchow Evaluating potential opportunity of business model Developing infrastructure to support growth Distribution Merchandising Beginning to view as separate business unit 13


14 Last Call Clearance Centers 14

15 CUSP store openings LOCATION MALL/AREA OPENING DATE SQ. FOOTAGE Washington, DC Tyson s Mall July ,500 Los Angeles, CA Century City August ,100 Washington, DC Georgetown March ,000 Northbrook, IL Northbrook Court July ,000 15

16 CUSP 16

17 CUSP 17
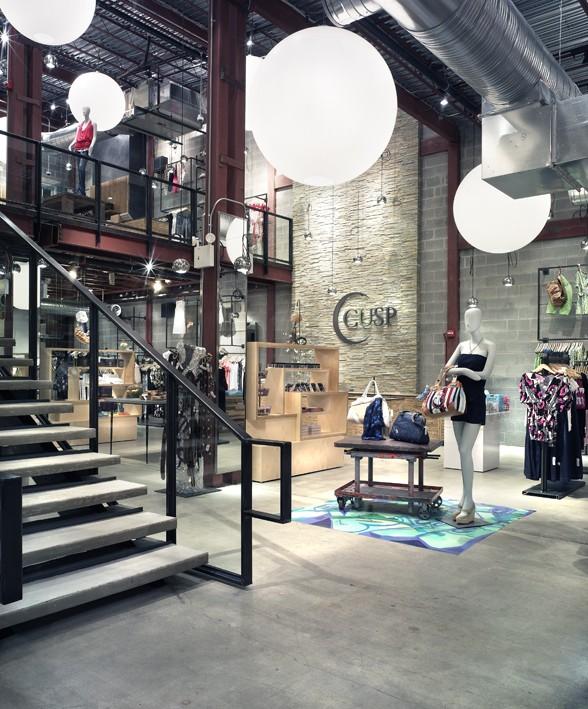

18 CUSP 18

19 19

20 20


21 Neiman Marcus Direct
22 Neiman Marcus Direct Expanding Brand Reach Through Multi-Channels 22


23 Direct Marketing Initiatives Innovative marketing Designer sites Customer personalization Online clearance Technology investment 23
24 Growth of Internet FY 2002 FY % 30% 83% 70% Catalog Internet Rapid internet growth resulting in strong operating results. 24
25 Business Activities Present Fiscal Year Launched internet business 2000 Formed separate NMG Corporate team 2001 Formed new Merchandise Planning Group 2003 Launched BG.com 2005 Formed Strategic Planning Team 2005 Sold Chef s Catalog 2005 Developed Designer Sites 2005 Sold Credit Card Portfolio 2005 Sold NMG to Private Equity 2006 Sold Gurwitch Products 2006 Opened first CUSP store 2006 Sold Kate Spade


26 Financial Overview
27 Historical Financial Performance Historical Financial Performance ($ in millions) $1,888 $2,580 $2,181 $2,338 $2,042 $150 $159 $183 $199 $183 7% Revenue CAGR 11% EBIT CAGR $2,913 $2,998 $2,861 $248 $203 $173 $3,001 $214 $3,421 $336 $3,695 $407 $4,030 $447 $4,390 $4,483 $550 $ LTM Q Fiscal Years Ending July Revenue EBIT Consistent growth through multiple business and economic cycles highlighted by 12 year Revenue and EBIT CAGRs of 7% and 11%, respectively Note: All information for 2000 and thereafter reflects the change in classification of revenues deferred in connection with the Company s loyalty programs. EBIT figures exclude non-recurring items. FY have been restated to exclude Brand Development. FY 2002 reflects 53 weeks ended August 3, Operating earnings are adjusted to exclude amortization of customer lists and favorable lease commitments, purchase accounting adjustments, transaction and other costs and other non-recurring items. 27
28 Financial Metrics Specialty Retail Revenue ($ in millions) ($ in millions) Specialty Retail EBIT 6% CAGR $3,375 $3,675 $3,756 10% CAGR $378 $404 $491 $500 $2,442 $2,487 $2,417 $2,507 $2,850 $3,103 $249 $201 $171 $ % $ % 12.2% 12.0% 13.4% 13.3% 10.2% 8.1% 7.1% LTM Q1 '08 NMD Revenue ($ in millions) ($ in millions) LTM EBIT EBIT Margin Q1 '08 NMD EBIT 8% CAGR $571 $494 $438 $444 $405 $715 $727 $655 $592 $2 83% CAGR $61 $ % $23 $11 9.3% 2.5% 5.1% $116 $119 $98 $ % 16.2 % 16.4 % 12.7 % LTM LTM Q1 '08 Q1 '08 EBIT EBIT Margin Note: Specialty Retail revenue reflects the change in classification of revenues deferred in connection with the Company s loyalty programs. 28
29 Superior Performance NMG Sales per Square Foot $440 $452 $497 $511 $478 $472 $528 $577 $611 $638 $ LTM Q1 '08 NMG Comparable Revenue Growth 6.0% 2.6% 11.8% 2.3% 3.8% 14.0% 9.8% 7.3% 6.7% 6.6% -4.4% LTM Q1 '08 Note: NMG comparable revenue growth figures for reflect the change in classification of revenues deferred in connection with the Company s loyalty programs and reflect the sale of Gurwitch Products and Kate Spade. NMG Sales per Square Foot figures represent Specialty Retail and exclude clearance centers. 29
30 Superior Performance $700 $600 $500 $400 $300 $200 $100 Sales Per Square Foot Note Figures are from LTM ending Nov 3, NMG data is for the Specialty Retail segment only (Full line Neiman Marcus Stores and Bergdorf Goodman). SFAE is estimated Saks Fifth Avenue stores and internet sales (excludes estimated clearance center sales). 30
31 FY 2008 Q1 Financial Highlights NMG Q1 '08 Q1 '07 % change Comparable Sales 6.5% 6.8% Adjusted Operating Earnings ($M)* $175 $ % Adjusted Operating Margin 15.5% 16.2% Specialty Retail Comparable Store Sales 6.4% 5.4% Operating Earnings ($M) $166 $ % Operating Margin 17.2% 17.8% Neiman Marcus Direct Sales Growth 7.1% 14.7% Operating Earnings ($M) $23 $ % Operating Margin 13.6% 13.1% Source Neiman Marcus, Inc. FY2008 Q1 Earnings Release (for the fiscal period ended October 27, 2007). Figures exclude Kate Spade LLC. *Adjusted Operating earnings represents operating earnings excluding amortization of customer lists and favorable lease commitments and other income. 31
32 Summary Balance Sheet ($ in millions) Q Q Cash $ 81 $ 159 Merchandise inventories 1, Current liabilities $ 796 $ 810 Long-term debt 2,946 3,196 Shareholder s equity $ 1,626 $ 1,449 32
33 Historical Capital Expenditures Average gross capex spend of $153 million between 2001 and 2007 FY 2001 FY 2006 FY % 27% 21% 38% 22% 26% 23% 18% New Stores Major Remodels Information Technology Other Note: Figures represent gross capital expenditures. FY01 FY05 include Brand Development. 33
34 Leverage Ratio Q1 FY 06 Q4 FY 06 Q4 FY 07 Q1 FY 08 Leverage ratio is calculated as Total Debt / LTM Adjusted EBITDA LTM adjusted EBITDA excludes purchase accounting adjustments and transaction and other costs. (See EBITDA Reconciliation). Figures exclude Brand Development. 34
35 Capitalization (As of October 27, 2007) ($ in millions) Q1 FY '08 % of Q1 FY '06 % of 10/27/2007 Cap. 10/29/2005 Cap. $600 Million Asset-Based Revolving Credit Facility 0 0.0% % Senior Debentures due 2028 (7.125%) % % Senior Secured Term Loan 1, % 1, % Other Senior Secured Debt 3 0.1% 6 0.1% Total Senior Secured Debt $1, % $2, % Senior Unsecured Notes (9.00%) % % Total Senior Debt $2, % $2, % Senior Subordinated Notes (10.375%) % % Total Debt $2, % $3, % Equity 1, % 1, % Total Capitalization $4, % $4, % No maintenance covenants or mandatory amortization Senior Unsecured Notes Cash / PIK feature provides flexibility Excess liquidity from $600 million Asset-Based Revolver 35
36 Reconciliation of Adjusted Operating Earnings Thirteen Thirteen weeks ended weeks ended Oct 27, Oct 28, (dollars in millions) OPERATING EARNINGS: Specialty Retail Stores $ 166 $ 157 Direct Marketing Corporate expenses (14) (9) ADJUSTED OPERATING EARNINGS $ 175 $ 168 Amortization of intangible assets (18) (18) Other income 33 4 OPERATING EARNINGS $ 190 $ 154 Depreciation & Amortization Source Neiman Marcus, Inc. 10-Q (For the fiscal period ended Oct 27, 2007). 36
37 EBITDA Reconciliation ($ in millions) Q1 FY '08 Q4 FY '07 Q4 FY '06 Q1 FY '06 LTM EBITDA (Reported) 1 $ 723 $ 686 $ 515 $ 509 Adjustments: Inventory purchase price adjustment Transaction costs Gain on credit card transaction (6) Non-cash gain on curtailment of defined benefit retirement obligation (33) Total EBITDA adjustments (33) LTM EBITDA (Adjusted) $ 690 $ 686 $ 577 $ 534 Debt/LTM EBITDA (Adjusted) (1) LTM EBITDA excludes Gurwitch Products and Kate Spade. 37
38
Lehman Brothers High Yield Bond & Syndicated Loan Conference March 28, 2007 Scottsdale, AZ
 Lehman Brothers High Yield Bond & Syndicated Loan Conference March 28, 2007 Scottsdale, AZ Forward Looking Statements Disclaimer The following information contains, or may be deemed to contain, forward-looking
JP Morgan High Yield Conference January 22, 2007 Miami, Florida
 JP Morgan High Yield Conference January 22, 2007 Miami, Florida Forward Looking Statements Disclaimer The following information contains, or may be deemed to contain, forward-looking statements (as defined
Deutsche Bank Leveraged Finance Conference September 25, 2008
 Deutsche Bank Leveraged Finance Conference September 25, 2008 Forward Looking Statements Disclaimer The following information contains, or may be deemed to contain, forward-looking statements (as defined
Wachovia Equity & Fixed Income Consumer Conference October 15, 2008
 Wachovia Equity & Fixed Income Consumer Conference October 5, 2008 Forward Looking Statements Disclaimer The following information contains, or may be deemed to contain, forward-looking statements (as
Bank of America Securities 2008 Credit Conference November 20, 2008
 Bank of America Securities 2008 Credit Conference November 20, 2008 Forward Looking Statements Disclaimer The following information contains, or may be deemed to contain, forward-looking statements (as
Lehman Brothers High Yield Bond and Syndicated Loan Conference March 13, 2008
 Lehman Brothers High Yield Bond and Syndicated Loan Conference March 13, 2008 Forward Looking Statements Disclaimer The following information contains, or may be deemed to contain, forward-looking statements
Credit Suisse Global Leveraged Financial Conference March 27, 2008
 Credit Suisse Global Leveraged Financial Conference March 27, 2008 Forward Looking Statements Disclaimer The following information contains, or may be deemed to contain, forward-looking statements (as
JPMorgan High Yield Conference. February 2006
 JPMorgan High Yield Conference February 2006 Forward Looking Statements Disclaimer The following information contains, or may be deemed to contain, forward-looking statements (as defined in the U.S. Private
Lehman Brothers 2006 High Yield Bond & Syndicated Loan Conference. March 2006
 Lehman Brothers 2006 High Yield Bond & Syndicated Loan Conference March 2006 Forward Looking Statements Disclaimer The following information contains, or may be deemed to contain, forward-looking statements
W H AT S I N The Neiman Marcus Group Annual Report 2002
 WHAT S IN The Neiman Marcus Group Annual Report 2002 Dear Shareholder, We live in an ever-changing world. What s popular one season can be out the next. And by no means is that limited to fashion. But
ZipRealty, Inc. Supplemental Data Reclassification of Consolidated Statement of Operations
 Reclassification of Consolidated Statement of Operations Effective January 1, 2007, for income statement presentation purposes, we have reclassified sales support and marketing expenses from general and
THE NEIMAN MARCUS GROUP ANNUAL REPORT
 THE NEIMAN MARCUS GROUP ANNUAL REPORT 2000 On the cover: Detail, Judith Leiber handbag in berry alligator. Featured on page 17. LUXE IS: MORE At The Neiman Marcus Group, luxe is more than a designer label
2017 Jefferies Consumer Conference
 207 Jefferies Consumer Conference June 20, 207 Tom Taylor Chief Executive Officer Forward-Looking Statements This presentation and the associated webcast contain forward-looking statements, including with
The Five Retail Trends to Watch in January 14, 2015
 The Five Retail Trends to Watch in 2015 January 14, 2015 U.S. ECONOMIC TRENDS Inflation Adjusted Crude Oil Prices Fall Below Long-Term Average Price per Barrel (Nov. 2014 Dollars) $160 $120 $80 $40 $0
 Page 1 of 6 Print Page Close Window Nordstrom Reports Second 2010 Earnings SEATTLE, Aug 12, 2010 (BUSINESS WIRE) -- Nordstrom, Inc. (NYSE:JWN) today reported net earnings of $146 million, or $0.66 per
Mattress Firm s Pending Acquisition of Sleepy s November 30, 2015
 Mattress Firm s Pending Acquisition of Sleepy s November 0, 2015 Forward Looking Statements and Non-GAAP Information This presentation contains forward-looking statements within the meaning of federal
Deutsche Bank Global Industrials and Basic Materials Conference June 14, 2012
 Deutsche Bank Global Industrials and Basic Materials Conference June 14, 2012 1 Statement Of Forward-looking Information Certain information included in this presentation is forward-looking within the
Presented By: Doug Herzbrun Managing Director January 26, 2000
 NORTHWEST CONSTRUCTION CONSUMER COUNCIL Presented By: Doug Herzbrun Managing Director January 26, 2000 U.S. Real Estate Capital Markets Overview INVESTABLE UNIVERSE $1.1 TRILLION 3 INVESTABLE UNIVERSE
SUNSTONE HOTEL INVESTORS, INC. Company Presentation. September 2011
 Company Presentation September 2011 Forward-Looking Statements This presentation contains forward-looking statements that have been made pursuant to the provisions of the Private Securities Litigation
<DOCUMENT> <TYPE>424B2 <SEQUENCE>1 <DESCRIPTION>HARCOURT GENERAL PROSPECTUS SUPPLEMENT FILING <TEXT>
 424B2 1 HARCOURT GENERAL PROSPECTUS SUPPLEMENT FILING PROSPECTUS SUPPLEMENT (To Prospectus Dated July 9, 1997) Filed pursuant to Rule 424(b)(2) Registration
Europe June Carol Tomé Executive Vice President, Corporate Services & Chief Financial Officer. Diane Dayhoff Vice President, Investor Relations
 Europe June 2017 Carol Tomé Executive Vice President, Corporate Services & Chief Financial Officer Diane Dayhoff Vice President, Investor Relations Forward Looking Statements and Non-GAAP Financial Measurements
NMG Investment Case 3Q17 Update June 14, 2017
 INCOME STATEMENT REVENUES Bergdorf Goodman 809 844 784 185 202 168 167 722 181 202 170 169 722 185 206 174 173 737 752 767 Y/Y Growth (%) NA 4.4% (7.2)% (7.5)% (10.7)% (7.7)% (5.0)% (7.9)% (2.0)% 0.0%
Australia/Asia July Diane Dayhoff Vice President, Investor Relations. Lyndsey Burton Senior Manager, Investor Relations
 Australia/Asia July 2017 Diane Dayhoff Vice President, Investor Relations Lyndsey Burton Senior Manager, Investor Relations Forward Looking Statements and Non-GAAP Financial Measurements Certain statements
December Operating Priorities & Global Growth Strategy
 December 2011 Operating Priorities & Global Growth Strategy Operating Priorities Achieve medium term margin targets and strengthen income quality Leverage strengthening local markets positions - Maximize
Item 7. Management s Discussion and Analysis of Financial Condition and Results of Operation.
 Item 7. Management s Discussion and Analysis of Financial Condition and Results of Operation. Nordstrom is a fashion specialty retailer offering high-quality apparel, shoes, cosmetics and accessories for
US Hotel Industry Overview. Chris Crenshaw
 US Hotel Industry Overview Chris Crenshaw ccrenshaw@str.com July 2014 (12 MMA): All Signs Point To A Sellers Market % Change Room Supply* 1.8 bn 0.8% Room Demand* 1.1 bn 3.4% Occupancy 63 % 2.6% A.D.R.*
Affirms Full-Year EPS Guidance
 Print Page Close Window Nordstrom Reports First Quarter 2013 Earnings Affirms Full-Year EPS Guidance SEATTLE--(BUSINESS WIRE)--May. 16, 2013-- Nordstrom, Inc. (NYSE: JWN) today reported earnings per diluted
Highlands Spin-Off & Student Housing Transaction Webcast. January 18, 2016
 Highlands Spin-Off & Student Housing Transaction Webcast January 18, 2016 Disclaimer Forward-Looking Statements in this presentation, which are not historical facts, are forward-looking statements within
Financial Strength and Operational Excellence
 Financial Strength and Operational Excellence 425 Mass Washington, D.C. RiverTower New York, NY Longacre House New York, NY 1401 Joyce on Pentagon Row Arlington, VA JUNE 2010 Trump Place New York, NY 180
Office-Using Jobs and Net Migration Point to Continued Strength
 October 20, 2017 Office-Using Jobs and Net Migration Point to Continued Strength Key Takeaways Secondary Sunbelt office markets are priced to offer attractive, risk-adjusted returns relative to the Gateway²
Supplemental Financial Information Q2 2018
 A P O L L O C O M M E R C I A L R E A L E S T A T E F I N A N C E, I N C. Supplemental Financial Information Q2 2018 July 25, 2018 Information is as of June 30, 2018, except as otherwise noted. It should
ERRATA. To: Recipients of MG-388-RC, Estimating Terrorism Risk, RAND Corporation Publications Department. Date: December 2005
 ERRATA To: Recipients of MG-388-RC, Estimating Terrorism Risk, 25 From: RAND Corporation Publications Department Date: December 25 Re: Corrected pages (pp. 23 24, Table 4.1,, Density, Density- Weighted,
CAPITALIZATION RATES BY PROPERTY TYPE
 RATES BY PROPERTY TYPE MID-YEAR 2014 0 RATES BY ASSET TYPE MID-YEAR 2014 O V E R V I E W Capital continues to flow steadily into the U.S. real estate market, as both domestic and foreign investors increase
Supplemental Financial Information Q4 2018
 A P O L L O C O M M E R C I A L R E A L E S T A T E F I N A N C E, I N C. Supplemental Financial Information Q4 2018 February 13, 2019 Information is as of December 31, 2018, except as otherwise noted.
Investor Presentation September 2012
 Investor Presentation September 2012 DISCLAIMER FORWARD LOOKING STATEMENTS Certain information contained in this presentation, particularly information regarding future economic performance, finances,
The University of Chicago Booth School of Business
 The University of Chicago Booth School of Business David Simon Chairman & CEO Simon Property Group November 10, 2011 The Economic Roller Coaster High Volatility The market is down / The market is up Market
AEI Center on Housing Markets and Finance Announces Ten Best and Worst Metro Areas to Be a First Time Homebuyer
 AEI Center on Housing Markets and Finance Announces Ten Best and Worst Metro Areas to Be a First Time Homebuyer Edward Pinto and Tobias Peter November 28th, 2018 New AEI study ranks 50 metros by home price
Senior Housing Properties Trust
 11 Fan Pier Boulevard & 50 Northern Avenue, Boston, MA. Biotech Medical Office Buildings. Primary Tenant: Vertex Pharmaceuticals. REITWeek 2017: NAREIT's Investor Forum June 2017 Disclaimer THIS PRESENTATION
Metro Washington, DC State of the Market
 Metro Washington, DC State of the Market Q1 2016 U.S. office clock San Francisco Peninsula Silicon Valley Houston Dallas, San Francisco Austin Nashville Peaking phase Falling phase Denver, Minneapolis,
Nordstrom Reports First Quarter 2016 Earnings
 Nordstrom Reports First Quarter 2016 Earnings May 12, 2016 SEATTLE--(BUSINESS WIRE)--May 12, 2016-- Nordstrom, Inc. (NYSE:JWN) today reported earnings per diluted share of $0.26 for the first quarter ended
Pending Acquisition of Sleep Train. September 4, 2014
 Pending Acquisition of Sleep Train September 4, 2014 Forward Looking Statements and Non-GAAP Information This presentation contains forward-looking statements within the meaning of federal securities laws,
RELIABILITY. RELATIONSHIPS. RESULTS.
 RELIABILITY. RELATIONSHIPS. RESULTS. DONE DEALS 2013 BEYOND NUMBERS. BEYOND BORDERS. BEYOND EXPECTATIONS. At PNC Business Credit, we have a longterm track record of reliability, with more than 600 done
Office. Office. IRR Viewpoint 2015
 IRR Viewpoint 05 Above: Designed in 95 in the Art Deco style by architect Timothy Pflueger as the Pacific Telephone and Telegraph Building, 40 New Montgomery Street, San Francisco, CA has been the subject
Senior Housing Properties Trust
 11 Fan Pier Boulevard & 50 Northern Avenue, Boston, MA. Biotech Medical Office Buildings. Primary Tenant: Vertex Pharmaceuticals. Square Feet: 1,650,000. Investor Presentation November 2016 Disclaimer.
UNITED STATES SECURITIES AND EXCHANGE COMMISSION Washington, D.C FORM 10-Q
 UNITED STATES SECURITIES AND EXCHANGE COMMISSION Washington, D.C. 20549 FORM 10-Q (Mark One) QUARTERLY REPORT PURSUANT TO SECTION 13 OR 15(d) OF THE SECURITIES EXCHANGE ACT OF 1934 For the quarterly period
Global Benefits & Compensation
 Global Benefits & Compensation July 2007 ALBANY AMSTERDAM ATLANTA BOCA RATON BOSTON CHICAGO DALLAS DELAWARE DENVER FORT LAUDERDALE HOUSTON LAS VEGAS LOS ANGELES MIAMI NEW JERSEY NEW YORK ORANGE COUNTY
View printer-friendly version << Back
 1 of 8 22/04/2014 15:17 Print Page Close Window Press Release View printer-friendly version
Hotel Valuation and Transaction Trends For the U.S. Lodging Industry
 Hotel Valuation and Transaction Trends For the U.S. Lodging Industry Stephen Rushmore, CHA, MAI, FRICS President and Founder HVS International 372 Willis Avenue Mineola, NY 11501 516-248-8828 ext. 204
State of the U.S. Multifamily Market. Q Review and Forecast
 State of the U.S. Multifamily Market Q1 2015 Review and Forecast Agenda Economy Leasing Fundamentals Rent and NOI Trends Single-Family Market Capital Markets Economy page 3 GDP Growth Contributions To
Dillard s Inc. NEUTRAL ZACKS CONSENSUS ESTIMATES (DDS-NYSE)
") March 12, 2015 Dillard s Inc. Current Recommendation SUMMARY DATA NEUTRAL Prior Recommendation Outperform Date of Last Change 01/05/2014 Current Price (03/11/15) $130.28 Target Price $137.00 52-Week High
March 12, 2015 Dillard s Inc. Current Recommendation SUMMARY DATA NEUTRAL Prior Recommendation Outperform Date of Last Change 01/05/2014 Current Price (03/11/15) $130.28 Target Price $137.00 52-Week High
Dillard's, Inc. Reports Fourth Quarter & Fiscal Year Results
 February 24, 2014 Dillard's, Inc. Reports Fourth Quarter & Fiscal Year Results Reports Record Fiscal Year Earnings per Share February 24, 2014 - Little Rock, Arkansas - Dillard's, Inc. (DDS-NYSE) (the
ULTA SALON, COSMETICS & FRAGRANCE, INC. (Exact Name of Registrant as Specified in its Charter)
") UNITED STATES SECURITIES AND EXCHANGE COMMISSION WASHINGTON, DC 20549 FORM 8-K CURRENT REPORT Pursuant to Section 13 or 15(d) of the Securities Exchange Act of 1934 Date of Report (Date of earliest event
UNITED STATES SECURITIES AND EXCHANGE COMMISSION WASHINGTON, DC 20549 FORM 8-K CURRENT REPORT Pursuant to Section 13 or 15(d) of the Securities Exchange Act of 1934 Date of Report (Date of earliest event
Morningstar Document Research
 Morningstar Document Research FORM 10-K NORDSTROM INC - jwn Filed: March 22, 2010 (period: January 30, 2010) Annual report which provides a comprehensive overview of the company for the past year UNITED
The Economic Backdrop When will this cycle end?
 The Economic Backdrop When will this cycle end? How far are we into the current economic expansion? Current expansion in 8 th year; 4 th longest since 1960 Length of economic expansions (months) Apr-91-Feb-01
Forward-Looking Statements
 January 2018 Forward-Looking Statements The Company's assumptions and financial projections in this presentation are based upon "forward-looking" information and are being made pursuant to the safe harbor
Safe Harbor Caution Concerning Forward-Looking Statements Non-GAAP Financial Measures Important Information For Investors And Shareholders
 February 13, 2014 Safe Harbor Caution Concerning Forward-Looking Statements Certain statements in this communication regarding the proposed acquisition of Time Warner Cable Inc. ( Time Warner Cable ) by
Nordstrom continued its progress in executing its strategy to improve the customer experience:
 Nordstrom Reports Third Quarter Earnings SEATTLE--(BUSINESS WIRE)--Nov. 9, -- Nordstrom, Inc. (NYSE: JWN) today reported earnings per diluted share for the third quarter ended of $0.67. The estimated reduction
Contacts: Media - Jim Sluzewski 513/ Investor Matt Stautberg 513/
 FOR IMMEDIATE RELEASE Contacts: Media - Jim Sluzewski 513/579-7764 Investor Matt Stautberg 513/579-7780 REPORTS ITS SIXTH CONSECUTIVE YEAR OF DOUBLE-DIGIT GROWTH IN ADJUSTED EARNINGS PER SHARE Diluted
ULTA SALON, COSMETICS & FRAGRANCE, INC. (Exact Name of Registrant as Specified in its Charter)
") UNITED STATES SECURITIES AND EXCHANGE COMMISSION WASHINGTON, DC 20549 FORM 8-K CURRENT REPORT Pursuant to Section 13 or 15(d) of the Securities Exchange Act of 1934 Date of Report (Date of earliest event
UNITED STATES SECURITIES AND EXCHANGE COMMISSION WASHINGTON, DC 20549 FORM 8-K CURRENT REPORT Pursuant to Section 13 or 15(d) of the Securities Exchange Act of 1934 Date of Report (Date of earliest event
Capital Market Update. February 10, 2011 Marc Louargand, Ph.D., CRE, FRICS Principal SALTASH PARTNERS LLC investing in American ingenuity
 Capital Market Update February 10, 2011 Marc Louargand, Ph.D., CRE, FRICS Principal SALTASH PARTNERS LLC investing in American ingenuity A Brief Tour of the Capital Market What s happened in the past year?
Contacts: Media - Jim Sluzewski 513/ Investor Matt Stautberg 513/
 FOR IMMEDIATE RELEASE Contacts: Media - Jim Sluzewski 513/579-7764 Investor Matt Stautberg 513/579-7780 REPORTS FIRST QUARTER EARNINGS OF 56 CENTS PER DILUTED SHARE Company reiterates full-year 2015 guidance,
[This page intentionally left blank.]
![[This page intentionally left blank.]](/thumbs/83/88967179.jpg "[This page intentionally left blank.]") FINANCIALS 2006 2 [This page intentionally left blank.] UNITED STATES SECURITIES AND EXCHANGE COMMISSION Washington, D.C. 20549 FORM 10-K (Mark One) ANNUAL REPORT PURSUANT TO SECTION 13 OR 15(d) OF THE
FINANCIALS 2006 2 [This page intentionally left blank.] UNITED STATES SECURITIES AND EXCHANGE COMMISSION Washington, D.C. 20549 FORM 10-K (Mark One) ANNUAL REPORT PURSUANT TO SECTION 13 OR 15(d) OF THE
NORDSTROM, INC. (Exact name of Registrant as specified in its charter)
") UNITED STATES SECURITIES AND EXCHANGE COMMISSION Washington, D.C. 20549 FORM 10-K (Mark One) ANNUAL REPORT PURSUANT TO SECTION 13 OR 15(d) OF THE SECURITIES EXCHANGE ACT OF 1934 For the fiscal year ended
UNITED STATES SECURITIES AND EXCHANGE COMMISSION Washington, D.C. 20549 FORM 10-K (Mark One) ANNUAL REPORT PURSUANT TO SECTION 13 OR 15(d) OF THE SECURITIES EXCHANGE ACT OF 1934 For the fiscal year ended
Page 2 PERFORMANCE... 3
 TABLE OF CONTENTS PERFORMANCE... 3 NET ASSET VALUE... 4 FINANCIAL HIGHLIGHTS... 6 PORTFOLIO PROFILE... 7 BALANCE SHEETS... 8 STATEMENTS OF OPERATIONS... 9 FUNDS FROM OPERATIONS... 10 RESULTS OF OPERATIONS...
2017 Fourth Quarter and Full Year Results. Maracay Homes Pardee Homes Quadrant Homes Trendmaker Homes TRI Pointe Homes Winchester Homes
 217 Fourth Quarter and Full Year Results Maracay Homes Pardee Homes Quadrant Homes Trendmaker Homes TRI Pointe Homes Winchester Homes Forward Looking Statement Various statements contained in this presentation,
Relationships. Results. COMPANY OVERVIEW COMMERCIAL REAL ESTATE DEBT, EQUITY & SERVICING
 Relationships. COMPANY OVERVIEW Results. COMMERCIAL REAL ESTATE DEBT, EQUITY & SERVICING C O M M E R C I A L R E A L E S TAT E D E B T, E Q U I T Y & S E R V I C I N G Relationships. Results. For more
 Page of 3 Print Page Close Window Nordstrom Reports Total Sales Growth of 6.6% and Comparable Sales Increase of 0.9% Third Quarter 205 Earnings Included $0.5 EPS Reduction Related to its Credit Card Portfolio
2017 Third Quarter Results. Maracay Homes Pardee Homes Quadrant Homes Trendmaker Homes TRI Pointe Homes Winchester Homes
 2017 Third Quarter Results Maracay Homes Pardee Homes Quadrant Homes Trendmaker Homes TRI Pointe Homes Winchester Homes Forward Looking Statement Various statements contained in this presentation, including
MACY S, INC. REPORTS FIRST QUARTER EARNINGS Company maintains fiscal 2017 sales and earnings guidance
 Contacts: Macy s Media Blair Fasbender Rosenberg 212-333-3810 FOR IMMEDIATE RELEASE Macy s Investors Matt Stautberg 513-579-7780 REPORTS FIRST QUARTER EARNINGS Company maintains fiscal 2017 sales and earnings
Investor Presentation Second Quarter September 6, 2018
 Investor Presentation Second Quarter 2018 Disclaimer Forward-Looking Statements This presentation dated includes forward-looking statements within the meaning of the Private Securities Litigation Reform
equity advisory services
 CAPABILITIES equity advisory services YOUR SINGLE POINT OF CONTACT FOR THE ENTIRE CAPITAL STACK Better relationships. Better results. EQUITY VOLUME BY PROPERTY TYPE Our close relationships with debt providers
Investor Presentation January 2016
 Investor Presentation January 2016 Forward Looking Statements and Non-GAAP Information This presentation contains forward-looking statements within the meaning of federal securities laws, that are subject
2016 Second Quarter Results. Maracay Homes Pardee Homes Quadrant Homes Trendmaker Homes TRI Pointe Homes Winchester Homes
 2016 Second Quarter Results Maracay Homes Pardee Homes Quadrant Homes Trendmaker Homes TRI Pointe Homes Winchester Homes Forward Looking Statement Various statements contained in this presentation, including
US CAPITAL MARKETS REPORT
 US CAPITAL MARKETS REPORT Capitalization Rates By Property Type Fall 2016 US Capital Markets Report Capitalization Rates By Asset Type OVERVIEW Year-to-date investment sales volume lagged on a year-over-year
FOR IMMEDIATE RELEASE Contact: Ann Marie Gorden/Robert Nihen
 cutting through complexity News FOR IMMEDIATE RELEASE Contact: Ann Marie Gorden/Robert Nihen June 24, 2014 KPMG LLP 201-505-6288/201-307-8296 agorden@kpmg.com / rnihen@kpmg.com CINCINNATI, CLEVELAND, ATLANTA
2017 Portfolio Enhancements
 2017 Portfolio Enhancements October 2017 Hyatt Regency Scottsdale Resort & Spa at Gainey Ranch Scottsdale, AZ Royal Palms Resort & Spa Phoenix, AZ The Ritz-Carlton Pentagon City Arlington, VA Hyatt Regency
Carroll Co-Invest Fund II, LP Investor Update, Q4 2013
 Carroll Co-Invest Fund II, LP Investor Update, Q4 2013 January 31, 2014 We are pleased to report that Carroll Co-Invest Fund II experienced a successful 4th quarter 2013. Our work at ARIUM Resort, Carroll
2017 First Quarter Results. Maracay Homes Pardee Homes Quadrant Homes Trendmaker Homes TRI Pointe Homes Winchester Homes
 217 First Quarter Results Maracay Homes Pardee Homes Quadrant Homes Trendmaker Homes TRI Pointe Homes Winchester Homes Forward Looking Statement Various statements contained in this presentation, including
Investor Presentation May 2018
 Investor Presentation May 2018 1 Warning Concerning Forward Looking Statements THIS PRESENTATION CONTAINS STATEMENTS THAT CONSTITUTE FORWARD LOOKING STATEMENTS WITHIN THE MEANING OF THE PRIVATE SECURITIES
2015 Fourth Quarter and Full Year Results. Maracay Homes Pardee Homes Quadrant Homes Trendmaker Homes TRI Pointe Homes Winchester Homes
 215 Fourth Quarter and Full Year Results Maracay Homes Pardee Homes Quadrant Homes Trendmaker Homes TRI Pointe Homes Winchester Homes Forward Looking Statement Various statements contained in this presentation,
REDISHRED CAPITAL CORP. MANAGEMENT S DISCUSSION AND ANALYSIS MARCH 31, Table of Contents
 Table of Contents Forward Looking Statements... 2 Non-IFRS Financial Measures... 3 Business Overview... 4 Key Performance Indicators ( KPIs )... 4 Financial and Operational Highlights... 5 Company Strategy...
State Of The U.S. Industrial Market: 2017 Q2
 State Of The U.S. Industrial Market: 2017 Q2 Copyright 2017 CoStar Realty Information, Inc. No reproduction or distribution without permission. The following information includes projections and analyses
equity advisory services
 CAPABILITIES equity advisory services YOUR SINGLE POINT OF CONTACT FOR THE ENTIRE CAPITAL STACK Better relationships. Better results. EQUITY VOLUME BY PROPERTY TYPE Our close relationships with debt providers
ehealth Inventory Report of Major Medical Health Plans Available Off of Government Exchanges
 ehealth Inventory Report of Major Medical Health Available Off of Government Exchanges February 2014 Introduction Beginning January 1, 2014, all new major medical health insurance plans were required to
Struggling to Escape the Fallout of the Great Recession MARISA Di NATALE, MANAGING DIRECTOR
 Struggling to Escape the Fallout of the Great Recession MARISA Di NATALE, MANAGING DIRECTOR FROM MOODY S ECONOMY.COM Broad-Based Slowing Across the Nation Total employment excluding federal government,
Hudson's Bay Company Reports Second Quarter 2015 Financial Results
 September 10, 2015 Hudson's Bay Company Reports Second Quarter 2015 Financial Results Continues Trend of Strong Sales Growth Generates Net Earnings of $67 Million compared to a Net Loss of $36 Million
UBS Leveraged Finance Conference
 UBS Leveraged Finance Conference Las Vegas, NV - May 12, 2005 2 Comment to Investors This presentation includes forwardlooking statements as characterized in the Private Securities Litigation Reform Act
APARTMENT TRENDS. U.S. Economic and Multi-Family Outlook. Special Client Webcast May 31, 2006
 APARTMENT TRENDS U.S. Economic and Multi-Family Outlook Special Client Webcast May 31, 2006 U.S. Apartment Market Economic and Apartment Supply-Demand Overview and Outlook U.S. Economic Conditions Ideal
FORM 10-K. NORDSTROM INC - jwn. Filed: March 24, 2006 (period: January 28, 2006)
") FORM 10-K NORDSTROM INC - jwn Filed: March 24, 2006 (period: January 28, 2006) Annual report which provides a comprehensive overview of the company for the past year 10-K - FORM 10-K PART I Item 1. Business.
FORM 10-K NORDSTROM INC - jwn Filed: March 24, 2006 (period: January 28, 2006) Annual report which provides a comprehensive overview of the company for the past year 10-K - FORM 10-K PART I Item 1. Business.
2015 REAL ESTATE ECONOMIC FORECAST The National Economy and What It Means For Real Estate
 2015 REAL ESTATE ECONOMIC FORECAST The National Economy and What It Means For Real Estate February 5, 2015 Jeanette I. Rice Kentucky Chapter National economy in great shape for 2015 Creating excellent
NEIMAN MARCUS GROUP LTD LLC REPORTS SECOND QUARTER RESULTS. DALLAS, Texas, March 9, 2018 Neiman Marcus Group LTD LLC today reported
 FOR IMMEDIATE RELEASE CONTACT: Mark Anderson Director Finance and Investor Relations (214) 757-2934 NEIMAN MARCUS GROUP LTD LLC REPORTS SECOND QUARTER RESULTS DALLAS, Texas, Neiman Marcus Group LTD LLC
Investing in Communities
 Investing in Communities Q3 2018 Earnings Presentation November 8, 2018 Disclaimer General You are advised to read this disclaimer carefully before reading, accessing or making any other use of the information
Nordstrom Reports Second Quarter Earnings Per Share of 71 Cents
 Nordstrom Reports Second Quarter Earnings Per Share of 71 Cents SEATTLE, Aug 16, 2007 /PRNewswire-FirstCall via COMTEX News Network/ -- Nordstrom, Inc. (NYSE: JWN) today reported net earnings of $180.4
Supplemental Financial Information Q3 2018
 A P O L L O C O M M E R C I A L R E A L E S T A T E F I N A N C E, I N C. Supplemental Financial Information Q3 2018 October 24, 2018 Information is as of September 30, 2018, except as otherwise noted.
U.S. Investment Outlook
 U.S. Investment Outlook Quarterly Investor Research update Q2 2015 U.S. Investment overview 37% 21% 15% 15% U.S. cities dominating global investment activity Top 20 Cities for Transactional Volumes H1
2018 Jefferies Consumer Conference June 19, Trevor Lang EVP and Chief Financial Officer
 2018 Jefferies Consumer Conference June 19, 2018 Trevor Lang EVP and Chief Financial Officer Forward-Looking Statements This presentation and the associated webcast contain forward-looking statements,
Liberty Property Trust Supplemental Information March 31, 2014
 Supplemental Information Page Page Highlights.. 1 Lease Expirations.. 13 Statement of Operations 2 Completed Development Properties.. 14 Statement of Funds from Operations 3 Balance Sheet. 4 Key Financial
Sovran Self Storage, Inc. Company Presentation February 28, 2016
 Sovran Self Storage, Inc. Company Presentation February 28, 2016 Safe Harbor Statement This presentation may contain forward looking statements as defined in Section 27A of the Securities Act of 1933,
37.5% 37.4% 34.5% 35.5% 36.7% Inventory Turn (cost of sales and related buying and occupancy divided by average inventory)
") Nordstrom, Inc. Annual Report 2009 OUR SCORECARD Dollars in millions except per share and per square foot amounts Fiscal Year 2009 2008 % Change Net sales $8,258 $8,272 (0.2) Earnings before income taxes
Nordstrom, Inc. Annual Report 2009 OUR SCORECARD Dollars in millions except per share and per square foot amounts Fiscal Year 2009 2008 % Change Net sales $8,258 $8,272 (0.2) Earnings before income taxes