THE TRANSPORTATION COSTS OF NEW DEVELOPMENT
|
|
|
- Hillary Singleton
- 6 years ago
- Views:
Transcription

1 THE TRANSPORTATION COSTS OF NEW DEVELOPMENT A New NCHRP Model to Calculate Local Costs/Revenues of New Development Robert W. Burchell, Ph.D. Rutgers University Arthur C. Nelson, Ph.D. University of Utah Reid Ewing, Ph.D. University of Utah ROCKY MOUNTAIN LAND USE INSTITUTE University of Denver Sturm College of Law Denver, Colorado 2:30 3:45 p.m., Friday March 4, 2011
2 INTRODUCTION TO THE TRANSPORTATION COSTS OF NEW DEVELOPMENT Robert W. Burchell, Ph.D. Chair Urban Planning Program Director, Center for Urban Policy Research Rutgers University

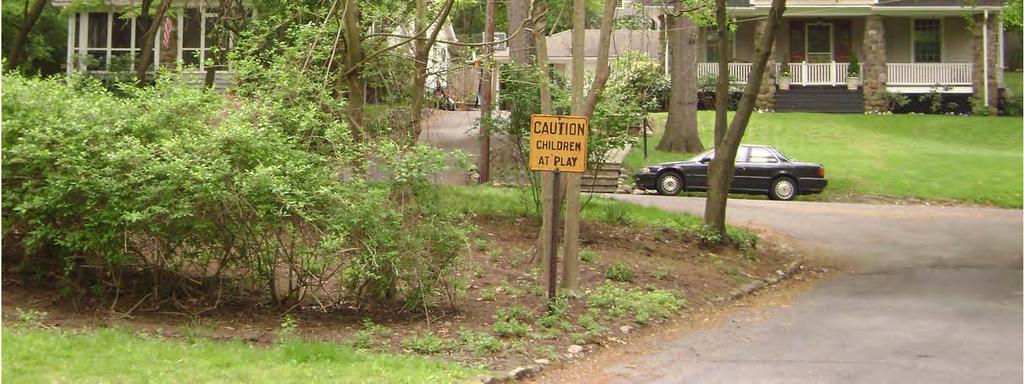
3 Suburban Collector Road
4 Transportation Costs/Revenues Related to New Development: Capital and Operating Public Services New development occurs locally and causes local capital and operating costs and revenues. These costs involve capital items such as: road construction/expansion; transportation vehicles for the poor, disabled, infirmed, and elderly; improved intersections; signalization; public parking lots; school bus stations; school parking facilities. They also involve operating items such as: road cleaning and repair; transportation services for the poor, disabled, infirmed, and elderly; school district student transportation. Impact fees, property taxes, and other revenues pay a portion of the capital and operating costs and are counted as revenues against the above costs. 4
5 Rounds of Transportation Costs/Revenues Direct, Indirect, and Induced Costs/Revenues Transportation cost impacts begin with those related to the initial development increment. New residents pay taxes. The foregoing are termed direct costs/revenues. The initial development may have employees who live within the community or residents who create new jobs due to the magnitude of their local spending. Employee households pay taxes. These are termed indirect costs/revenues. The initial and subsequent development may create the need for road improvements. A portion of this new capacity causes other people to locate within the community, consume services and pay taxes. These costs and associated revenues are termed induced costs/revenues. 5
6 Direct Costs/Revenues: Capital and Operating Calculation Procedures Direct capital costs/revenues are calculated using standard impact fee procedures to determine the magnitude of direct capital costs and revenues. Direct operating costs/revenues are calculated using standard fiscal impact procedures to determine the magnitude of direct operating costs and revenues. Direct capital costs/revenues are charged to the developer if local impact fee ordinances are in place. Direct operating costs/revenues are almost never charged to the developer but are paid for by development residents in the form of property taxes. 6
7 Indirect Costs/Revenues: Capital and Operating Calculation Procedures Indirect capital costs/revenues are calculated using impact fee procedures applied to the increment of housing units and nonresidential space comprising indirect development. (Employee housing and additional commercial space) Indirect operating costs/revenues are calculated using fiscal impact procedures and data applied to the increment of housing units and nonresidential space comprising indirect development. (Employee housing and additional commercial space) Indirect costs/revenues are never charged to the initial round of development that caused them. On the capital side, they may be charged as direct costs of subsequent development. Indirect operating costs, while almost never charged to the developer, are paid for by residents in the form of property taxes/other revenues. 7
8 Induced Costs/Revenues: Capital and Operating Calculation Procedures Induced capital costs/revenues are calculated using elasticities of demand to develop an increment of new population living within the community related solely to the excess capacity of the road improvements. In most cases, they are afforded the same level of service as currently held by existing residents. Induced operating costs/revenues are calculated using the same elasticities of demand. This produces a new population that consumes local operating services at the same level and costs of the old population. Induced capital and operating costs/revenues are never charged directly to the developer. They often are not even charged as subsequent rounds of development. They are paid for in the property taxes/other revenues of new local housing and commercial space. 8
9 OPERATING COSTS IN THE NCHRP MODEL Robert W. Burchell, Ph.D. Director, Center for Urban Policy Research Chair Urban Planning Program Rutgers University


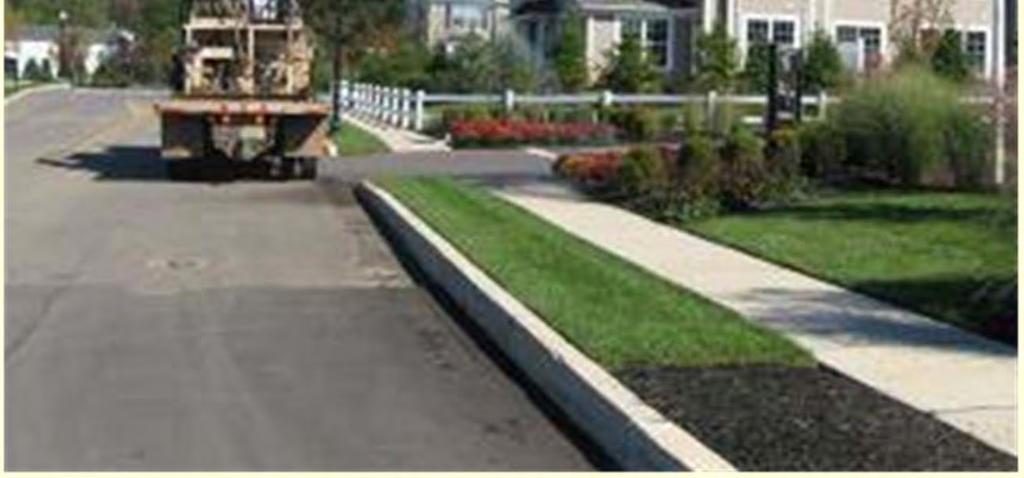
10 Drainage Repair along Road ROW
11 Operating Costs/Revenues 1. This is the standard fiscal impact approach using methods from Burchell and Listokin (Rutgers University). TischlerBise, Mary Edwards (St. Cloud University). 2. Basic Formula Revenues Costs = Net Fiscal Impact 3. Costs/revenues come from local municipal/county and school district budgets. 4. Costs related to transportation services are separated from other costs, both operating and debt service. 11
12 The Development Proforma 1. This is a profile of the new development increment to the municipality/county and school district. 2. On the proforma is contained information on: a) Number of housing units by type and bedrooms b) Amount of nonresidential space by type and square feet c) Price per dwelling unit for residential or per square foot for nonresidential d) Assessment or equalization ratio so that local property tax rate can be applied 12
13 Calculating Costs 1. Disaggregation of municipal/county and school district budget into departmental categories (gen. govt., public safety, public works, econ. develop., health, and debt service). 2. Extracting transportation share in the above areas (usually from public works, econ. develop., debt service). 3. Estimating share of municipal/county budget to support employees versus residents. School budget for students. 4. Develop overall cost per employee and resident and transportation cost per employee and resident. 13
14 Calculating Per Capita Costs Exhibit I B.5 Estimating Municipality/County/School District Per Person, Per Employee, and Per Student Costs Expenditure(Municipal/County) Per Capita (Transportation) Per Worker (Transportation) General Administration $99.34 $41.25 Public Safety $ $ Public Works $ $53.10 Transportation ($51.15) ($21.24) Economic Development $48.77 $20.25 Transportation ($12.19) ($5.06) Health/Human Services $16.26 $6.75 Recreation/Culture $66.83 $27.75 Debt Service $72.25 $30.00 TOTAL Transportation ($36.12) ($15.00) Overall Transportation $ ($99.47) $ ($41.30) Expenditure(School) Per Student Total Per Student (Transportation) Teaching $9,300 $0.00 Administration $1,500 $0.00 Transportation $3,000 $3,000 Debt Service $1,200 $360 TOTAL $15,000 $3,360 14
15 Calculating Total Costs/Transportation Share Exhibit I B.6 Calculating Total Municipal/County and School District Operating Costs Municipal/County Residential Operating Costs Amount (Total Costs) Transportation Costs a. Per person costs $684 $99.47 b. Population of development 4,956 4,956 Total (a X b) $3,390,848 $492,962 Municipal/County Nonresidential Operating Costs c. Per employee costs d. Employees in development Total (c X d) TOTAL MUNICIPAL/COUNTY School District Operating Costs $284 $ ,625 2,625 $745,763 $108,419 $4,136,610 $601,381 Amount (Total Costs) Transportation Costs e. Per student cost $15,000 $3,360 f. Students in development Total (e X f) $10,500,000 $2,352,000 TOTAL SCHOOL DISTRICT $10,500,000 $2,352,000 TOTAL: MUNICIPAL/COUNTY AND SCHOOL DISTRICT OPERATING COSTS $14,636,610 $2,953,381 15
16 Calculating Revenues Gross Revenues 1. Property Tax = New Valuation X Eq. Ratio X Tax Rate 2. Gross Receipts = GRT/Employee X New Employees 3. Fees, Fines, Forfeits = FFF/per Capita X New People 4. Interest, Rents, Royalties = IRR/per person X New Persons + IRR/per Employee X New Employees 5. Licenses/Permits = L&P/per Person X New Persons + L&P per Employee X New Employees 6. Transportation Share of Revenues = Share of Costs 16
17 Calculating Total Revenues Exhibit I B.11 Calculating Municipal/County and School District Future Operating Revenue A. B. C. D. icipal/county Revenues Per Person Transportation Share Per Employee Transportation Share l other revenues $ $84.11 $ $ operty tax revenues $ $19.37 $ $11.43 Total $ $ $ $39.04 people/employees in development 4,956 4,956 2,625 2,625 unicipal/county revenues $3,137,411 $512,871 $867,750 $102,469 Total Municipal/County (A + C) $4,005,161 Transportation (B + D) $615,340 ol District Revenues Per Student Transportation Share l other revenues $3,723 $367 operty tax revenues $7,200 $1,440 Total $10,923 $1,807 students in development hool district revenues $7,646,383 $1,264,915 Total School District $7,646,383 Transportation $1,264,915 17
18 Net Fiscal Impact 1. Net Fiscal Impact equals revenues minus costs. 2. All revenue minus all costs and transportation share revenues minus transportation share costs. 3. For residential development (including school costs), result frequently comes out negative; for nonresidential development (no school costs) result frequently comes out positive. 18
19 Net Fiscal Impact Exhibit I B.12 Transportation Operating Costs/Revenues of Development Net Fiscal Impact Project-Specific (Total) Transportation Share I. Revenues Municipal/County $4,005,161 $615,340 School District 7,646,383 1,264,915 Total $11,651,544 $1,880,255 II. Costs Municipal/County $4,136,610 $601,381 School District 10,500,000 2,352,000 Total $14,636,610 $2,953,381 III. Net Fiscal Impact Municipal/County -$131,449 $13,959 School District -$2,853,617 -$1,087,085 Total -$2,985,066 -$1,073,126 19
20 CAPITAL COSTS IN THE NCHRP MODEL Arthur (Chris) Nelson, Ph.D. Chair Urban Planning Program Director, Metropolitan Studies Center University of Utah
21 Capital Costs/Revenues 1. This is the standard impact fee approach using a composite of methods from Nelson and Nicholas (Utah, Florida), Duncan Associates (Texas), and Tindale-Oliver (Florida). 2. Basic formula for residential or nonresidential unit based fees: Vehicle Miles Traveled by New Population/Employment X Net Cost Per Vehicle Mile Traveled (levels of service, improvement costs, revenue credits) Number of Units/1,000 ft 2 in Proposed Development 3. Costs are proportionally/rationally assigned (Rational Nexus). 4. Rational Nexus only those costs actually attributable to the new development increment are assigned. 21
22 Levels of Service 1. Standards exist to determine the level of service that the improvement is attempting to replicate. 2. Levels of service can be determined locally or may be influenced by state standards. 3. Many jurisdictions use ITE/TRB Service Levels A B C D E F (A is for free flowing; F is stopped for periods of time). 4. Often LOS is a local determination of how heavy road use will be in the future. This takes into account all other forms of transportation. 22
23 Transportation Service Areas 1. No hard-and-fast rules on how to construct service areas. 2. Depends on local assessment of travel demand. 3. Albuquerque N.M. has seven service areas: same land area, City of Atlanta has only one service area. 4. Service areas depend largely on local prior practices of transportation services (road as well as transit, bike, pedestrian). 23

24 Albuquerque Service Areas Figure 1. Albuquerque transportation facility service areas. 24
25 Estimates of Transportation Demand 1. Begin with assessment of current conditions. 2. VMT (links) VMC (links) = VMT/VMC Ratio VMT to VMC Ratio equals 0.5 to Determine unit of demand: VMT (trip miles) at peak, assigned to each new unit/1,000 ft 2 of land use. 4. Trip miles is the current impact fee standard of demand. 5. Transit and other modes are also calculated. 25
26 Road Costs (Units/Unit Size) 1. Costs are costs per trip mile X distance per trip (adjusting for pass-by and diverted trips). 2. Costs involve scaling for unit size larger units: equals more people per unit equals more trips per unit. 3. Resultant impact fees are then scaled by size of unit. 4. If costs are scaled per unit so too must be the credits assigned. 26

27 Road Capital Improvement
28 Road Cost Credits 1. Credits adjustments made to reflect the net capital cost of new development. 2. Gross costs are reduced by federal, state, local, and other funds contributing to road building (transportation) costs. 3. New development must pay for only its net capital facility impacts. 4. The above addresses double counting issues. 28
29 Capital Cost Calculation 1. VMT Per Capita X New Pop/D.U. = VMT/DU 2. Capital Improvements Existing Deficits = Costs of Growth 3. Net Cost of Growth = Net Cost / VMT VMT 4. VMT/D.U. X Net Cost/VMT = Impact Fee/D.U. 29
30 Calculating Net Cost Per VMT Exhibit I A.8 Average Construction Cost Per Lane Mile based on the Tucson Study New Lane- Miles Cost per Lane-Mile 2004 Arterial Segment Miles Lanes Cost Golf Links Pantano-Harrison Golf Links Harrison-Bonanza Golf Links Pantano-Bonanza $8,860,278 $1,107,535 Harrison Golf Links-OST $5,841,510 $1,168,302 12th Avenue* Drexel Rd to Valencia Rd $4,810,679 $1,202,670 Pima St* Swan Rd to Craycroft Rd $7,903,501 $1,975,875 Ft Lowell Laurel-Swan $1,918,478 $1,918,478 Pantano Golf Links-Escalante $5,290,657 $1,322,664 Total $34,625,103 $1,331,735 Exhibit I A.12 Average Cost Per Service Unit based on the Tucson Study 2004 Average Cost per New Lane-Mile $1,331,735 Average Hourly Capacity Added per New Lane 780 Average Cost per Peak Hour VMC $1,707 Systemwide VMC/VMT Ratio 1.16 Cost per Peak Hour VMT $1,980 Exhibit I A.13 Net Road Cost Per Vehicle Mile Traveled Based on the Tucson Study 2004 Road Cost Cost per Peak Hour VMT $1,980 Debt Credit per Peak Hour VMT $164 CIP/County Funding Credit per Peak Hour VMT $349 Net Cost per Peak Hour VMT $1,467 30
31 Calculating Impact Fees Per Unit Exhibit I A.14 Schedule of Road Capital Cost Charges (at 100% assessment) Based on the Tucson Study Land Use Type Unit Peak Hour VMT Net Cost/VMT (2004 Cost) Net Cost/ Unit (2004 Cost) Progressive Residential Fees by Unit Size: Less than 500 sq. ft sq. ft sq. ft. 1,000-1,249 sq. ft. 1,250-1,499 sq. ft. 1,500-1,999 sq. ft. 2,000-2,999 sq. ft. 3,000-3,999 sq. ft. 4,000 sq. ft. or more Single-Family Detached Multi-Family Mobile Home Park Hotel/Motel NONRESIDENTIAL General Retail Commercial Office Institutional Hospital Nursing Home Church Elementary/Sec. School Industrial/Warehousing Dwelling Dwelling Dwelling Dwelling Dwelling Dwelling Dwelling Dwelling Dwelling Dwelling Dwelling Pad 1,000 sq. ft 1,000 sq. ft. 1,000 sq. ft. 1,000 sq. ft. 1,000 sq. ft. 1,000 sq. ft. 1,000 sq. ft. 1,000 sq. ft $1,467 $1,467 $1,467 $1,467 $1,467 $1,467 $1,467 $1,467 $1,467 $1,467 $1,467 $1,467 $1,467 $1,467 $1,467 $1,467 $1,467 $1,467 $1,467 $1,467 $2,186 $2,743 $3,198 $3,462 $3,829 $4,196 $4,386 $4,562 $4,738 $4,020 $2,831 $2,553 $1,203 $3,976 $4,724 $3,271 $1,159 $1,379 $660 $2,039 31
32 Calculating Direct Capital Costs Related to New Development Exhibit I A.15 Applying the Tucson Study Methodology for Direct Capital Costs to the Development Being Analyzed Number of Residential Units/ 000s of Square Feet of Nonresidential Space Cost per Residential/Nonresidential Unit Total Direct Capital Costs ) (Transportation) Dwelling units $2,070 $2,484,586 1,200 2 bedroom Town 1,400 sq.ft bedroom Town 2,000 sq.ft. $2,562 $2,049,989 Office space 750,000 square feet $3,198 $2,398,487 Total $6,933,062 32
33 Revenues 1. In capital cost or impact fee calculations, revenues equal costs. 2. The fees or revenues are specifically set to equal costs. 3. The fee or revenues only apply in jurisdictions that raise impact fees. 4. This (Direct Capital) is the only potential charge to a developer. Operations costs and Indirect/Induced costs are not formally charged. 33
34 Conclusions 1. Capital Costs in the NCHRP Model follow impact fee procedures. 2. These procedures reflect court opinions and continuous general practice upgrades. 3. These have been built into the NCHRP Model. 4. These procedures will be available to all planning practitioners upon publishing of the Model. 34
35 INDUCED TRANSPORTATION CAPITAL AND OPERATING COSTS IN THE NCHRP MODEL Reid Ewing, Ph.D. Director, Doctoral Program and Director, Center for Metropolitan Studies University of Utah
36 Induced Travel and Transportation Costs 1. Induced Costs additional highway capacity creates additional traffic and promotes additional urban development in proximity to the added highway capacity. 2. Highway capacity is expanded to relieve congestion. Road supply increases travel times decrease 3. Lower travel times lead to an increase in traffic. 4. The amount of traffic on an expanded highway is greater than existed without the expansion, i.e. induced traffic. 36
37 Short and Long Term Effects of Highway Expansion Exhibit III 1 Short-Term Effect of Highway Expansion Exhibit III 2 Long-Term Effect of Highway Expansion 37
38 The Components of Induced Traffic 1. Increases in highway capacity in the short run involves route switches, mode switches, and changes in destination. 2. Also possibility of new trips that would not have occurred without road expansion. 3. Increases in highway capacity in the long run improves accessibility lowers travel time residences and businesses are drawn to the location. 38


39 Urban Regional Road
40 Induced Traffic Issues Related to Definition 1. Type of Travel person or vehicle travel 2. Unit of Measure new trips or new trips + lengthening 3. Time Frame any increase in travel or peak hour increases 4. Geographic Frame corridor or regionwide 5. Period short term (<1 year) or long term (<5 years) 40
41 Resulting Definition of Induced Traffic 1. Induced Traffic any increase in daily VMT in the long term at the regionwide level resulting from expansion of highway capacity. 2. Induced Traffic a) vehicle not person trips b) daily travel, not peak or off peak c) Regionwide, not limited to a corridor d) long term, not short term 41
42 Induced Transportation Capital and Operating Costs 1. Impacts of induced demand can be calculated using the elasticities of direct VMT. 2. VMT varies with: a) density (development) b) diversity (development) c) design (street) d) destination (accessibility) e) distance (to transit) f) development (scale) g) demographics 3. Direct development costs yield a direct VMT figure and additional land mile capacity (LOS constant). 42
43 Elasticity Ratio and Induced Costs 1. Elasticity ratios are used to calculate the increment of induced costs over direct and indirect costs. 2. An elasticity ratio is the ratio of percent change in one variable to percent change in another. 3. Induced transportation involves both redistributed and steady state traffic. At first, redistributed traffic; at steady state, new residents brought to area. 43

44 Growth of Traffic Over Time
45 Cervero s Bottom Lines the preponderance of research suggests that induced-demand effects are significant, with an appreciable share of added capacity being absorbed by increases in traffic. All that can be said with certainty is that induceddemand effects exist and they accumulate over time.
46 Average Elasticities Facility-Specific Studies Areawide Studies Short-Term Medium-Term 0.27 NA Long-Term
47 Dual Causality over the past several decades in California, road supply has been both a cause and an effect in relation to VMT. elasticity VMT wrt lane miles = 0.56 (with respect to) elasticity lane miles wrt VMT = 0.33 (with respect to)
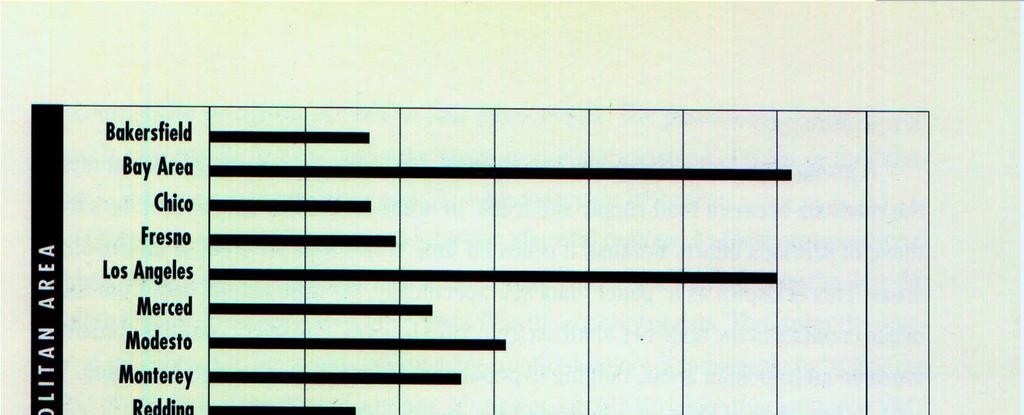
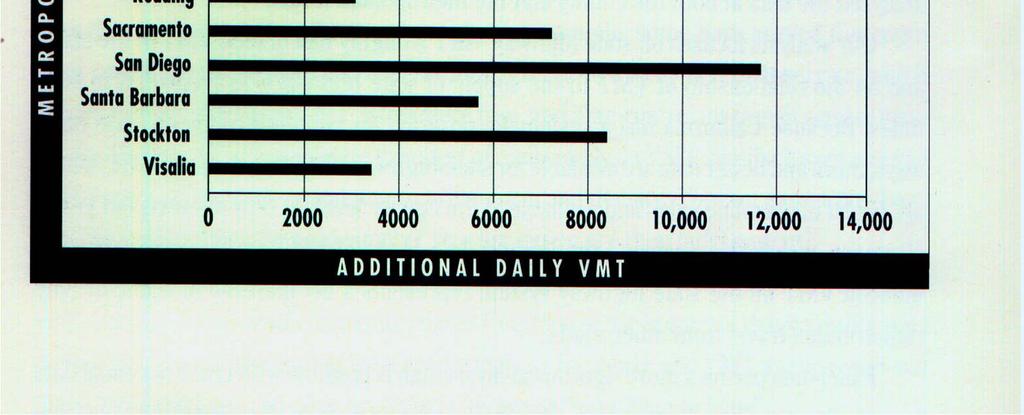
48 Additional VMT per Lane Mile
49 Forecasting Induced Traffic % growth of traffic = elasticity * % growth of capacity or % growth of traffic = elasticity * % reduction in travel time
50 Calculation of Induced Costs 1. The direct and indirect effects add 26 percent extra population and employment to the jurisdiction. 2. Road capacity assumed to increase by same increment. 3. An average elasticity of 0.5 is applied to new capacity to estimate induced VMT. 4. The elasticity is multiplied by 0.5 to include the expected share of new households likely to live within the jurisdiction. 5. The induced effect is one-quarter of the combined direct 50 and indirect effects (26%) or about 6%.
51 Calculations of Induced Costs Exhibit III-3 Calculating Induced Development Residents, Units, Jobs, Square Feet of Nonresidential Space Initial Activity (Residents and Jobs in Existence before Development) Added Activities from Development Generated Direct and Indirect Growth Direct and Indirect Activities as Percent of Initial Activities Assume Same Percent Growth of Capacity Multiply Above by Elasticity of VMT with Respect to Capacity Multiply above by Percent of Induced Development inside Jurisdiction Induced Population (Base Residents Times above Value Induced Jobs (Base Jobs Times above Value) Induced Students (Base Jobs Times above Value) Induced Housing Units (Induced Population Divided by Household Size) Induced Square Feet of Nonresidential Space (Induced Jobs / Average Jobs per 1,000 sq. ft). X 1,000 23,530 Residents + 10,000 Jobs = 33,530 7,581 Added Residents + 1,175 Added Jobs =8,756 8,756 / 33,530 = X 0.5 = X 0.5 = ,530 X = 1,536 10,000 X = 653 9,400 X = 614 1,536 / = 613 (653 / ) X 1,000= 305,446 51
52 IMPLICATIONS FOR FIELD PRACTICE AND CONCLUSIONS Robert W. Burchell, Ph.D. Chair Urban Planning Program Director, Center for Urban Policy Research Rutgers University
53 Products Emanating from the NCHRP Study: Implications for Field Practice The NCHRP study has produced three component devices to assist in analyzing costs and revenues. The first is a Procedural Guide explaining the cost and revenue calculation procedures in detail and showing their historical origins. The second is a User Guide defining terms, showing the origins and form of data, and explaining the model in parallel with the software sequence. The third is Model Software that provides an automated solution of the cost/revenue assessment either quickly (using provided data) or over a longer time period (using self-gathered data). 53

54 Procedural Guide for NCHRP Model 54
55 Input to NCHRP Model STEP 2 - DEVELOPMENT DESCRIPTION - ENTER INFORMATION ON DEVELOPMENT BEING ANALYZED DEVELOPMENT DESCRIPTION AND PREVIEW METHOD Fill in cells only for included housing/nonresidential types 1. Name of Development = Sample Development 2. Name of Owner = Total Project Land Area in Acres = Acres Distance of Project to nearest rail-based transit system (default is 10 miles) = Miles Walkability (short description) = (Measure) Bicycle access (short description) = (Measure) 3. Development Composition A. Number of Residential Units by type and size Square Feet Sales Price Unit Type and Size Units Per Unit per Unit Single-family det. 2 bedroom = 3 bedroom = 4 bedroom = 5 bedroom = Garden Apt. 1 bedroom = 2 bedroom = 3 bedroom = Town House 2 bedroom = 1,200 1,400 $200,000 3 bedroom = 800 2,000 $300,000 4 bedroom = High-rise Studio* = 1 bedroom* = 2 bedroom* = Mobile Home 1 bedroom* = 2 bedroom = 3 bedroom = Other Type 1* = Type 2* = Type 3* = Age-Restricted 1 bedroom* = 2 bedroom* = Total Residential Units = 2,000 * Default person and student multipliers not available in the program for these unit types. Multipliers must be provided if these types are used. 55
56 Output from NCHRP Model STEP 7 - VIEW OUTPUT FOR DIRECT, INDIRECT, AND INDUCED COSTS/REVENUES TRANSPORTATION COSTS OF NEW DEVELOPMENT MODEL Page 1 Sample Development November 20, :35 PM OUTPUT 1 - DIRECT CAPITAL COSTS/REVENUES Residential/Nonresidential Unit Generation Residential Units 2,000 Nonresidential Space (000 sq. ft.) 750 Average Cost/Revenue per Residential Unit 2, Average Cost/Rev. per 1,000 sq.ft. Nonresidential Space 3, Transportation Capital Costs related to Residential Nonresidential Total Direct Development $4,534,575 $2,398,487 $6,933,062 Transportation Capital Revenues related to Direct Development $4,534,575 $2,398,487 $6,933,062 OUTPUT 2 - DIRECT OPERATING COSTS/REVENUES Population Added 4,956 Students Added Grades K Employees Added 2,625 Residential Market Valuation $480,000,000 Nonresidential Market Valuation $150,000,000 Total Market Valuation $630,000,000 Total Transportation Share Per Person Costs $ $99.47 Per Employee Costs $ $41.30 Per Student Costs $15, $3, Municipal/County Costs (person & Employee) $4,136,610 $601,381 School Costs $10,500,000 $2,352,000 Total $14,636,610 $2,953,381 Municipal/County Property Tax Revenues (res & nonres) $2,520,000 $125,997 School Property Tax Revenues $5,040,000 $1,008,000 Municipal/ County School Municipal/County Transportation School Transp. Nonproperty Tax Revenue (Total)(no intergov) $1,026,508 $148,936 $215,545 $11,170 Intergovernmental Revenue (Total) $458,653 $2,457,447 $273,798 $245,745 Municipal/ County Total School Total Municipal/County Transportation School Transportation Personal Property Tax (Residential Property) $0 $0 $0 $0 Personal Property Tax (Business) $0 $0 $0 $0 Personal Property Tax (Total) $0 $0 $0 $0 Municipal/ County/ School Transportation Share Total Income Generated by Growth (Municipal/County) $4,005,161 $615,340 Total Income Generated by Growth (School) $7,646,383 $1,264,915 Per Person Revenues (All Sources) $ $ Per Employee Revenues (All Sources) $ $39.04 Per Student Revenues (All Sources) $10, $1, Municipal/County Surplus/Deficit -$131,449 $13,959 School Surplus/Deficit -$2,853,617 -$1,087,085 Total Surplus/Deficit -$2,985,066 -$1,073,126 Municipal/County Surplus/Deficit as Share of Budget -0.69% School Surplus/Deficit as Share of Budget -2.02% 56
57 What the NCHRP Research Does: Develops User Products: To provide a guide to cost/revenue calculations that heretofore did not exist. To provide a detailed definition of steps to gather data and enact calculations in the transportation impact cost/revenue studies. To provide both a relatively quick general procedure and a slower, more detailed procedure of transportation impact cost/revenue calculations. To display the overall impacts of new development on transportation in their various stages and relative magnitudes. 57
58 What the NCHRP Research Does Not Do The NCHRP Research: Is not an impact fee calculator of the capital costs/revenues of new development it approximates these types of costs/revenues. Is not a fiscal impact model of the operating costs/revenues of new development it approximates these types of costs/revenues. Is not a prescription for whether or what these developments should pay locally in exactions or impact fees. 58
59 Conclusions/Implications for Policy Transportation costs/revenues of new development, both operating and capital, are capable of being counted. These costs/revenues are also capable of being counted by stage of occurrence: direct, indirect, and induced. The above is done by using the best procedures in the field (and variations of them) developed by those who initiated these original field procedures. Given the above, it is now possible to estimate the magnitude of forthcoming transportation costs/revenues related to new development. 59
System Development Charge Methodology
 City of Springfield System Development Charge Methodology Stormwater Local Wastewater Transportation Prepared By City of Springfield Public Works Department 225 Fifth Street Springfield, OR 97477 November
IMPACT FEE CREDIT APPLICATION & GUIDELINES
 IMPACT FEE CREDIT APPLICATION & GUIDELINES Land Development Division City of Kansas City, Missouri Updated on January 2009 TABLE OF CONTENTS I. Introduction II. III. IV. Defined terms Formulas Items Not
Loudoun 2040 Fiscal Impact Analysis Report Loudoun County, Virginia
 Loudoun 2040 Fiscal Impact Analysis Report Loudoun County, Virginia Submitted to: Loudoun County, Virginia July 6, 2018 4701 Sangamore Road Suite S240 Bethesda, Maryland 20816 800.424.4318 www.tischlerbise.com
Presented By: L. Carson Bise II, AICP President
 Impact Fee Basics: Methodology and Fee Design Presented By: L. Carson Bise II, AICP President Basic Options for One-Time Infrastructure Charges Funding from broad-based revenues (general taxes) Growth
Subdivision Staging Policy (SSP) By Dan Wilhelm, As of 11/15/2016
 By Dan Wilhelm, As of 11/15/2016") Subdivision Staging Policy (SSP) By Dan Wilhelm, As of 11/15/2016 The SSP is intended to be the primary tool the County uses to pace new development with the provision of adequate public facilities. The
Subdivision Staging Policy (SSP) By Dan Wilhelm, As of 11/15/2016 The SSP is intended to be the primary tool the County uses to pace new development with the provision of adequate public facilities. The
COUNTY COUNCIL FOR MONTGOMERY COUNTY, MARYLAND
 Bill No. 31-03 Concerning: Transportation Impact Tax - Amendments Revised: 10-27-03 Draft No. 4 Introduced: September 9, 2003 Enacted: October 28, 2003 Executive: Effective: March 1, 2004 Sunset Date:
Chapter 5: Cost and Revenues Assumptions
 Chapter 5: Cost and Revenues Assumptions Chapter 5: Cost and Revenues Assumptions INTRODUCTION This chapter documents the assumptions that were used to develop unit costs and revenue estimates for the
Fiscal Impact Analysis
 May 12, 2017 Fiscal Impact Analysis Westport Cupertino Development Prepared for: KT Urban, LLC Prepared by: Applied Development Economics, Inc. 1756 Lacassie Avenue, #100, Walnut Creek, CA 94596 925.934.8712
Town of Prescott Valley 2014 Development Impact Fee Report. Raftelis Financial Consultants, Inc.
 Town of Prescott Valley 2014 Development Impact Fee Report Raftelis Financial Consultants, Inc. February 13, 2014 Table of Contents Purpose of this Report... 1 Existing Development Impact Fees... 1 Summary
Fiscal Analysis November 14, Fiscal Analysis Fiscal Conditions Project Background
 3.11 Fiscal Analysis Fiscal Analysis 3.11.1 Fiscal Conditions 3.11.1.1 Project Background The proposed action is a 149 unit residential development, including a private road and appurtenances, on a 29.3
Chapter 6: Financial Resources
 Chapter 6: Financial Resources Introduction This chapter presents the project cost estimates, revenue assumptions and projected revenues for the Lake~Sumter MPO. The analysis reflects a multi-modal transportation
Pasco County, Florida. Multi-Modal Mobility Fee 2018 Update Study
 Pasco County, Florida Multi-Modal Mobility 2018 Update Study PCPT December 3, 2018 PASCO COUNTY 2018 MULTI MODAL MOBILITY FEE UPDATE STUDY Prepared for: Pasco County, Florida Prepared by: W.E. Oliver,
Market and Fiscal Impact Analysis of the Phase 2 Metrorail Extension to Loudoun County. Loudoun County April 19, 2011
 Market and Fiscal Impact Analysis of the Phase 2 Metrorail Extension to April 19, 2011 BACKGROUND AND OBJECTIVES RCLCO (Robert Charles Lesser & Co.) is a national real estate advisory firm based in Bethesda
GRASS VALLEY TRANSPORTATION IMPACT FEE PROGRAM NEXUS STUDY
 HEARING REPORT GRASS VALLEY TRANSPORTATION IMPACT FEE PROGRAM NEXUS STUDY Prepared for: City of Grass Valley Prepared by: Economic & Planning Systems, Inc. March 2008 EPS #17525 S A C R A M E N T O 2150
LEVEL OF SERVICE / COST & REVENUE ASSUMPTIONS
 LEVEL OF SERVICE / COST & REVENUE ASSUMPTIONS APPENDIX TO THE FISCAL IMPACT ANALYSIS OF PHASE I OF CAROLINA NORTH University of North Carolina-Chapel Hill Town of Chapel Hill, North Carolina Town of Carrboro,
Draft-Fiscal Impact Analysis of Union Square and Boynton Yards
 Draft-Fiscal Impact Analysis of Union Square and Boynton Yards Prepared for: City of Somerville, Massachusetts November 16, 2015 Prepared by: 4701 Sangamore Road Suite S240 Bethesda, Maryland 20816 800.424.4318
The Economic Capture of the Downtown Phoenix Redevelopment Area. Prepared for:
 The Economic Capture of the Downtown Phoenix Redevelopment Area Prepared for: June 2018 Table of Contents Section 1: Executive Summary... 2 Section 2: Introduction and Purpose... 4 2.1 Analytical Qualifiers...4
TRANSIT ORIENTED DEVELOPMENT IN THE PORTLAND METRO REGION
 TRANSIT ORIENTED DEVELOPMENT IN THE PORTLAND METRO REGION Presented by: Megan Gibb What is Metro Directly elected regional government Serves more than 1.4 million residents in Clackamas, Multnomah and
APPENDIX - TRANSPORTATION IMPACT TAX. Basis and General Purpose for the Tax
 APPENDIX - TRANSPORTATION IMPACT TAX Basis and General Purpose for the Tax The authority to impose a Transportation Impact Tax on new development is in Chapter 52 (Article VII Development Impact Tax for
VOLUSIA COUNTY COUNCIL IMPACT FEE DISCUSSION
 VOLUSIA COUNTY COUNCIL IMPACT FEE DISCUSSION J U N E 5, 2 0 1 8 05-2 CRITICAL POINTS May 1, 2018, the County Council directed staff to bring forward a discussion on the county thoroughfare road impact
Economic Impact of Public Transportation Investment 2014 UPDATE
 Economic Impact of Public Transportation Investment 2014 UPDATE May 2014 Acknowledgements This study was conducted for the American Public Transportation Association (APTA) by Economic Development Research
Traffic Impact Analysis Guidelines Methodology
 York County Government Traffic Impact Analysis Guidelines Methodology Implementation Guide for Section 154.037 Traffic Impact Analysis of the York County Code of Ordinances 11/1/2017 TABLE OF CONTENTS
Balancing Patterns of Development:
 Balancing Patterns of Development: The Importance of Fiscal Impact Analysis in Comprehensive Planning Prepared By: Outline Defining fiscal impact analysis Why/When/How to use fiscal impact analysis? General
Fiscal Impact Model. City of Falls Church Presentation to Economic Development Authority November 2, 2015
 Fiscal Impact Model City of Falls Church Presentation to Economic Development Authority November 2, 2015 TischlerBise Experience Fiscal, economic, and planning consultants National Practice Fiscal Impact
Project Prattville : : The Next Chapter
 Welcome Introductions How Well Do You Know Prattville? Comp Planning 101 Schedule & Products Prattville in 2008 Questions & Answers The Planning Stations Next Steps Project Team Urban Collage Urban Design
City of Antioch Development Impact Fee Study
 Report City of Antioch Development Impact Fee Study Prepared for: City of Antioch Prepared by: Economic & Planning Systems, Inc. February 2014 EPS #20001 Table of Contents 1. INTRODUCTION AND RESULTS...
City of Redding, California Development Impact Mitigation Fee Nexus Study
 , California Development Impact Mitigation Fee Nexus Study December 5, 2017 Prepared by helping communities fund to morrow This page intentionally left blank. TABLE OF CONTENTS Executive Summary...1 Background
ECONOMIC ISSUES AND OPPORTUNITIES PAPER
 ECONOMIC ISSUES AND OPPORTUNITIES PAPER Introduction The purpose of this paper is to identify important economic issues that need to be addressed in order to create policy options for the City of Simi
Supplementary Development Contributions Scheme - Cobh/Midleton - Blarney Suburban Rail Project
 Adopted by Council on 23 rd February, 2004. Supplementary Development Contributions Scheme - Cobh/Midleton - Blarney Suburban Rail Project Under Section 49 of the Planning & Development Act, 2000 Section
Active Transportation Health and Economic Impact Study
 Active Transportation Health and Economic Impact Study November 7, 2016 Please recycle this material. SCAG 2789.2017.02.22 Contract No. 15-019-C1 Active Transportation Health and Economic Impact Study
THE ECONOMIC IMPACT OF FEARRINGTON PLACE
 THE ECONOMIC IMPACT OF FEARRINGTON PLACE PREPARED FOR JESSE FEARRINGTON PREPARED BY COLUMBIA, SOUTH CAROLINA RESEARCH TRIANGLE PARK, NORTH CAROLINA APRIL 17, 2006 1 INTRODUCTION This report evaluates the
Mobility Plans and Fees: The Future of Transportation Funding
 Mobility Plans and Fees: The Future of Transportation Funding Mobility Plans and Fees: The Future of Transportation Funding Growth & Infrastructure Consortium November 4, 2010 Tampa, Florida Bob Wallace,
Measure I Strategic Plan, April 1, 2009 Glossary Administrative Committee Advance Expenditure Agreement (AEA) Advance Expenditure Process
 Advance Expenditure Process") Glossary Administrative Committee This committee makes recommendations to the Board of Directors and provides general policy oversight that spans the multiple program responsibilities of the organization
Glossary Administrative Committee This committee makes recommendations to the Board of Directors and provides general policy oversight that spans the multiple program responsibilities of the organization
sources for FY , only a portion of the statedistributed revenue would be available for new capital projects.
 6 REVENUE PROJECTIONS, SARASOTA/MANATEE 2040 LRTP The purpose of this analysis is to begin to document the financial resources and revenues available for consideration in developing the Financially Feasible
Wake County. People love to be connected. In our cyberspace. transit plan CONNECTING PEOPLE, CONNECTING THE COUNTY
 Wake County transit plan CONNECTING PEOPLE, CONNECTING THE COUNTY EXECUTIVE SUMMARY People love to be connected. In our cyberspace driven world, people can stay connected pretty much all of the time. Connecting
The Economic Impact of Amtrak s Southwest Chief Rail Service on the Colorado Economy.
 1 The Economic Impact of Amtrak s Southwest Chief Rail Service on the Colorado Economy. Presented to: Greg Severance, Director of Transportation, Urban Transportation Planning Division City of Pueblo,
PLEASANT GROVE, UTAH TRANSPORTATION IMPACT FEE FACILITIES PLAN AND ANALYSIS
 PLEASANT GROVE, UTAH TRANSPORTATION IMPACT FEE FACILITIES PLAN AND OCTOBER 2012 PREPARED BY: LEWIS YOUNG ROBERTSON & BURNINGHAM IMPACT FEE CERTIFICATION Impact Fee Facilities Plan (IFFP) Certification
Economic Growth Initiatives. November 14, 2014
 Economic Growth Initiatives November 14, 2014 Key Concepts Creating Jobs Increased Revenue (type of jobs) Reduced Cost (location) Productive vs. New Revenues A Plan Land Use / Regulations / Finance / Services
8. FINANCIAL ANALYSIS
 8. FINANCIAL ANALYSIS This chapter presents the financial analysis conducted for the Locally Preferred Alternative (LPA) selected by the Metropolitan Transit Authority of Harris County (METRO) for the.
LEGEND Bridges Parks Fire Stations Project Locations Libraries Schools A
 LEGEND Bridges Parks Fire Stations Project Locations Libraries Schools A Aid to Construction Fund The Aid to Construction Fund (Water) are funds received from customers for requested water service and
Costs and Revenues of Residential Development: A Workbook for Local Officials and Citizens
 U N D E R S T A N D I N G E C O N O M I C C H A N G E I N Y O U R C O M M U N I T Y Costs and Revenues of Residential Development: A Workbook for Local Officials and Citizens - + 21 College of Agricultural
HEMSON C o n s u l t i n g L t d
 DEVELOPMENT CHARGES BACKGROUND STUDY Town of Gravenhurst C o n s u l t i n g L t d April, 2014 TABLE OF CONTENTS EXECUTIVE SUMMARY... 1 I INTRODUCTION... 7 II A TOWN-WIDE UNIFORM CHARGE APPROACH TO ALIGN
Travel Forecasting for Corridor Alternatives Analysis
 Travel Forecasting for Corridor Alternatives Analysis Purple Line Functional Master Plan Advisory Group January 22, 2008 1 Purpose of Travel Forecasting Problem Definition Market Analysis Current Future
TOWN OF HINESBURG FIRE PROTECTION IMPACT FEE ANALYSIS. Prepared By. Michael J. Munson, Ph.D., FAICP
 TOWN OF HINESBURG FIRE PROTECTION IMPACT FEE ANALYSIS Prepared By Michael J. Munson, Ph.D., FAICP September 23, 2009 I. INTRODUCTION: The Town of Hinesburg, Vermont, has recently updated its Town Plan
Rates Effective 1/1/2018 Water Residential and Commercial Charges CPI not applicable to base and consumption rates for Rates Effective 1/1/2017
 Water Rates WATER Regular water rates are indexed annually by the treasurer to reflect one hundred percent of any change from the Consumer Price Index for Seattle- Tacoma-Bremerton-All Urban Wage Earners
ENGINEER S REPORT COUNTY SERVICE AREA NO. 10 BENEFIT ZONE NO. 3 COUNTY OF SACRAMENTO THIRD ADMINISTRATIVE DRAFT NOVEMBER 21, 2005.
 ENGINEER S REPORT COUNTY SERVICE AREA NO. 10 BENEFIT ZONE NO. 3 COUNTY OF SACRAMENTO THIRD ADMINISTRATIVE DRAFT NOVEMBER 21, 2005 Oakland Office 1700 Broadway Temecula, CA Phoenix, AZ 6 th Floor Sacramento,
TAUSSIG DEVELOPMENT IMPACT FEE JUSTIFICATION STUDY CITY OF ESCALON. Public Finance Public Private Partnerships Urban Economics Clean Energy Bonds
 DAVID TAUSSIG & ASSOCIATES, INC. DEVELOPMENT IMPACT FEE JUSTIFICATION STUDY CITY OF ESCALON B. C. SEPTEMBER 12, 2016 Public Finance Public Private Partnerships Urban Economics Clean Energy Bonds Prepared
FISCAL IMPACT ANALYSIS FOR THE REDEVELOPMENT PLAN FOR THE CHENEY/HAGERTY/KUSHNER TRACT TOWNSHIP OF CRANBURY MIDDLESEX COUNTY, NEW JERSEY.
 FISCAL IMPACT ANALYSIS FOR THE REDEVELOPMENT PLAN FOR THE CHENEY/HAGERTY/KUSHNER TRACT TOWNSHIP OF CRANBURY MIDDLESEX COUNTY, NEW JERSEY Prepared by: Phillips Preiss Grygiel LLC Planning and Real Estate
Westwood Country Club Redevelopment
 Westwood Country Club Redevelopment Economic and Fiscal Impact March, 2014 Prepared for: Mensch Capital Partners Prepared By: Kent Gardner, Ph.D. Project Director 1 South Washington Street Suite 400 Rochester,
D R A F T M E M O R A N D U M
 D R A F T M E M O R A N D U M To: From: Joe Speaks, CH2M Darin Smith and Matt Loftis Subject: 4th and King RAB Financing Opportunities; EPS #141018 Date: August 18, 2017 Economic & Planning Systems Inc.
Corridors of Commerce DRAFT Scoring and Prioritization Process. Patrick Weidemann Director of Capital Planning and Programming November 1, 2017
 Corridors of Commerce DRAFT Scoring and Prioritization Process Patrick Weidemann Director of Capital Planning and Programming November 1, 2017 Project Purpose To develop and implement a scoring and project
UNDERSTANDING THE FISCAL IMPACTS OF TRANSIT-ORIENTED DEVELOPMENT (TOD) PROJECTS IN NORTHERN VIRGINIA AND MARYLAND
 PROJECTS IN NORTHERN VIRGINIA AND MARYLAND") UNDERSTANDING THE FISCAL IMPACTS OF TRANSIT-ORIENTED DEVELOPMENT (TOD) PROJECTS IN NORTHERN VIRGINIA AND MARYLAND Prepared for The Urban Land Institute Baltimore-Washington, DC Transit-Oriented Development
UNDERSTANDING THE FISCAL IMPACTS OF TRANSIT-ORIENTED DEVELOPMENT (TOD) PROJECTS IN NORTHERN VIRGINIA AND MARYLAND Prepared for The Urban Land Institute Baltimore-Washington, DC Transit-Oriented Development
CHAPTER 9 FINANCIAL CONSIDERATIONS
 CHAPTER 9 FINANCIAL CONSIDERATIONS 9.1 INTRODUCTION This chapter presents anticipated costs, revenues, and funding for the Berryessa Extension Project (BEP) Alternative and the Silicon Valley Rapid Transit
STAFF REPORT Regional Transportation Plan/Sustainable Communities Strategy (RTP/SCS) Scenario Performance Update for Board Direction
 Scenario Performance Update for Board Direction") November 2017 Board of Directors STAFF REPORT SUBJECT: RECOMMENDED ACTION: 2018 Regional Transportation Plan/Sustainable Communities Strategy (RTP/SCS) Scenario Performance Update for Board Direction Support
November 2017 Board of Directors STAFF REPORT SUBJECT: RECOMMENDED ACTION: 2018 Regional Transportation Plan/Sustainable Communities Strategy (RTP/SCS) Scenario Performance Update for Board Direction Support
CAPITAL IMPROVEMENTS ELEMENT
 GOALS, OBJECTIVES AND POLICIES Goal 1.0.0. To annually adopt and utilize a 5-Year Capital Improvements Program and Annual Capital Budget to coordinate the timing and to prioritize the construction and
INVESTING STRATEGICALLY
 11 INVESTING STRATEGICALLY Federal transportation legislation (Fixing America s Surface Transportation Act FAST Act) requires that the 2040 RTP be based on a financial plan that demonstrates how the program
Big Chino Water Ranch Project Impact Analysis Prescott & Prescott Valley, Arizona
 Big Chino Water Ranch Project Impact Analysis Prescott & Prescott Valley, Arizona Prepared for: Central Arizona Partnership August 2008 Prepared by: 7505 East 6 th Avenue, Suite 100 Scottsdale, Arizona
TEX Rail Fort Worth, Texas Project Development (Rating Assigned November 2012)
") TEX Rail Fort Worth, Texas Project Development (Rating Assigned November 2012) Summary Description Proposed Project: Commuter Rail 37.6 Miles, 14 Stations (12 new, two existing) Total Capital Cost ($YOE):
TEX Rail Fort Worth, Texas Project Development (Rating Assigned November 2012) Summary Description Proposed Project: Commuter Rail 37.6 Miles, 14 Stations (12 new, two existing) Total Capital Cost ($YOE):
A New Tool for Tracking Home and Rental Values in TODs
 A New Tool for Tracking Home and Rental Values in TODs John L. Renne, Ph.D., AICP Florida Atlantic University & University of Oxford Founder: TOD Group TOD Group Consulting TOD Index Denver TOD Fund Why
GLOSSARY. At-Grade Crossing: Intersection of two roadways or a highway and a railroad at the same grade.
 Glossary GLOSSARY Advanced Construction (AC): Authorization of Advanced Construction (AC) is a procedure that allows the State to designate a project as eligible for future federal funds while proceeding
The Economic Impact of Northern Virginia Transportation Authority Capital Investment
 The Economic Impact of Northern Virginia Transportation Authority Capital Investment Prepared for Northern Virginia Transportation Authority November 26, 2018 1309 E Cary Street, Richmond, VA 23219 1025
APPENDIX E: ATM MODEL TECH MEMORANDUM. Metropolitan Council Parsons Brinckerhoff
 APPENDIX E: ATM MODEL TECH MEMORANDUM Metropolitan Council Parsons Brinckerhoff Metropolitan Highway System Investment Study Evaluation of Active Traffic Management Strategies Prepared by: Parsons Brinckerhoff
River Edge Fiscal Impact Analysis
 Final Report Prepared for: Carbondale Investments Prepared by: Economic & Planning Systems, Inc. EPS #20813 App. N-2 Table of Contents 1. INTRODUCTION AND SUMMARY OF FINDINGS... 1 Summary of Findings...
Midtown Row. Fiscal Impact Study. BSV Colonial Owner, LLC. Ted Figura Consulting. City of Williamsburg, Virginia. Prepared by. For. Bethesda, Maryland
 Midtown Row Fiscal Impact Study City of Williamsburg, Virginia Prepared by Ted Figura Consulting For BSV Colonial Owner, LLC Bethesda, Maryland August 1 2017 Table of Contents Executive Summary. 4 Background......
1. identifies the required capacity of capital improvements to serve existing and future development based on level-of-service (LOS) standards;
 standards;") DIVISION 4.200 CAPITAL IMPROVEMENTS ELEMENT SECTION 4.201 INTRODUCTION The purpose of the Capital Improvements Element (CIE) is to tie the capital improvement needs identified in the other elements to
DIVISION 4.200 CAPITAL IMPROVEMENTS ELEMENT SECTION 4.201 INTRODUCTION The purpose of the Capital Improvements Element (CIE) is to tie the capital improvement needs identified in the other elements to
Financial Forecasting Assumptions for Plan 2040 (DRAFT)
") Financial Forecasting Assumptions for Plan 2040 (DRAFT) Inflation and Long Range Cost Escalation For the FY 2012 2017 TIP period, ARC will use the GDOT recommended 4 percent inflation rate. This conservative
Financial Forecasting Assumptions for Plan 2040 (DRAFT) Inflation and Long Range Cost Escalation For the FY 2012 2017 TIP period, ARC will use the GDOT recommended 4 percent inflation rate. This conservative
May 31, 2016 Financial Report
 2016 May 31, 2016 Financial Report Capital Metropolitan Transportation Authority 7/13/2016 Table of Contents SUMMARY REPORTS Budgetary Performance - Revenue 2 - Sales Tax Revenue 6 - Operating Expenses
Policy CIE The following are the minimum acceptable LOS standards to be utilized in planning for capital improvement needs:
 Vision Statement: Provide high quality public facilities that meet and exceed the minimum level of service standards. Goals, Objectives and Policies: Goal CIE-1. The City shall provide for facilities and
Resolution Establishing Special Event Permit Requirements For Larimer County Roads
 Resolution Establishing Special Event Permit Requirements For Larimer County Roads SECTION I - Authority Authority for the administration and enforcement of the Special Event Permit for Larimer County
CHAPTER 2: SOCIO-ECONOMIC PROFILE
 2040 Regional Transit Element CHAPTER 2: SOCIO-ECONOMIC PROFILE STUDY AREA The study area for this 2040 RTE is the NFRMPO region, also designated by the Colorado Department of Transportation (CDOT) as
TUMF TRANSPORTATION UNIFORM MITIGATION FEE NEXUS REPORT
 TRANSPORTATION UNIFORM MITIGATION FEE NEXUS REPORT TUMF Prepared by: Economic & Planning Systems, Inc. One Kaiser Plaza, Suite 1410, Oakland, CA 94612 510.841.9190 www.epsys.com Nexus Report Transportation
2012 TIGER Grant Application Benefit Cost Analysis Technical Memo March 19, 2012
 Improved US 70 with Railroad Grade Separation (Highway Overpass) Valliant, Oklahoma 2012 TIGER Grant Application Benefit Cost Analysis Technical Memo March 19, 2012 Project Summary The Improved US 70 with
4.3 Economic and Fiscal Impacts
 4.3 This section evaluates the potential economic, and fiscal impacts that could arise from the construction and long-term operation of the proposed East San Fernando Valley Transit Corridor Project. 4.3.1
The Economic and Fiscal Impacts of Development near DART Stations
 1 The Economic and Fiscal s of Development near DART Stations 2014 2015 Prepared for Dallas Area Rapid Transit Prepared by Michael C. Carroll, Ph.D. Christopher Carlyle Michael Seman, Ph.D. Executive Summary
YEAR 2035 LONG RANGE TRANSPORTATION PLAN FINAL TECHNICAL REPORT NO. 2: DATA COLLECTION, MAPPING AND DATA DEVELOPMENT
 YEAR 2035 LONG RANGE TRANSPORTATION PLAN FINAL TECHNICAL REPORT NO. 2: DATA COLLECTION, MAPPING AND DATA DEVELOPMENT Prepared for: METROPOLITAN TRANSPORTATION PLANNING ORGANIZATION FOR THE GAINESVILLE
GENERAL INFORMATION ABOUT THE CONTENTS OF THIS FILE
 GENERAL INFORMATION ABOUT THE CONTENTS OF THIS FILE Submissions by the public in compliance with the Commission Rules and Operating Procedures (ROPs), Rule 4.3, are distributed to the Commission and uploaded
The Potential for Shared Use Mobility in Affordable Housing Complexes in Rural California
 The Potential for Shared Use Mobility in Affordable Housing Complexes in Rural California A Research Report from the University of California Institute of Transportation Studies Susan Pike, Ph.D., Post-Doctoral
DRCOG is local officials working together to address the region's challenges for today and tomorrow. Metro Vision 2040
 DRCOG is local officials working together to address the region's challenges for today and tomorrow A plan to make life better for people of all ages, incomes and abilities Equitable sharing of costs and
ALL Counties. ALL Districts
 TEXAS TRANSPORTATION COMMISSION ALL Counties rhnute ORDER Page of ALL Districts The Texas Transportation Commission (commission) finds it necessary to propose amendments to. and., relating to Transportation
University Link LRT Extension
 (November 2007) The Central Puget Sound Regional Transit Authority, commonly known as Sound Transit, is proposing to implement an extension of the Central Link light rail transit (LRT) Initial Segment
Environmental Analysis, Chapter 4 Consequences, and Mitigation
 Environmental Analysis, Chapter 4 4.14 Economic and Fiscal Impacts This section evaluates potential impacts to local and regional economies during construction and operation of each project alternative.
Analysis of the Alameda County Transportation Expenditure Plan Prepared by Alameda County Transportation Commission
 Analysis of the Alameda County Transportation Expenditure Plan Prepared by Alameda County Transportation Commission Discussion: In 1986, voters approved Measure B, a 1/2 cent sales tax, to fund transportation
Route Route Z Intersection Realignment
 Route N @ Route Z Intersection Realignment Sponsor County Highway Project No. RB18-000016 Project Type Traffic Flow TOTAL FUNDING Total County Sponsor Federal $3,310,000 $1,776,000 $0 $1,534,000 Project
CITY OF LANCASTER FISCAL BUDGET REVENUE SOURCES
 CITY OF LANCASTER FISCAL 2006-07 BUDGET REVENUE SOURCES TAXES The tax raising authority of cities has been severely limited for the past 25 years. Proposition 13 enacted in 1978 amended the California
Arizona Low Income Housing Tax Credit and Housing Trust Fund Economic and Fiscal Impact Report
 Arizona Low Income Housing Tax Credit and Housing Trust Fund Economic and Fiscal Impact Report Prepared for: Arizona Department of Housing January 2014 Prepared by: Elliott D. Pollack & Company 7505 East
Target Formula Re-evaluation
 Target Formula Re-evaluation Target Formula Background Target formula is used to distribute federal funding to the eight ATPs Current formula was developed in 1996 Reauthorization of federal transportation
Planning Board Roundtable 12/3/15
 Planning Board Roundtable 12/3/15 1 Study overview Four specific topics: 1. Function and relationship of transportation funding mechanisms (LATR, TPAR, transportation impact taxes) 2. Pro-rata share concept
Transportation Sustainability Program
 TSP Transportation Sustainability Program MARKET & OCTAVIA CAC JANUARY 2012 GOALS & OBJECTIVES Better align City practices with citywide policy goals Harmonize California Environmental Quality Act (CEQA)
Draft Environmental Impact Statement. Appendix G Economic Analysis Report
 Draft Environmental Impact Statement Appendix G Economic Analysis Report Appendix G Economic Analysis Report Economic Analyses in Support of Environmental Impact Statement Carolina Crossroads I-20/26/126
1.0 FISCAL BENEFITS OF PROPOSED GENERAL PLAN
 11661 San Vicente Boulevard, Suite 306 Los Angeles, CA 90049 (310) 820-2680, (310) 820-8341 fax www.stanleyrhoffman.com Memorandum DATE: TO: Laura Stetson, EDAW FROM: Stan Hoffman, SUBJECT: Claremont General
(REVISED) NOTICE OF PUBLIC MEETING
 NOTICE OF PUBLIC MEETING") (REVISED) NOTICE OF PUBLIC MEETING Notice is hereby given that a public meeting on an Amendment to the Schedule of Taxes, Fees and Charges for fiscal year 2017 will be held by the Finance Committee of
(REVISED) NOTICE OF PUBLIC MEETING Notice is hereby given that a public meeting on an Amendment to the Schedule of Taxes, Fees and Charges for fiscal year 2017 will be held by the Finance Committee of
Transportation Funding
 Transportation Funding TABLE OF CONTENTS Introduction... 3 Background... 3 Current Transportation Funding... 4 Funding Sources... 4 Expenditures... 5 Case Studies... 6 Washington, D.C... 6 Chicago... 8
NATIONAL LAND TRANSPORT PROGRAMME / INformation sheet / october 2012
 NATIONAL LAND TRANSPORT PROGRAMME 2012 15 / INformation sheet / october 2012 Creating transport solutions for a thriving New Zealand The NZ Transport Agency Board has adopted the 2012 15 National Land
Commercial Tax Objectives and Options. January 2018 Bruce Fisher and Andre MacNeil (Finance)
") Commercial Tax Objectives and Options January 2018 Bruce Fisher and Andre MacNeil (Finance) Outline Introduction What is and is not allowed under property tax law Four critical success factors: Hypothetical
Commercial Tax Objectives and Options January 2018 Bruce Fisher and Andre MacNeil (Finance) Outline Introduction What is and is not allowed under property tax law Four critical success factors: Hypothetical
HEMSON GROWTH FORECAST
 GROWTH FORECASTS 17 III GROWTH FORECAST This section provides the basis for the growth forecasts used in calculating the development charges and provides a summary of the forecast results. The growth forecast
Okaloosa-Walton 2035 Long Range Transportation Plan Amendment
 Okaloosa-Walton 2035 Long Range Transportation Plan Amendment Adopted August 22, 2013 This report was financed in part by the U.S. Department of Transportation, Federal Highway Administration, the Florida
Dr. Laurie Heinz, Superintendent Park Ridge Niles School District 64. Scott Goldstein, AICP & LEED AP, Principal Pete Iosue, AICP, Senior Planner
 TO: FROM: Dr. Laurie Heinz, Superintendent Park Ridge Niles School District 64 Scott Goldstein, AICP & LEED AP, Principal Pete Iosue, AICP, Senior Planner DATE: September 5, 2017 RE: 1440 W. Higgins Road
FISCAL IMPACT ANALYSIS Local Policy Primer
 FISCAL IMPACT ANALYSIS Local Policy Primer Resources are at a premium for local governments, and this is particularly true for many small towns and rural communities where tax base has shrunk, infrastructure
Development of the Cost Feasible Plan
 March 15, 2012 TPO Board and Advisory Committee Meetings Development of the Cost Feasible Plan Transportation Outlook 2035 LRTP Update Atkins Development of the Cost Feasible Plan P a g e 1 Development
Technical Report No. 4. Revenue and Costs
 Technical Report No. 4 Revenue and Costs Technical Report No. 4 REVENUE AND COSTS PASCO COUNTY METROPOLITAN PLANNING ORGANIZATION 8731 Citizens Drive New Port Richey, FL 34654 Ph (727) 847-8140, fax (727)